Embed Size (px)
Citation preview

Oral health quality indicators
HCQI Health promotion, prevention and primary care Sub Group
9th May 2012
Anne Nordblad
Ministry of Social Affairs and Health
Department of Social and Health Services
Finland
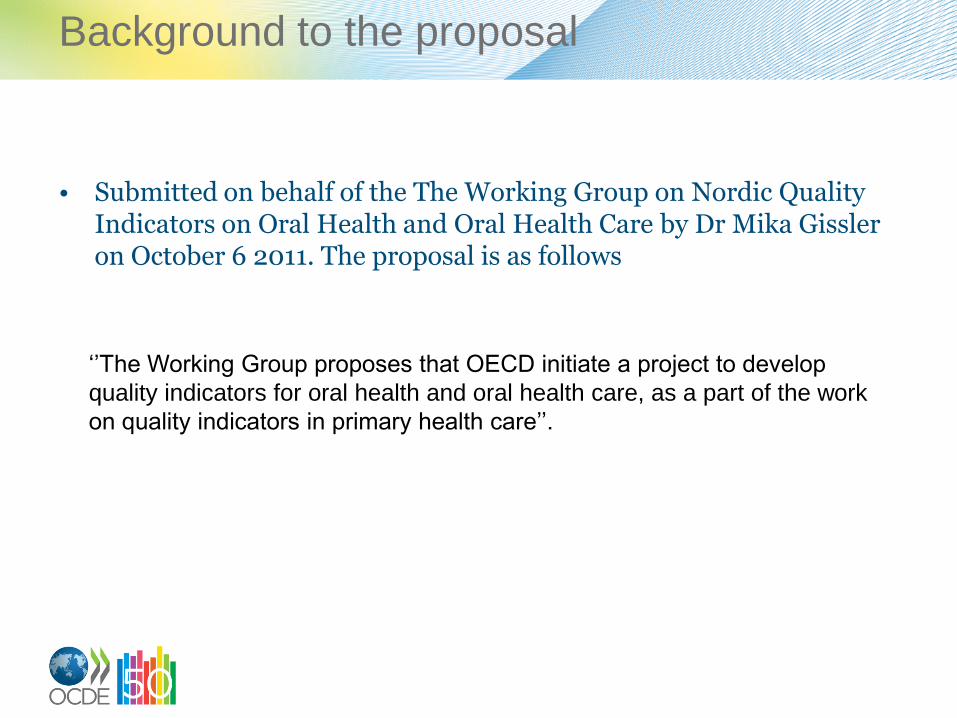
Background to the proposal
• Submitted on behalf of the The Working Group on Nordic Quality Indicators on Oral Health and Oral Health Care by Dr Mika Gissler on October 6 2011. The proposal is as follows
‘’The Working Group proposes that OECD initiate a project to develop
quality indicators for oral health and oral health care, as a part of the work
on quality indicators in primary health care’’.

The proposal builds on:
• The report: A Nordic project of quality indicators for oral health care 2010 (The Working Group on Nordic Quality Indicators on Oral Health and Oral Health Care) http://www.thl.fi/thl-client/pdfs/a389b3ed-a262-44c5-bad0-b9d3eecdf089
• EU-funded European Global Oral Health Indicators Development Project (EGOHID) project (2002-2008) (40 indicators) www.egohid.eu and
• The framework developed by the OECD Health Care Quality Indicators project.
Background to the proposal

Relevance: health, well being,the economy
• Poor oral health can affect a persons’ ability to eat properly and a poor diet can cause rapid deterioration in physical and psycho-social health
• Some evidence to suggest that poor oral health is a risk factor for cardiovascular disease and other life threatening conditions
• Between 60-90% of school children worldwide have dental cavities and between 5-20% of middle-aged adults have severe gum disease(WHO)
• Poor oral health can be particularly damaging to the elderly
• The economic costs of curative dental care are high, representing between 5 to 10% of total public health expenditure (WHO)

Relevance: inequality
0 5 10 15 20 25
% people by income quintile who felt they needed dental health care treatment but did not receive it
High Middle Low
Income Income Income
People in lowest income quintile
consistently more likely to
express higher levels of unmet
need
Portugal
Spain
Iceland
Sweden
Italy
Poland
Norway
France
Greece
Switzerland
Finland
Hungary
Estonia
Denmark
United Kingdom
Czech Republic
Germany
Austria
Slovak Republic
Ireland
Luxembourg
Netherlands
Belgium
Slovenia
Source: EU-SILC.

Relevance: access
Large variations in annual
consultation rates
0.1
0.3
0.6
0.7
0.7
0.8
0.8
0.9
0.9
1.0
1.2
1.2
1.3
1.3
1.4
1.4
1.4
1.5
1.6
1.6
1.7
1.8
2.1
2.1
2.3
3.2
0 0.5 1 1.5 2 2.5 3 3.5
Mexico
Turkey
Luxembourg
Chile
United Kingdom
Hungary
Poland
Denmark
Italy
United States
Austria
Switzerland
Finland
OECD
Australia
Estonia
Germany
Slovak Republic
Korea
Spain
France
Czech Republic
Belgium
Netherlands
Israel
Japan
Annual consultations per capita
Information on data for Israel: http://dx.doi.org/10.1787/888932315602
Source: OECD Health Data 2011.

Conceptual framework for indicator groupings:
1. Structure indicators
2. Process indicators
3. Outcome indicators
4. Potential quality indicators; (to be developed)
Defining and classifying clinical indicators for quality improvement.
Mainz Jan. International Journal for Quality in Health Care 2003; 15(6): 523-530.

Nordic Working Group indicators
STRUCTURE INDICATORS
INDICATOR GROUP / INDICATOR IMPORTANCE/RELEVANCE
1. Number of inhabitants per legitimate (licensed)
oral health care personnel under retirement age
The structure of health care systems is a key element in the
attainment of health goals, health care responsiveness and
equity.
NOTE
(variants of these indicators are collected via OECD Health
Data)
2. Number of inhabitants per active (licensed) oral
health care personnel under retirement age NOTE
(variants of this indicator are collected via OECD Health Data)
3. Number of licensed dentists under retirement
age per legitimate oral health care personnel
4. Oral health service expenditure per capita
This indicator can be used in comparative analysis of health
systems and can be used in conjunction with quality
measures to assess whether or not differences in
expenditure are systematically associated with changes in
quality.

Number of inhabitants/ licensed dentists
under retirement age

Nordic Working Group indicators PROCESS INDICATORS
INDICATOR GROUP / INDICATOR IMPORTANCE/RELEVANCE
5. Proportion of the population* who
used oral health services within a
year
*divided according to:
- The proportion of population under 18/19/20
years old
- The proportion of adults aged 18/19/20
years-old
NOTE
(variant of this indicator is collected via OECD Health
Data)
Describes the visiting pattern of oral health care
services – while is little evidence to support or
refute any particular frequency of dental check
visits, most public health authorities recommend at
least one annual visit to a dentist.
6. Oral health behaviour in school-
aged children:
a) Frequency of daily tooth brushing
b) Rate of consumption of non-diet soft
drinks
The two main dental diseases – caries and
periodontal disease can be effectively prevented
by good oral hygiene and by restricting the
frequency and amount of sugar consumption.
Consumption of soft drinks and other sugary food
stuffs has been associated with elevated risk of
poor oral health in adolescence, particularly caries
and dental erosion

Nordic Working Group indicators
OUTCOME INDICATORS
INDICATOR GROUP / INDICATOR IMPORTANCE/RELEVANCE
7. Proportion of caries free (no dentine
caries) in children and adolescents
Information about caries free children and adolescents is a good basis for
planning and for comparing the development of oral health status. This
indicator is commonly used to assess overall levels of oral health and to
monitor trends in oral health over time.
8. Dental caries severity (mean DMFT) in
children and adolescents (DMFT = Disease, missing, filled teeth)
NOTE
(variant of this indicators is collected via OECD Health Data)
Decay experience at early and / or later stages of severity assessed by
variations of the severity of caries index is accepted globally as a
standardised measure of one of the most common oral diseases.
9. Significant caries index (children aged 12
– based on WHO goal)
(mean DMFT of the one third of a population with the highest
caries values)
The distribution of caries prevalence as measured by the mean DMFT
indicator is typically skewed with a proportion of children having high or
very high DMFT values. Mean DMFT values do not accurately reflect this
and can result in misleading assessments indicating for example, that the
caries profile overall for a population is controlled.
The SiC indicator draws attention to the scale of severe dental caries in a
proportion of the population that has the worst dental caries index overall.
9. Edentulous (without teeth) prevalence in
adults aged 65-74
Loss of all natural teeth can contribute to psychological, social and
physical impairment. Edentulous prevalence is a measure of past disease
and an indicator of overall oral health.
10. Functional occlusion prevalence in adults
aged 65-74
People with impaired dentitions due to missing teeth often choose foods
that do not provide optimal nutrition – in the elderly, poor oral health can
lead to significant weight loss and a loss in well being more broadly.
Early tooth loss has also been shown to be a predictor of eventual
edentulism.

Proportion of caries free 12 year olds, %

Health status: 1.Caries free children and adolescents 2. Dental caries severity (mean DMFT) in children and adolescents 3. Significant Caries Index (SiC Index) 4. Edentulous prevalence in adults aged 65-74 years 5. Functional occlusion prevalence in adults aged 65-74 years
Non-medical determinants of health 1.Soft drinks consumption 2.Tooth brushing more than once a day
Health care system performance: Quality, access, cost/expenditure 1.The total cost per capita on oral health care 2.The proportion of population who used oral health services within the past year
Health care resources and activities 1. Number of inhabitants per legitimate oral health care personnel under
retirement age
2. Number of inhabitants per working oral health care personnel
3. Number of oral health care personnel per dentists under retirement age
Adapted from Conceptual framework for the OECD Health Care Quality Indicators Project

Potential indicators according to the Nordic
project
• Dental Contact within the past two years
• Self assessed oral health status
• Oral disadvantage due to functional limitations

Nordic project: Conclusions and recommendations
Quality indicators for monitoring
– access to care,
– periodontal diseases and their effective treatment,
– coverage of orthodontic treatment,
– success of root treatments
– the prevalence of erosion
were considered important by the working group and these fields need to be developed

The Subgroup is invited to:
–COMMENT on the feasibility of developing oral health and oral health care indicators (Given the balance of ongoing and new HCQI work is oral health care quality a priority area? Is the current information infrastructure conducive to their development? What data quality problems are envisaged?)