Embed Size (px)
Citation preview

Copyright 2014 Velocity Software, Inc. All Rights Reserved. Other products and company names mentioned herein may be trademarks of their respective
Oracle Performance Management (with zVPS)
Session 16166
Barton Robinson Velocity Software, Inc [email protected] www.VelocitySoftware.com www.LinuxVM.com

October, 2013, ski tournament People see things different

• Velocity Software • What is Performance Management • zVPS – Velocity Performance Suite • Managing Performance for:
• z/VM, • Linux, • Oracle
Topics
3
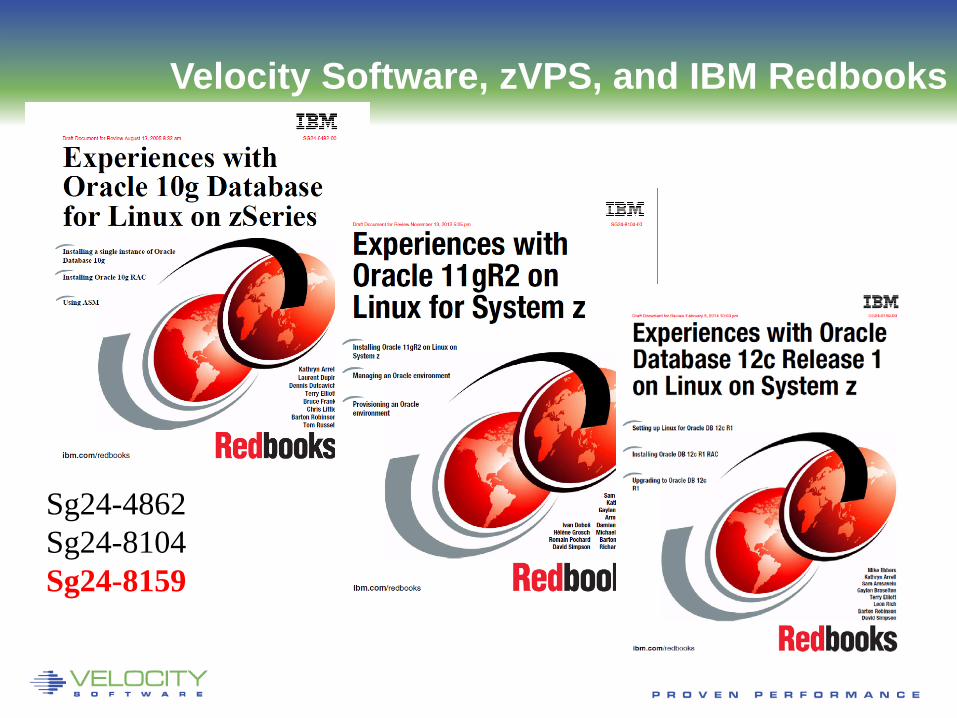
Velocity Software, zVPS, and IBM Redbooks
Sg24-4862 Sg24-8104 Sg24-8159
“large financial” • 500 IFLs, • 4,000 Linux servers under z/VM • 4,400 Oracle databases running on Linux on z/VM
Government • 98 IFLs, • consolidated MANY LARGE Oracle databases
Insurance • 3 CECs, 71 IFLs • SAP, Oracle
100’s of installations support Oracle on z/Linux
Linux Installation Profiles
5
Computers are important part of any organization • Increased competitiveness, lowers operating costs
Running at high utilization reduces cost of ownership • 90% utilization less than ½ cost of 45% utilization
Bad performance results in Lost Customers • Slow websites drive customers to competitors • Non-responsive costs companies money (and jobs)
Batch Windows • Backups take so long can’t start production • (So don’t back up?)
Why Performance Management?
6
Performance Analysis • Real time analysis • Service Level Support
Capacity Planning • Long Term service level support • By application, node, system, server, etc
Operations Support • Alerts to detect service issues
Charge back Support • Run your IT as a business (Profit Center) • Required for cloud
FORMAL Performance Management
7

Performance Analysis - reactionary • Diagnosing yesterday’s problem with todays data? • Turn on performance monitor ONLY if a problem
• (Overhead is too high to run all the time) • PROBLEM: Too many MIPS/IFLs required
Capacity Planning - reactionary • Buy hardware when performance is bad • Problem: Business impact when performance bad?
Operations Support • Alerts by telephone calls from users (or executives?)
Charge back Support • Costs not managed
Performance management is NOT “TOP”, “ps”, etc
What is NOT Performance Management
8
Oracle application layer • Has performance settings, • Has LRU Algorithms
Oracle Application runs under Linux layer • Dispatching • Storage requirements, LRU algorithm
Linux servers run under z/VM layer • Dispatching, • Storage requirements, LRU algorithm • Subsystems: CPU, RAM, Paging, DASD, Network
z/VM runs in an LPAR – Sharing IFLs
Oracle Performance Management
9
10
Why Performance Analysis
Why Performance Analysis: Service Level Mgmt • Diagnose real time service issues • Manage “large” Shared resource environment • Any application may impact other applications
Infrastructure Requirements • Analyze all z/VM Subsystems in detail, real time
• (DASD, Cache, Storage, Paging, Processor, TCPIP) • Analyze Linux
• (applications, processes, processor, storage, swap) • Historical view of same data important (What changed?)
• Why are things worse today than yesterday? • Did adding new workload affect overall throughput?
11
Why Capacity Planning
Capacity Planning: Future Service Levels • How many servers can you support with existing EC12? • What is capacity requirements for an application? • Avoid crises in advance • Consolidation Planning – Projecting requirements of the
next 100 or 1000 servers Infrastructure Requirements
• Performance database (long term) • z/VM AND Linux data (and Oracle) • Resource requirements by Server, Application, User • z/VM, z/Linux data must be usable by existing planners • Interface to MICS, MXG, TUAM, TDS
12
Accounting and Chargeback
Why Chargeback? (run IT competitively) • Distributed chargeback model is by server • Shared chargeback model is by resource utilized • Installations with chargeback models adopt Linux easily • Encourages efficient/effective resource use • Align IT to your business model • Integral part of Cloud architecture
Infrastructure Requirements • Identify Resource by server, by Linux Application • High capture ratio • Every site does it differently, so flexible data is key
Copyright 2008 Velocity Software, Inc. All Rights Reserved.
13
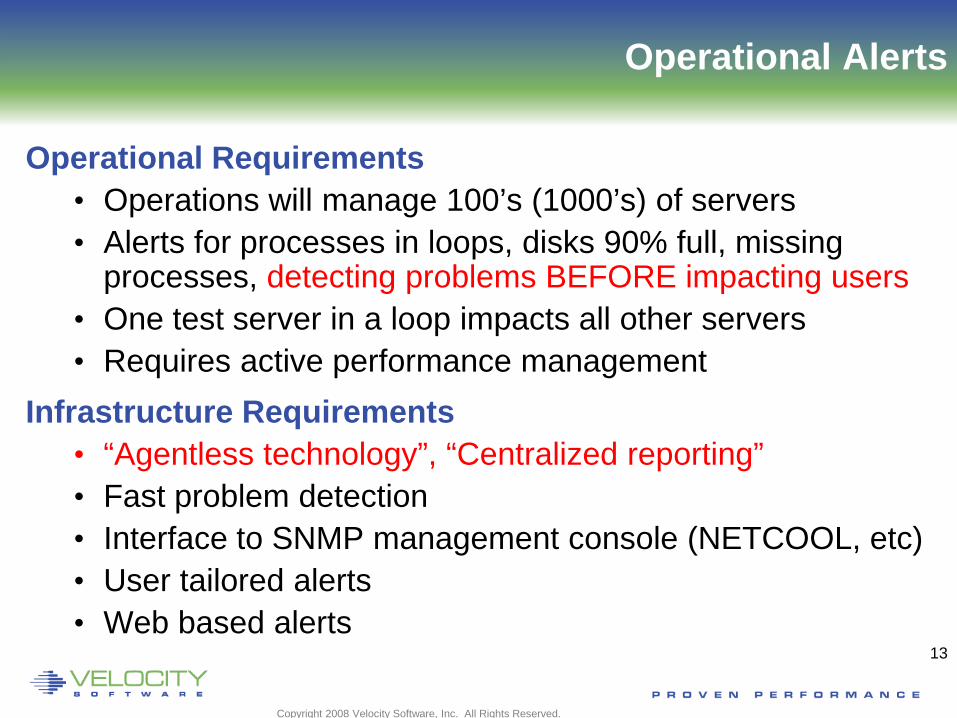
Operational Alerts
Operational Requirements • Operations will manage 100’s (1000’s) of servers • Alerts for processes in loops, disks 90% full, missing
processes, detecting problems BEFORE impacting users • One test server in a loop impacts all other servers • Requires active performance management
Infrastructure Requirements • “Agentless technology”, “Centralized reporting” • Fast problem detection • Interface to SNMP management console (NETCOOL, etc) • User tailored alerts • Web based alerts
14
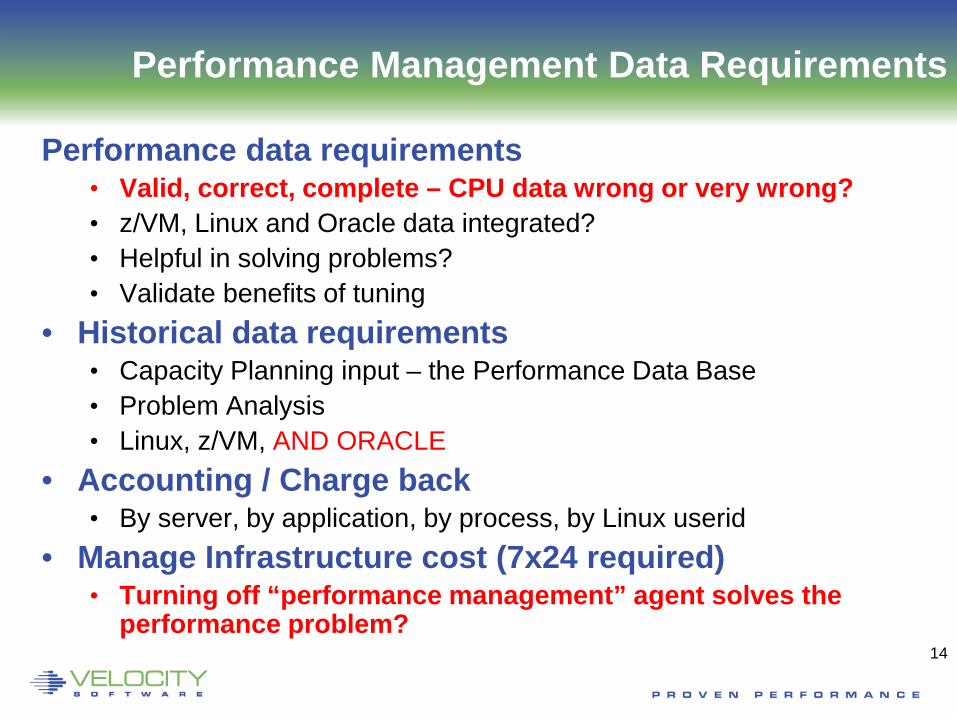
Performance Management Data Requirements
Performance data requirements • Valid, correct, complete – CPU data wrong or very wrong? • z/VM, Linux and Oracle data integrated? • Helpful in solving problems? • Validate benefits of tuning
• Historical data requirements • Capacity Planning input – the Performance Data Base • Problem Analysis • Linux, z/VM, AND ORACLE
• Accounting / Charge back • By server, by application, by process, by Linux userid
• Manage Infrastructure cost (7x24 required) • Turning off “performance management” agent solves the
performance problem?
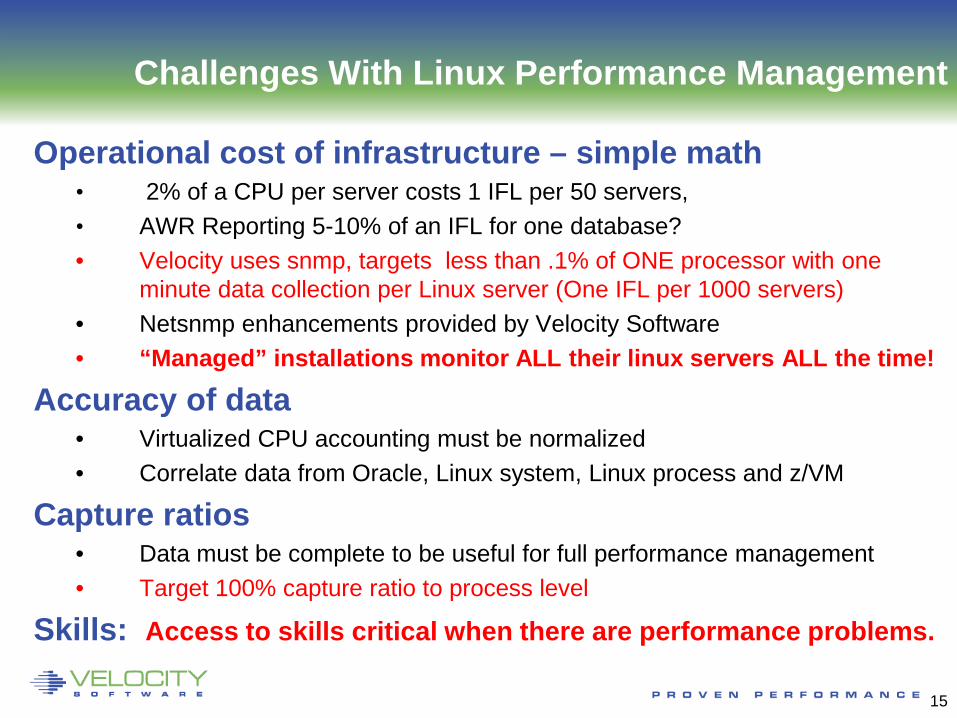
Challenges With Linux Performance Management
Operational cost of infrastructure – simple math • 2% of a CPU per server costs 1 IFL per 50 servers, • AWR Reporting 5-10% of an IFL for one database? • Velocity uses snmp, targets less than .1% of ONE processor with one
minute data collection per Linux server (One IFL per 1000 servers) • Netsnmp enhancements provided by Velocity Software • “Managed” installations monitor ALL their linux servers ALL the time!
Accuracy of data • Virtualized CPU accounting must be normalized • Correlate data from Oracle, Linux system, Linux process and z/VM
Capture ratios • Data must be complete to be useful for full performance management • Target 100% capture ratio to process level
Skills: Access to skills critical when there are performance problems.
15
Building an Oracle Performance Mgmt Architecture
Integrated platform data • LPAR (virtualization) • z/VM (virtualization) • Linux • Oracle
Data acquisition • Low cost of acquisition (or just won’t be utilized) • Historical data maintained (performance data base)
16
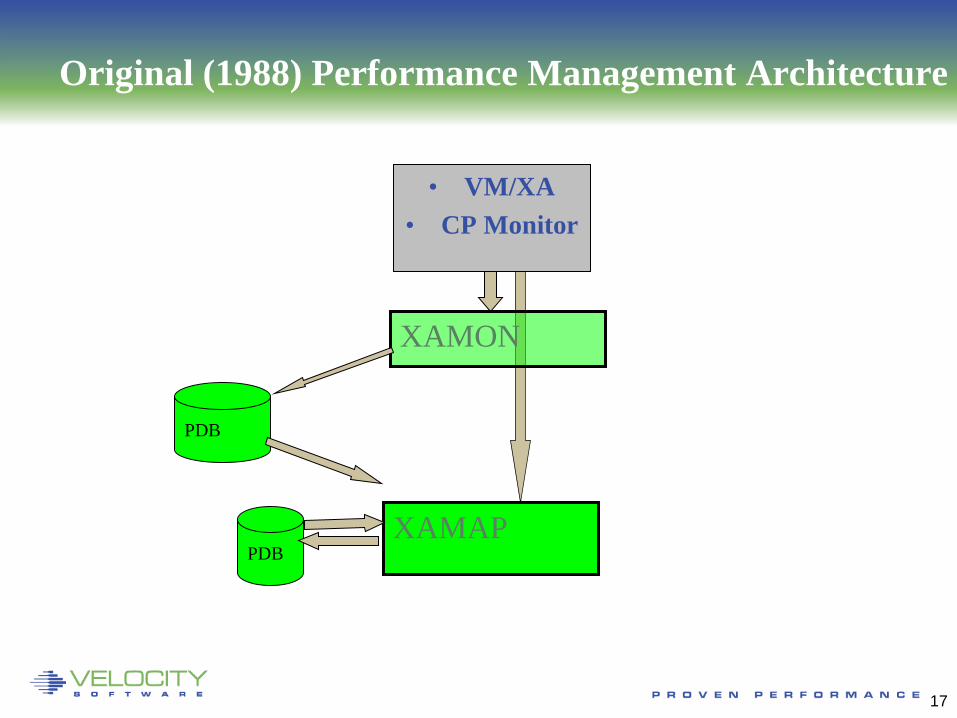
Original (1988) Performance Management Architecture
• VM/XA • CP Monitor
XAMON
PDB
XAMAP
17
PDB
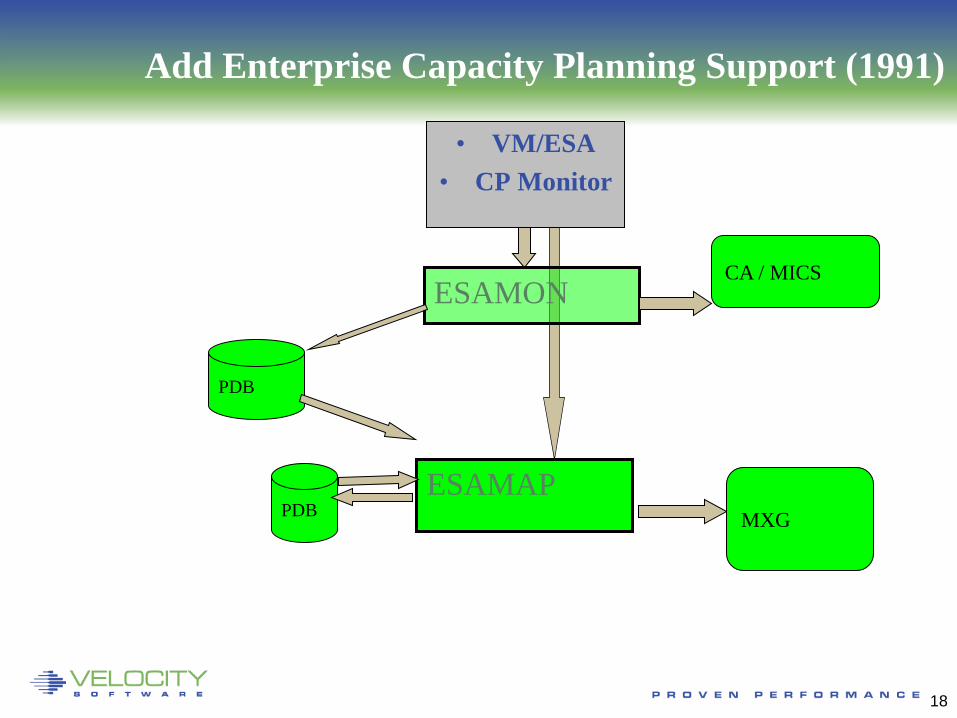
• VM/ESA • CP Monitor
ESAMON
PDB
ESAMAP
CA / MICS
MXG
18
PDB
Add Enterprise Capacity Planning Support (1991)
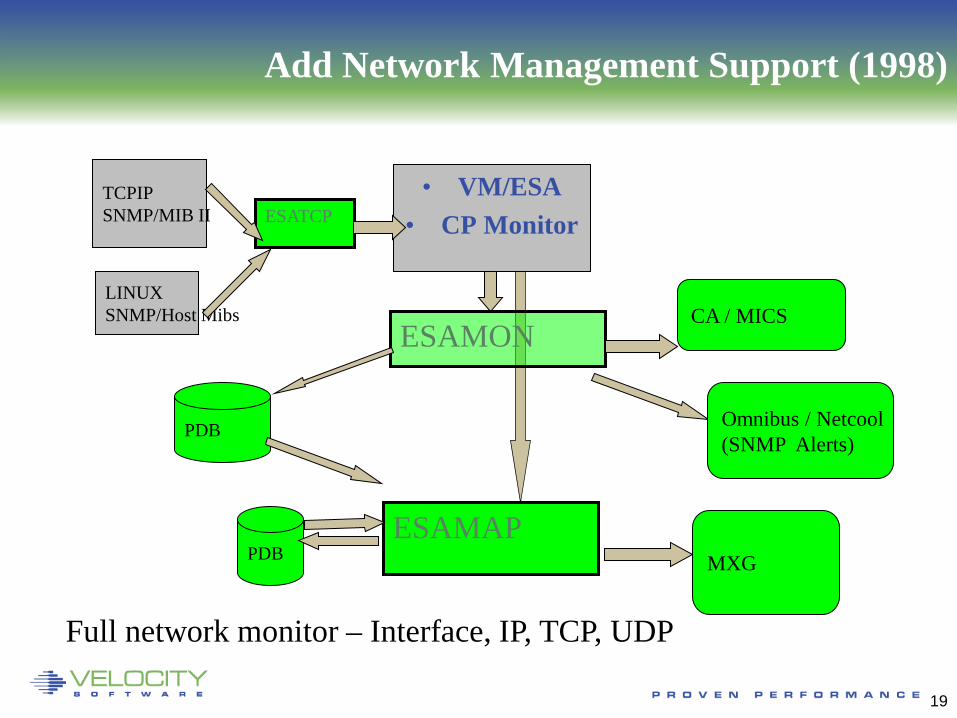
Add Network Management Support (1998)
• VM/ESA • CP Monitor
ESAMON
PDB
ESAMAP
CA / MICS
Omnibus / Netcool (SNMP Alerts)
MXG
TCPIP SNMP/MIB II
LINUX SNMP/Host Mibs
ESATCP
19
PDB
Full network monitor – Interface, IP, TCP, UDP

Added Linux and Network Data Acquisition (2001)
zTCP: Network Monitor SNMP Data collection Data added to PDB Availability Checking
z/VM CP Monitor
zMON
Reports
PDB
zMAP
Real-Time Displays
PDB
TCPIP SNMP/MIB II
LINUX SNMP/Host Mibs
zTCP snmp
Collects data from: LINUX (netsnmp) NT/SUN/HP (native snmp) Printers/Routers…. THOUSANDS OF SERVERS?
WinNT SUN/HP/AIX Blade/Linux (VSE!!! - 2010) (VMWare)
20

Process Capture Ratio
• High cpu capture ratio Report: ESALNXV LINUX Virtual Processor Analysis Report ----------------------------------------------------------------- Node/ VM <Linux Pct CPU> <Process Data> Capture Prorate Name ServerID Total Syst User Total Syst User Ratio Factor --------- -------- ----- ---- ---- ----- ---- ---- ------- ------ 10:03:00
NEALE1 LNEALE1 100.0 11.4 88.6 100.2 11.5 88.7 1.002 1.000
NO “top” or “ps” command required, EVER Report: ESALNXP LINUX HOST Process Statistics Report --------------------------------------------------------- node/ <-Process Ident-> Nice <------CPU Percents----> Name ID PPID GRP Valu Tot sys user syst usrt --------- ----- ----- ----- ---- ---- ---- ---- ---- ---- 10:03:00 NEALE1 0 0 0 0 100 0.43 3.35 11.0 85.4 kswapd0 100 1 1 0 0.12 0.12 0 0 0 snmpd 1013 1 1012 -10 0.13 0.03 0.10 0 0 sh 3653 3652 30124 0 52.7 0 0 9.37 43.3 gmake 9751 9750 30124 0 43.4 0.02 0.02 1.37 42.0 sh 10129 9751 30124 0 0.02 0.02 0 0 0 sh 10130 10129 30124 0 0.63 0.03 0.23 0.28 0.08 cc1 10307 10306 30124 0 3.12 0.18 2.93 0 0 rpmbuild 30124 16382 30124 0 0.07 0.03 0.03 0 0 sh 30125 30124 30124 0 0.02 0 0.02 0 0 gmake 30126 30125 30124 0 0.02 0 0.02 0 0
Report: ESALNXC LINUX Process Conf --------------------------------------- Node/ <-Process Ident-> <-----Pr Name ID PPID GRP Path ------------ ----- ----- ----- -------- NEALE1 init 1 0 0 init [3] migratio 2 1 0 migratio ksoftirq 3 1 0 ksoftirq events/0 4 1 0 events/0 khelper 5 4 0 khelper kblockd/ 6 4 0 kblockd/ cio 41 4 0 cio cio_noti 42 4 0 cio_noti kslowcrw 43 4 0 kslowcrw appldata 96 4 0 appldata aio/0 101 4 0 aio/0 pdflush 5266 4 0 pdflush pdflush 26647 4 0 pdflush kswapd0 100 1 1 kswapd0 kmcheck 158 1 1 kmcheck syslogd 976 1 976 /sbin/sy klogd 979 1 979 /sbin/kl snmpd 1013 1 1012 snmpd portmap 1030 1 1030 /sbin/po rpciod 1034 1 1 rpciod lockd 1035 1 1 lockd sshd 1072 1 1072 /usr/sbi sshd 16272 1072 16272 sshd: bu sshd 16288 1072 16288 sshd: bu sshd 16290 16288 16288 sshd: bu bash 16291 16290 16291 bash python 16312 16291 16291 python do-bui 16313 16312 16291 /bin/sh bb_do 16382 16313 16291 /usr/bin rpmb 16415 16382 16415 rpmbuild rpmb 30124 16382 30124 rpmbuild
21
Copyright 2012 Velocity Software, Inc. All Rights Reserved. Other products and company names mentioned herein may be trademarks of their respective
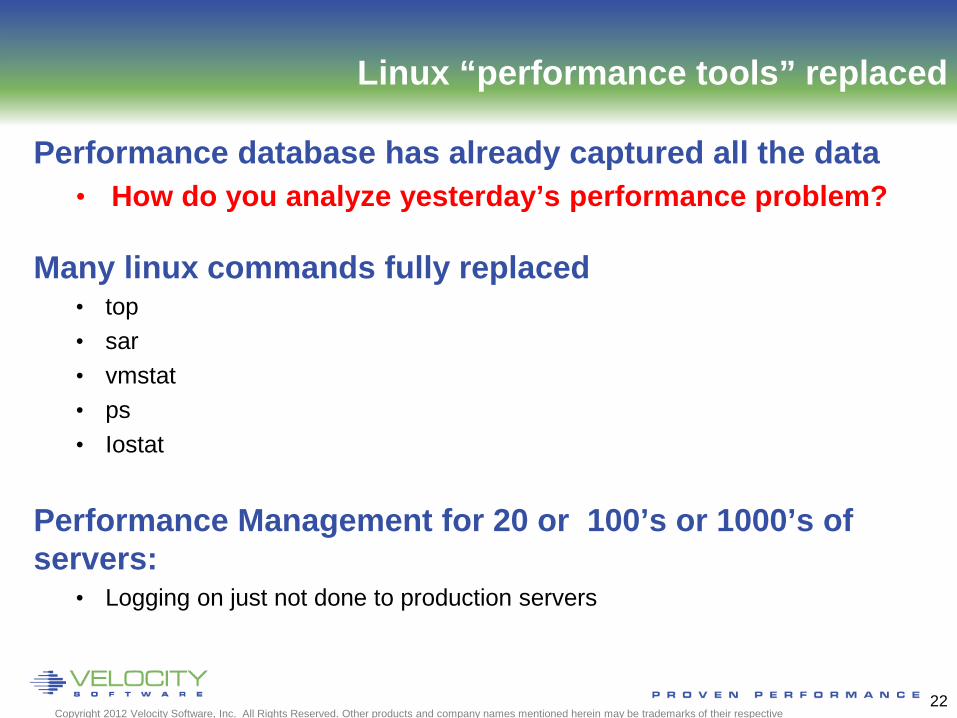
Linux “performance tools” replaced
Performance database has already captured all the data • How do you analyze yesterday’s performance problem?
Many linux commands fully replaced • top • sar • vmstat • ps • Iostat
Performance Management for 20 or 100’s or 1000’s of servers:
• Logging on just not done to production servers
22
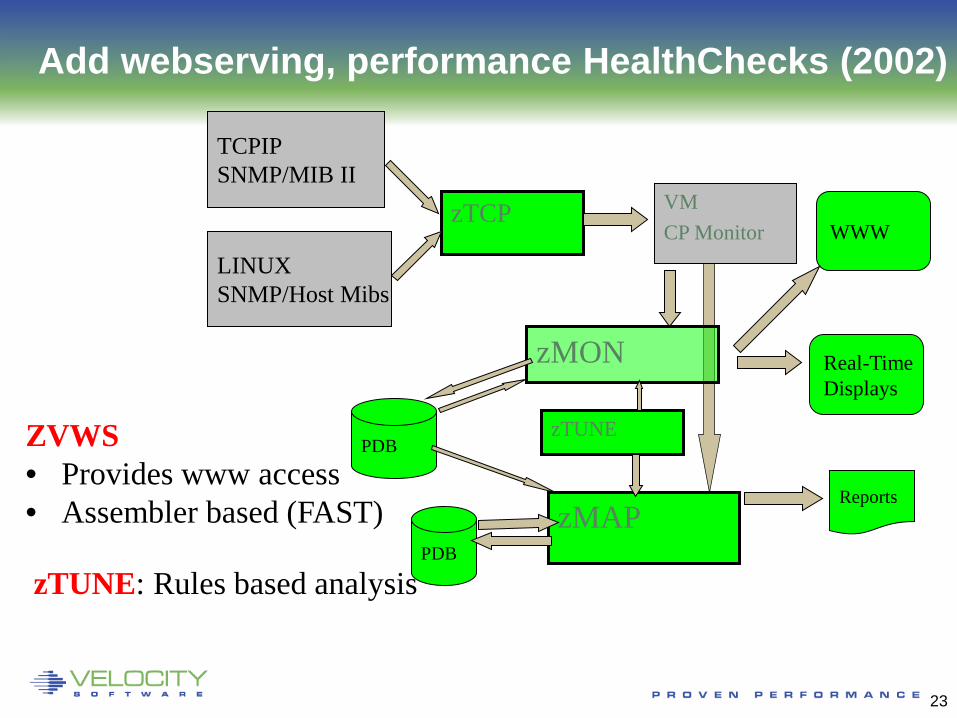
Add webserving, performance HealthChecks (2002)
zTUNE: Rules based analysis
TCPIP SNMP/MIB II
VM CP Monitor
LINUX SNMP/Host Mibs
zMON
Reports
PDB
zMAP
zTCP
Real-Time Displays
WWW
zTUNE ZVWS • Provides www access • Assembler based (FAST)
23
PDB

Add Full Enterprise Alerts, Oracle Metrics
Oracle MIB added to Velocity Mib (2014) • One minute granularity, maintain .1% target
TCPIP SNMP/MIB II
VM CP Monitor
LINUX SNMP/Host Mibs
zMON
Reports
PDB
zMAP
zTCP
Real-Time Displays
zALERT
24 Copyright 2012 Velocity Software, Inc. All Rights Reserved. Other products and company names mentioned herein may be trademarks of their respective
PDB
LINUX Oracle Mibs
Copyright 2012 Velocity Software, Inc. All Rights Reserved. Other products and company names mentioned herein may be trademarks of their respective
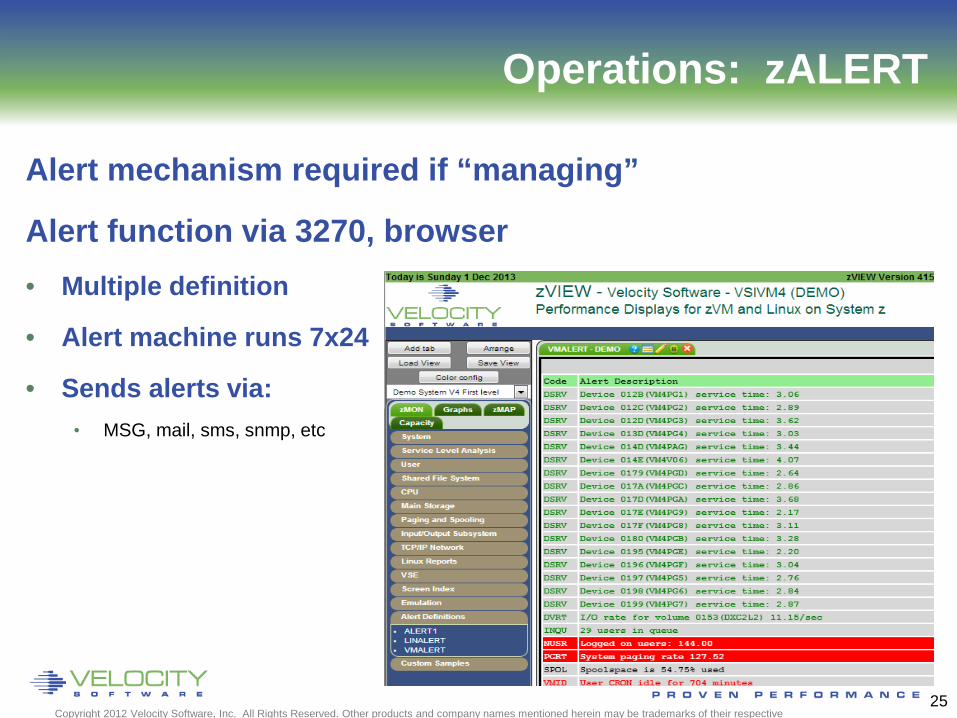
Operations: zALERT
Alert mechanism required if “managing”
Alert function via 3270, browser • Multiple definition
• Alert machine runs 7x24
• Sends alerts via: • MSG, mail, sms, snmp, etc
25
Copyright 2006 Velocity Software, Inc. All Rights Reserved. Other products and company names mentioned herein may be trademarks of their respective
• zVIEW is the “face” of zVPS, browser based
• zVIEW: • Web application • Integrated with zVPS • No charge feature of zVPS
• CEC List / Enterprise View • Feature of zVIEW • “CECLIST” Renamed to match function • High level view of any LPAR in enterprise
zVPS “is” zVIEW
26
Copyright 2006 Velocity Software, Inc. All Rights Reserved. Other products and company names mentioned herein may be trademarks of their respective
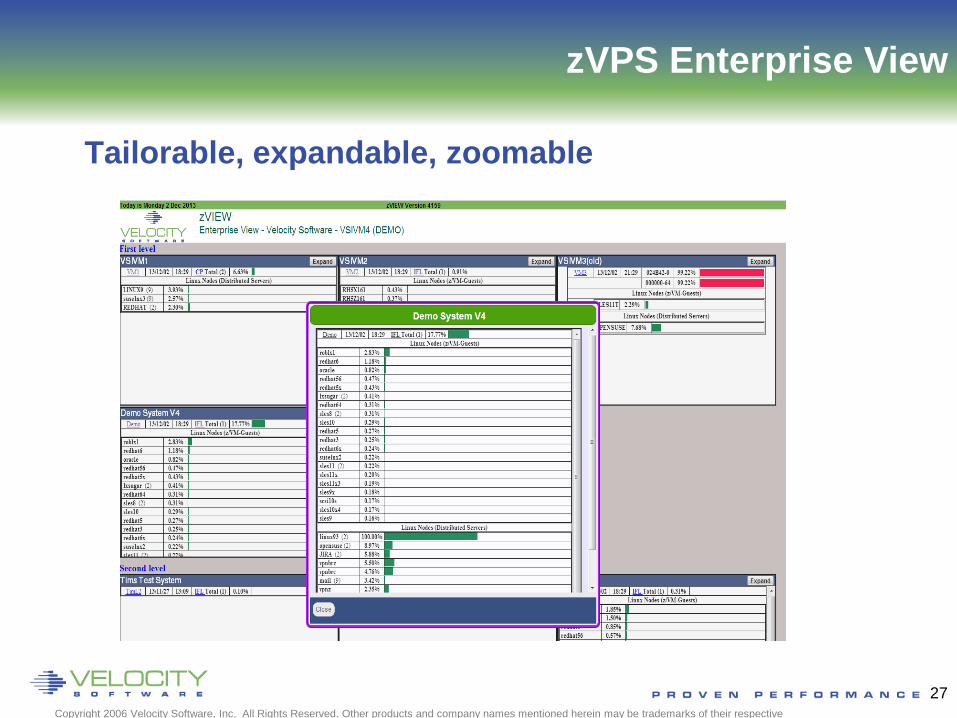
Tailorable, expandable, zoomable
zVPS Enterprise View
27
Copyright 2006 Velocity Software, Inc. All Rights Reserved. Other products and company names mentioned herein may be trademarks of their respective
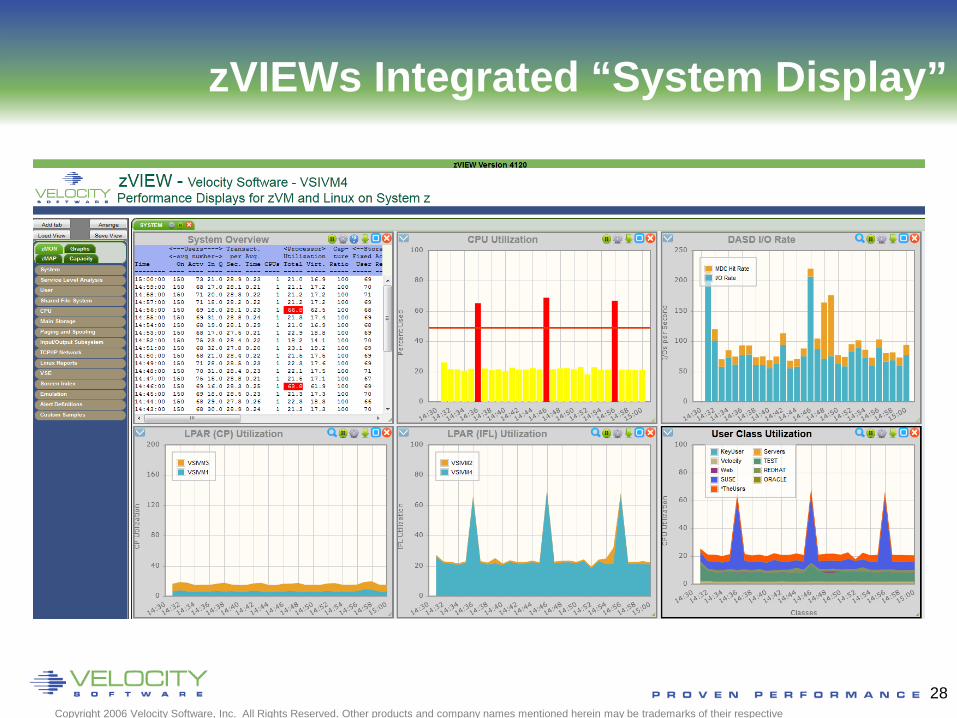
zVIEWs Integrated “System Display”
28

ZMON Drill down Options
Click on “user” to see user screens Click on “redhat” class to see “redhat users” Oracle data available 4.2
29 Copyright 2012 Velocity Software, Inc. All Rights Reserved. Other products and company names mentioned herein may be trademarks of their respective

Multiple System View (3 LPARs - 2012)
30
Oracle data from multiple lpars visible on one tab
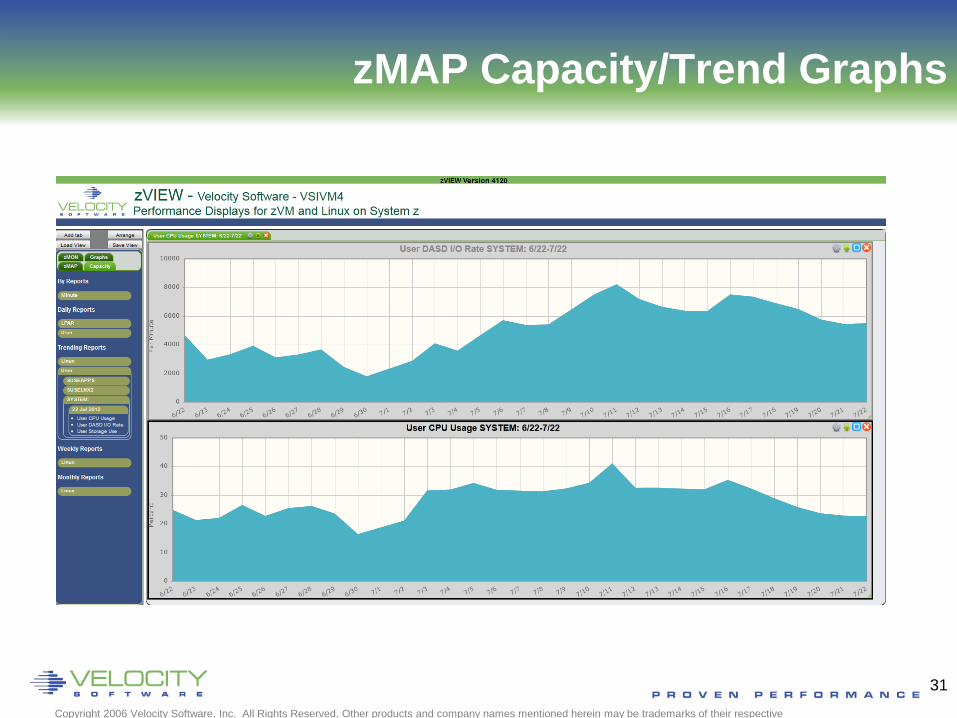
zMAP Capacity/Trend Graphs
Copyright 2006 Velocity Software, Inc. All Rights Reserved. Other products and company names mentioned herein may be trademarks of their respective
31
Copyright 2006 Velocity Software, Inc. All Rights Reserved. Other products and company names mentioned herein may be trademarks of their respective
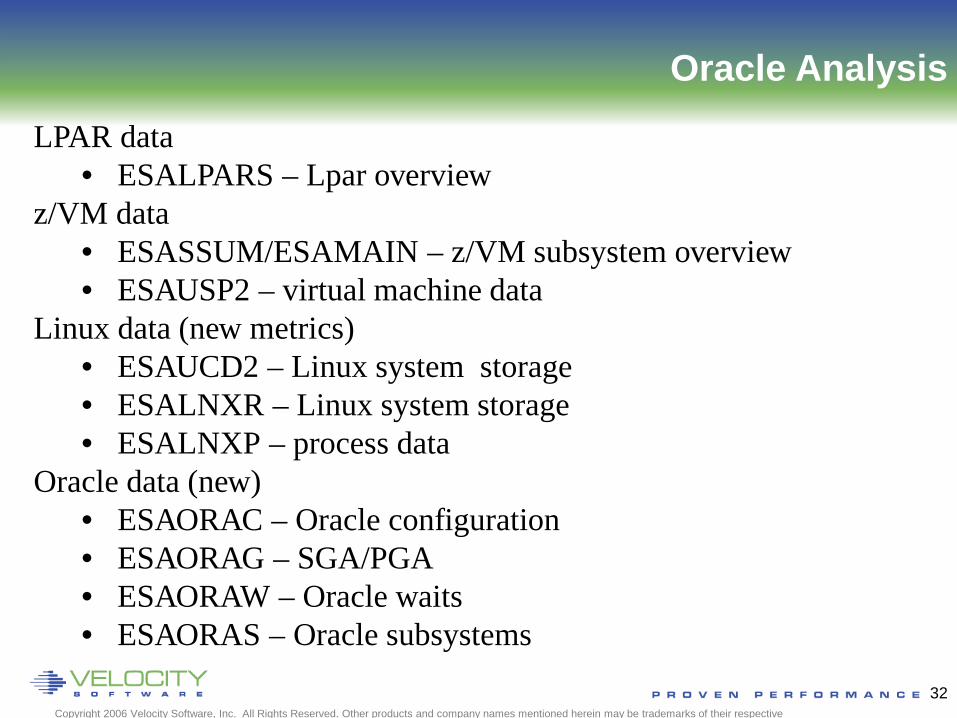
Oracle Analysis
LPAR data • ESALPARS – Lpar overview
z/VM data • ESASSUM/ESAMAIN – z/VM subsystem overview • ESAUSP2 – virtual machine data
Linux data (new metrics) • ESAUCD2 – Linux system storage • ESALNXR – Linux system storage • ESALNXP – process data
Oracle data (new) • ESAORAC – Oracle configuration • ESAORAG – SGA/PGA • ESAORAW – Oracle waits • ESAORAS – Oracle subsystems
32
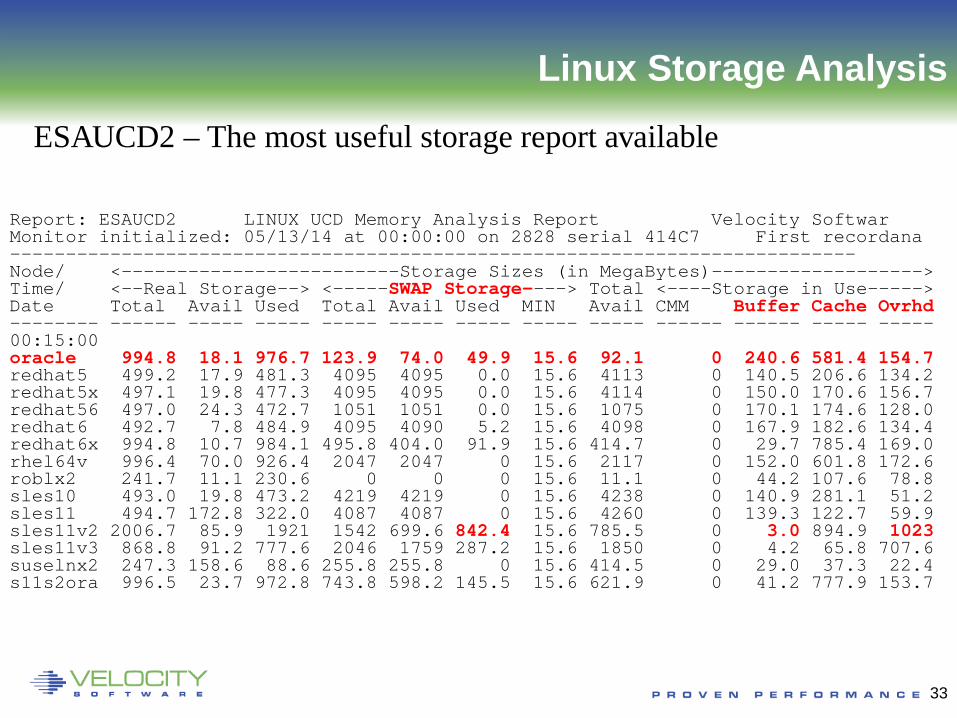
Report: ESAUCD2 LINUX UCD Memory Analysis Report Velocity Softwar Monitor initialized: 05/13/14 at 00:00:00 on 2828 serial 414C7 First recordana ---------------------------------------------------------------------------- Node/ <-------------------------Storage Sizes (in MegaBytes)-------------------> Time/ <--Real Storage--> <-----SWAP Storage----> Total <----Storage in Use-----> Date Total Avail Used Total Avail Used MIN Avail CMM Buffer Cache Ovrhd -------- ------ ----- ----- ----- ----- ----- ----- ----- ------ ------ ----- ----- 00:15:00 oracle 994.8 18.1 976.7 123.9 74.0 49.9 15.6 92.1 0 240.6 581.4 154.7 redhat5 499.2 17.9 481.3 4095 4095 0.0 15.6 4113 0 140.5 206.6 134.2 redhat5x 497.1 19.8 477.3 4095 4095 0.0 15.6 4114 0 150.0 170.6 156.7 redhat56 497.0 24.3 472.7 1051 1051 0.0 15.6 1075 0 170.1 174.6 128.0 redhat6 492.7 7.8 484.9 4095 4090 5.2 15.6 4098 0 167.9 182.6 134.4 redhat6x 994.8 10.7 984.1 495.8 404.0 91.9 15.6 414.7 0 29.7 785.4 169.0 rhel64v 996.4 70.0 926.4 2047 2047 0 15.6 2117 0 152.0 601.8 172.6 roblx2 241.7 11.1 230.6 0 0 0 15.6 11.1 0 44.2 107.6 78.8 sles10 493.0 19.8 473.2 4219 4219 0 15.6 4238 0 140.9 281.1 51.2 sles11 494.7 172.8 322.0 4087 4087 0 15.6 4260 0 139.3 122.7 59.9 sles11v2 2006.7 85.9 1921 1542 699.6 842.4 15.6 785.5 0 3.0 894.9 1023 sles11v3 868.8 91.2 777.6 2046 1759 287.2 15.6 1850 0 4.2 65.8 707.6 suselnx2 247.3 158.6 88.6 255.8 255.8 0 15.6 414.5 0 29.0 37.3 22.4 s11s2ora 996.5 23.7 972.8 743.8 598.2 145.5 15.6 621.9 0 41.2 777.9 153.7
Linux Storage Analysis
ESAUCD2 – The most useful storage report available
33
Copyright 2006 Velocity Software, Inc. All Rights Reserved. Other products and company names mentioned herein may be trademarks of their respective
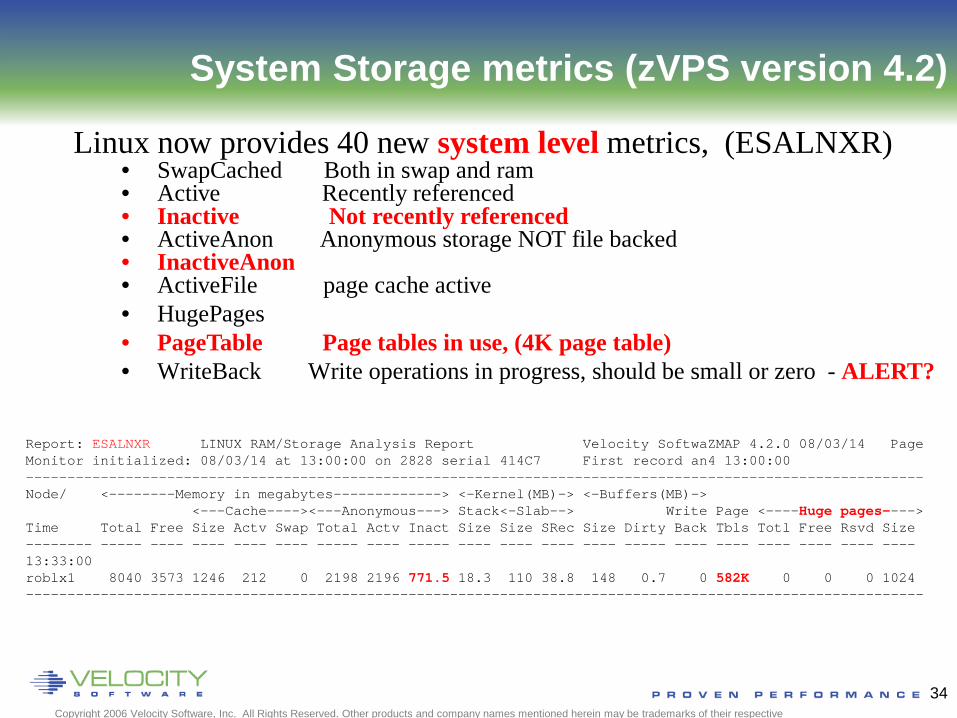
Report: ESALNXR LINUX RAM/Storage Analysis Report Velocity SoftwaZMAP 4.2.0 08/03/14 Page Monitor initialized: 08/03/14 at 13:00:00 on 2828 serial 414C7 First record an4 13:00:00 ------------------------------------------------------------------------------------------------------------ Node/ <--------Memory in megabytes-------------> <-Kernel(MB)-> <-Buffers(MB)-> <---Cache----><---Anonymous---> Stack<-Slab--> Write Page <----Huge pages----> Time Total Free Size Actv Swap Total Actv Inact Size Size SRec Size Dirty Back Tbls Totl Free Rsvd Size -------- ----- ---- ---- ---- ---- ----- ---- ----- ---- ---- ---- ---- ----- ---- ---- ---- ---- ---- ---- 13:33:00 roblx1 8040 3573 1246 212 0 2198 2196 771.5 18.3 110 38.8 148 0.7 0 582K 0 0 0 1024 ------------------------------------------------------------------------------------------------------------
System Storage metrics (zVPS version 4.2)
Linux now provides 40 new system level metrics, (ESALNXR) • SwapCached Both in swap and ram • Active Recently referenced • Inactive Not recently referenced • ActiveAnon Anonymous storage NOT file backed • InactiveAnon • ActiveFile page cache active • HugePages • PageTable Page tables in use, (4K page table) • WriteBack Write operations in progress, should be small or zero - ALERT?
34
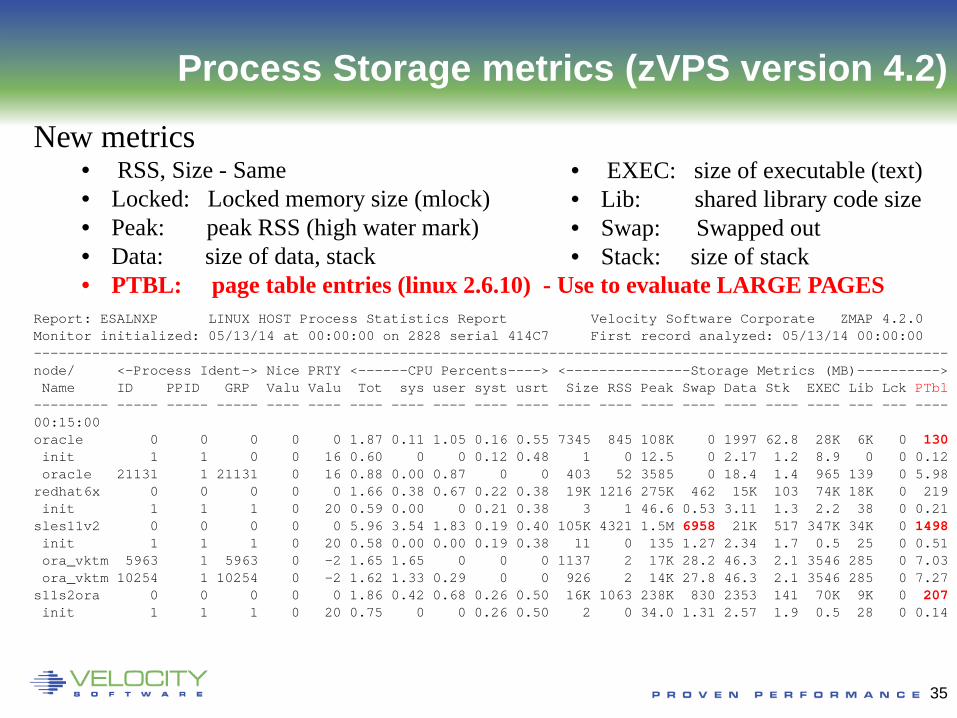
Report: ESALNXP LINUX HOST Process Statistics Report Velocity Software Corporate ZMAP 4.2.0 Monitor initialized: 05/13/14 at 00:00:00 on 2828 serial 414C7 First record analyzed: 05/13/14 00:00:00 -------------------------------------------------------------------------------------------------------------- node/ <-Process Ident-> Nice PRTY <------CPU Percents----> <---------------Storage Metrics (MB)----------> Name ID PPID GRP Valu Valu Tot sys user syst usrt Size RSS Peak Swap Data Stk EXEC Lib Lck PTbl --------- ----- ----- ----- ---- ---- ---- ---- ---- ---- ---- ---- ---- ---- ---- ---- ---- ---- --- --- ---- 00:15:00 oracle 0 0 0 0 0 1.87 0.11 1.05 0.16 0.55 7345 845 108K 0 1997 62.8 28K 6K 0 130 init 1 1 0 0 16 0.60 0 0 0.12 0.48 1 0 12.5 0 2.17 1.2 8.9 0 0 0.12 oracle 21131 1 21131 0 16 0.88 0.00 0.87 0 0 403 52 3585 0 18.4 1.4 965 139 0 5.98 redhat6x 0 0 0 0 0 1.66 0.38 0.67 0.22 0.38 19K 1216 275K 462 15K 103 74K 18K 0 219 init 1 1 1 0 20 0.59 0.00 0 0.21 0.38 3 1 46.6 0.53 3.11 1.3 2.2 38 0 0.21 sles11v2 0 0 0 0 0 5.96 3.54 1.83 0.19 0.40 105K 4321 1.5M 6958 21K 517 347K 34K 0 1498 init 1 1 1 0 20 0.58 0.00 0.00 0.19 0.38 11 0 135 1.27 2.34 1.7 0.5 25 0 0.51 ora_vktm 5963 1 5963 0 -2 1.65 1.65 0 0 0 1137 2 17K 28.2 46.3 2.1 3546 285 0 7.03 ora_vktm 10254 1 10254 0 -2 1.62 1.33 0.29 0 0 926 2 14K 27.8 46.3 2.1 3546 285 0 7.27 s11s2ora 0 0 0 0 0 1.86 0.42 0.68 0.26 0.50 16K 1063 238K 830 2353 141 70K 9K 0 207 init 1 1 1 0 20 0.75 0 0 0.26 0.50 2 0 34.0 1.31 2.57 1.9 0.5 28 0 0.14
Process Storage metrics (zVPS version 4.2)
New metrics • RSS, Size - Same • Locked: Locked memory size (mlock) • Peak: peak RSS (high water mark) • Data: size of data, stack • PTBL: page table entries (linux 2.6.10) - Use to evaluate LARGE PAGES
35
• EXEC: size of executable (text) • Lib: shared library code size • Swap: Swapped out • Stack: size of stack
Copyright 2006 Velocity Software, Inc. All Rights Reserved. Other products and company names mentioned herein may be trademarks of their respective
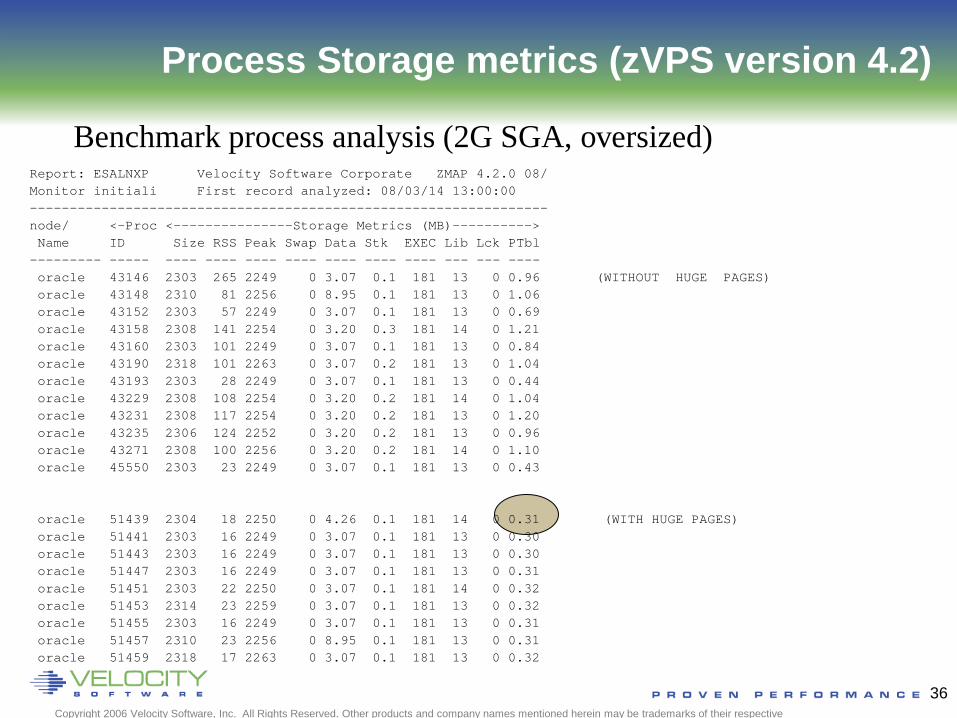
Report: ESALNXP Velocity Software Corporate ZMAP 4.2.0 08/ Monitor initiali First record analyzed: 08/03/14 13:00:00 ----------------------------------------------------------------- node/ <-Proc <---------------Storage Metrics (MB)----------> Name ID Size RSS Peak Swap Data Stk EXEC Lib Lck PTbl --------- ----- ---- ---- ---- ---- ---- ---- ---- --- --- ---- oracle 43146 2303 265 2249 0 3.07 0.1 181 13 0 0.96 (WITHOUT HUGE PAGES) oracle 43148 2310 81 2256 0 8.95 0.1 181 13 0 1.06 oracle 43152 2303 57 2249 0 3.07 0.1 181 13 0 0.69 oracle 43158 2308 141 2254 0 3.20 0.3 181 14 0 1.21 oracle 43160 2303 101 2249 0 3.07 0.1 181 13 0 0.84 oracle 43190 2318 101 2263 0 3.07 0.2 181 13 0 1.04 oracle 43193 2303 28 2249 0 3.07 0.1 181 13 0 0.44 oracle 43229 2308 108 2254 0 3.20 0.2 181 14 0 1.04 oracle 43231 2308 117 2254 0 3.20 0.2 181 13 0 1.20 oracle 43235 2306 124 2252 0 3.20 0.2 181 13 0 0.96 oracle 43271 2308 100 2256 0 3.20 0.2 181 14 0 1.10 oracle 45550 2303 23 2249 0 3.07 0.1 181 13 0 0.43 oracle 51439 2304 18 2250 0 4.26 0.1 181 14 0 0.31 (WITH HUGE PAGES) oracle 51441 2303 16 2249 0 3.07 0.1 181 13 0 0.30 oracle 51443 2303 16 2249 0 3.07 0.1 181 13 0 0.30 oracle 51447 2303 16 2249 0 3.07 0.1 181 13 0 0.31 oracle 51451 2303 22 2250 0 3.07 0.1 181 14 0 0.32 oracle 51453 2314 23 2259 0 3.07 0.1 181 13 0 0.32 oracle 51455 2303 16 2249 0 3.07 0.1 181 13 0 0.31 oracle 51457 2310 23 2256 0 8.95 0.1 181 13 0 0.31 oracle 51459 2318 17 2263 0 3.07 0.1 181 13 0 0.32
Process Storage metrics (zVPS version 4.2)
Benchmark process analysis (2G SGA, oversized)
36
Copyright 2012 Velocity Software, Inc. All Rights Reserved. Other products and company names mentioned herein may be trademarks of their respective
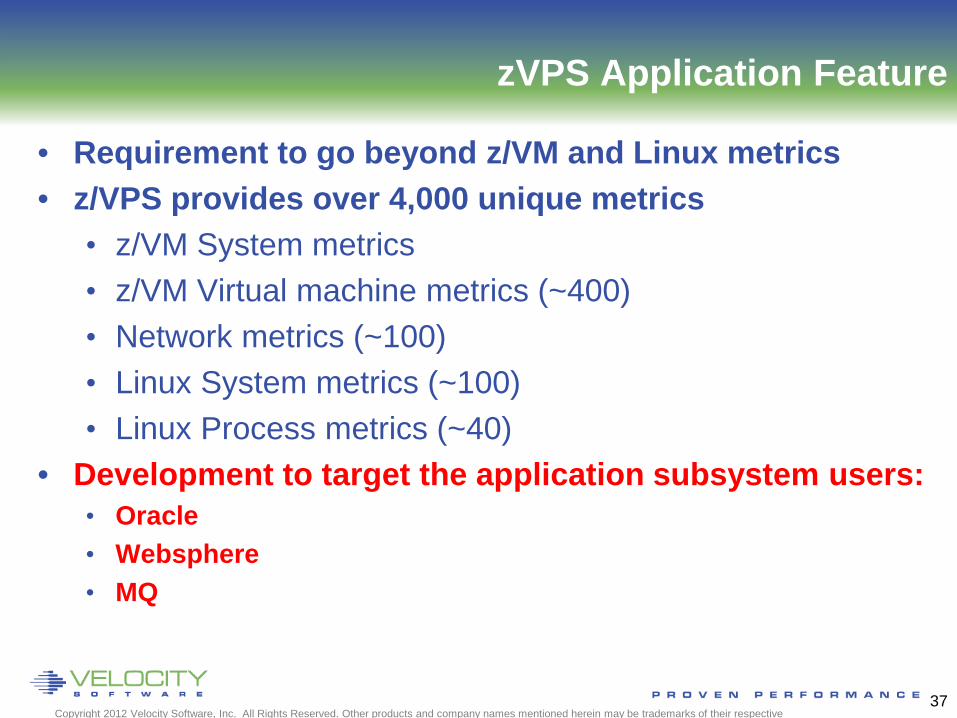
zVPS Application Feature
• Requirement to go beyond z/VM and Linux metrics • z/VPS provides over 4,000 unique metrics
• z/VM System metrics • z/VM Virtual machine metrics (~400) • Network metrics (~100) • Linux System metrics (~100) • Linux Process metrics (~40)
• Development to target the application subsystem users: • Oracle • Websphere • MQ
37
Copyright 2006 Velocity Software, Inc. All Rights Reserved. Other products and company names mentioned herein may be trademarks of their respective
zVPS Application Feature
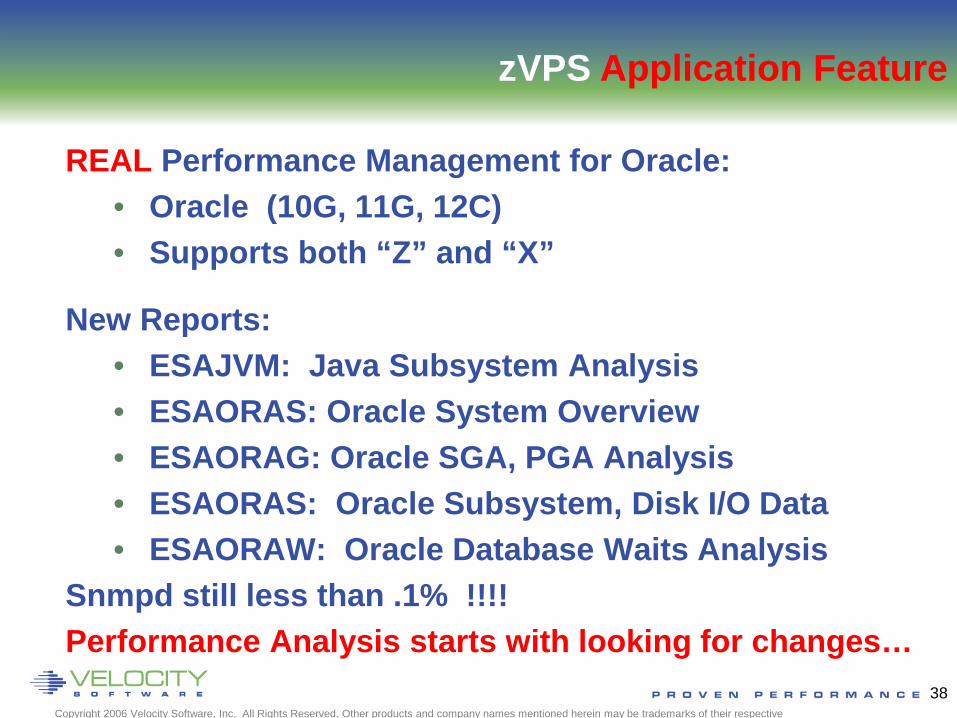
REAL Performance Management for Oracle: • Oracle (10G, 11G, 12C) • Supports both “Z” and “X”
New Reports: • ESAJVM: Java Subsystem Analysis • ESAORAS: Oracle System Overview • ESAORAG: Oracle SGA, PGA Analysis • ESAORAS: Oracle Subsystem, Disk I/O Data • ESAORAW: Oracle Database Waits Analysis
Snmpd still less than .1% !!!! Performance Analysis starts with looking for changes…
38
Copyright 2012 Velocity Software, Inc. All Rights Reserved. Other products and company names mentioned herein may be trademarks of their respective
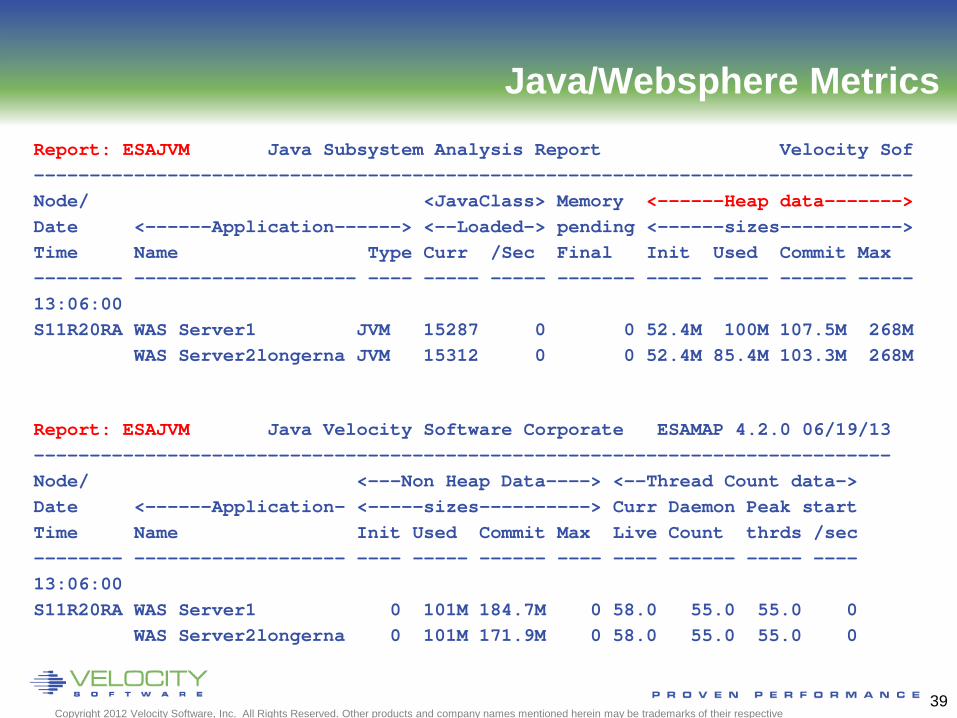
Java/Websphere Metrics Report: ESAJVM Java Subsystem Analysis Report Velocity Sof ------------------------------------------------------------------------------- Node/ <JavaClass> Memory <------Heap data-------> Date <------Application------> <--Loaded-> pending <------sizes-----------> Time Name Type Curr /Sec Final Init Used Commit Max -------- -------------------- ---- ----- ----- ------- ----- ----- ------ ----- 13:06:00 S11R20RA WAS Server1 JVM 15287 0 0 52.4M 100M 107.5M 268M WAS Server2longerna JVM 15312 0 0 52.4M 85.4M 103.3M 268M
Report: ESAJVM Java Velocity Software Corporate ESAMAP 4.2.0 06/19/13 ----------------------------------------------------------------------------- Node/ <---Non Heap Data----> <--Thread Count data-> Date <------Application- <-----sizes----------> Curr Daemon Peak start Time Name Init Used Commit Max Live Count thrds /sec -------- ------------------- ---- ----- ------ ---- ---- ------ ----- ---- 13:06:00 S11R20RA WAS Server1 0 101M 184.7M 0 58.0 55.0 55.0 0 WAS Server2longerna 0 101M 171.9M 0 58.0 55.0 55.0 0
39
Copyright 2012 Velocity Software, Inc. All Rights Reserved. Other products and company names mentioned herein may be trademarks of their respective
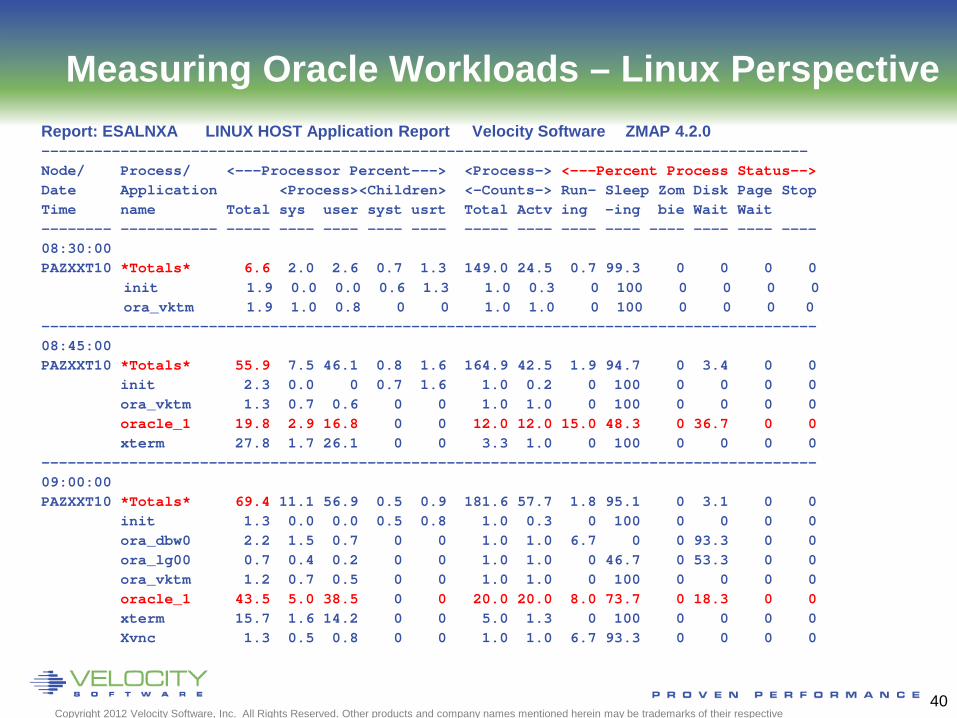
Measuring Oracle Workloads – Linux Perspective Report: ESALNXA LINUX HOST Application Report Velocity Software ZMAP 4.2.0 --------------------------------------------------------------------------------------- Node/ Process/ <---Processor Percent---> <Process-> <---Percent Process Status--> Date Application <Process><Children> <-Counts-> Run- Sleep Zom Disk Page Stop Time name Total sys user syst usrt Total Actv ing -ing bie Wait Wait -------- ----------- ----- ---- ---- ---- ---- ----- ---- ---- ---- ---- ---- ---- ---- 08:30:00 PAZXXT10 *Totals* 6.6 2.0 2.6 0.7 1.3 149.0 24.5 0.7 99.3 0 0 0 0 init 1.9 0.0 0.0 0.6 1.3 1.0 0.3 0 100 0 0 0 0 ora_vktm 1.9 1.0 0.8 0 0 1.0 1.0 0 100 0 0 0 0 ---------------------------------------------------------------------------------------- 08:45:00 PAZXXT10 *Totals* 55.9 7.5 46.1 0.8 1.6 164.9 42.5 1.9 94.7 0 3.4 0 0 init 2.3 0.0 0 0.7 1.6 1.0 0.2 0 100 0 0 0 0 ora_vktm 1.3 0.7 0.6 0 0 1.0 1.0 0 100 0 0 0 0 oracle_1 19.8 2.9 16.8 0 0 12.0 12.0 15.0 48.3 0 36.7 0 0 xterm 27.8 1.7 26.1 0 0 3.3 1.0 0 100 0 0 0 0 ---------------------------------------------------------------------------------------- 09:00:00 PAZXXT10 *Totals* 69.4 11.1 56.9 0.5 0.9 181.6 57.7 1.8 95.1 0 3.1 0 0 init 1.3 0.0 0.0 0.5 0.8 1.0 0.3 0 100 0 0 0 0 ora_dbw0 2.2 1.5 0.7 0 0 1.0 1.0 6.7 0 0 93.3 0 0 ora_lg00 0.7 0.4 0.2 0 0 1.0 1.0 0 46.7 0 53.3 0 0 ora_vktm 1.2 0.7 0.5 0 0 1.0 1.0 0 100 0 0 0 0 oracle_1 43.5 5.0 38.5 0 0 20.0 20.0 8.0 73.7 0 18.3 0 0 xterm 15.7 1.6 14.2 0 0 5.0 1.3 0 100 0 0 0 0 Xvnc 1.3 0.5 0.8 0 0 1.0 1.0 6.7 93.3 0 0 0 0
40
Oracle Database Configuration
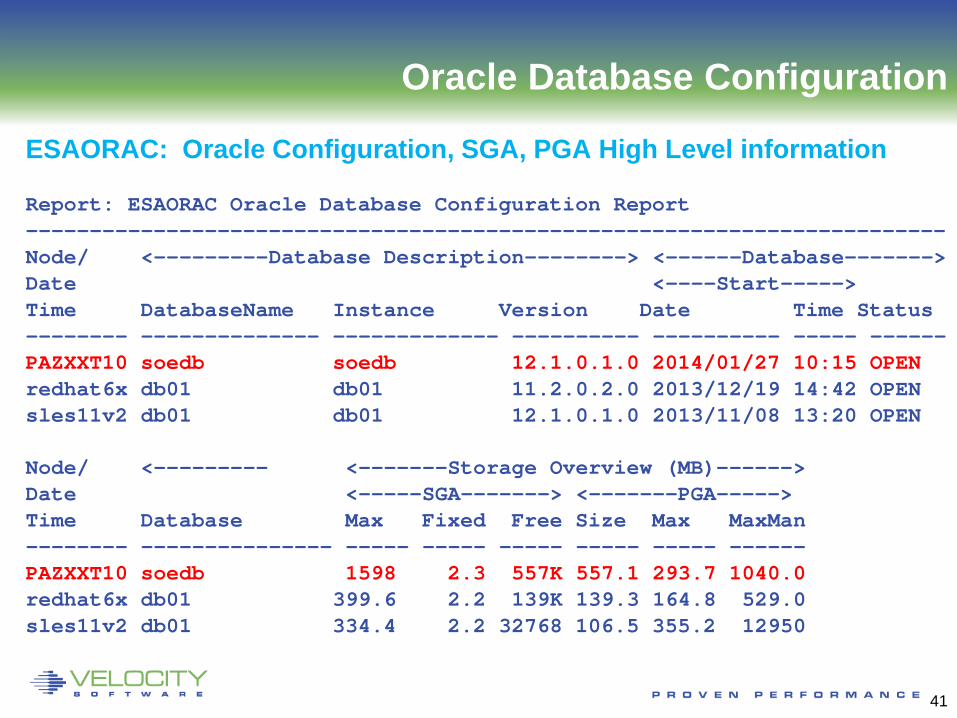
ESAORAC: Oracle Configuration, SGA, PGA High Level information
Report: ESAORAC Oracle Database Configuration Report ------------------------------------------------------------------------ Node/ <---------Database Description--------> <------Database-------> Date <----Start-----> Time DatabaseName Instance Version Date Time Status -------- -------------- ------------- ---------- ---------- ----- ------ PAZXXT10 soedb soedb 12.1.0.1.0 2014/01/27 10:15 OPEN redhat6x db01 db01 11.2.0.2.0 2013/12/19 14:42 OPEN sles11v2 db01 db01 12.1.0.1.0 2013/11/08 13:20 OPEN Node/ <--------- <-------Storage Overview (MB)------> Date <-----SGA-------> <-------PGA-----> Time Database Max Fixed Free Size Max MaxMan -------- --------------- ----- ----- ----- ----- ----- ------ PAZXXT10 soedb 1598 2.3 557K 557.1 293.7 1040.0 redhat6x db01 399.6 2.2 139K 139.3 164.8 529.0 sles11v2 db01 334.4 2.2 32768 106.5 355.2 12950
41

Measuring Oracle Database Storage
ESAORAG: General Storage Areas – SGA, no changes
Report: ESAORAG SGA/PGA Analysis Report Velocity Software Monitor initializ/14 at 08:00:00 on 2094 serial 53E5D First record anal --------------------------------------------------------------------------- Node/ <------------Shared Global Area (SGA) in Megabytes-----> Date <--Data Max Fixed Redo Buffer <------Pool sizes----------> Time Name Size Size Buffr Cache Free Shrd Large Java Stream ShrIO -------- -------- ----- ---- ----- ----- ---- ---- ----- ---- ------ ----- 08:30:00 PAZXXT10 soedb 1598 2.3 6.9 655.4 557K 295 32.8 16.4 32.8 49.2 --------------------------------------------------------------------------- 08:45:00 PAZXXT10 soedb 1598 2.3 6.9 658.6 557K 295 32.8 16.4 29.5 49.2 --------------------------------------------------------------------------- 09:00:00 PAZXXT10 soedb 1598 2.3 6.9 671.7 557K 295 32.8 16.4 16.4 49.2
42

Measuring Oracle PGA
ESAORAG: General Storage Areas – PGA Grows with workload Report: ESAORAG --------------------------------------------------- Node/ <--PGA Data (in Megabytes)--> Date <--Data <-Target-> InUse Alloc Free Time Name Parm Auto -able -------- -------- ---- ---- ----- ----- ----- 01/28/14 08:30:00 PAZXXT10 soedb 557 451 56.8 84.1 17.5 --------------------------------------------------- 08:45:00 PAZXXT10 soedb 557 426 84.2 128.9 30.4 --------------------------------------------------- 09:00:00 PAZXXT10 soedb 557 404 109.4 170.3 43.6
43
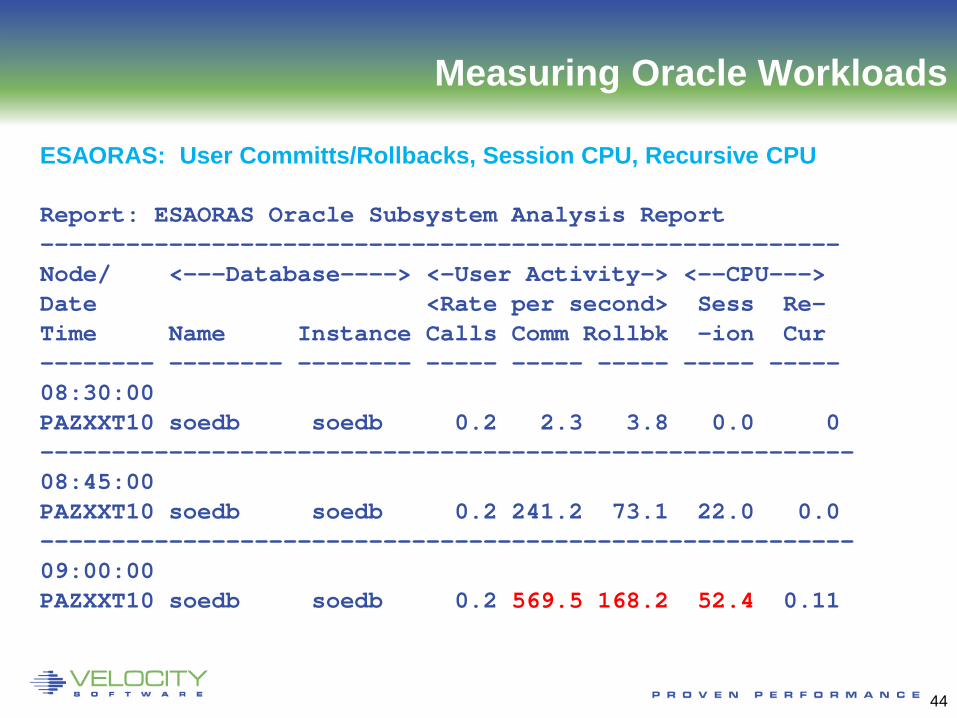
Measuring Oracle Workloads
ESAORAS: User Committs/Rollbacks, Session CPU, Recursive CPU
Report: ESAORAS Oracle Subsystem Analysis Report -------------------------------------------------------- Node/ <---Database----> <-User Activity-> <--CPU---> Date <Rate per second> Sess Re- Time Name Instance Calls Comm Rollbk -ion Cur -------- -------- -------- ----- ----- ----- ----- ----- 08:30:00 PAZXXT10 soedb soedb 0.2 2.3 3.8 0.0 0 --------------------------------------------------------- 08:45:00 PAZXXT10 soedb soedb 0.2 241.2 73.1 22.0 0.0 --------------------------------------------------------- 09:00:00 PAZXXT10 soedb soedb 0.2 569.5 168.2 52.4 0.11
44

Oracle Database I/O
ESAORAS: Oracle Subsystem
Report: ESAORAS Velocity Software Corporate ZMAP 4.2.0 12/21/13 -------------------------------------------------------------------------- Node/ <----Physical Reads Activty---> <-Physical Write Activity--> Date <------Rate per second--------> <----Rate per second-------> Time Name Rds Hits Direct I/O Bytes Writs CHits Dirct I/O Bytes -------- ----- ----- ----- ----- ----- ----- ----- ----- ------ ----- ---- 08:30:00 PAZXXT10 soedb 0.8 0.2 0.2 0.2 0 0.1 1415 0.3 0.2 0.1 -------------------------------------------------------------------------- 08:45:00 PAZXXT10 soedb 18.1 8.3 172.8 172.8 0 172.2 715K 42.8 42.3 0.5 ---------------------------------------------------------------- ---------- 09:00:00 PAZXXT10 soedb 36.5 13.8 279.9 279.9 0 276.6 9733K 178.6 178.6 0.1
45
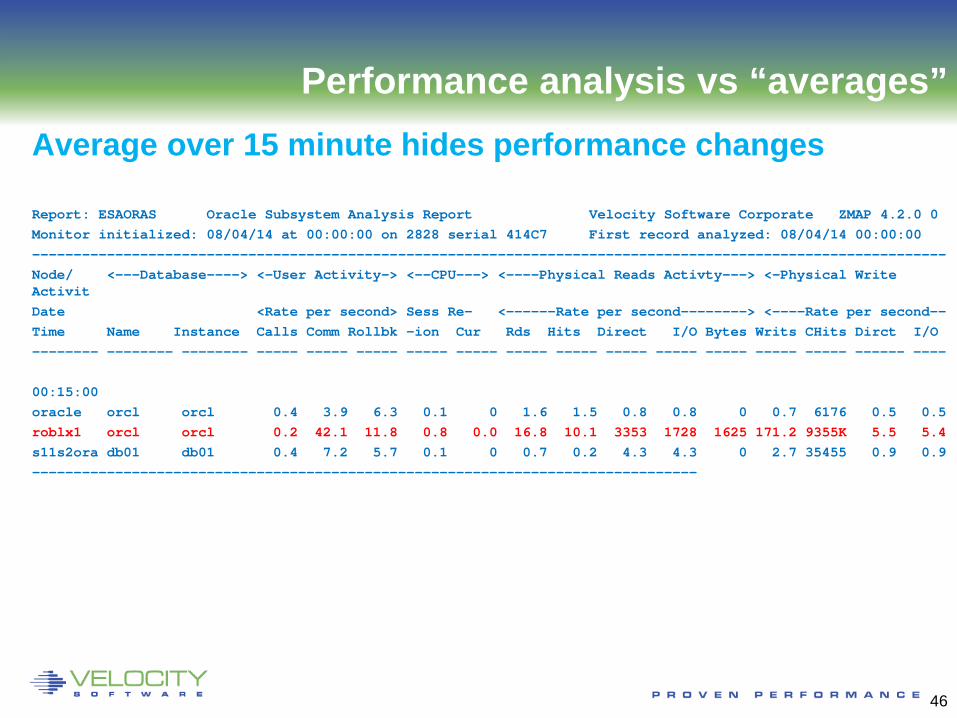
Performance analysis vs “averages” Average over 15 minute hides performance changes Report: ESAORAS Oracle Subsystem Analysis Report Velocity Software Corporate ZMAP 4.2.0 0 Monitor initialized: 08/04/14 at 00:00:00 on 2828 serial 414C7 First record analyzed: 08/04/14 00:00:00 -------------------------------------------------------------------------------------------------------------- Node/ <---Database----> <-User Activity-> <--CPU---> <----Physical Reads Activty---> <-Physical Write Activit Date <Rate per second> Sess Re- <------Rate per second--------> <----Rate per second-- Time Name Instance Calls Comm Rollbk -ion Cur Rds Hits Direct I/O Bytes Writs CHits Dirct I/O -------- -------- -------- ----- ----- ----- ----- ----- ----- ----- ----- ----- ----- ----- ----- ------ ---- 00:15:00 oracle orcl orcl 0.4 3.9 6.3 0.1 0 1.6 1.5 0.8 0.8 0 0.7 6176 0.5 0.5 roblx1 orcl orcl 0.2 42.1 11.8 0.8 0.0 16.8 10.1 3353 1728 1625 171.2 9355K 5.5 5.4 s11s2ora db01 db01 0.4 7.2 5.7 0.1 0 0.7 0.2 4.3 4.3 0 2.7 35455 0.9 0.9 --------------------------------------------------------------------------------
46
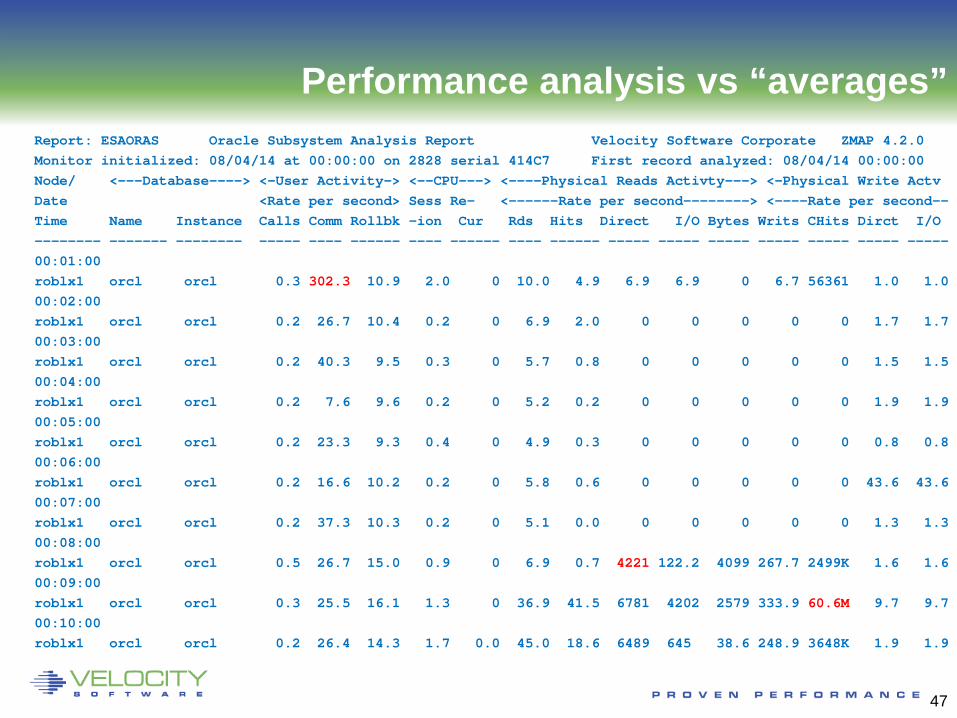
Performance analysis vs “averages” Report: ESAORAS Oracle Subsystem Analysis Report Velocity Software Corporate ZMAP 4.2.0 Monitor initialized: 08/04/14 at 00:00:00 on 2828 serial 414C7 First record analyzed: 08/04/14 00:00:00 Node/ <---Database----> <-User Activity-> <--CPU---> <----Physical Reads Activty---> <-Physical Write Actv Date <Rate per second> Sess Re- <------Rate per second--------> <----Rate per second-- Time Name Instance Calls Comm Rollbk -ion Cur Rds Hits Direct I/O Bytes Writs CHits Dirct I/O -------- ------- -------- ----- ---- ------ ---- ------ ---- ------ ----- ----- ----- ----- ----- ----- ----- 00:01:00 roblx1 orcl orcl 0.3 302.3 10.9 2.0 0 10.0 4.9 6.9 6.9 0 6.7 56361 1.0 1.0 00:02:00 roblx1 orcl orcl 0.2 26.7 10.4 0.2 0 6.9 2.0 0 0 0 0 0 1.7 1.7 00:03:00 roblx1 orcl orcl 0.2 40.3 9.5 0.3 0 5.7 0.8 0 0 0 0 0 1.5 1.5 00:04:00 roblx1 orcl orcl 0.2 7.6 9.6 0.2 0 5.2 0.2 0 0 0 0 0 1.9 1.9 00:05:00 roblx1 orcl orcl 0.2 23.3 9.3 0.4 0 4.9 0.3 0 0 0 0 0 0.8 0.8 00:06:00 roblx1 orcl orcl 0.2 16.6 10.2 0.2 0 5.8 0.6 0 0 0 0 0 43.6 43.6 00:07:00 roblx1 orcl orcl 0.2 37.3 10.3 0.2 0 5.1 0.0 0 0 0 0 0 1.3 1.3 00:08:00 roblx1 orcl orcl 0.5 26.7 15.0 0.9 0 6.9 0.7 4221 122.2 4099 267.7 2499K 1.6 1.6 00:09:00 roblx1 orcl orcl 0.3 25.5 16.1 1.3 0 36.9 41.5 6781 4202 2579 333.9 60.6M 9.7 9.7 00:10:00 roblx1 orcl orcl 0.2 26.4 14.3 1.7 0.0 45.0 18.6 6489 645 38.6 248.9 3648K 1.9 1.9
47
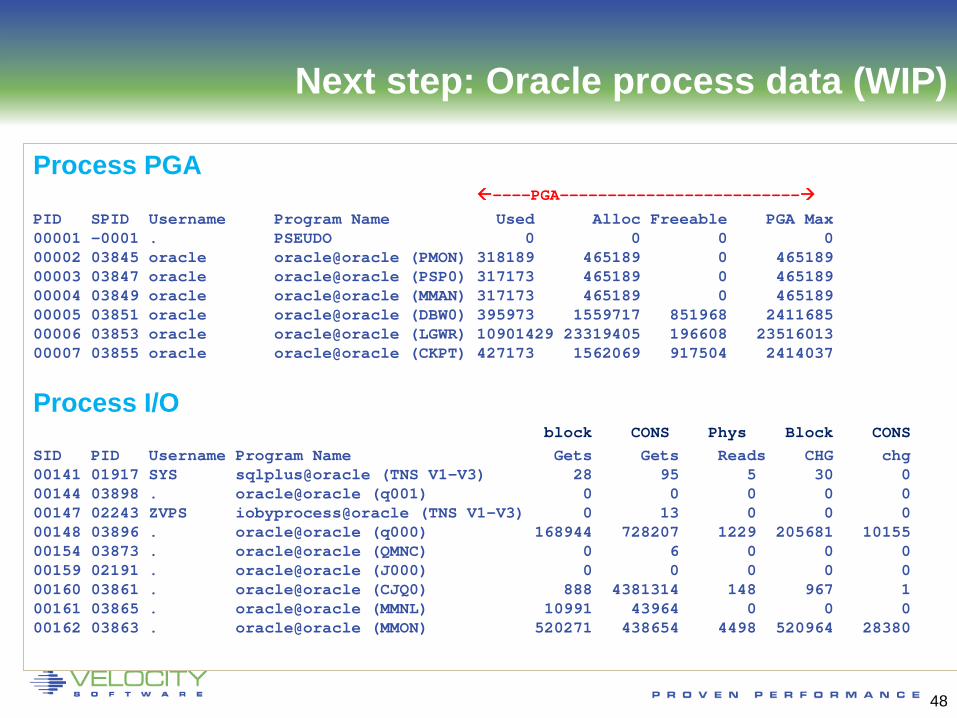
Next step: Oracle process data (WIP)
Process PGA ----PGA-------------------------
PID SPID Username Program Name Used Alloc Freeable PGA Max 00001 -0001 . PSEUDO 0 0 0 0 00002 03845 oracle oracle@oracle (PMON) 318189 465189 0 465189 00003 03847 oracle oracle@oracle (PSP0) 317173 465189 0 465189 00004 03849 oracle oracle@oracle (MMAN) 317173 465189 0 465189 00005 03851 oracle oracle@oracle (DBW0) 395973 1559717 851968 2411685 00006 03853 oracle oracle@oracle (LGWR) 10901429 23319405 196608 23516013 00007 03855 oracle oracle@oracle (CKPT) 427173 1562069 917504 2414037
Process I/O block CONS Phys Block CONS SID PID Username Program Name Gets Gets Reads CHG chg 00141 01917 SYS sqlplus@oracle (TNS V1-V3) 28 95 5 30 0 00144 03898 . oracle@oracle (q001) 0 0 0 0 0 00147 02243 ZVPS iobyprocess@oracle (TNS V1-V3) 0 13 0 0 0 00148 03896 . oracle@oracle (q000) 168944 728207 1229 205681 10155 00154 03873 . oracle@oracle (QMNC) 0 6 0 0 0 00159 02191 . oracle@oracle (J000) 0 0 0 0 0 00160 03861 . oracle@oracle (CJQ0) 888 4381314 148 967 1 00161 03865 . oracle@oracle (MMNL) 10991 43964 0 0 0 00162 03863 . oracle@oracle (MMON) 520271 438654 4498 520964 28380
48
Setting Alerts?
Possible metrics for alerting: • For server, by database: • SGA size > x • PGA allocated > x • Users? • I/O • Cache hits?
49