Embed Size (px)
Citation preview

Oracle Financial Services
Market Risk Measurement and Management
User Guide
Release 8.0.6.0.0
Part Number: E98958-01

Oracle Financial Services Market Risk Measurement and Management User Guide: Release
8.0.6.0.0
ii
Oracle Financial Services Market Risk Measurement and Management User Guide, Release 8.0.6.0.0
E98958-01
Copyright © 2018, Oracle and/or its affiliates. All rights reserved.
Primary Author: Vineeta Mishra
Contributors: Hirak Patel and Vivek Choudhary
Oracle and Java are registered trademarks of Oracle and/or its affiliates. Other names may be
trademarks of their respective owners.
Intel and Intel Xeon are trademarks or registered trademarks of Intel Corporation. All SPARC trademarks
are used under license and are trademarks or registered trademarks of SPARC International, Inc. AMD,
Opteron, the AMD logo, and the AMD Opteron logo are trademarks or registered trademarks of Advanced
Micro Devices. UNIX is a registered trademark of The Open Group.
This software and related documentation are provided under a license agreement containing restrictions
on use and disclosure and are protected by intellectual property laws. Except as expressly permitted in
your license agreement or allowed by law, you may not use, copy, reproduce, translate, broadcast,
modify, license, transmit, distribute, exhibit, perform, publish, or display any part, in any form, or by any
means. Reverse engineering, disassembly, or decompilation of this software, unless required by law for
interoperability, is prohibited.
The information contained herein is subject to change without notice and is not warranted to be error-free.
If you find any errors, please report them to us in writing. If this is software or related documentation that
is delivered to the U.S. Government or anyone licensing it on behalf of the U.S. Government, the
following notice is applicable:
U.S. GOVERNMENT END USERS: Oracle programs, including any operating system, integrated
software, any programs installed on the hardware, and/or documentation, delivered to U.S. Government
end users are "commercial computer software" pursuant to the applicable Federal Acquisition Regulation
and agency-specific supplemental regulations. As such, use, duplication, disclosure, modification, and
adaptation of the programs, including any operating system, integrated software, any programs installed
on the hardware, and/or documentation, shall be subject to license terms and license restrictions
applicable to the programs. No other rights are granted to the U.S. Government.
This software or hardware is developed for general use in a variety of information management
applications. It is not developed or intended for use in any inherently dangerous applications, including
applications that may create a risk of personal injury. If you use this software or hardware in dangerous
applications, then you shall be responsible to take all appropriate fail-safe, backup, redundancy, and

Oracle Financial Services Market Risk Measurement and Management User Guide: Release
8.0.6.0.0
iii
other measures to ensure its safe use. Oracle Corporation and its affiliates disclaim any liability for any
damages caused by use of this software or hardware in dangerous applications.
This software or hardware and documentation may provide access to or information on content, products,
and services from third parties. Oracle Corporation and its affiliates are not responsible for and expressly
disclaim all warranties of any kind with respect to third-party content, products, and services. Oracle
Corporation and its affiliates will not be responsible for any loss, costs, or damages incurred due to your
access to or use of third-party content, products, or services.
Oracle Financial Services Market Risk Measurement and Management User Guide
Release 8.0.6.0.0
iv
TTAABBLLEE OOFF CCOONNTTEENNTTSS
ABOUT THE GUIDE ....................................................................................................................................... XIII
SCOPE OF THE GUIDE .................................................................................................................................. XIII
INTENDED AUDIENCE ................................................................................................................................... XIII
DOCUMENTATION ACCESSIBILITY ................................................................................................................ XIII
ACCESS TO ORACLE SUPPORT .................................................................................................................... XIII
RELATED INFORMATION SOURCES .............................................................................................................. XIV
HOW THIS GUIDE IS ORGANIZED ................................................................................................................. XIV
ABBREVIATIONS ........................................................................................................................................... XV
1 INTRODUCTION TO ORACLE FINANCIAL SERVICES MARKET RISK MEASUREMENT AND MANAGEMENT ....... 17
1.1 Overview of OFS MRMM ......................................................................................................................... 17
1.2 Process Flow............................................................................................................................................ 18
1.3 Components of OFS Market Risk Measurement and Management ......................................................... 19
2 GETTING STARTED WITH OFS MRMM ................................................................................................... 21
2.1 Logging in to OFS MRMM Application ..................................................................................................... 21
2.2 Managing OFS MRMM ............................................................................................................................ 23
2.3 Common User Interface Functionalities ................................................................................................... 25
2.3.1 Search ......................................................................................................................................................... 25
2.3.2 Folder .......................................................................................................................................................... 25
2.3.3 Sorting Objects ............................................................................................................................................ 25
2.3.4 New ............................................................................................................................................................. 25
2.3.5 Deleting an Object........................................................................................................................................ 25
2.3.6 Changing the Layout .................................................................................................................................... 25
2.3.7 Exporting a Portfolio ..................................................................................................................................... 26
3 OVERVIEW OF OFSAA INFRASTRUCTURE COMPONENTS ........................................................................ 27
4 OFSAA RATE MANAGEMENT – CURRENCIES ......................................................................................... 28
4.1 Currencies ................................................................................................................................................ 28
4.1.1 Search Container ......................................................................................................................................... 28
4.1.2 Currencies Container ................................................................................................................................... 29
4.1.3 Currencies Summary Grid ............................................................................................................................ 29

Oracle Financial Services Market Risk Measurement and Management User Guide
Release 8.0.6.0.0
v
4.1.4 Editing Currencies ........................................................................................................................................ 30
4.1.5 Adding Currencies ........................................................................................................................................ 30
4.1.6 Deleting Currencies ...................................................................................................................................... 30
5 HOLIDAY CALENDAR ............................................................................................................................. 31
5.1 Overview of Holiday Calendars ................................................................................................................ 31
5.1.1 Searching for a Holiday Calendar ................................................................................................................. 31
5.1.2 Creating a Holiday Calendar ........................................................................................................................ 32
5.1.3 Executing a Holiday Calendar ...................................................................................................................... 34
5.1.4 Holiday Exceptions ....................................................................................................................................... 35
5.1.5 Excel Import/ Export ..................................................................................................................................... 36
6 APPLICATION PREFERENCES ................................................................................................................. 37
6.1 Overview .................................................................................................................................................. 37
6.2 Understanding Application Preferences ................................................................................................... 37
6.3 Dimension and Hierarchy Configuration ................................................................................................... 38
6.3.1 Configuring Dimensions ............................................................................................................................... 38
6.3.2 Configuring Hierarchies ................................................................................................................................ 40
6.4 Default Configurations .............................................................................................................................. 40
6.4.1 Currency ...................................................................................................................................................... 41
6.4.2 Currency Pair ............................................................................................................................................... 43
6.4.3 Model and Method ....................................................................................................................................... 45
6.4.4 Model Parameters ........................................................................................................................................ 47
6.4.5 Instrument Type Classification ..................................................................................................................... 48
6.4.6 Liquidity Horizon .......................................................................................................................................... 50
6.5 Technical Configurations .......................................................................................................................... 51
7 BUSINESS CONFIGURATIONS.................................................................................................................. 55
7.1 Overview .................................................................................................................................................. 55
7.2 Understanding Business Configuration Settings ...................................................................................... 55
7.3 Portfolio Definition .................................................................................................................................... 56
7.3.1 Defining a Portfolio ....................................................................................................................................... 56
7.3.2 Viewing a Portfolio ....................................................................................................................................... 59
7.3.3 Editing a Portfolio ......................................................................................................................................... 59
7.3.4 Copying a Portfolio ....................................................................................................................................... 60
7.4 Modellable and Non-Modellable Risk Factor ............................................................................................ 60
7.4.1 Defining Modellable and Non-Modellable Risk Factors ................................................................................. 60
7.5 Market Scenarios ..................................................................................................................................... 69

Oracle Financial Services Market Risk Measurement and Management User Guide
Release 8.0.6.0.0
vi
7.5.1 Configuring a Scenario ................................................................................................................................. 69
7.5.2 Shock Definition Parameters ........................................................................................................................ 71
7.5.3 Type of Shocks ............................................................................................................................................ 74
7.6 Hybrid Model ............................................................................................................................................ 75
7.6.1 Adding a Hybrid Model ................................................................................................................................. 75
8 INSTRUMENT VALUATION ....................................................................................................................... 79
8.1 Overview .................................................................................................................................................. 79
8.2 Creating and Executing a Business Definition ......................................................................................... 79
8.2.1 Defining a Business Approach ..................................................................................................................... 79
8.2.2 Defining a New Business Definition .............................................................................................................. 81
8.2.3 Procedure for Creating a Business Definition in Instrument Valuation .......................................................... 86
9 MARKET RISK – HISTORICAL SIMULATION .............................................................................................. 89
9.1 Overview .................................................................................................................................................. 89
9.2 Creating and Executing a Business Definition ......................................................................................... 89
9.2.1 Defining a Business Approach ..................................................................................................................... 89
9.2.2 Defining a New Business Definition .............................................................................................................. 90
9.2.3 Procedure for Creating a Business Definition in Market Risk Historical Simulation ....................................... 99
10 MARKET RISK- MONTE CARLO SIMULATION ......................................................................................... 103
10.1 Overview ................................................................................................................................................ 103
10.2 Creating and Executing a Business Definition ....................................................................................... 104
10.2.1 Defining a Business Approach ................................................................................................................... 104
10.2.2 Defining a New Business Definition ............................................................................................................ 105
10.2.3 Procedure for Creating a Business Definition in Market risk Monte-Carlo Simulation .................................. 109
11 MODEL VALIDATION............................................................................................................................. 113
11.1 Overview ................................................................................................................................................ 113
11.2 Creating and Executing a Business Definition ....................................................................................... 113
11.2.1 Defining a Business Approach ................................................................................................................... 113
11.2.2 Defining a New Business Definition ............................................................................................................ 114
11.2.3 Risk Theoretical and Hypothetical Definition............................................................................................... 115
11.2.4 Model Parameters ...................................................................................................................................... 116
11.2.5 Model Acceptance Criteria ......................................................................................................................... 117
11.2.6 Exception Probability and Multiplier ............................................................................................................ 118
11.2.7 Zone Classification ..................................................................................................................................... 120
11.2.8 Procedure for Creating a Business Definition in Model Validation ............................................................... 120
Oracle Financial Services Market Risk Measurement and Management User Guide
Release 8.0.6.0.0
vii
11.3 Model Performance Outputs .................................................................................................................. 123
12 ANNEXURE A: DETAILS OF MARKET DATA ........................................................................................... 126
13 ANNEXURE B: APPROVAL WORKFLOW ................................................................................................. 133
13.1 Overview ................................................................................................................................................ 133
13.2 Understanding Approval Work Flow ....................................................................................................... 133
14 ANNEXURE C: LIST OF INSTRUMENTS SUPPORTED BY OFS MRMM ...................................................... 136
14.1 List of Instruments Supported by MRMM ............................................................................................... 136
14.2 List of Instruments Supported for Monte Carlo ....................................................................................... 138
15 ANNEXURE D: LIST OF MODELS AND METHODS .................................................................................... 140
16 ANNEXURE E: MR REPORTS ................................................................................................................ 148
17 ANNEXURE F: DATA EXPECTATION ...................................................................................................... 149

Oracle Financial Services Market Risk Measurement and Management User Guide
Release 8.0.6.0.0
viii
TTAABBLLEE OOFF FFIIGGUURREESS
Figure 1 MRMM Process Flow .................................................................................................................... 18
Figure 2 OFSAAI Login Window ................................................................................................................. 21
Figure 3 OFSAAI Landing Page ................................................................................................................. 22
Figure 4 MRMM Landing Page ................................................................................................................... 23
Figure 5 MRMM Home Screen ................................................................................................................... 23
Figure 6 MRMM Business Process ............................................................................................................. 24
Figure 7 MRMM Common Screen Elements .............................................................................................. 25
Figure 8 Rate Management - Currencies Summary Screen ....................................................................... 28
Figure 9 Holiday Calendar-Excel Import/Export for Adding Calendar Definitions ...................................... 34
Figure 10 Holiday Calendar – Excel Import/Export for Adding Calendar Exceptions ................................. 36
Figure 11 Application Preferences .............................................................................................................. 37
Figure 12 Dimension Configuration ............................................................................................................ 38
Figure 13 Hierarchy Configuration .............................................................................................................. 40
Figure 14 Default Configurations - Currency .............................................................................................. 41
Figure 15 Default Configurations – Currency Pair ...................................................................................... 44
Figure 16 Default Configurations – Model and Method .............................................................................. 46
Figure 17 Default Configurations – Model Parameters ............................................................................... 47
Figure 18 Default Configurations – Instrument Type Classification ............................................................ 49
Figure 19 Default Liquidity Horizon Values as Specified in BCBS d352 .................................................... 50
Figure 20 Default Configurations - Liquidity Horizon .................................................................................. 51
Figure 21 Technical Configuration .............................................................................................................. 52
Figure 22 Business Configurations ............................................................................................................. 55
Figure 23 Business Configurations – Portfolio Definition Summary Screen ............................................... 56
Figure 24 Business Configurations – Portfolio Definition Based on Instruments ....................................... 58
Figure 25 Business Configurations – Portfolio Definition Based on Hierarchy ........................................... 59
Figure 26 Portfolio Definition – Copying a Portfolio .................................................................................... 60
Figure 27 Modellable and Non-Modellable Risk Factor Identification Summary Screen ........................... 61
Figure 28 Modellable and Non-Modellable Risk Factor Identification- Setting Rules ................................. 66
Figure 29 Modellable and Non-Modellable Risk Factor Identification- Adding Attributes ........................... 67
Figure 30 Modellable and Non-Modellable Risk Factor Identification – Adding Dimensions to Attributes . 68
Figure 31 Market Scenario – Scenario Definition Summary Screen .......................................................... 69
Figure 32 Scenario Definition Screen ......................................................................................................... 70

Oracle Financial Services Market Risk Measurement and Management User Guide
Release 8.0.6.0.0
ix
Figure 33 Hybrid Model Definition Screen .................................................................................................. 77
Figure 34 Instrument Valuation Summary Screen ...................................................................................... 80
Figure 35 Instrument Valuation – New Business Approach ....................................................................... 80
Figure 36 Instrument Valuation – Business Definition Screen .................................................................... 82
Figure 37 Instrument Valuation – Execution Summary .............................................................................. 82
Figure 38 Instrument Valuation – Pricing policy Download ........................................................................ 83
Figure 39 Instrument Valuation – Defining a Pricing Policy ........................................................................ 84
Figure 40 Instrument Valuation- Defining a Pricing Policy .......................................................................... 85
Figure 41 Instrument Valuation - Scenario ................................................................................................. 85
Figure 42 Instrument Valuation – Adding the Baseline Scenario ............................................................... 86
Figure 43 Market Risk – Historical Simulation Summary Screen ............................................................... 90
Figure 44 Market Risk Historical Simulation – Business Definition Screen ................................................ 90
Figure 45 Historical Simulation – Execution Summary ............................................................................... 91
Figure 46 Risk Factor Reduced Set Identification - Download ................................................................... 91
Figure 47 Risk Factor Reduced Set Identification - Define ......................................................................... 92
Figure 48 Defining Risk Factor Reduced Set.............................................................................................. 92
Figure 49 Stress Period Identification ......................................................................................................... 94
Figure 50 VaR Model Parameters .............................................................................................................. 95
Figure 51 Analyze By .................................................................................................................................. 96
Figure 52 Output Metrics ............................................................................................................................. 97
Figure 53 Market Risk Historical Simulation – New Business Definition .................................................. 100
Figure 54 Market Risk – Monte Carlo Simulation Summary Screen ........................................................ 104
Figure 55 Market Risk Monte Carlo Simulation – Business Definition Screen ......................................... 105
Figure 56 Monte Carlo Simulation – Execution Summary ........................................................................ 106
Figure 57 Monte Carlo Simulation – Purpose ........................................................................................... 106
Figure 58 Monte Carlo Simulation – Model Parameter Definition............................................................. 107
Figure 59 Monte Carlo Simulation – Optional Outputs ............................................................................. 108
Figure 60 Monte Carlo Simulation – Configurations ................................................................................. 108
Figure 61 Market Risk Monte Carlo Simulation – New Business Definition ............................................. 110
Figure 62 Model Validation Summary Screen .......................................................................................... 113
Figure 63 Model Validation – Business Definition Screen ........................................................................ 114
Figure 64 Model Validation – Execution Summary ................................................................................... 115
Figure 65 Risk Theoretical and Hypothetical Definition ............................................................................ 115
Figure 66 Model Parameters..................................................................................................................... 116
Figure 67 Model Acceptance Criteria ........................................................................................................ 117

Oracle Financial Services Market Risk Measurement and Management User Guide
Release 8.0.6.0.0
x
Figure 68 Exception Probability and Multiplier .......................................................................................... 118
Figure 69 Adding Exception Probability and Multiplier ............................................................................. 119
Figure 70 Zone Classification ................................................................................................................... 120
Figure 71 Business Definition – Model Validation .................................................................................... 121
Figure 72 Approval Workflow .................................................................................................................... 133
Oracle Financial Services Market Risk Measurement and Management User Guide
Release 8.0.6.0.0
xi
TTAABBLLEE OOFF TTAABBLLEESS
Table 1 OFSAAI Landing Page ................................................................................................................... 22
Table 2 Fields and their Descriptions in Dimension Configuration ............................................................. 39
Table 3 Fields and their Descriptions in Hierarchy Configuration ............................................................... 40
Table 4 Fields and their Descriptions in Currency Window ........................................................................ 43
Table 5 Fields and their Descriptions in Currency Pair Window ................................................................. 45
Table 6 Fields and their Descriptions in Model and Method Window ......................................................... 46
Table 7 Fields and their Descriptions in Model Parameters Window ......................................................... 48
Table 8 Fields and their Descriptions in Instrument Type Classification Window ...................................... 49
Table 9 Fields and their Descriptions in Instrument Type Classification Window ...................................... 53
Table 10 Fields and their Descriptions in Portfolio Definition Window ....................................................... 57
Table 11 Fields and their Descriptions in Scenario Definition window ....................................................... 70
Table 12 Shock Attributes ........................................................................................................................... 74
Table 13 Fields and their Descriptions in Hybrid Model Window................................................................ 76
Table 14 Fields and their Descriptions in New Business Approach Window ............................................. 81
Table 15 Fields and their Descriptions in Instrument Valuation-Business Definition Window .................... 87
Table 16 Fields and their Descriptions in Historical Simulation-Business Definition Window .................. 101
Table 17 Fields and their Descriptions in Historical Simulation-Business Definition Window .................. 111
Table 18 Fields and their Descriptions in Model Validation-Business Definition Window ........................ 122
Table 19 Expected Logical Quote Structure for Market Data ................................................................... 132
Table 20 Logical Quote Structure for Fixing Data ..................................................................................... 132
Table 21 List of Instruments Supported By MRMM .................................................................................. 137
Table 22 List of Instruments Supported By MRMM for Monte-Carlo Simulation ...................................... 139
Table 23 List of Models and Methods ....................................................................................................... 147

Oracle Financial Services Market Risk Measurement and Management User Guide
Release 8.0.6.0.0
xii
DDOOCCUUMMEENNTT CCOONNTTRROOLL
Version Number Revision Date Changes Done
1.0 Created August 2018 Captured updates for 8.0.6.0.0 release
This document provides a comprehensive knowledge about the user interface and functionalities
in Oracle Financial Services Market Risk Measurement and Management, Release 8.0.6.0.0. The
latest copy of this guide can be accessed from OHC Documentation Library.

Oracle Financial Services Market Risk Measurement and Management User Guide
Release 8.0.6.0.0
xiii
AABBOOUUTT TTHHEE GGUUIIDDEE
This section provides a brief description of the scope, intended audience, related information
sources, the organization of the user guide, and abbreviations used in the user guide. The topics
in this section are organized as below:
Scope of the guide
Intended Audience
Documentation Accessibility
Access to Oracle Support
Related Information Sources
How This Guide is Organized
Abbreviations Used
SSCCOOPPEE OOFF TTHHEE GGUUIIDDEE
Oracle Financial Services Market Risk Measurement and Management User Guide, Release
8.0.6.0.0, contains all the essential information required by a user to understand and make use of
the functionalities in the application. It includes description of the system functions and
capabilities, and details the step-by-step process for system access and use.
IINNTTEENNDDEEDD AAUUDDIIEENNCCEE
Welcome to release 8.0.6.0.0 of the Oracle Financial Services Market Risk Measurement and
Management Analytics User Guide. This manual is intended for the following audience:
Trading Desk Manager: Monitors the performance of the investment and trading portfolios
of a trading desk using varied tools.
Business Analysts: Reviews the functional requirements and information sources, such as
reports.
Manager-Finance and Manager-Risk: Analyzes and evaluates output metrics, which will
help to restructure the portfolio in accordance to business needs.
Administrator: Manages system access, data load process, and setup data.
DDOOCCUUMMEENNTTAATTIIOONN AACCCCEESSSSIIBBIILLIITTYY
For information about Oracle's commitment to accessibility, visit the Oracle Accessibility Program
website at http://www.oracle.com/pls/topic/lookup?ctx=acc&id=docacc.
AACCCCEESSSS TTOO OORRAACCLLEE SSUUPPPPOORRTT

Oracle Financial Services Market Risk Measurement and Management User Guide
Release 8.0.6.0.0
xiv
Oracle customers have access to electronic support through My Oracle Support. For information,
visit http://www.oracle.com/pls/topic/lookup?ctx=acc&id=info or visit
http://www.oracle.com/pls/topic/lookup?ctx=acc&id=trs if you are hearing impaired.
RREELLAATTEEDD IINNFFOORRMMAATTIIOONN SSOOUURRCCEESS
You can access the below documents online from the Oracle Help Center (OHC) documentation
Library for OFS MRMM 8.0.6:
Oracle Financial Services Market Risk Measurement and Management Release Notes.
Release 8.0.6.0.0
Oracle Financial Services Market Risk Measurement and Management Installation Guide,
Release 8.0.6.0.0
Oracle Financial Services Market Risk Measurement and Management Analytics User
Guide, Release 8.0.6.0.0
You can access the OFS AAI documentation online from the documentation library for OFS AAAI
8.x:
OFS Advanced Analytical Applications Infrastructure (OFS AAAI) Application Pack
Installation and Configuration Guide
OFS Analytical Applications Infrastructure User Guide
The additional documents are:
OFS Analytical Applications Infrastructure Security Guide
OFSAAI FAQ Document
OFS Analytical Applications 8.0.6.0.0 Technology Matrix
HHOOWW TTHHIISS GGUUIIDDEE IISS OORRGGAANNIIZZEEDD
This guide includes the following chapters:
Introduction to Oracle Financial Services Market Risk Measurement and Management
Getting Started with OFS MRMM
Overview of OFSAA Infrastructure Components
OFSAA Rate Management – Currencies
Holiday Calendar
Application Preferences
Business Configurations
Instrument Valuation

Oracle Financial Services Market Risk Measurement and Management User Guide
Release 8.0.6.0.0
xv
Market Risk – Historical Simulation
Market Risk-Monte-Carlo Simulation
Model Validation
Annexure A: Details of Market Data
Annexure B: Approval Workflow
Annexure C: List of Instruments
Annexure D: List of Models and Methods
Annexure E: List of MR Reports
Annexure F: Data Expectation
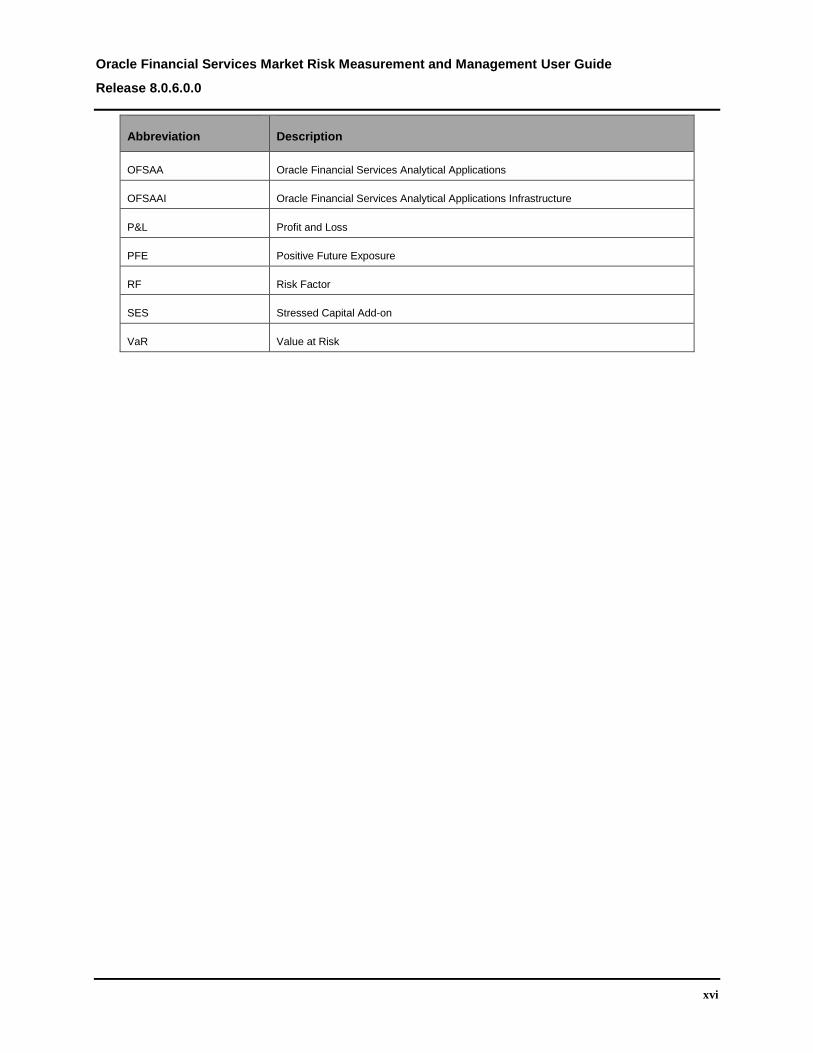
AABBBBRREEVVIIAATTIIOONNSS
Abbreviation Description
CAS Cross Asset Server
CVA Credit Valuation Adjustment
DM Data Model
DRC Default Risk Charge
DVA Debit Valuation Adjustment
EE Expected Exposure
ENE Expected Negative Exposure
EOD End of Day
EPE Expected Positive Exposure
ES Expected Shortfall
FRTB Fundamental Review of Trading Book
FVA Funding Valuation Adjustment
IMA Internal Models Approach
IMCC Internally Modelled Capital Charge
MRF Modellable Risk Factor
MRMM Market Risk Measurement and Management
NMRF Non-Modellable Risk Factor
Oracle Financial Services Market Risk Measurement and Management User Guide
Release 8.0.6.0.0
xvi
Abbreviation Description
OFSAA Oracle Financial Services Analytical Applications
OFSAAI Oracle Financial Services Analytical Applications Infrastructure
P&L Profit and Loss
PFE Positive Future Exposure
RF Risk Factor
SES Stressed Capital Add-on
VaR Value at Risk

Oracle Financial Services Market Risk Measurement and Management User Guide
Release 8.0.6.0.0
17
11 IInnttrroodduuccttiioonn ttoo OOrraaccllee FFiinnaanncciiaall SSeerrvviicceess MMaarrkkeett RRiisskk
MMeeaassuurreemmeenntt aanndd MMaannaaggeemmeenntt
This chapter provides an introduction to the Oracle Financial Services Market Risk Measurement
and Management (OFS MRMM) application. This chapter includes:
Overview of OFS MRMM
Process Flow
Components of OFS MRMM
11..11 OOvveerrvviieeww ooff OOFFSS MMRRMMMM
Market Risk is the risk of losses, in on-balance sheet, and off-balance sheet positions arising from
changes to factors, such as interest rates, currency exchange rates, equity prices, inflation, and
so on. Banks and financial institutions must manage market risk from both, regulatory and non-
regulatory perspectives. From a regulatory perspective, market risk stems from all the positions
included in the banks trading book and from commodity, foreign exchange risk positions in the
whole balance sheet.
OFS MRMM enables banks to accurately measure, evaluate, monitor and manage market risk.
Additionally, it enables banks to proactively comply with the regulatory requirements of capital
calculation as per the Internal Models Approach (IMA). This solution combines, OFSAA’s deep
expertise with the Numerix analytics (Numerix Cross Asset Server and Numerix Oneview
Enterprise Platform), to ensure that all the critical elements of a market risk program from pricing,
valuations, risk assessment, monitoring and management, stress testing to data governance,
data storage, and final regulatory submissions are fully addressed.
OFS MRMM enables banks and financial institutions to comply with the latest market risk capital
regulations, such as Fundamental Review of Trading Book (FRTB). MRMM uses Numerix Cross
Asset Server 4.1.0 and Numerix Oneview Enterprise Platform 1.5. It includes the models and
methods to price instruments, derive historical Value-at-Risk (VaR) and Counterparty Credit Risk
measurements.
OFS MRMM includes the following integrated components:
Instrument Valuation
Market Risk - Historical Simulation
Market Risk- Monte Carlo Simulation
Model Validation

Oracle Financial Services Market Risk Measurement and Management User Guide
Release 8.0.6.0.0
18
11..22 PPrroocceessss FFllooww
The process flow of OFS MRMM solution is as follows.
Figure 1 MRMM Process Flow
The process flow is explained below.
1. Input Data Requirement: The following types of data are expected as input to the solution:
Trade Data: This is data of on and off balance sheet positions, settled and unsettled
trades/deals belonging to trading book that you want to price and calculate risk
measures. For example: data of bonds in which investment has been made, or swap
transactions entered with the counterparty.
Reference Data: These are dimensions and attributes that describe the trade data.
These are used to define business rules, and view reports. For example: Product, Legal
Entity, Currency, Netting Agreement, and Credit Support Annex.
Market Data: These are price quotes, yield curves, volatility surface and other forms for
financial market data which are supplied by designated agencies such as Bloomberg,
Reuters, and various exchanges, or market makers. For example: Interest Rate Curve,
Equity prices, Foreign Exchange spot and forward rates and so on.
2. User Configurations (Processing): To process the above data and achieve desired results,
such as price of a trade or capital requirement for trading book, you need to perform the
system configurations, explained below:
Application preferences
Dimension and Hierarchy configuration: In this section, select the dimension that
must be available for further configurations in MRMM, and specify the hierarchy for
each selected dimension. The hierarchy must be pre-defined in Dimension

Oracle Financial Services Market Risk Measurement and Management User Guide
Release 8.0.6.0.0
19
Management. See Dimension Management section in OFS Advanced Analytics
Infrastructure User Guide on OHC Documentation Library for details.
Default Settings: In this section you need to define the default values used by
various components of MRMM. It includes:
Currency
Currency Pair
Model and Method
Model Parameters
Instrument Type Classification
Liquidity Horizon
Technical Configuration: In this section you need to define values such as
memory strategy, log level and so on, that are used by the application during
various processes.
Business Configuration: In this section you need to define the portfolios, configure
rules for identification of modellable and non-modellable risk factors, and create market
scenarios and hybrid models for use in counterparty credit risk calculations. It includes:
Portfolio Definition
Modellable and Non-Modellable Risk Factor Identification
Market Scenarios
Hybrid Model
Business Processes: In this section you need to perform valuation of instruments and
positions in a trading book, measure the risk of your portfolio or trading desk using
historical simulation, and validate the models. It includes:
Instrument Valuation
Market Risk – Historical Simulation
Market Risk – Monte Carlo Simulation
Model Validation
Output: MRMM solution has predefined reports to view and analyze data and results.
The reports are presented in multiple dashboards which can be modified as per the
specific requirements.
11..33 CCoommppoonneennttss ooff OOFFSS MMaarrkkeett RRiisskk MMeeaassuurreemmeenntt aanndd MMaannaaggeemmeenntt
This section provides an overview of the functionalities available in various components of
MRMM application:

Oracle Financial Services Market Risk Measurement and Management User Guide
Release 8.0.6.0.0
20
Instrument Valuation
This component delivers the following functionalities:
Pricing of each trade in a portfolio or part of a trading desk
Calculation of Greeks for instruments
Computation of sensitivities (such as Delta, Vega) as per the regulatory requirements
for the FRTB standardized approach
See Instrument Valuation for details.
Market Risk – Historical Simulation
This component delivers the following functionalities:
Risk factor reduced set identification
Stress period identification, as per the regulatory requirements for FRTB IMA
Historical VaR and Expected Shortfall (ES) from a non-regulatory perspective
Stress calibrated ES, as per the regulatory requirements for FRTB IMA
Stressed capital add-on and Internal Modeled Capital Charge (IMCC), as per regulatory
requirements for FRTB IMA
See Market Risk – Historical Simulation for details.
Market Risk – Monte Carlo Simulation
This component delivers the following functionalities:
Credit Value Adjustment (CVA) measures
Potential Future Exposure (PFE) measures
Monte Carlo VaR
See Market Risk – Monte Carlo Simulation for details.
Model Validation
This component delivers the following functionalities:
VaR model backtesting
Actual, hypothetical and risk-theoretical Profit and Loss (P&L) calculation
Backtesting and P&L attribution test, as per requirements for FRTB IMA
R-Y-G zone classification, as per requirements for FRTB IMA
See Model Validation for details.

Oracle Financial Services Market Risk Measurement and Management User Guide
Release 8.0.6.0.0
21
22 GGeettttiinngg SSttaarrtteedd wwiitthh OOFFSS MMRRMMMM
This chapter details how to get started with the OFS MRMM application, and explains the
common features available across the components in the user interface. It describes the
organization of the user interface, and provides step-by-step instructions for navigating through
the application. To avoid repetition, the common functionalities used in different modules of OFS
MRMM application are explained under the Common User Interface Functionalities section. For
example, common user interface functionalities in Portfolio Definition.
This chapter includes:
Logging in to OFS MRMM Application
Managing OFS MRMM
Common User Interface Functionalities
22..11 LLooggggiinngg iinn ttoo OOFFSS MMRRMMMM AApppplliiccaattiioonn
Access the OFS MRMM application using the login credentials (User ID and Password) provided
and select the preferred language to navigate. The built-in security system ensures that you are
only permitted to access the window and actions based on the authorization.
Figure 2 OFSAAI Login Window

Oracle Financial Services Market Risk Measurement and Management User Guide
Release 8.0.6.0.0
22
After logging in to OFSAAI, the below home screen is displayed.
Figure 3 OFSAAI Landing Page
Tag Description
MRMMUSER (username) Click this drop-down to select the options: Preferences, About,
Change Password or Logout.
Click the icon and select Financial Services Market Risk Measurement
and Management where the MRMM Application is installed.
Click this drop-down to select the desired language.
Click this icon to view the Administration related tools such as Process
Modelling Framework.
Click this icon to view details of the last login and last failed login.
Object Administration
Object Administration is an integral part of the infrastructure, and
facilitates system administrators to define the security framework. For
more information, see OFS Analytical Applications Infrastructure User
Guide on OHC
Common Object Maintenance
Common Object Maintenance is an integral part of the Infrastructure
system, and facilitates system administrators to define the security
framework with the capacity to restrict access to the data and
metadata in the warehouse, based on a flexible, fine-grained access
control mechanism. For more information, see OFS Analytical
Applications Infrastructure User Guide on OHC.
Processing Modelling Framework
This module facilitates built-in tooling for orchestration of human and
automatic workflow interfaces. For more information, see OFS
Analytical Applications Infrastructure User Guide on OHC.
Table 1 OFSAAI Landing Page

Oracle Financial Services Market Risk Measurement and Management User Guide
Release 8.0.6.0.0
23
Select Market Risk Measurement and Management in the Left Hand Side (LHS) pane. The
Market Risk Measurement and Management landing page is displayed.
Figure 4 MRMM Landing Page
22..22 MMaannaaggiinngg OOFFSS MMRRMMMM
This section describes how to manage the OFS MRMM application for users across all modules
of the application. Some of the functionalities can be specific to the rights owned by the user.
In the MRMM landing page, click the Market Risk Measurement and Management Application
link to view the MRMM home screen. Click the Username drop-down on the top Right Hand Side
(RHS) corner to select the options such as Preferences, About, Change Password or Logout.
Figure 5 MRMM Home Screen
NOTE: For ease of navigation, click the Application Navigation icon.
Oracle Financial Services Market Risk Measurement and Management User Guide
Release 8.0.6.0.0
24
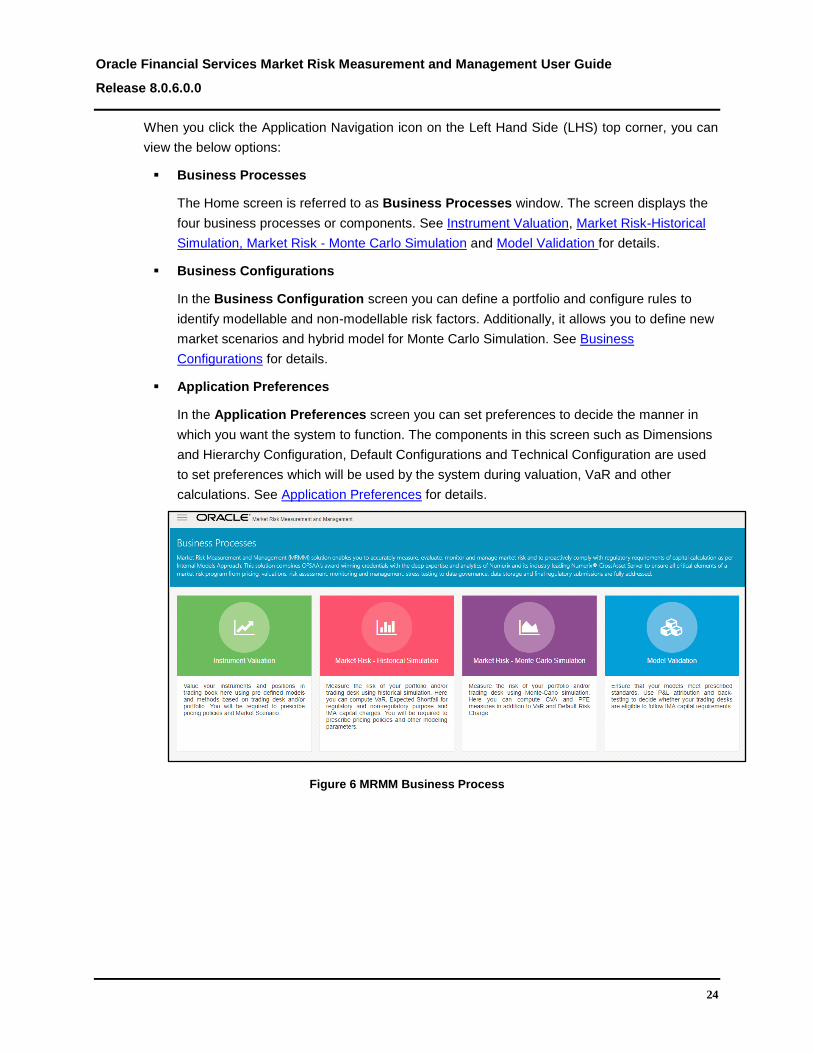
When you click the Application Navigation icon on the Left Hand Side (LHS) top corner, you can
view the below options:
Business Processes
The Home screen is referred to as Business Processes window. The screen displays the
four business processes or components. See Instrument Valuation, Market Risk-Historical
Simulation, Market Risk - Monte Carlo Simulation and Model Validation for details.
Business Configurations
In the Business Configuration screen you can define a portfolio and configure rules to
identify modellable and non-modellable risk factors. Additionally, it allows you to define new
market scenarios and hybrid model for Monte Carlo Simulation. See Business
Configurations for details.
Application Preferences
In the Application Preferences screen you can set preferences to decide the manner in
which you want the system to function. The components in this screen such as Dimensions
and Hierarchy Configuration, Default Configurations and Technical Configuration are used
to set preferences which will be used by the system during valuation, VaR and other
calculations. See Application Preferences for details.
Figure 6 MRMM Business Process

Oracle Financial Services Market Risk Measurement and Management User Guide
Release 8.0.6.0.0
25
22..33 CCoommmmoonn UUsseerr IInntteerrffaaccee FFuunnccttiioonnaalliittiieess
This section details the common functionalities available across all modules of OFS MRMM such
as creating, deleting, sorting, and searching a MRMM object. The following sections explain the
procedures, taking the example of the Portfolio Definition screen.
Figure 7 MRMM Common Screen Elements
22..33..11 SSeeaarrcchh
The Search option in the user interface enables you to find the required information. You can
enter the nearest matching keywords to search, and filter the results by entering information on
the additional fields. Search values are not case sensitive.
22..33..22 FFoollddeerr
This option enables you to select the folder where the portfolio is to be defined.
22..33..33 SSoorrttiinngg OObbjjeeccttss
This option enables you to sort the portfolios based on the Name (in ascending or descending
alphabetical order).
22..33..44 NNeeww
This option enables you to navigate to the Portfolio Definition screen.
22..33..55 DDeelleettiinngg aann OObbjjeecctt
To delete an existing Portfolio:
1. Select a portfolio and click Delete. Alternatively, you can select multiple Portfolios by
using Shift + click/ Ctrl + click, and click Delete on the top right hand corner. A
confirmation dialogue appears.
2. Click Yes. The Portfolio details are deleted.
NOTE: Definition can be deleted only if it is not used in any MRMM object.
22..33..66 CChhaannggiinngg tthhee LLaayyoouutt
The application supports Grid View and List View layouts. You can change the layout by clicking
the icon at the right hand corner of the screen.

Oracle Financial Services Market Risk Measurement and Management User Guide
Release 8.0.6.0.0
26
22..33..77 EExxppoorrttiinngg aa PPoorrttffoolliioo
You can export the listed records to a Microsoft Excel Spreadsheet (XLS), from the summary
page. If any search criteria is applied, the values exported are restricted only to the search result.
To export the records:
1. Navigate to the summary page.
2. Click Export, and select the required option from the drop down menu. The application
supports export to Excel.
3. Specify the location for saving the exported file. You can view the file offline from the
folder.

Oracle Financial Services Market Risk Measurement and Management User Guide
Release 8.0.6.0.0
27
33 OOvveerrvviieeww ooff OOFFSSAAAA IInnffrraassttrruuccttuurree CCoommppoonneennttss
OFS MRMM uses the following components and frameworks of OFSAA infrastructure. You can
access these components under Common Object Maintenance in the OFSAAI landing page.
See OFS Analytical Applications Infrastructure User Guide in OHC Documentation Library for
features and details.
Data Model Maintenance: OFS MRMM uses the Data Model Maintenance module of
OFSAA. You can upload the data model using this component.
Data Management: Data Management tools such as Data Sources, Data Mapping, Data
File Mapping, and Post Load Changes. Data Quality Rules and Data Quality Groups in the
OFSAA Data Quality Framework. OFS MRMM uses Excel Upload (Atomic), Forms
Designer, Forms Authorization, Data Entry from the Data Entry Forms and Queries module
of OFSAA.
Unified Analytical Metadata: OFS MRMM uses Dimension Management (Member,
Attribute and Hierarchy Management) from the Unified Analytical Metadata module of
OFSAA.
Rate Management: See OFSAA Rate Management – Currencies, for details.
Holiday Calendar: See Holiday Calendar, for details.
Operations: OFS MRMM uses Batch Maintenance, Batch Execution, Batch Monitor, Batch
Cancellation, Batch Scheduler, and View Log from Operations module of OFSAA.
Process Modeling Framework: OFS MRMM uses the Process Modeling Framework
module of OFSAA.
Rule Run Framework: Process Modeling Framework internally uses Process and Run
from the OFSAA Run Rule Framework.

Oracle Financial Services Market Risk Measurement and Management User Guide
Release 8.0.6.0.0
28
44 OOFFSSAAAA RRaattee MMaannaaggeemmeenntt –– CCuurrrreenncciieess
44..11 CCuurrrreenncciieess
Financial institutions commonly transact business in more than one currency. Transacting
business in multiple currencies demands functional capabilities for multi-currency accounting and
currency rate management.
OFSAA Rate Management's Currency module supports the definitions and maintenance of
currencies. Currency definitions are fundamental to the definition of both interest rate yield curves
and currency exchange rates. A key attribute of every yield curve is the currency with which it is
associated; and currency exchange rates can only be established between defined currencies.
OFSAA Rate Management provides a comprehensive list of ISO-defined currencies; you may
also define and add your own user-defined currencies.
Upon initially navigating to Common Object Maintenance > Rate Management > Currencies, a
summary screen displays a comprehensive list of more than 170 seeded ISO currency codes.
Figure 8 Rate Management - Currencies Summary Screen
44..11..11 SSeeaarrcchh CCoonnttaaiinneerr
A Search container is provided, in which you may search for currencies by Name, by Currency
(by ISO currency code), by status or by reporting currency.
44..11..11..11 SSeeaarrcchh CCoonnttrrooll
Enter your desired search criteria and click on the Search control.
44..11..11..22 RReesseett CCoonnttrrooll
Clicking on the Reset control removes search constraint you may have specified and refreshes
the screen.

Oracle Financial Services Market Risk Measurement and Management User Guide
Release 8.0.6.0.0
29
44..11..22 CCuurrrreenncciieess CCoonnttaaiinneerr
The Currencies container presents a grid containing all of the currencies, which meet your search
criteria. The Currencies summary grid offers several controls, which allow you to perform different
functions when a currency is selected.
To select a currency, click on a check box in the first column of the grid. Multiple currencies can
be selected at a time. However, this disables some of the controls. Clicking on a check-box a
second time de-selects the currency.
You may select or deselect all of the currencies in the summary grid by clicking on the check box
in the upper left hand corner of the summary grid directly to the left of the Code column header.
44..11..22..11 AAdddd
Clicking on the Add control begins the process of adding a new currency. The Add control is
disabled if any rows in the grid have been selected.
44..11..22..22 EEddiitt
Selecting a single row out of the grid enables the Edit control. Clicking on the Edit control allows
you to modify an existing currency. The Edit control is only enabled when a single currency has
been selected.
NOTE: You can control the number of rows to display on screen by selecting the Pagination Options
icon from the action bar.
44..11..22..33 DDeelleettee
Selecting one or more rows out of the grid enables the Delete control. Clicking on the Delete
control deletes the currency or currencies you have selected.
44..11..33 CCuurrrreenncciieess SSuummmmaarryy GGrriidd
The following columns categorize each currency shown in the summary grid:
Code: For seeded currencies, these are ISO Currency Codes. For user-defined currencies,
these may be any pure character string (no numbers) up to a length of 3 characters.
Currency Name: For seeded currencies, these are ISO Currency Codes. For user-defined
currencies, these may be any string up to a length of 40 characters.
Reference Interest Rate Code: Reference Interest Rate Code is the Interest Rate Code
with which a currency is associated for forecasting purposes. You may define multiple yield
curves each of which has the same Reference Currency, but a currency may only have one
Reference Interest Rate Code.

Oracle Financial Services Market Risk Measurement and Management User Guide
Release 8.0.6.0.0
30
Reporting Currency: A reporting currency is an active currency to which balances in other
currencies may be consolidated in order to facilitate reporting. Balances in reporting
currencies may be, in turn, consolidated to the functional currency. For example, an
American multinational bank might consolidate its holdings in Asian currencies to the
Japanese yen (reporting currency) and its balances in European currencies to the Euro
(reporting currency) after which it might consolidate these reporting currencies to the U.S.
dollar (functional currency).
Status: The status of any currency may be either Active or Inactive. You must “activate” a
currency before you can configure default configurations for it in application preference. See
Default Configurations for details.
44..11..44 EEddiittiinngg CCuurrrreenncciieess
To edit a currency, select a currency and then click on the Edit control. You may not modify any
currency Code value. You may, however, modify Currency Name, the Reference Interest Rate
Code, the Reporting Currency value (limited to Yes or No), or the currency's Status (limited to
Active or Inactive). Once you have completed your edits, click Save.
44..11..55 AAddddiinngg CCuurrrreenncciieess
The first row in the Currencies container is an empty row that is ready for you to edit as a new
currency. You may select this empty row, click on the Edit control, and generate a new currency.
You may also generate a new currency by clicking on the Add control. This will generate another
empty row at the top of the Currencies container that is ready for you to edit.
44..11..66 DDeelleettiinngg CCuurrrreenncciieess
Click on one or more currencies, and then select the Delete control.

Oracle Financial Services Market Risk Measurement and Management User Guide
Release 8.0.6.0.0
31
55 HHoolliiddaayy CCaalleennddaarr
This chapter discusses the procedure for creating a Holiday Calendar and generating a list of
weekend and holiday dates. These dates are used during valuation of instruments.
This chapter includes:
Overview of Holiday Calendars
Searching for a Holiday Calendar
Creating a Holiday Calendar
Executing Holiday Calendar
Holiday Exceptions
Excel Import/ Export
55..11 OOvveerrvviieeww ooff HHoolliiddaayy CCaalleennddaarrss
A Holiday is a day designated as having special significance for which individuals, a government,
or some religious groups have deemed that observance is warranted, and thus no business is
carried on this day. The Holiday Calendar code can range from 1 to 99999.
The procedure for working with and managing a holiday calendar is similar to that of other
OFSAA business rules. It includes the following steps:
Searching for a Holiday Calendar.
Viewing and Updating a Holiday Calendar.
Copying a Holiday Calendar.
Deleting a Holiday Calendar.
Check Dependencies in the Holiday Calendar definitions.
Refresh the Holiday Calendar summary page.
55..11..11 SSeeaarrcchhiinngg ffoorr aa HHoolliiddaayy CCaalleennddaarr
Search for a Holiday Calendar to perform any of the following tasks:
View
Edit
Copy
Delete
Check Dependencies
Refresh
Oracle Financial Services Market Risk Measurement and Management User Guide
Release 8.0.6.0.0
32
55..11..11..11 PPrreerreeqquuiissiitteess
Predefined holiday calendar
55..11..11..22 PPrroocceedduurree
1. Navigate to the Holiday Calendar summary page. This page is the gateway to all
Holiday Calendars and related functionality. You can navigate to other pages relating to
Holiday Calendar from this page.
2. Enter the Search criteria.
Enter the name of the Holiday Calendar.
Click the Search icon.
Only holiday calendars that match the search criteria are displayed.
NOTE: You can control the number of rows to display on screen by selecting the "Pagination Options"
icon from the action bar.
55..11..22 CCrreeaattiinngg aa HHoolliiddaayy CCaalleennddaarr
You create holiday calendars to capture holidays for a given date range for any organization. It is
possible to create and use multiple holiday calendars.
55..11..22..11 PPrroocceedduurree
1. Navigate to the Holiday Calendar summary page.
2. Click Add Holiday Calendar.
3. The Holiday Calendar details page is displayed.
4. Enter a code value for the new holiday calendar.
Note:
The code, is a numeric identifier for the holiday calendar. The code value must be a
number between 1 and 99999. The code value you assign to the new holiday calendar
must be unique.
5. Enter the name and a brief description for the holiday calendar.
Note:
The name you assign to the holiday calendar must be unique. Name can hold a
maximum of 30 characters.
6. In the Holiday Properties grid, select not more than two weekend days. Then choose
the Holiday Period. The Holiday Period can be defined for a range of up to 40 years
Oracle Financial Services Market Risk Measurement and Management User Guide
Release 8.0.6.0.0
33
less than the current date and 40 years greater than the current date, totally spanning a
maximum of 80 years.
In the Holiday Details grid, define the Holiday details for the any period within the
holiday range defined in step 6. There are two types of holidays that can be defined:
Fixed and Moving.
A fixed holiday is one which is deemed as a holiday for every year in the holiday period,
for that particular day.
Example
25th December – Christmas, is a fixed holiday.
Note:
To define a fixed holiday, input the holiday date for the first occurrence in the date
range. For example, if your Date Range runs from 01-JAN-2000 to 31-DEC-2050, you
should input the fixed holiday, Christmas, as 25-DEC-2000. The holiday calendar
procedure will populate all subsequent 25-DEC entries in the holiday list table
(FSI_HOLIDAY_LIST). A HOLIDAY_TYPE code = 0 is a Fixed type holiday, code = 1 is
a Moving type holiday, and code = 2 is a weekend.
The holiday calendar procedure will also ensure that holiday and weekend entries are
not duplicated. For example, if weekends are defined as Saturday/Sunday and
Christmas falls on a weekend day, there will be only one entry in the FSI_
HOLIDAY_LIST table. The PREVIOUS_WORKINGDAY and NEXT_WORKINGDAY
fields designate the valid prior and following working days, respectively.
7. A moving holiday is one which is deemed as a holiday only for that particular date and
year, and not for every year in the holiday period. All occurrences of a moving holiday
must be input manually.
Once the holiday calendar definition is saved, its status in the summary page is marked
as defined.
8. A holiday calendar created can also be deleted. Select one or more rows of holiday
calendar definitions and click the Delete control.
55..11..22..22 EExxcceell IImmppoorrtt // EExxppoorrtt
Excel import/export functionality is used for adding/editing holiday calendar definitions.

Oracle Financial Services Market Risk Measurement and Management User Guide
Release 8.0.6.0.0
34
Figure 9 Holiday Calendar-Excel Import/Export for Adding Calendar Definitions
55..11..33 EExxeeccuuttiinngg aa HHoolliiddaayy CCaalleennddaarr
You execute a holiday calendar definition to generate calendar dates listing the various types of
holidays for a given holiday period.
55..11..33..11 PPrreerreeqquuiissiitteess
Predefined Rules
55..11..33..22 PPrroocceedduurree
1. Navigate to the Holiday Calendar summary page.
2. Search for a rule.
3. Select a Holiday Calendar, and click the Generate Calendar Dates icon to execute the
selected holiday calendar. Holiday list for holiday ID #1 generated successfully
message appears (where #1 is the holiday calendar code). The holiday list can be
confirmed by querying the FSI_HOLIDAY_LIST table.
4. The status of a holiday calendar where holiday dates have been generated displays as
“processed” in the status column in the summary page.
Note:
In case you do not want to Generate Calendar dates immediately, you can select that
particular holiday calendar anytime later from the summary page with its status defined,
and then click the Generate Calendar Dates icon to execute the selected holiday
calendar.
5. The generated holiday list is no longer valid if
There is a change in the definition of the holiday calendar.
Oracle Financial Services Market Risk Measurement and Management User Guide
Release 8.0.6.0.0
35
There is any update or modification to the Holiday Exceptions defined for that
holiday calendar.
In such a case, the user will get a message “This holiday calendar has been modified,
Please generate the holiday list again” and the holiday calendar state will be changed to
“Defined” until the holiday list is regenerated with new definition.
55..11..44 HHoolliiddaayy EExxcceeppttiioonnss
To specify holiday exceptions, follow the below steps:
1. You can specify exceptions to holidays. As a prerequisite, a holiday calendar should
have been properly defined and the status of the holiday calendar in the summary page
should be processed. Generating the holiday list will populate the holidays (weekends,
fixed and moving) along with the working days. Then the Show Exceptions button is
enabled in the detail page. Any changes in the holiday definition will disable the “Show
Exceptions” button. The user must generate the holiday list again to define or view the
exceptions.
2. Click Show Exceptions in the Holiday Exceptions grid. The Holiday Exceptions window
opens.
3. The search block in the Exceptions page has 6 fields: From (Year), To (year), Fixed
Holidays, Moving Holidays, Holiday Date and All Exceptions.
From and To - Denotes the range of years which is a subset out of the holiday list
generated, for which exceptions are required to be defined.
Fixed Holidays – You can filter the list of holidays by the type of Fixed Holidays.
Moving Holidays – You can filter the list of holidays by the type of Moving Holidays.
Holiday Date – For a particular known holiday date, exceptions can be defined.
All Exceptions - This checkbox when selected lists all the exceptions, if already
defined, for the holidays within the From, To Date range.
The search result gives the list of all holidays based on the selection of the above
search criteria fields.
4. In the Holiday Exceptions block, there are two types of exceptions that can be defined:
Not a holiday and Shift to.
Any holiday can be marked as not a holiday, in which case that day is removed from the
Holiday List. If the drop-down list in the exception type is selected as “Not a Holiday”,
then the “shift to” date picker field is disabled.
Spring earlier considered as a holiday in the holiday calendar can be marked as Not a
Holiday in the Exceptions Window. Further the user can write his comments or remarks
in the Notes Text Box next to the Exception Type drop-down list.

Oracle Financial Services Market Risk Measurement and Management User Guide
Release 8.0.6.0.0
36
Any holiday can be shifted to another day, in which case the earlier declared holiday is
removed from the Holiday List, while the shifted to day is included as a holiday.
55..11..55 EExxcceell IImmppoorrtt// EExxppoorrtt
Excel import/export functionality is used for adding/editing holiday exceptions.
Figure 10 Holiday Calendar – Excel Import/Export for Adding Calendar Exceptions
Oracle Financial Services Market Risk Measurement and Management User Guide
Release 8.0.6.0.0
37
66 AApppplliiccaattiioonn PPrreeffeerreenncceess
This chapter describes the application preferences in OFS MRMM and includes the following
topics.
Overview
Understanding Application Preferences
Dimension and Hierarchy Configuration
Default Configurations
Technical Configuration
66..11 OOvveerrvviieeww
The application preferences section allows to set your preferences for the OFS MRMM
application, which will be used for computing valuation, VaR and other measures. The MRMM
functional administrator can set the application preferences. Once set they are applicable at a
global level, and are applied to all users. Some of the preferences get overwritten by parameters
defined at other places, such as data and business processes.
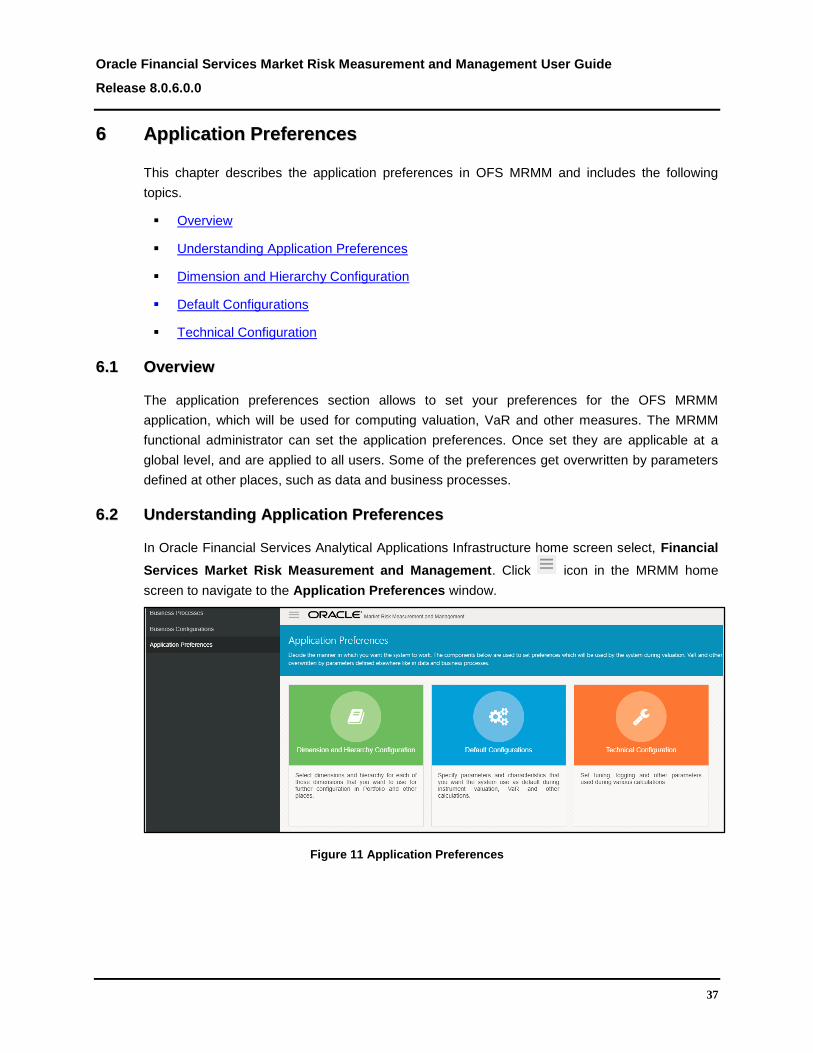
66..22 UUnnddeerrssttaannddiinngg AApppplliiccaattiioonn PPrreeffeerreenncceess
In Oracle Financial Services Analytical Applications Infrastructure home screen select, Financial
Services Market Risk Measurement and Management. Click icon in the MRMM home
screen to navigate to the Application Preferences window.
Figure 11 Application Preferences

Oracle Financial Services Market Risk Measurement and Management User Guide
Release 8.0.6.0.0
38
The Application Preferences section includes:
Dimension and Hierarchy Configuration
Default Configurations
Technical Configurations
66..33 DDiimmeennssiioonn aanndd HHiieerraarrcchhyy CCoonnffiigguurraattiioonn
You can select dimensions from the available list to create a portfolio and decide the aggregation
of results such as Value at Risk (VaR). For every selected dimension you must select a hierarchy
which will be used to select members to define a trading book portfolio. The dimensions are pre-
seeded with the application. You must create at least one hierarchy for all the dimensions that
you intend to use in portfolio definition. See OFS Analytical Applications Infrastructure User Guide
on OHC Documentation Library, for steps to create a hierarchy.
In this window you can perform the following actions:
Dimension Configuration: This window enables you to select one or multiple dimensions
from the available list of dimensions.
Hierarchy Configuration: This window enables you to update one hierarchy each for the
selected dimensions.
66..33..11 CCoonnffiigguurriinngg DDiimmeennssiioonnss
This section details the process of configuring dimensions.
Figure 12 Dimension Configuration

Oracle Financial Services Market Risk Measurement and Management User Guide
Release 8.0.6.0.0
39
The following table describes the fields in the Dimensions Configuration window:
Fields Description
Fields marked in red asterisk(*) are mandatory
Available Values Displays the list of available dimensions.
Selected Values Displays the list of selected dimensions.
Table 2 Fields and their Descriptions in Dimension Configuration
To select a dimension, follow the below steps:
1. In Oracle Financial Services Analytical Applications Infrastructure home screen select,
Market Risk Measurement and Management.
2. Click Market Risk Measurement and Management, in the MRMM landing page. The
MRMM home screen is displayed.
3. Click button in the MRMM home screen to navigate to the Application
Preferences window.
4. Click Dimension and Hierarchy Configuration.
5. To add the dimensions, select the dimension from the Available Values and add them
to the list of Selected Values by using button. To select multiple values use Ctrl
or Shift key. To select all the Available Values, use button. To remove any
selected value from the list use button. To remove all the selected values use
button.
6. Click Save to update the selected dimensions list. The selected dimensions are
populated in the Hierarchy Configuration window.

Oracle Financial Services Market Risk Measurement and Management User Guide
Release 8.0.6.0.0
40
66..33..22 CCoonnffiigguurriinngg HHiieerraarrcchhiieess
This section details the process of configuring hierarchies.
Figure 13 Hierarchy Configuration
The following table describes the fields in the Hierarchy Configuration window
Fields Description
Fields marked in red asterisk(*) are mandatory
Dimensions Displays name of the dimension selected in Dimension
Configuration
Folder Select the folder from the drop-down box where the
hierarchy has been defined
Hierarchies Select the Hierarchy
Table 3 Fields and their Descriptions in Hierarchy Configuration
To select a hierarchy, follow the below steps:
1. In the Hierarchy Configuration window, update the Folder and Hierarchies fields.
2. Click Save. The configured hierarchies will be used to define portfolios.
66..44 DDeeffaauulltt CCoonnffiigguurraattiioonnss
In this section you can specify the default parameters and characteristics to be used by the
application during valuation, VaR and other calculations. If the application fails to obtain values
from trade, instrument or other specific configurations, then it uses these default values. You can
configure the below settings in this window:
Currency
Currency Pair

Oracle Financial Services Market Risk Measurement and Management User Guide
Release 8.0.6.0.0
41
Model and Method
Model Parameters
Instrument Type Classification
Liquidity Horizon
66..44..11 CCuurrrreennccyy
In this window you can define the default values at the granularity of currency. If you do not define
the values at the instrument granularity, then the default values are used for processing. For each
active currency, you can specify characteristics, such as Rank, Interest Rate Index, Interest Rate
Tenor, Discount Curve, Dual Curve, Overnight Index, Holiday Calendar, Country, and Allowed
Yield Curves.
Figure 14 Default Configurations - Currency
The following table describes the fields in the Currency window:
Fields Description
Fields marked in red asterisk(*) are mandatory
Currency Name This field displays the list of all currencies which are
available in currency dimensions
Currency Code This field displays the code of the selected currency.
Rank Rank represents the contribution of currency in
global foreign exchange market turnover. Higher the
turnover, higher the rank of currency. For example:
USD is the most traded currency in world and is
assigned rank 1.

Oracle Financial Services Market Risk Measurement and Management User Guide
Release 8.0.6.0.0
42
Fields Description
Fields marked in red asterisk(*) are mandatory
Interest Rate Index Provide the default index rate associated with
currency such as LIBOR, Euribor and so on. It is the
standard interest rate index or yield curve which is
used for pricing of a trading book instrument. For
example: LIBOR for USD, MIBOR for INR
Interest Rate Tenor Select the default tenor for the given Interest Rate
Index, such as 3M, 6M and so on. It represents the
term point of the interest rate index mentioned
above. It is expressed as Tenor and unit of the term
period. For example: 3 months term point is
expressed as 3M.
Discount Curve
Select the default discounting curve associated with
the currency. It is the default interest rate index or
yield curve which is used to discount cash flows
during pricing of a trading book instrument. For
example: USD-LIBOR-3M
Dual curve
Specify True and False.
This field indicates whether two separate indexes are
used to construct a risk-free discount curve. For
example: In the US market, OIS swaps with tenor
greater than 2 years are not as liquid as Federal
funds/LIBOR basis swaps, which are called Feds.
Therefore, overnight index swaps are usually used to
construct the first two years of the risk-free discount
curve, while Fed funds/LIBOR basis swaps with
maturities of 3-30 years are used to build the longer
end of the curve.
Overnight Index
It is the interest rate index/curve that is designated
as overnight rate for the selected currency. For
example: SONIA for GBP and EONI for EUR.
Holiday Calendar
Specify the default holiday calendar to be used for
the corresponding currency. It indicates the default
calendar which will be used to price any instrument
denominated in the selected currency.
Country This indicates the country code of the currency.

Oracle Financial Services Market Risk Measurement and Management User Guide
Release 8.0.6.0.0
43
Fields Description
Fields marked in red asterisk(*) are mandatory
Allowed Yield Curve
This is the list of all interest rate curves which are
allowed to be used by the application. For a specific
currency, all the possible interest rate index or yield
curves that the application can use are stored here.
Table 4 Fields and their Descriptions in Currency Window
Follow the below procedure for defining the Currency:
1. In Oracle Financial Services Analytical Applications Infrastructure home screen select,
Market Risk Measurement and Management.
2. Click Market Risk Measurement and Management, in the MRMM landing page. The
MRMM Home screen is displayed.
3. Click in the MRMM home screen, to navigate to the Application Preferences
window.
4. Click Default Configurations > Currency.
5. Select the currency row that needs to be updated, and enter the details for Rank,
Interest Rate Index, Interest Rate Tenor, Discount Curve, Dual Curve, Overnight
Index, Holiday Calendar, Country and Allowed Yield Curve.
Note: Use ‘F2’ key, or click on any other row to come out of the edit mode in a table,
before updating or navigating to a different tab.
6. Click Update.
66..44..22 CCuurrrreennccyy PPaaiirr
The Currency Pair window enables you to provide default values at the granularity of currency
pair. This is used for pricing of cross-currency instruments. If you do not define the values at the
instrument granularity, then the default seeded values are used for processing.

Oracle Financial Services Market Risk Measurement and Management User Guide
Release 8.0.6.0.0
44
Figure 15 Default Configurations – Currency Pair
The following table describes the fields in the Currency Pair window:
Fields Description
Fields marked in red asterisk(*) are mandatory
Currency Pair Code A currency pair is the quotation and pricing structure
of the currencies traded in the market.
Base Currency The first listed currency in currency pair is called the
base currency.
Term Currency The second listed currency in currency pair is called
the term currency.
Base CC Basis Tenor
Specify the tenor of interest rate index of base
currency. This is represented as tenor and tenor unit.
For example: 3M
Term CC Basis Tenor
Tenor of interest rate index of term currency. This is
represented as tenor and tenor unit. For example:
3M
Inverse Price
This is an indicator field with values as TRUE or
FALSE. The value TRUE allows the usage of inverse
price of currency pair with preference to direct price,
FALSE will use only direct price.
CC Basis Curve
Select the default currency basis curve to be used for
corresponding currency pair. Example: AUD-LIBOR-
3M/USD-LIBOR-3M
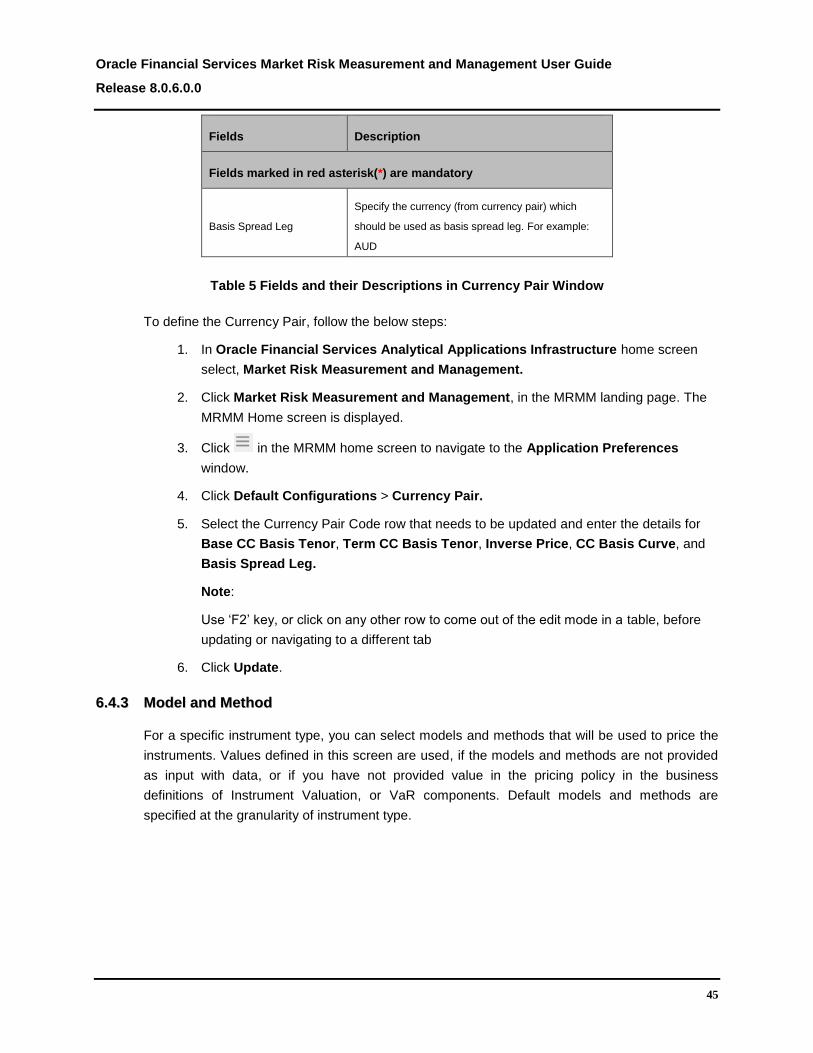
Oracle Financial Services Market Risk Measurement and Management User Guide
Release 8.0.6.0.0
45
Fields Description
Fields marked in red asterisk(*) are mandatory
Basis Spread Leg
Specify the currency (from currency pair) which
should be used as basis spread leg. For example:
AUD
Table 5 Fields and their Descriptions in Currency Pair Window
To define the Currency Pair, follow the below steps:
1. In Oracle Financial Services Analytical Applications Infrastructure home screen
select, Market Risk Measurement and Management.
2. Click Market Risk Measurement and Management, in the MRMM landing page. The
MRMM Home screen is displayed.
3. Click in the MRMM home screen to navigate to the Application Preferences
window.
4. Click Default Configurations > Currency Pair.
5. Select the Currency Pair Code row that needs to be updated and enter the details for
Base CC Basis Tenor, Term CC Basis Tenor, Inverse Price, CC Basis Curve, and
Basis Spread Leg.
Note:
Use ‘F2’ key, or click on any other row to come out of the edit mode in a table, before
updating or navigating to a different tab
6. Click Update.
66..44..33 MMooddeell aanndd MMeetthhoodd
For a specific instrument type, you can select models and methods that will be used to price the
instruments. Values defined in this screen are used, if the models and methods are not provided
as input with data, or if you have not provided value in the pricing policy in the business
definitions of Instrument Valuation, or VaR components. Default models and methods are
specified at the granularity of instrument type.

Oracle Financial Services Market Risk Measurement and Management User Guide
Release 8.0.6.0.0
46
Figure 16 Default Configurations – Model and Method
The following table describes the fields in the Model and Method window:
Fields Description
Fields marked in red asterisk(*) are mandatory
Asset Class
Displays the asset class (Interest Rate, Equity,
Commodity and so on) of instrument type for
which models and methods needs to be
defined.
Instrument Type Displays the instrument types.
Model Select the model to be used for the specific
instrument type from the drop-down list.
Method Select the method to be used for selected
model from the drop-down list.
Table 6 Fields and their Descriptions in Model and Method Window
To define the default model and methods, follow the below steps:
1. In Oracle Financial Services Analytical Applications Infrastructure home screen
select, Market Risk Measurement and Management.
2. Click Market Risk Measurement and Management, in the MRMM landing page. The
MRMM Home screen is displayed.

Oracle Financial Services Market Risk Measurement and Management User Guide
Release 8.0.6.0.0
47
3. Click in the MRMM home screen to navigate to the Application Preferences
window.
4. Click Default Configurations > Model and Method.
5. Select the instrument type row to be updated.
6. Select the Model and the Method from the drop-down box.
Note:
Use ‘F2’ key, or click on any other row to exit the edit mode in a table, before updating
or navigating to a different tab.
7. Click Update. Each instrument type is mapped to one of the asset class and its value is
displayed.
NOTE: Model and Methods to be selected for a specific instrument type is limited to the models that
are applicable to the corresponding asset class. See Annexure D: List of Models and Methods
for details.
66..44..44 MMooddeell PPaarraammeetteerrss
You can define parameters for models which are used for pricing and calibration. Default model
parameters are specified for each model used in the MRMM application.
The model table displays the asset classes and their corresponding model(s). Each model has a
specific list of inputs that are required. Input for each model is integrated with the instrument
parameters. For example, currency is integrated with market data used such as volatility
parameter for some of the instrument types. You can define the default value for such parameters
in this window. In a scenario where data for parameter is missing, the values assigned to the
model parameter is used, while pricing the instrument with corresponding model.
Figure 17 Default Configurations – Model Parameters

Oracle Financial Services Market Risk Measurement and Management User Guide
Release 8.0.6.0.0
48
The following table describes the fields in the Model Parameters window:
Fields Description
Fields marked in red asterisk(*) are mandatory
Asset Class Displays the type of asset for which model and
method needs to be defined.
Model Displays the model name.
Model Parameter Name Displays the model parameters associated with the
selected model.
Model Parameter Default
Value Specify a value for the model parameter.
Table 7 Fields and their Descriptions in Model Parameters Window
To define the default Model Parameter value, follow the below steps:
1. In Oracle Financial Services Analytical Applications Infrastructure home screen select,
Market Risk Measurement and Management.
2. Click Market Risk Measurement and Management, in the MRMM landing page. The
MRMM Home screen is displayed.
3. Click in the MRMM home screen to navigate to the Application Preferences
window.
4. Click Default Configurations > Model Parameters.
5. Select the model for which model parameter values needs to be updated. When you
select a model, then all the parameters associated with the model will be displayed in
the model parameter table on the Right Hand Side (RHS) of the window. Enter the
default model parameter value against each model parameter. In this table you can
either provide any default value, or leave it blank.
6. Click Update. The updated values are displayed.
66..44..55 IInnssttrruummeenntt TTyyppee CCllaassssiiffiiccaattiioonn
The configuration and processing in OFS Market Risk Measurement and Management, is
primarily based on the instrument type. The list of instrument types and their names generally
differ for each financial institution. The table in Instrument Type Classification window allows
you to map the instrument type as per the financial institution, and the standard instrument type
names used in MRMM application.

Oracle Financial Services Market Risk Measurement and Management User Guide
Release 8.0.6.0.0
49
Figure 18 Default Configurations – Instrument Type Classification
The following table describes the fields in the Instrument Type Classification window:
Fields Description
Fields marked in red asterisk(*) are mandatory
Bank Instrument Type It is the instrument type name as specified in
instrument type dimension.
Standard Instrument Type
It is the instrument type name as used by
MRMM application.
Select the Standard Instrument Type from the
drop-down box.
Table 8 Fields and their Descriptions in Instrument Type Classification Window
To select the standard instrument type for a specific bank instrument, follow the below steps:
1. In Oracle Financial Services Analytical Applications Infrastructure home screen select,
Market Risk Measurement and Management.
2. Click Market Risk Measurement and Management, in the MRMM landing page. The
MRMM Home screen is displayed.
3. Click in the MRMM home screen to navigate to the Application Preferences
window.
4. Click Default Configurations > Instrument Type Classification.
5. Click any Bank Instrument Type. Select the Standard Instrument Type from the
drop-down list on the RHS column.

Oracle Financial Services Market Risk Measurement and Management User Guide
Release 8.0.6.0.0
50
Note:
Use ‘F2’ key, or click on any other row to exit the edit mode in a table, before updating
or navigating to a different tab.
6. Click Update. The mapping is saved.
66..44..66 LLiiqquuiiddiittyy HHoorriizzoonn
OFS MRMM application incorporates the risk of market liquidity, by varying the liquidity horizons
for calculating regulatory Expected Shortfall. This enables to mitigate the risk of a sudden, and
severe impairment of market liquidity across asset markets. Liquidity horizon for each risk factor
category is specified through the MRMM User Interface (UI) either at a global level, or individually
for each trading desk and portfolio. The default values applied by the application are as per Basel
regulation (Reference: BCBS document d352).
Liquidity Horizon screen provides a mapping between the risk factor category and the values
associated with each category. The table below lists the default liquidity horizon values as per
Basel regulation (Reference: BCBS document d352).
.
Figure 19 Default Liquidity Horizon Values as Specified in BCBS d352
Liquidity horizon can be defined for each portfolio and trading desk individually.
To assign a risk factor value to each risk factor category, follow the below steps:
1. In Oracle Financial Services Analytical Applications Infrastructure home screen select,
Market Risk Measurement and Management.

Oracle Financial Services Market Risk Measurement and Management User Guide
Release 8.0.6.0.0
51
2. Click Market Risk Measurement and Management, in the MRMM landing page. The
MRMM Home screen is displayed.
3. Click in the MRMM home screen to navigate to the Application Preferences
window.
4. Click Default Configurations > Liquidity Horizon.
Figure 20 Default Configurations - Liquidity Horizon
5. In the field Define Liquidity Horizon For, select Portfolio, Trading Desk or Default. If
you select default, the pre-seeded values are considered for calculation of stress
calibrated Expected Shortfall. You can update pre-seeded default values. If you select
Portfolio or Trading Desk the list of Portfolio/ Trading Desk is displayed and liquidity
horizon can be specified for each of them separately
6. Select the Portfolio or Trading Desk for which the Risk Factor values needs to be
assigned.
7. Select any Risk Factor Category, and update the Liquidity Horizon or risk factor value.
Note:
Use ‘F2’ key, or click on any other row to exit the edit mode in a table, before updating
or navigating to a different tab.
8. Click Update. If the Risk Factor values are not defined for any Liquidity Horizon, or are
partially defined, then the application considers default values for those items.
66..55 TTeecchhnniiccaall CCoonnffiigguurraattiioonnss
In this section you can set the tuning, logging and other parameters used during various
calculations.
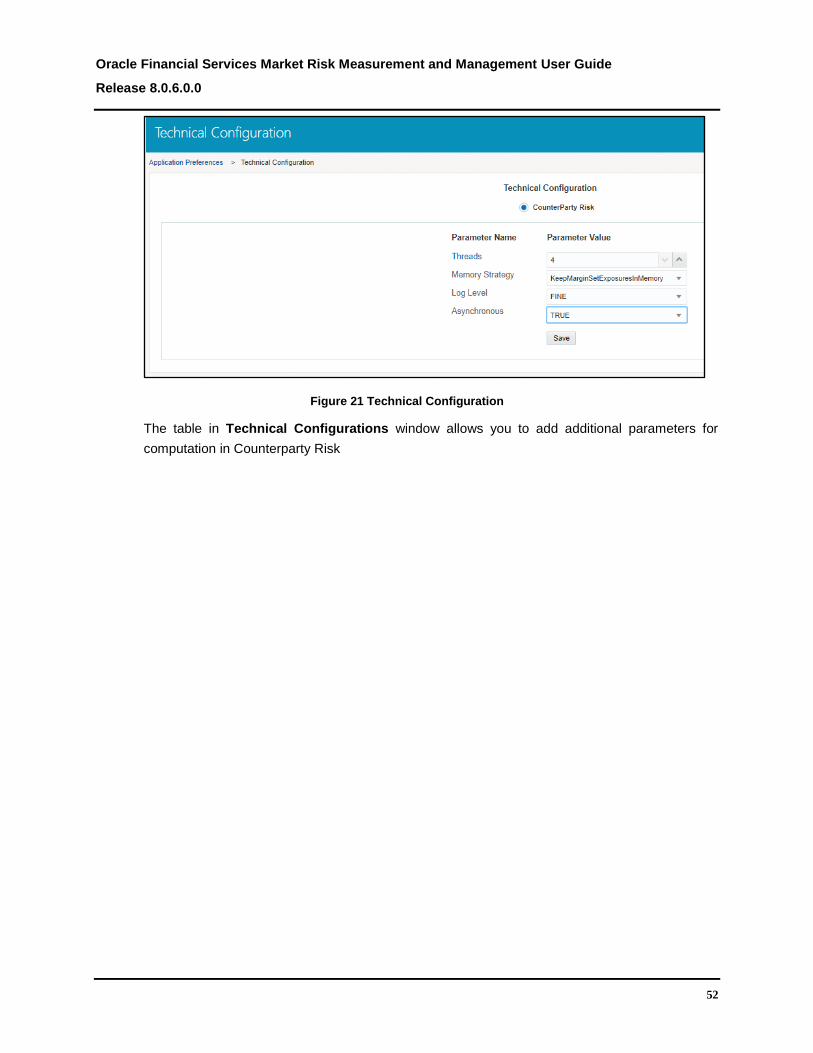
Oracle Financial Services Market Risk Measurement and Management User Guide
Release 8.0.6.0.0
52
Figure 21 Technical Configuration
The table in Technical Configurations window allows you to add additional parameters for
computation in Counterparty Risk

Oracle Financial Services Market Risk Measurement and Management User Guide
Release 8.0.6.0.0
53
The following table describes the fields in the Technical Configurations window:
Fields Description
Fields marked in red asterisk(*) are mandatory
Threads Specify the number of threads to be used for the
computation. The default value is Four.
Memory Strategy
Specify the memory strategy to be used for intermediate
results.
Note: XVA results (i.e., the final results) are always kept in
memory.
Available values are:
• KeepAllExposuresInMemory: Keep trade exposures in
memory. With this option, intermediate netting set and
margin set exposures are kept in memory. However, the
adjusted exposures used for incremental and marginal
calculations are not stored in memory.
• KeepMarginSetExposuresInMemory (Default): In
addition to final results, margin set exposures are also
kept in memory. With this option, the aggregation of trade
exposures at the margin set level will only be done once,
because exposures for each margin set are stored in
memory.
Log Level
Define the amount of information that is logged. Available
values are:
• INFO: It logs high level information.
• FINE: It is the default value, and is used to log
calculation details.
• SEVERE: It only logs errors.
Asynchronous
Set this to true to call the CAS extension asynchronously
so that you do not have to wait till the end of the
calculation to perform other actions.
The value is True, by default.
Table 9 Fields and their Descriptions in Instrument Type Classification Window
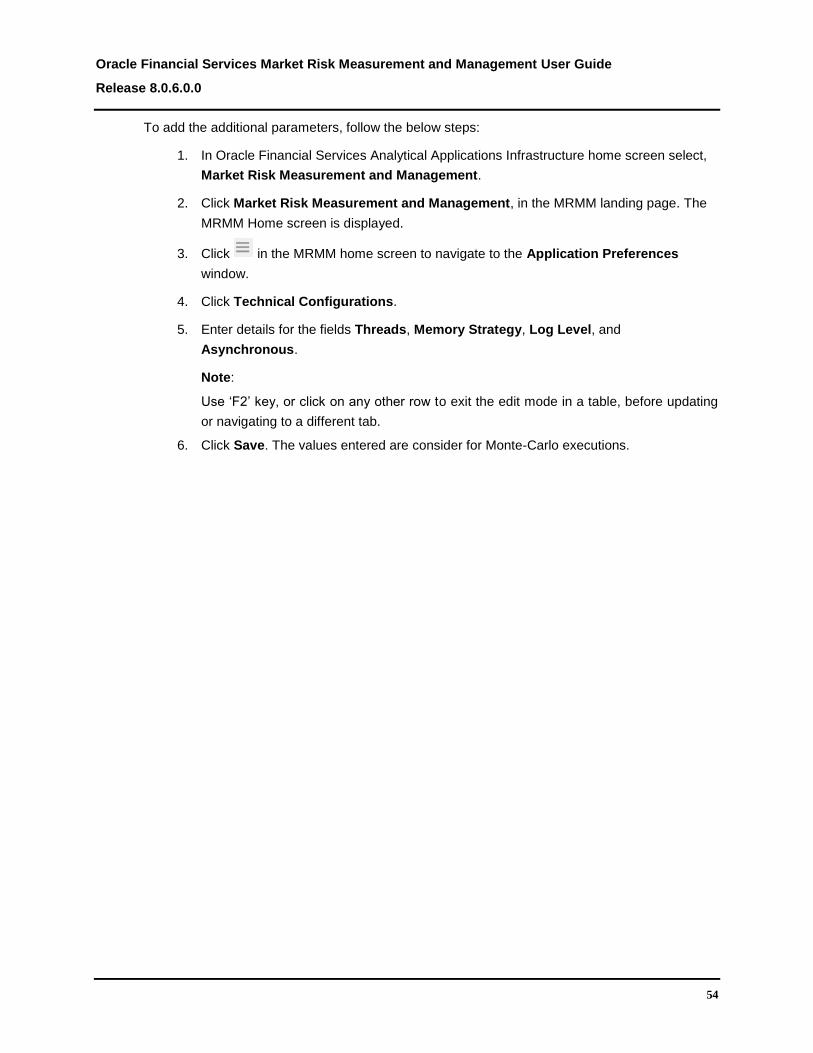
Oracle Financial Services Market Risk Measurement and Management User Guide
Release 8.0.6.0.0
54
To add the additional parameters, follow the below steps:
1. In Oracle Financial Services Analytical Applications Infrastructure home screen select,
Market Risk Measurement and Management.
2. Click Market Risk Measurement and Management, in the MRMM landing page. The
MRMM Home screen is displayed.
3. Click in the MRMM home screen to navigate to the Application Preferences
window.
4. Click Technical Configurations.
5. Enter details for the fields Threads, Memory Strategy, Log Level, and
Asynchronous.
Note:
Use ‘F2’ key, or click on any other row to exit the edit mode in a table, before updating
or navigating to a different tab.
6. Click Save. The values entered are consider for Monte-Carlo executions.

Oracle Financial Services Market Risk Measurement and Management User Guide
Release 8.0.6.0.0
55
77 BBuussiinneessss CCoonnffiigguurraattiioonnss
This Chapter describes the Business Configurations module in OFS MRMM.
This chapter includes:
Overview
Understanding Business Configuration Settings
Portfolio Definition
Modellable and Non-modellable Risk Factor Classification
Market Scenarios
Hybrid model
77..11 OOvveerrvviieeww
The Business Configurations section enables you to define a portfolio and configure rules to
identify modellable and non-modellable risk factors. This screen enables you to define new
market scenarios and hybrid models for Market Risk - Monte Carlo Simulation.
77..22 UUnnddeerrssttaannddiinngg BBuussiinneessss CCoonnffiigguurraattiioonn SSeettttiinnggss
In Oracle Financial Services Analytical Applications Infrastructure home screen, select Market
Risk Measurement and Management. Click icon in the MRMM home screen to navigate to
the Business Configurations window.
Figure 22 Business Configurations
The Business Configurations window includes the following sections:
Portfolio Definition
Modellable and Non-modellable Risk Factor
Market Scenarios
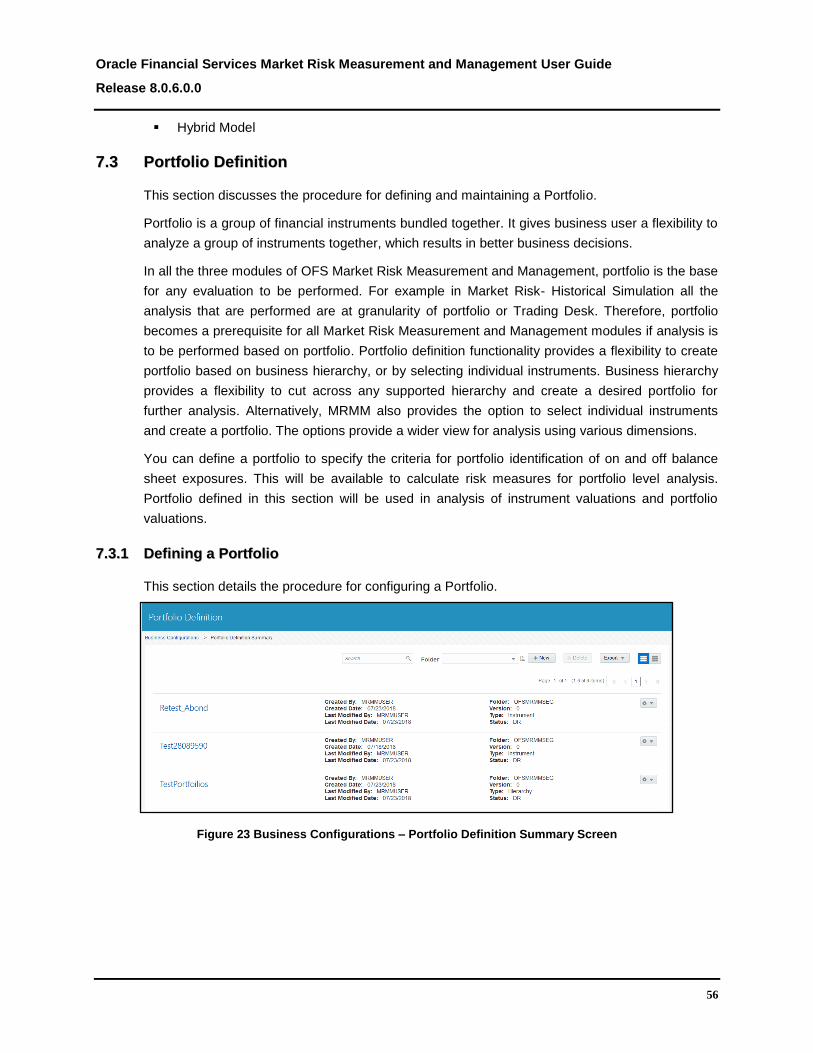
Oracle Financial Services Market Risk Measurement and Management User Guide
Release 8.0.6.0.0
56
Hybrid Model
77..33 PPoorrttffoolliioo DDeeffiinniittiioonn
This section discusses the procedure for defining and maintaining a Portfolio.
Portfolio is a group of financial instruments bundled together. It gives business user a flexibility to
analyze a group of instruments together, which results in better business decisions.
In all the three modules of OFS Market Risk Measurement and Management, portfolio is the base
for any evaluation to be performed. For example in Market Risk- Historical Simulation all the
analysis that are performed are at granularity of portfolio or Trading Desk. Therefore, portfolio
becomes a prerequisite for all Market Risk Measurement and Management modules if analysis is
to be performed based on portfolio. Portfolio definition functionality provides a flexibility to create
portfolio based on business hierarchy, or by selecting individual instruments. Business hierarchy
provides a flexibility to cut across any supported hierarchy and create a desired portfolio for
further analysis. Alternatively, MRMM also provides the option to select individual instruments
and create a portfolio. The options provide a wider view for analysis using various dimensions.
You can define a portfolio to specify the criteria for portfolio identification of on and off balance
sheet exposures. This will be available to calculate risk measures for portfolio level analysis.
Portfolio defined in this section will be used in analysis of instrument valuations and portfolio
valuations.
77..33..11 DDeeffiinniinngg aa PPoorrttffoolliioo
This section details the procedure for configuring a Portfolio.
Figure 23 Business Configurations – Portfolio Definition Summary Screen

Oracle Financial Services Market Risk Measurement and Management User Guide
Release 8.0.6.0.0
57
The following table describes the fields in the Portfolio Definition window:
Fields Description
Fields marked in red asterisk(*) are mandatory
Name* Enter the portfolio name.
Description Enter a short description for the portfolio
Folder* Select the Folder in which you want to save the
definition.
Access Type
Specify the access type for the Business Definition
created for selected trading desk/portfolio
Specify whether the definition is Read Only/ Read Write
Version* Displays the workflow version.
Portfolio Type
This option determines whether the Portfolio is defined
based on Instruments or Hierarchy. Select the desired
radio button to create portfolio based on Instruments or
Hierarchy
Filters
If you have selected Instrument option. You will be
provided with two filters such as, Currency and
Instrument type to filter the instrument records.
Table 10 Fields and their Descriptions in Portfolio Definition Window
To define a Portfolio, follow the below steps:
1. In Oracle Financial Services Analytical Applications Infrastructure home screen select,
Market Risk Measurement and Management.
2. Click Market Risk Measurement and Management, in the MRMM landing page. The
MRMM Home screen is displayed.
3. Click in the MRMM home screen to navigate to the Business Configuration window.
4. Click Portfolio Definition. The Portfolio Definition Summary Screen is displayed. You
can view all the Portfolios, and perform operations such as searching, sorting, changing
the layout, deleting and exporting the portfolios to an Excel Spreadsheet. For details
see section Common User Interface Functionalities.
5. In the Portfolio Summary screen, click New. The Create New screen is displayed.
6. Enter the Portfolio Name and Description.
7. Select the Folder from the drop down.

Oracle Financial Services Market Risk Measurement and Management User Guide
Release 8.0.6.0.0
58
8. Specify the Access Type.
9. In the Portfolio Type field, select whether the portfolio should be based on Hierarchy
or Instruments. For example, if you select Instruments, then the list of Instruments is
displayed. The list displays all the available marketable instruments.
a. To create the Portfolio based on instruments, follow the below steps:
i. Select the Instrument radio button in Portfolio Type.
ii. Select the instruments to be added in the portfolio by toggling the switch in
the Include column. The application allows multiple selections for this
section.
Figure 24 Business Configurations – Portfolio Definition Based on Instruments
b. To create the Portfolio based on hierarchy, follow the below steps:
i. Select the Hierarchy radio button in Portfolio Type.
ii. Select the hierarchy from the Available Values and add them to the list of
Selected Values by using button. To select multiple values use Ctrl or
Shift key. To select all the Available Values, use button. To remove any
selected value from the list use button. To remove all the selected
values use button.
iii. In the Select Currencies for Current Portfolio field, select the desired
currency.
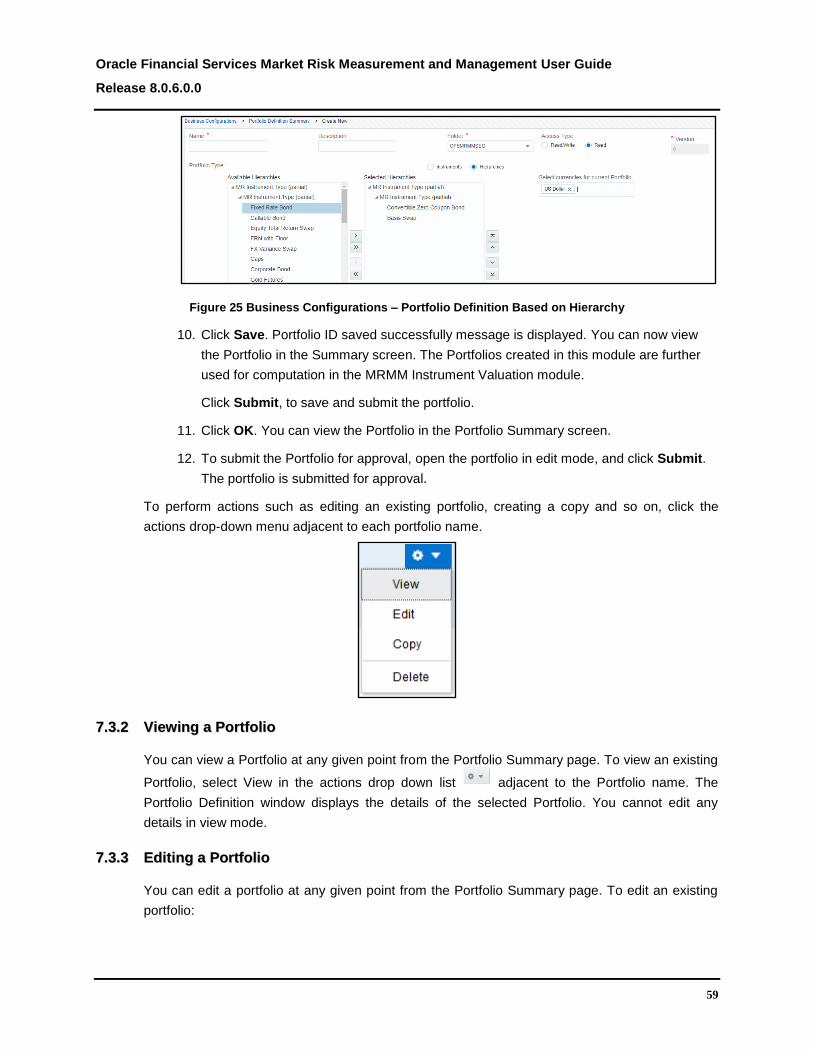
Oracle Financial Services Market Risk Measurement and Management User Guide
Release 8.0.6.0.0
59
Figure 25 Business Configurations – Portfolio Definition Based on Hierarchy
10. Click Save. Portfolio ID saved successfully message is displayed. You can now view
the Portfolio in the Summary screen. The Portfolios created in this module are further
used for computation in the MRMM Instrument Valuation module.
Click Submit, to save and submit the portfolio.
11. Click OK. You can view the Portfolio in the Portfolio Summary screen.
12. To submit the Portfolio for approval, open the portfolio in edit mode, and click Submit.
The portfolio is submitted for approval.
To perform actions such as editing an existing portfolio, creating a copy and so on, click the
actions drop-down menu adjacent to each portfolio name.
77..33..22 VViieewwiinngg aa PPoorrttffoolliioo
You can view a Portfolio at any given point from the Portfolio Summary page. To view an existing
Portfolio, select View in the actions drop down list adjacent to the Portfolio name. The
Portfolio Definition window displays the details of the selected Portfolio. You cannot edit any
details in view mode.
77..33..33 EEddiittiinngg aa PPoorrttffoolliioo
You can edit a portfolio at any given point from the Portfolio Summary page. To edit an existing
portfolio:

Oracle Financial Services Market Risk Measurement and Management User Guide
Release 8.0.6.0.0
60
1. Select Edit in the actions drop down list adjacent to the portfolio name. The
Portfolio Definition window displays the details of the selected portfolio for editing.
2. Edit the required fields.
3. Click Save. The updated information can be viewed in the Portfolio Summary page.
77..33..44 CCooppyyiinngg aa PPoorrttffoolliioo
You can copy a Portfolio at any given point from the Portfolio Summary page. To copy an existing
portfolio, follow the below steps:
1. Select Copy in the actions drop-down list adjacent to the Portfolio name.
2. Assign a new Portfolio Name, and edit the Description.
Figure 26 Portfolio Definition – Copying a Portfolio
3. Click OK. The copy is created and can be viewed in the Portfolio Summary screen.
77..44 MMooddeellllaabbllee aanndd NNoonn--MMooddeellllaabbllee RRiisskk FFaaccttoorr
A risk factor is referred as modellable, when the price of risk factor is real and is continuously
available. All the risk factors should be classified into modellable and non modellable. Expected
Shortfall (ES) and Value at Risk (VaR) computation is done only for modellable risk factor. In this
screen you can set the business rules and identify risk factors as modellable or non-modellable.
77..44..11 DDeeffiinniinngg MMooddeellllaabbllee aanndd NNoonn--MMooddeellllaabbllee RRiisskk FFaaccttoorrss
This section details the procedure for classifying a risk factor into modellable or non- modellable.
The classification of a risk factor as modellable or non-modellable is performed using this screen.
The screen has the below two sections:

Oracle Financial Services Market Risk Measurement and Management User Guide
Release 8.0.6.0.0
61
Modellable and Non-modellable Executions
This section displays the list of executions and their status. You can select the previous
execution from the Select Execution Date drop-down box, and check the status as Success
or Failed.
Modellable and Non-modellable Risk Factors
This screen has two sections. The LHS displays the list of filters where you can select the
nodes of given filter. Click Apply to apply the filters to the risk factors, or Reset to remove all
the filters. The filtered set of risk factors can be viewed in the screen.
Figure 27 Modellable and Non-Modellable Risk Factor Identification Summary Screen
Following is the list of applicable filters:
Risk Factor Type
Term/Target Currency
Inflation Index Name
Market Capitalization Category
Commodity Group
Bond Type
Market Data Source
Asset Class
Market Data Type
Currency
Base/Known Currency
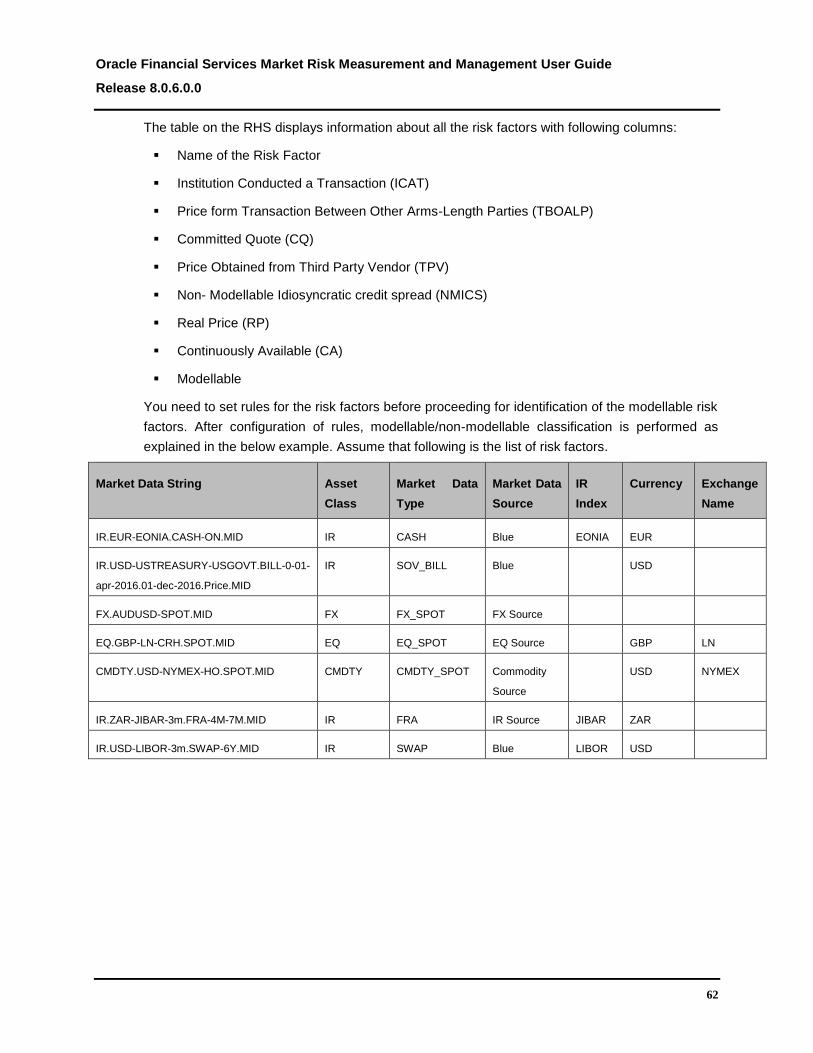
Oracle Financial Services Market Risk Measurement and Management User Guide
Release 8.0.6.0.0
62
The table on the RHS displays information about all the risk factors with following columns:
Name of the Risk Factor
Institution Conducted a Transaction (ICAT)
Price form Transaction Between Other Arms-Length Parties (TBOALP)
Committed Quote (CQ)
Price Obtained from Third Party Vendor (TPV)
Non- Modellable Idiosyncratic credit spread (NMICS)
Real Price (RP)
Continuously Available (CA)
Modellable
You need to set rules for the risk factors before proceeding for identification of the modellable risk
factors. After configuration of rules, modellable/non-modellable classification is performed as
explained in the below example. Assume that following is the list of risk factors.
Market Data String Asset
Class
Market Data
Type
Market Data
Source
IR
Index
Currency Exchange
Name
IR.EUR-EONIA.CASH-ON.MID IR CASH Blue EONIA EUR
IR.USD-USTREASURY-USGOVT.BILL-0-01-
apr-2016.01-dec-2016.Price.MID
IR SOV_BILL Blue USD
FX.AUDUSD-SPOT.MID FX FX_SPOT FX Source
EQ.GBP-LN-CRH.SPOT.MID EQ EQ_SPOT EQ Source GBP LN
CMDTY.USD-NYMEX-HO.SPOT.MID CMDTY CMDTY_SPOT Commodity
Source
USD NYMEX
IR.ZAR-JIBAR-3m.FRA-4M-7M.MID IR FRA IR Source JIBAR ZAR
IR.USD-LIBOR-3m.SWAP-6Y.MID IR SWAP Blue LIBOR USD

Oracle Financial Services Market Risk Measurement and Management User Guide
Release 8.0.6.0.0
63
The rules created are as below.
Rule for Institution Conducted a Transaction
Rule Name Asset Class Currency
Rule 1 IR EUR,USD
Rule Name Market Data Source Currency
Rule 2 Commodity Source USD
Rule for Price from Transaction Between other Arms-Length Parties
Rule Name Asset Class Market Data Type
Rule 1 IR, CMDTY CASH, SOV_BILL, CMDTY_SPOT
Rule for Committed Quote
Rule Name Market Data Type
Rule 1 FRA, SWAP
Rule for Price Obtained from Third Party Vendor
Rule Name Market Data Source
Rule 1 FX Source
For each risk factor the flag is updated based on the rule as shown in the below table.
Market Data String ICAT TBOALP CQ TPV
IR.EUR-EONIA.CASH-ON.MID Y Y N N
IR.USD-USTREASURY-USGOVT.BILL-0-01-
apr-2016.01-dec-2016.Price.MID
Y Y N N
FX.AUDUSD-SPOT.MID N N N Y
EQ.GBP-LN-CRH.SPOT.MID N N N N
CMDTY.USD-NYMEX-HO.SPOT.MID Y Y N N
IR.ZAR-JIBAR-3m.FRA-4M-7M.MID N N Y N
IR.USD-LIBOR-3m.SWAP-6Y.MID Y N Y N

Oracle Financial Services Market Risk Measurement and Management User Guide
Release 8.0.6.0.0
64
The RP value is computed as Yes for each risk factor if the following condition is met:
(Institution conducted a transaction= “Yes” AND (Price form transaction between other arms-
length parties= “Yes” OR Committed quote = “Yes”) OR Price Obtained from Third Party Vendor
= “YES”)
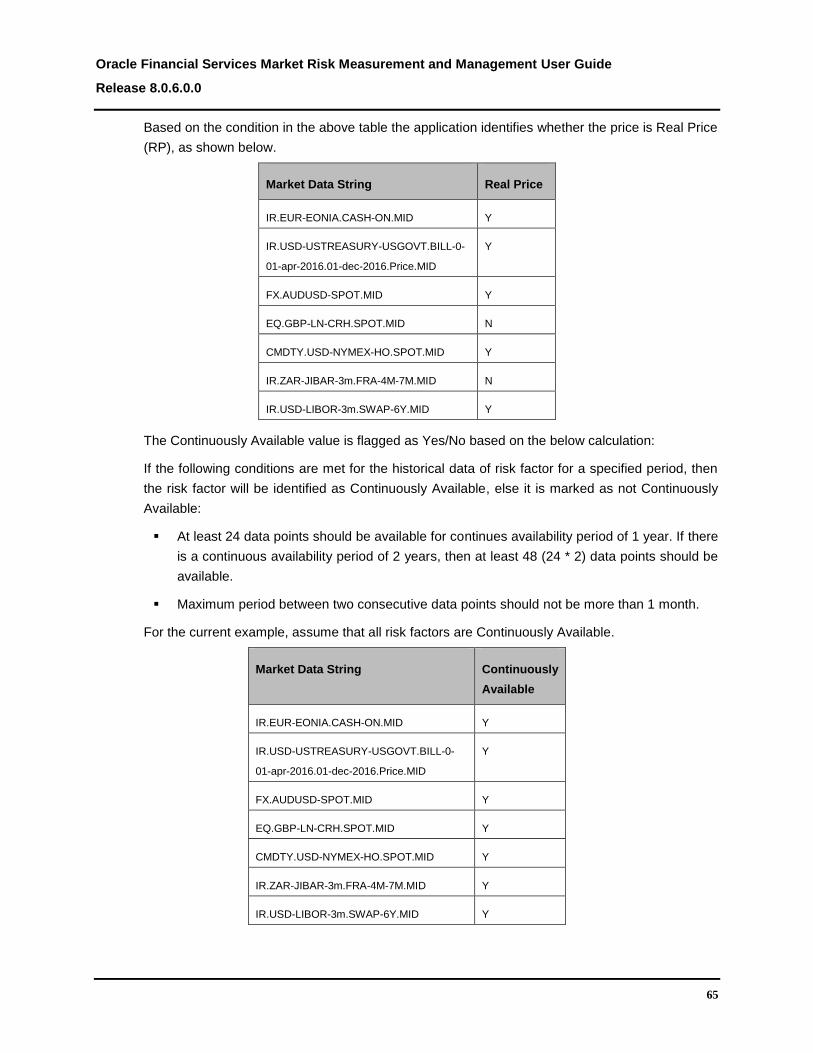
Oracle Financial Services Market Risk Measurement and Management User Guide
Release 8.0.6.0.0
65
Based on the condition in the above table the application identifies whether the price is Real Price
(RP), as shown below.
Market Data String Real Price
IR.EUR-EONIA.CASH-ON.MID Y
IR.USD-USTREASURY-USGOVT.BILL-0-
01-apr-2016.01-dec-2016.Price.MID
Y
FX.AUDUSD-SPOT.MID Y
EQ.GBP-LN-CRH.SPOT.MID N
CMDTY.USD-NYMEX-HO.SPOT.MID Y
IR.ZAR-JIBAR-3m.FRA-4M-7M.MID N
IR.USD-LIBOR-3m.SWAP-6Y.MID Y
The Continuously Available value is flagged as Yes/No based on the below calculation:
If the following conditions are met for the historical data of risk factor for a specified period, then
the risk factor will be identified as Continuously Available, else it is marked as not Continuously
Available:
At least 24 data points should be available for continues availability period of 1 year. If there
is a continuous availability period of 2 years, then at least 48 (24 * 2) data points should be
available.
Maximum period between two consecutive data points should not be more than 1 month.
For the current example, assume that all risk factors are Continuously Available.
Market Data String Continuously
Available
IR.EUR-EONIA.CASH-ON.MID Y
IR.USD-USTREASURY-USGOVT.BILL-0-
01-apr-2016.01-dec-2016.Price.MID
Y
FX.AUDUSD-SPOT.MID Y
EQ.GBP-LN-CRH.SPOT.MID Y
CMDTY.USD-NYMEX-HO.SPOT.MID Y
IR.ZAR-JIBAR-3m.FRA-4M-7M.MID Y
IR.USD-LIBOR-3m.SWAP-6Y.MID Y
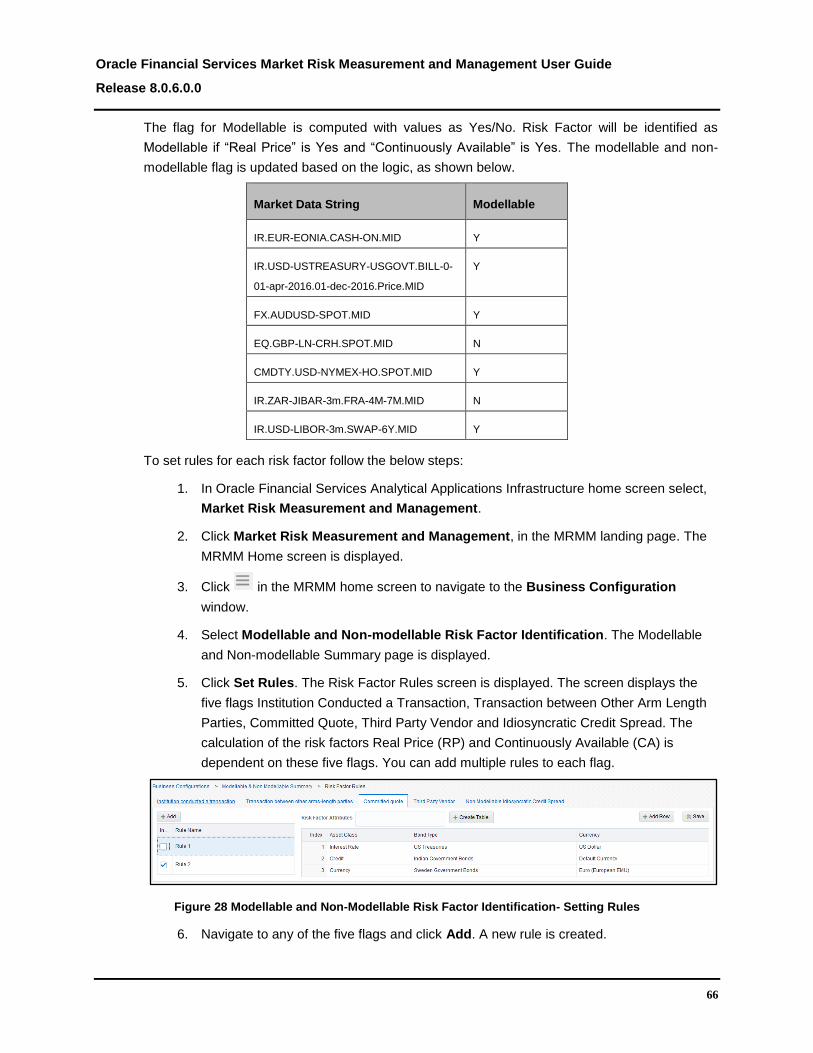
Oracle Financial Services Market Risk Measurement and Management User Guide
Release 8.0.6.0.0
66
The flag for Modellable is computed with values as Yes/No. Risk Factor will be identified as
Modellable if “Real Price” is Yes and “Continuously Available” is Yes. The modellable and non-
modellable flag is updated based on the logic, as shown below.
Market Data String Modellable
IR.EUR-EONIA.CASH-ON.MID Y
IR.USD-USTREASURY-USGOVT.BILL-0-
01-apr-2016.01-dec-2016.Price.MID
Y
FX.AUDUSD-SPOT.MID Y
EQ.GBP-LN-CRH.SPOT.MID N
CMDTY.USD-NYMEX-HO.SPOT.MID Y
IR.ZAR-JIBAR-3m.FRA-4M-7M.MID N
IR.USD-LIBOR-3m.SWAP-6Y.MID Y
To set rules for each risk factor follow the below steps:
1. In Oracle Financial Services Analytical Applications Infrastructure home screen select,
Market Risk Measurement and Management.
2. Click Market Risk Measurement and Management, in the MRMM landing page. The
MRMM Home screen is displayed.
3. Click in the MRMM home screen to navigate to the Business Configuration
window.
4. Select Modellable and Non-modellable Risk Factor Identification. The Modellable
and Non-modellable Summary page is displayed.
5. Click Set Rules. The Risk Factor Rules screen is displayed. The screen displays the
five flags Institution Conducted a Transaction, Transaction between Other Arm Length
Parties, Committed Quote, Third Party Vendor and Idiosyncratic Credit Spread. The
calculation of the risk factors Real Price (RP) and Continuously Available (CA) is
dependent on these five flags. You can add multiple rules to each flag.
Figure 28 Modellable and Non-Modellable Risk Factor Identification- Setting Rules
6. Navigate to any of the five flags and click Add. A new rule is created.

Oracle Financial Services Market Risk Measurement and Management User Guide
Release 8.0.6.0.0
67
7. Select the attributes for each rule which is created. For example, when you click Add in
the Committed Quote column, a new Rule is created. When you click on the rule name,
the Risk Factor Attributes field becomes available. For every rule, you need to add
one or multiple risk factor attributes.
Figure 29 Modellable and Non-Modellable Risk Factor Identification- Adding Attributes
8. After selecting attributes, click Create Table. The selected attributes are displayed as
column headers in the table.
9. Click Add Row to create a new row, and click on each cell. The pre-seeded dimensions
for the attributes are displayed. Select the required dimensions and add in the table.

Oracle Financial Services Market Risk Measurement and Management User Guide
Release 8.0.6.0.0
68
Figure 30 Modellable and Non-Modellable Risk Factor Identification – Adding Dimensions to Attributes
Note:
Use ‘F2’ key, or click on any other row to exit the edit mode in a table, before updating
or navigating to a different tab.
10. Click Save. The rules are saved. Additionally, you can also change the sequence of the
rules to be executed by dragging the rules. Sequence of the rule in table will be
sequence of execution of rule. You will have to select the check box for each rule if you
wish to apply the rule for identifying the corresponding attribute. If you do not select the
check box, the application will not execute the rule. Similarly set rules for all the
required flags.
11. Click Execute in the summary screen. Select Date message box appears. To reload
risk factor data of the last execution of given date, select Reload Data. In this case, the
application will not derive the risk factor data required for instruments it will take last
identified risk factor data. Else provide the Execution Date and click OK.
The rules created for Institution Conducted a Transaction (ICAT), Price form
Transaction Between Other Arms-Length Parties (TBOALP), Committed Quote (CQ),
Price Obtained from Third Party Vendor (TPV) and Non- Modellable Idiosyncratic credit
spread (NMICS) will be executed in the sequence displayed in the respective interface.
Rules will update the target column based on mapping selected in source column.
The RP value is computed as Yes, for each risk factor if following condition is met:
The Continuously Available value is flagged as Yes/No

Oracle Financial Services Market Risk Measurement and Management User Guide
Release 8.0.6.0.0
69
The flag for Modellable is computed with values as Yes/No. Risk Factor will be
identified as Modellable if “Real Price” is Yes and “Continuously Available” is Yes.
Corresponding risk factor should be marked as Modellable (Yes) else mark risk factor
as non Modellable (No).
12. The RHS of the summary screen has filters that can be applied to filter the risk output
data based on the risk factors. You can manually modify the system computed values
for modellable and non-modellable for each risk factor.
13. Click Save to save the modifications made to the modellable status of risk factor. The
resulting data is further used in the output metrics computed in historical simulation.
77..55 MMaarrkkeett SScceennaarriiooss
OFS MRMM uses a variety of market data such as Rate, Price, Curve, and Volatility to perform
Instrument, Counterparty and Portfolio level risk analysis.
A Scenario is a set of changes which can be applied to a base market. Current market data can
be used for business as usual analysis. However, to perform what-if analysis and other scenario
analysis modified market data is required. Market Scenarios section in MRMM application,
enables you to define market data under multiple scenarios, which can be further used to perform
valuations.
77..55..11 CCoonnffiigguurriinngg aa SScceennaarriioo
The functionality enables you to create and configure a new scenario.
Figure 31 Market Scenario – Scenario Definition Summary Screen

Oracle Financial Services Market Risk Measurement and Management User Guide
Release 8.0.6.0.0
70
Figure 32 Scenario Definition Screen
The following table describes the fields in the Scenario Definition window:
Fields Description
Fields marked in red asterisk(*) are mandatory
Name* Displays the identification number assigned to
the Scenario.
Description Provide a short description for the Scenario
Folder* Assign a folder name where the Scenario will
be saved
Access Type Specify the user access type for the Scenario.
Version* Specify the version.
Risk Factor Type Select the Risk Factor Type from the drop-down
box
Market Data Type Select the Market Data from the drop-down box
Shock Type Select the type of Shock. Available values are
Percentage, Absolute Value and Basis Point
Shock Value Specify the shock value to be applied
Definition ID In the audit trail section, this ID displays the
identification number assigned to the Shock.
Table 11 Fields and their Descriptions in Scenario Definition window
To configure a new scenario follow the below procedure:
Oracle Financial Services Market Risk Measurement and Management User Guide
Release 8.0.6.0.0
71
1. In Oracle Financial Services Analytical Applications Infrastructure home screen select,
Market Risk Measurement and Management.
2. Click Market Risk Measurement and Management, in the MRMM landing page. The
MRMM Home screen is displayed.
3. Click button in the MRMM home screen to navigate to the Application Preferences
window.
4. Click Market scenarios. The Market Scenarios Summary screen is displayed.
5. Click Configure Scenario to create a new scenario.
6. Enter details for the fields Name, Description, Folder and Access Type
7. To add a shock to the scenario, in the Shock at Risk Factor Type Level box, click Add
Row.
8. Select the Risk Factor Type and the corresponding Market Data Type from the drop-
down list.
9. Select the Shock Type and assign a Shock Value. For details see Shock Definition
Parameters. You can create multiple shocks in a scenario.
10. In the Shock at Attribute Level box, click Add Row. Based on the Risk Factor Type and
Market Data Type selected, the available factors/keys for shock definition are displayed.
Provide the details in the fields. See table below for details of shock attributes.
11. Click Save. The Scenario is defined and displayed in the summary page.
Click Submit, to save and submit the scenario.
12. Click OK. You can view the Scenario in the Scenario summary screen.
13. To submit the scenario for approval, open the scenario in edit mode, and click Submit.
The scenario is submitted for approval.
77..55..22 SShhoocckk DDeeffiinniittiioonn PPaarraammeetteerrss
Shock can be defined at various levels of dimension and market data market quotes. You need to
select the factors based on which the shock needs to be defined. The factors used to define a
shock are dependent on the Risk Factor Type and Market Data Type. Depending on the factor
the definition of a shock can be classified into the four categories. The categories are explained
considering Interest Rate Shock as an example:
Highest Level of Risk Factor: Any shock defined at this level will impact all the yield
curves. In the example, of Interest Rate Shock, this shock will be applied is at the level of
Interest Rate (IR). Any shock defined at IR level will impact all yield curves.
Currency Level: Any shock defined at this level will impact all yield curves mapped to a
specific currency type. In the example, of Interest Rate Shock, this shock will be applied is

Oracle Financial Services Market Risk Measurement and Management User Guide
Release 8.0.6.0.0
72
at the level of IR, mapped to a specific currency type such as US Dollar (USD). Any shock
defined at IR-USD level will impact all yield curves where currency is USD.
Yield Curve Level: Any shock defined at this level will impact the dimensions mapped to a
specific to a currency type, of a specific yield curve. In the example, of Interest Rate Shock,
this shock will be applied is at the level of IR, mapped to a specific currency type such as
US Dollar (USD), and yield curve such as LIBOR. Any shock defined at IR-USD-LIBOR
level will impact only LIBOR yield curve where currency is USD
Yield Curve Term Point Level Any shock defined at this level will impact the dimensions
mapped to a specific currency type, of a specific yield curve with a defined term point. In the
example, of Interest Rate Shock, this shock will be applied is at the level of IR, mapped to a
specific currency type such as US Dollar (USD), and yield curve such as LIBOR with a fixed
term point. Any shock defined at IR-USD-LIBOR-3M level will impact only 3 months term
point of LIBOR yield curve where currency is USD.
For example if the shock value for IR-USD-LIBOR-3M is 1% and that for IR-USD-LIBOR is 2%. In
this case a three month term point will be shocked by 1% whereas all other term points in yield
curve will be shocked by 2%. Below table illustrates the way shock definition is expected to work
in the form of a hierarchy. As a result the below percentage of shock is applied to the yield
curves:
4% shock to 3 month term point of yield curve IR-USD-LIBOR
3% shock to all term points except 3 month of yield curve IR-USD-LIBOR
2% shock to all USD yield curves except LIBOR
1% shock to all yields curves where currency is not USD
Level 1 Level 2 Level 3 Level 4 Shock value
IR 1%
IR USD 2%
IR USD LIBOR 3%
IR USD LIBOR 3M 4%
The below table lists the factors for each type of market data which can be used to define shock.
Additionally, dimensions such as Cash Flow, Time Bucket, industry/sector of the Counterparty,
Counterparty Type, and Rating of Instrument and so on can also be used to define shock.
Generic dimensions are applicable to all the shock factors. The granularity of the shock is
inversely proportional to the number of dimensions selected.
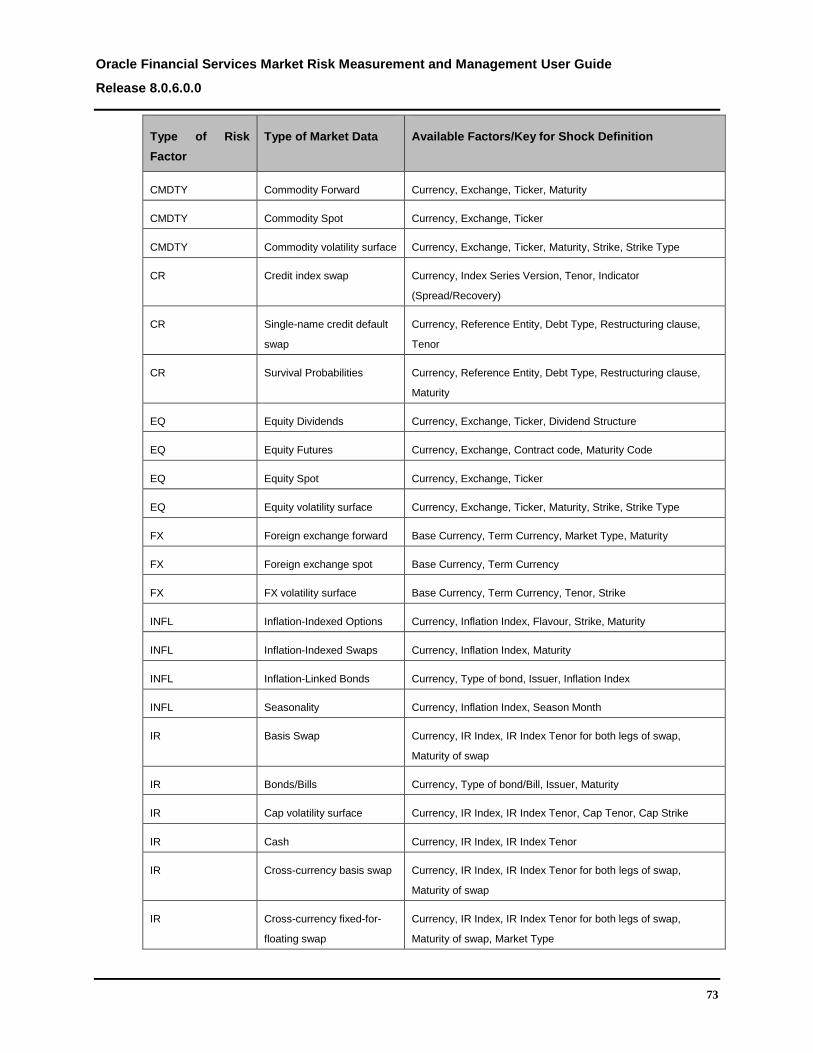
Oracle Financial Services Market Risk Measurement and Management User Guide
Release 8.0.6.0.0
73
Type of Risk
Factor
Type of Market Data Available Factors/Key for Shock Definition
CMDTY Commodity Forward Currency, Exchange, Ticker, Maturity
CMDTY Commodity Spot Currency, Exchange, Ticker
CMDTY Commodity volatility surface Currency, Exchange, Ticker, Maturity, Strike, Strike Type
CR Credit index swap Currency, Index Series Version, Tenor, Indicator
(Spread/Recovery)
CR Single-name credit default
swap
Currency, Reference Entity, Debt Type, Restructuring clause,
Tenor
CR Survival Probabilities Currency, Reference Entity, Debt Type, Restructuring clause,
Maturity
EQ Equity Dividends Currency, Exchange, Ticker, Dividend Structure
EQ Equity Futures Currency, Exchange, Contract code, Maturity Code
EQ Equity Spot Currency, Exchange, Ticker
EQ Equity volatility surface Currency, Exchange, Ticker, Maturity, Strike, Strike Type
FX Foreign exchange forward Base Currency, Term Currency, Market Type, Maturity
FX Foreign exchange spot Base Currency, Term Currency
FX FX volatility surface Base Currency, Term Currency, Tenor, Strike
INFL Inflation-Indexed Options Currency, Inflation Index, Flavour, Strike, Maturity
INFL Inflation-Indexed Swaps Currency, Inflation Index, Maturity
INFL Inflation-Linked Bonds Currency, Type of bond, Issuer, Inflation Index
INFL Seasonality Currency, Inflation Index, Season Month
IR Basis Swap Currency, IR Index, IR Index Tenor for both legs of swap,
Maturity of swap
IR Bonds/Bills Currency, Type of bond/Bill, Issuer, Maturity
IR Cap volatility surface Currency, IR Index, IR Index Tenor, Cap Tenor, Cap Strike
IR Cash Currency, IR Index, IR Index Tenor
IR Cross-currency basis swap Currency, IR Index, IR Index Tenor for both legs of swap,
Maturity of swap
IR Cross-currency fixed-for-
floating swap
Currency, IR Index, IR Index Tenor for both legs of swap,
Maturity of swap, Market Type

Oracle Financial Services Market Risk Measurement and Management User Guide
Release 8.0.6.0.0
74
Type of Risk
Factor
Type of Market Data Available Factors/Key for Shock Definition
IR Forward rate agreement Currency, IR Index, IR Index Tenor, FRA Period
IR Represent a point on a
swaption volatility cube
IR.[Underlying].SWPT.StrikeType::Strike::OptTenor::SwapTenor:
:DataType.QuoteType where [Underlying] = Currency-IRIndex-
IRIndexTenor.VOL
IR Swap Currency, IR Index, IR Index Tenor, Swap Tenor
IR Swaption volatility cube Currency, IR Index, IR Index Tenor, Strike Type, Strike, Option
Tenor, Swap Tenor
IR Swaption volatility surface Currency, IR Index, IR Index Tenor, Swaption Strike, Option
Tenor, Swap Tenor
Table 12 Shock Attributes
77..55..33 TTyyppee ooff SShhoocckkss
Shock types are defined as a set of additive and multiplicative operations. It results in either an
increase or decrease of the base market quotes.
Shock can be defined as Percent, Basis Points or Absolute Value.
77..55..33..11 SShhoocckk iinn TTeerrmmss ooff PPeerrcceenntt
In this scenario the shock value is defined in terms of percent. For example: 1%, -2% and so on.
This is applicable to all risk factors.
Below are a few examples:
Example 1: If the Base quote = 2 and the Shock value = - 2%
Modified quote = 2 * [1 + (-2%)] = 1.96
Example 2: If the Base quote = 2 and the Shock value = 1%
Modified quote = 2 * [1 + (1%)] = 2.02
77..55..33..22 SShhoocckk iinn TTeerrmmss ooff BBaassiiss PPooiinnttss
In this scenario the shock value is defined in terms of Basis Points (BP). For example: 1 BP up, 5
BP down and so on. This is applicable to risk factors expressed in terms of rate such as Interest
Rate, Swap Rate, and Forward Rate Agreement (FRA) Rate and so on. Below are a few
examples:
Example 1: If the Base quote = 2 and the Shock value = - 5 BP
Modified quote = 2 + (-0.05) = 1.95

Oracle Financial Services Market Risk Measurement and Management User Guide
Release 8.0.6.0.0
75
Example 2: If the Base quote = 2 and the Shock value = 4 BP
Modified quote = 2 + 0.04 = 2.04
77..55..33..33 SShhoocckk iinn TTeerrmmss ooff AAbbssoolluuttee VVaalluuee
In this scenario the shock value is defined in absolute terms. For example: USD 10 up, GBP 5
down and so on. This is applicable to risk factors expressed in terms of price such as Equity Spot
Price, Index, Futures, Bond Price and so on. Below are a few examples:
Example 1: If the Base quote = 112and the Shock value = 5
Modified quote = 112 + 5 = 117
Example 2: If the Base quote = 112 and the Shock value = - 8
Modified quote = 112 + (- 8) = 94
77..66 HHyybbrriidd MMooddeell
Hybrid model is a combination of models used to price multi-asset class deals. The Monte Carlo
technique used for Counterparty risk calculations requires a global hybrid model to be
constructed and used for the exposure calculation of each trade. The hybrid model is composed
of a set of component models, for which parameters, correlation values and calibration strategies
must be defined.
Rule within a hybrid model defines a pattern that is used to match the name of the underlying’s
specified by the trades. If a rule’s pattern matches the name of an underlying, other attributes in
the Rule element specify what type of model should be generated, and the parameters for that
(such as calibration strategy, and primary/secondary selection). Multiple rules can match an
underlying, since the same underlying can require multiple factor models.
77..66..11 AAddddiinngg aa HHyybbrriidd MMooddeell
This section details the procedure for adding a hybrid model. The following table describes the
fields in the Hybrid Model window:
Fields Description
Fields marked in red asterisk(*) are mandatory
Name* Enter the portfolio name.
Quote Type
Correlation factors are found by looking in the market
data, and this element notes how to form the full key of
those correctly factor quote keys. Select any one value
from available list – ASK, BID, FIX, LAST, MID
Version* Displays the workflow version.

Oracle Financial Services Market Risk Measurement and Management User Guide
Release 8.0.6.0.0
76
Fields Description
Fields marked in red asterisk(*) are mandatory
Workflow Status Displays the status of the workflow
Pattern
Defines a pattern with positional strings that is used to
match the name of an underlying. This determines if the
rule is applicable for a specific trade’s underlying. If the
pattern matches, the rule is used to generate one or
more factor models in the output hybrid model setup.
For example, "IR.<Currency>" will match any underlying
with the pattern that it starts with the string "IR." and
ends with some currency string. The positional strings
are set with the specified name (or names), and will be
substituted in the value of other attributes of the rule.
Number Factor The number of factors for the underlying component
model, if it can be configured with multiple factors.
Priority It indicates the priority that is used when two or more
pattern match the name of an underlying.
Model ID
This field indicates the ID string of the model to be
created for the single-factor model. It can refer to
positional strings found when the Pattern was matched.
For example, “IR.MODEL.HW1F.<Currency>" will be
the string
"IR.MODEL.HW1F.USD" if the previous example’s
Pattern matched the underlying "IR.USD".
Calibration Script A Numerix (NXEL) script function to call to generate the
calibration instruments for the model
Is primary
Set this to "true" or "false" to indicate if the generated
model is a primary or secondary one. Secondary
models are separate from other secondary models, and
are only correlated with the primary models.
Table 13 Fields and their Descriptions in Hybrid Model Window
To add a hybrid model, follow the below steps:
1. In Oracle Financial Services Analytical Applications Infrastructure home screen select,
Market Risk Measurement and Management.

Oracle Financial Services Market Risk Measurement and Management User Guide
Release 8.0.6.0.0
77
2. Click Market Risk Measurement and Management, in the MRMM landing page. The
MRMM Home screen is displayed.
3. Click in the MRMM home screen to navigate to the Business Configuration
window.
4. Click Hybrid Model, to view the hybrid model definition screen.
Figure 33 Hybrid Model Definition Screen
5. Click Add.
6. Provide a Name and Quote Type for the model.
7. Click Add Rule.
8. Based on the selected Pattern, the fields are displayed. Enter the relevant details in the
fields. The below table lists the mapping between pattern and fields displayed:
Pattern Fields
Common
Number Factor
Priority
Model ID
Calibration Script
IR.Currency Currency
FX.<Basecurrency>/<Termcurrency>
Base Currency
Term Currency
CR.<Currency>- Currency

Oracle Financial Services Market Risk Measurement and Management User Guide
Release 8.0.6.0.0
78
Pattern Fields
<ReferenceEntity>_<DebtType>_<RestructuringClause> Debt Type
Reference Entity
Restructuring Clause
EQ.<Currency>-<Exchange>-<Ticker>
Currency
Exchange
Ticker
CMDTY.<Currency>-<Exchange>-<Ticker>
Currency
Exchange
Ticker
CPI.<Currency>-<InflationIndex>
Currency
Inflation Index
RR.<Currency>-<InflationIndex>
Currency
Inflation Index
9. Provide details for Number Factor, Priority, Model ID, and Calibration Script.
10. Check the Is Primary check box, if applicable.
11. Click Save.
12. Click Generate XML. This file is used while defining a business definition in Monte-
Carlo simulation > Model Parameters (Hybrid Model Name).

Oracle Financial Services Market Risk Measurement and Management User Guide
Release 8.0.6.0.0
79
88 IInnssttrruummeenntt VVaalluuaattiioonn
OFS MRMM Instrument Valuation module, enables you to create and analyze different
perspectives of viewing the valuation of instruments. This chapter includes:
Overview
Creating and Executing a Business Definition
88..11 OOvveerrvviieeww
This module primarily aims to deliver the instrument granularity computations and metrics using
NUMERIX. It computes the price of instruments in the portfolio, and addresses the needs of both
regulatory reporting and internal risk management. You can perform valuation of instruments and
positions in trading book here using pre-defined models and methods based on trading desk
and/or portfolio. This module provides the below computations:
Present value of instrument
Cash flow of instrument
Greeks and sensitivity associated with instrument
Yield Risk report of instrument
88..22 CCrreeaattiinngg aanndd EExxeeccuuttiinngg aa BBuussiinneessss DDeeffiinniittiioonn
This section elaborates the process of creating a business approach, and executing a business
definition. A business definition allows you to set business specific parameters required for
analysis. You need to define a business approach before creating a business definition.
88..22..11 DDeeffiinniinngg aa BBuussiinneessss AApppprrooaacchh
A new business approach enables you to analyze each module from a trading desk or portfolio
perspective. Follow the below procedure for defining a new business approach:
1. In Oracle Financial Services Analytical Applications Infrastructure home screen select,
Market Risk Measurement and Management.
2. Click Market Risk Measurement and Management, in the MRMM landing page. The
MRMM Home screen is displayed.
3. Select Business Processes > Instrument Valuation. The Instrument Valuation
Summary screen is displayed. The screen displays the list of business approaches
based on Trading Desk or Portfolio.
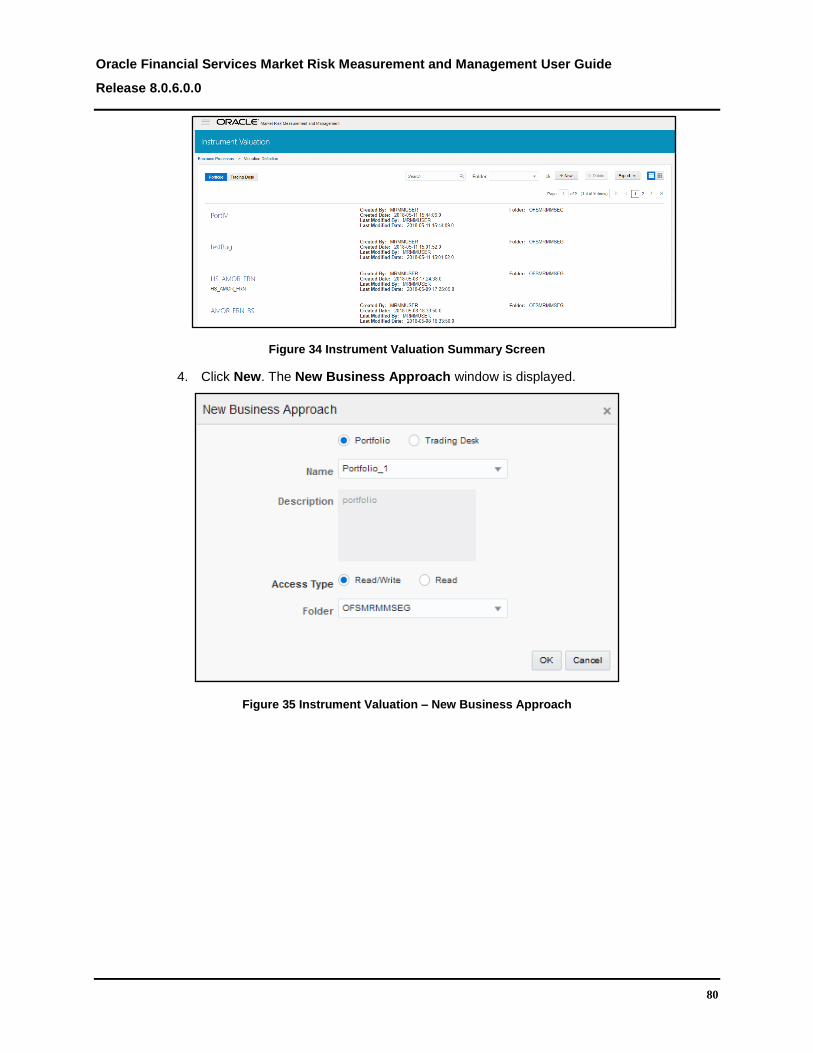
Oracle Financial Services Market Risk Measurement and Management User Guide
Release 8.0.6.0.0
80
Figure 34 Instrument Valuation Summary Screen
4. Click New. The New Business Approach window is displayed.
Figure 35 Instrument Valuation – New Business Approach
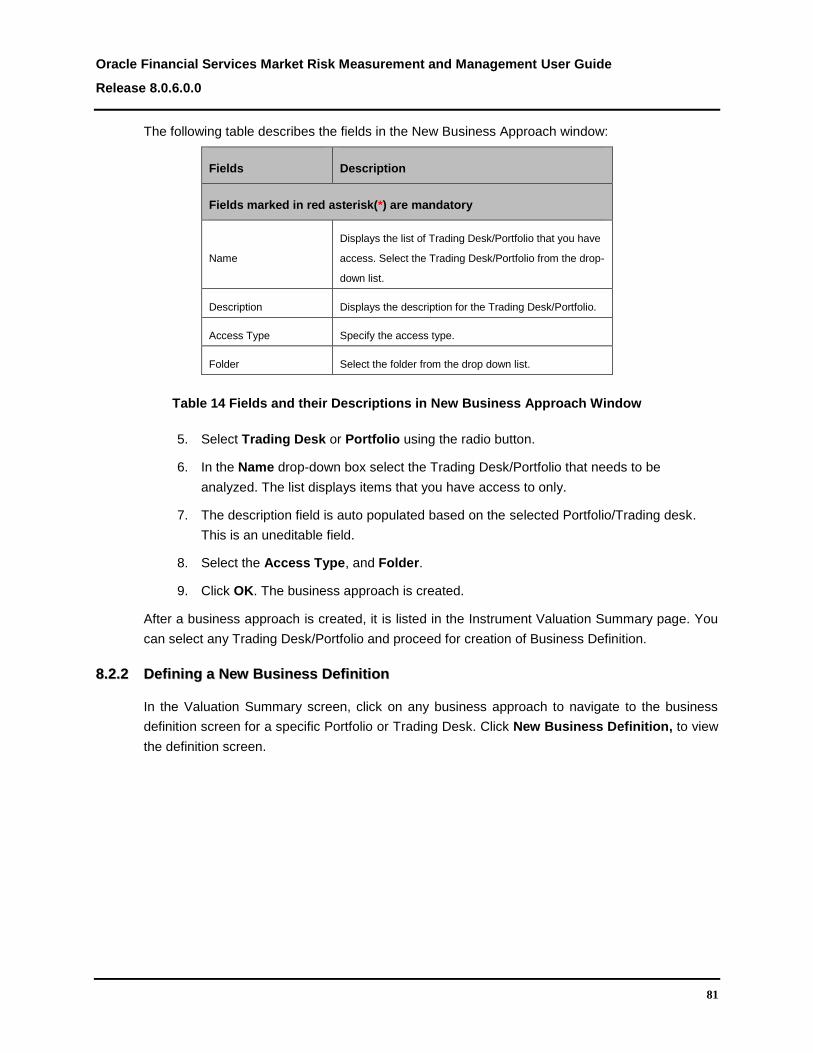
Oracle Financial Services Market Risk Measurement and Management User Guide
Release 8.0.6.0.0
81
The following table describes the fields in the New Business Approach window:
Fields Description
Fields marked in red asterisk(*) are mandatory
Name
Displays the list of Trading Desk/Portfolio that you have
access. Select the Trading Desk/Portfolio from the drop-
down list.
Description Displays the description for the Trading Desk/Portfolio.
Access Type Specify the access type.
Folder Select the folder from the drop down list.
Table 14 Fields and their Descriptions in New Business Approach Window
5. Select Trading Desk or Portfolio using the radio button.
6. In the Name drop-down box select the Trading Desk/Portfolio that needs to be
analyzed. The list displays items that you have access to only.
7. The description field is auto populated based on the selected Portfolio/Trading desk.
This is an uneditable field.
8. Select the Access Type, and Folder.
9. Click OK. The business approach is created.
After a business approach is created, it is listed in the Instrument Valuation Summary page. You
can select any Trading Desk/Portfolio and proceed for creation of Business Definition.
88..22..22 DDeeffiinniinngg aa NNeeww BBuussiinneessss DDeeffiinniittiioonn
In the Valuation Summary screen, click on any business approach to navigate to the business
definition screen for a specific Portfolio or Trading Desk. Click New Business Definition, to view
the definition screen.
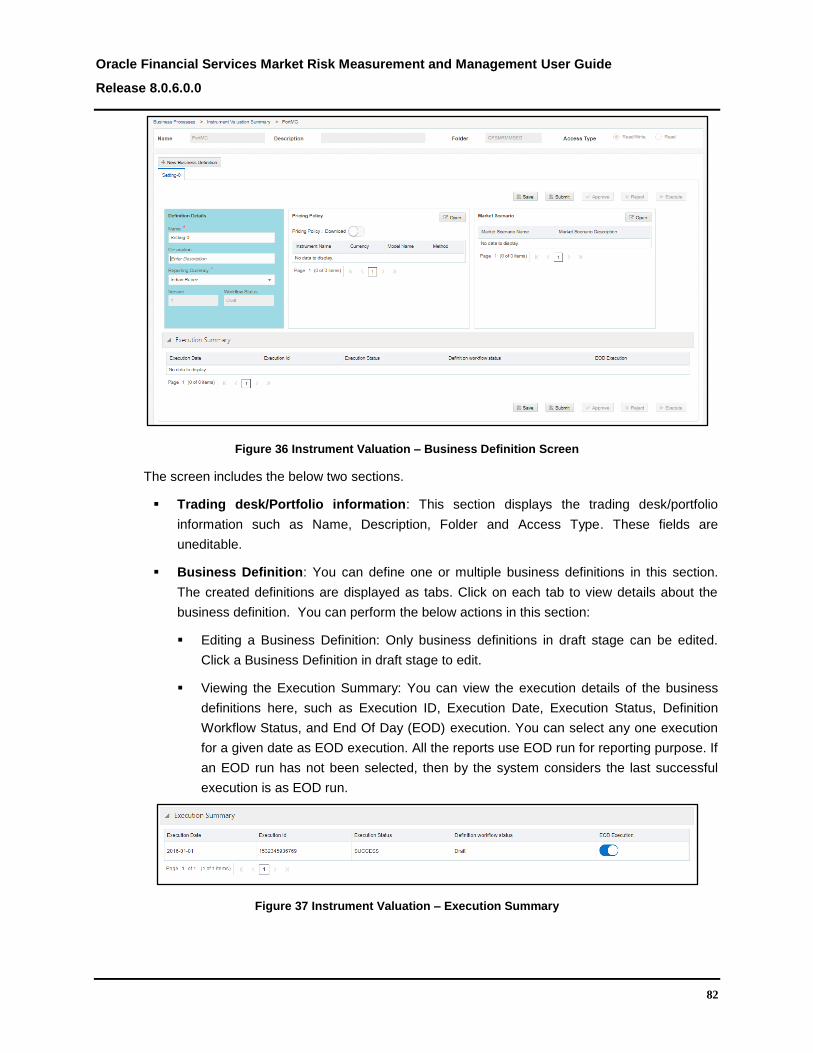
Oracle Financial Services Market Risk Measurement and Management User Guide
Release 8.0.6.0.0
82
Figure 36 Instrument Valuation – Business Definition Screen
The screen includes the below two sections.
Trading desk/Portfolio information: This section displays the trading desk/portfolio
information such as Name, Description, Folder and Access Type. These fields are
uneditable.
Business Definition: You can define one or multiple business definitions in this section.
The created definitions are displayed as tabs. Click on each tab to view details about the
business definition. You can perform the below actions in this section:
Editing a Business Definition: Only business definitions in draft stage can be edited.
Click a Business Definition in draft stage to edit.
Viewing the Execution Summary: You can view the execution details of the business
definitions here, such as Execution ID, Execution Date, Execution Status, Definition
Workflow Status, and End Of Day (EOD) execution. You can select any one execution
for a given date as EOD execution. All the reports use EOD run for reporting purpose. If
an EOD run has not been selected, then by the system considers the last successful
execution is as EOD run.
Figure 37 Instrument Valuation – Execution Summary

Oracle Financial Services Market Risk Measurement and Management User Guide
Release 8.0.6.0.0
83
88..22..22..11 PPrriicciinngg PPoolliiccyy
In this pane, you can select the pricing policy to be used for instrument pricing. Pricing Policy
enables you to select models and methods to be used for pricing the instrument. You can either
download, or define the pricing policy
Download: If you select the Download option, then with all the corresponding instrument
data, you will need to provide the models and methods to be used for pricing.
Figure 38 Instrument Valuation – Pricing policy Download
NOTE: In case for some instrument data the download values have not been provided, then default
models will be used for pricing. The default models are defined in the Business Configuration
section.
Define: The Define option allows you to select the models and methods at the granularity
level of Instrument Type and Currency. The pricing policy of an instrument can be defined
based on the instruments considered for valuation. You can select the models and methods
for the corresponding Instrument type and Currency.

Oracle Financial Services Market Risk Measurement and Management User Guide
Release 8.0.6.0.0
84
Figure 39 Instrument Valuation – Defining a Pricing Policy
To define a pricing policy, follow the below steps:
1. In the Pricing Policy pane, toggle off the Download button.
2. Click Open.
3. Click Add to create a new row in the table.
4. Click on each cell and select inputs for the below fields from the drop-down list.
Instrument Type: Select the instrument type for which you need to provide model
and method.
Currency: Select the currency for which you need to specify model and method.
Model Name: Select the model from the drop down list. Specific list of models are
eligible for specific instrument type. See Annexure D for the list of models and
methods.
Method: Select the method from the drop down list. Specific list of methods are
eligible for specific instrument type. See Annexure D for the list of models and
methods.

Oracle Financial Services Market Risk Measurement and Management User Guide
Release 8.0.6.0.0
85
Figure 40 Instrument Valuation- Defining a Pricing Policy
5. Click Done to save the entries.
NOTE: In case for some instrument type and currency models and methods are not defined then
default models will be used for pricing. The default models are defined in the Business
Configuration section.
88..22..22..22 SScceennaarriioo
In this pane, you can select only the Baseline scenario for execution. The Baseline scenario is
displayed by default and cannot be deleted.
Figure 41 Instrument Valuation - Scenario
To add a scenario, follow the below steps:
1. In the Scenario pane, click Open.
2. Select the required scenarios from the drop-down list, and click Add.

Oracle Financial Services Market Risk Measurement and Management User Guide
Release 8.0.6.0.0
86
NOTE: Baseline scenario is added by default in the Market Scenario drop-down, in addition to the
defined scenarios.
Figure 42 Instrument Valuation – Adding the Baseline Scenario
3. Select the scenario from the Select Market Scenario drop-down.
4. Click Add.
5. Click Done. The scenario is added to the list.
88..22..33 PPrroocceedduurree ffoorr CCrreeaattiinngg aa BBuussiinneessss DDeeffiinniittiioonn iinn IInnssttrruummeenntt VVaalluuaattiioonn
The defined executions are listed in the OFS MRMM Instrument Valuation summary screen. Click
either Portfolio or Trading Desk tabs to view the list. Each business definition is executed as a
separate run. The following table describes the fields in the new business definition window:
Fields Description
Fields marked in red asterisk(*) are mandatory
Name* Enter the name of the business definition.
Description Provide a description for the business definition.
Reporting Currency*
It is the currency in which all the output for given
definition will be computed. Select the currency type
from the drop-down list.
Version Displays the workflow version of the business definition.
Workflow Status Displays the workflow status of the business definition.
Pricing Policy Select the models and methods to be used for
instrument pricing.

Oracle Financial Services Market Risk Measurement and Management User Guide
Release 8.0.6.0.0
87
Fields Description
Fields marked in red asterisk(*) are mandatory
Market Scenario Select the scenario to be executed. The Baseline
scenario is selected by default.
Execution Summary
Displays the execution history of the business
scenarios. Select the execution to be marked as EOD
execution.
Table 15 Fields and their Descriptions in Instrument Valuation-Business Definition Window
Follow the below steps to create a new business definition in Instrument Valuation:
1. Click the business approach from the OFS MRMM Instrument Valuation summary
screen, for which the business definition needs to be created.
2. Click New Business Definition. A new tab is created.
3. Click on the new tab, and provide details in the Name, Description fields.
4. In the Currency field, select the currency type from the drop-down list.
5. In the Pricing Policy pane, select Download or Define. You can Add or Delete a
defined pricing policy. See Pricing Policy for details.
6. In the Scenario pane, select the baseline scenario. See Scenario for details.
7. Click Save and Submit.
8. Click Execute to trigger an adhoc run. A pop up message with a date-time editor is
displayed. Specify the date on which the execution needs to be performed and click
OK. The execution is triggered.

Oracle Financial Services Market Risk Measurement and Management User Guide
Release 8.0.6.0.0
88
9. After executing the Business Definition, select any one execution for a given date as
EOD execution.

Oracle Financial Services Market Risk Measurement and Management User Guide
Release 8.0.6.0.0
89
99 MMaarrkkeett RRiisskk –– HHiissttoorriiccaall SSiimmuullaattiioonn
The Market Risk Historical Simulation module enables you to compute portfolio level metrics
using historical simulation. This chapter includes:
Overview
Creating and Executing a Business Definition
99..11 OOvveerrvviieeww
This module primarily aims to measure the risk of your portfolio and/or trading desk, and deliver
the portfolio granularity metrics using NUMERIX and historical simulation. MRMM Historical
Simulation enables you to compute VaR, Expected Shortfall for regulatory and non-regulatory
purpose and IMA capital charges, and addresses the needs of both regulatory reporting and
internal risk management.
The module provides the following computation:
ES and VaR
Stress calibrated ES
Internally modelled capital charge
Stressed capital add-on
Aggregated Charge
99..22 CCrreeaattiinngg aanndd EExxeeccuuttiinngg aa BBuussiinneessss DDeeffiinniittiioonn
This section elaborates the process of creating a business approach, and executing a business
definition. A business definition allows you to set business specific parameters required for
analysis. You need to define a business approach before creating a business definition.
99..22..11 DDeeffiinniinngg aa BBuussiinneessss AApppprrooaacchh
Business approach enables you to analyze each module from a trading desk or portfolio
perspective. You can define a new business approach and view the existing business approach
from the Market Risk- Historical Simulation Summary screen.

Oracle Financial Services Market Risk Measurement and Management User Guide
Release 8.0.6.0.0
90
Figure 43 Market Risk – Historical Simulation Summary Screen
See Instrument Valuation - Defining a Business Approach for the detailed procedure.
99..22..22 DDeeffiinniinngg aa NNeeww BBuussiinneessss DDeeffiinniittiioonn
In the Market Risk – Historical Simulation Summary screen, click on any business approach to
navigate to the business definition screen for the specific Portfolio or Trading Desk. Click New
Business Definition, to view the definition screen.
Figure 44 Market Risk Historical Simulation – Business Definition Screen
The screen includes the below two sections.
Trading Desk/Portfolio information: It displays the trading desk/portfolio information.
These fields are uneditable.

Oracle Financial Services Market Risk Measurement and Management User Guide
Release 8.0.6.0.0
91
Business Definition: You can define one or multiple business definitions in this section.
The created definitions are displayed as tabs. Click on each tab to view details about the
business definition. You can perform the below actions in this section:
Edit a Business Definition: Only business definitions in draft stage can be edited. Click a
Business Definition in draft stage to edit.
View the Execution Summary: You can view the execution details of the business
definitions here, such as Execution ID, Execution Date, Execution Status, Workflow
Status, and End Of Day (EOD) Execution. You can select any one execution for a given
date as EOD execution. All the reports use EOD run for reporting purpose. If an EOD
run has not been selected, then by the system considers the last successful execution
is as EOD run.
Figure 45 Historical Simulation – Execution Summary
99..22..22..11 RRiisskk FFaaccttoorr RReedduucceedd SSeett IIddeennttiiffiiccaattiioonn
This section enables you to identify the reduced set of risk factors in such a way that it explains
75% of the variation of the full model. The last successful execution date of reduced set
identification is displayed on the reduced set of risk factor pane. You can either define or
download the reduced set.
Download: If you choose to download the reduced set, then reduced set of risk factors should be
provided as download in FSI_MR_PORT_RISK_RED_RSK_FACTR. See Download
Specifications sheet in MoS for details.
Figure 46 Risk Factor Reduced Set Identification - Download
Define: This option enables you to set the risk factor parameters.
NOTE: To compute Stress Calibrated ES of the corresponding business definition, ensure that a valid
Reduced Set ES is available.
Follow the below steps to define the risk factors for reduced set identification:

Oracle Financial Services Market Risk Measurement and Management User Guide
Release 8.0.6.0.0
92
1. Toggle off the download option in the Risk Factor Reduced Set Identification pane.
Figure 47 Risk Factor Reduced Set Identification - Define
2. Click Open, to view the zoom window.
3. Specify the date from the date-time editor.
Provide the number of historical days and select the unit as days, months or years from
the drop-down list.
4. Click Fetch. The risk factor for all the instruments is fetched for the selected execution
date. Fetch is background process which identifies the risk factors of the instrument for
selected date. Once fetch is clicked you will have to click on refresh. If risk factors for
given dates are already fetched then you can skip fetch and directly click on refresh
button.
5. Click Refresh. Refresh will refresh the screen with already fetched risk factor for
selected date.
Figure 48 Defining Risk Factor Reduced Set

Oracle Financial Services Market Risk Measurement and Management User Guide
Release 8.0.6.0.0
93
6. Select the check box for risk factors to be considered for reduced set.
7. Validate the reduced risk factor set after reduced set identification. OFS MRMM
validates the reduced risk factor set using the below steps:
a. The system fetches the Expected Shortfall for full set and current observation
period [ES (F, C)] amount for historical period. System expects that ES for full set is
already computed for all the dates in historical period.
b. Computes the value for Expected Shortfall for reduced set and current observation
period [ES(R, C)] for the specified historical period. To compute ES(R, C), the VaR
Model Parameter and Pricing Policy specified in business definition is considered.
c. For each date of historical period the percentage of ES(R,C) with respect to
ES(F,C) is computed by using the below formula:
𝑅𝑒𝑑𝑢𝑐𝑒𝑑 𝑠𝑒𝑡 𝑃𝑒𝑟𝑐𝑒𝑛𝑡𝑎𝑔𝑒 =𝐸𝑆(𝑅,𝐶)
𝐸𝑆(𝐹,𝐶)
d. Reduced Set Identified is Valid, if ES of the reduced set of risk factors is greater
than equal to 75% of the fully specified ES model on average measured over the
historical period as specified by user.
𝐴𝑣𝑒𝑟𝑎𝑔𝑒 𝑜𝑓 "Reduced set Percentage" ≥ 0.75
𝑊ℎ𝑒𝑟𝑒,
𝐴𝑣𝑒𝑟𝑎𝑔𝑒 𝑖𝑠 𝑐𝑜𝑚𝑝𝑢𝑡𝑒𝑑 𝑜𝑣𝑒𝑟 ℎ𝑖𝑠𝑡𝑜𝑟𝑖𝑐𝑎𝑙 𝑝𝑒𝑟𝑖𝑜𝑑 𝑠𝑝𝑒𝑐𝑖𝑓𝑖𝑒𝑑 𝑏𝑦 𝑢𝑠𝑒𝑟
Note:
OFS MRMM skips the dates within historical period where ES full set is not available.
Such dates are not considered for computing average.
8. Click Save.
9. Click Done to return to the business definition window.
99..22..22..22 SSttrreessss PPeerriioodd IIddeennttiiffiiccaattiioonn
Stress period is identified as a 12-month period of stress since 2007 till execution date in which
the portfolio experiences the largest loss. This section enables you to identify the stress period for
a corresponding portfolio or trading desk.
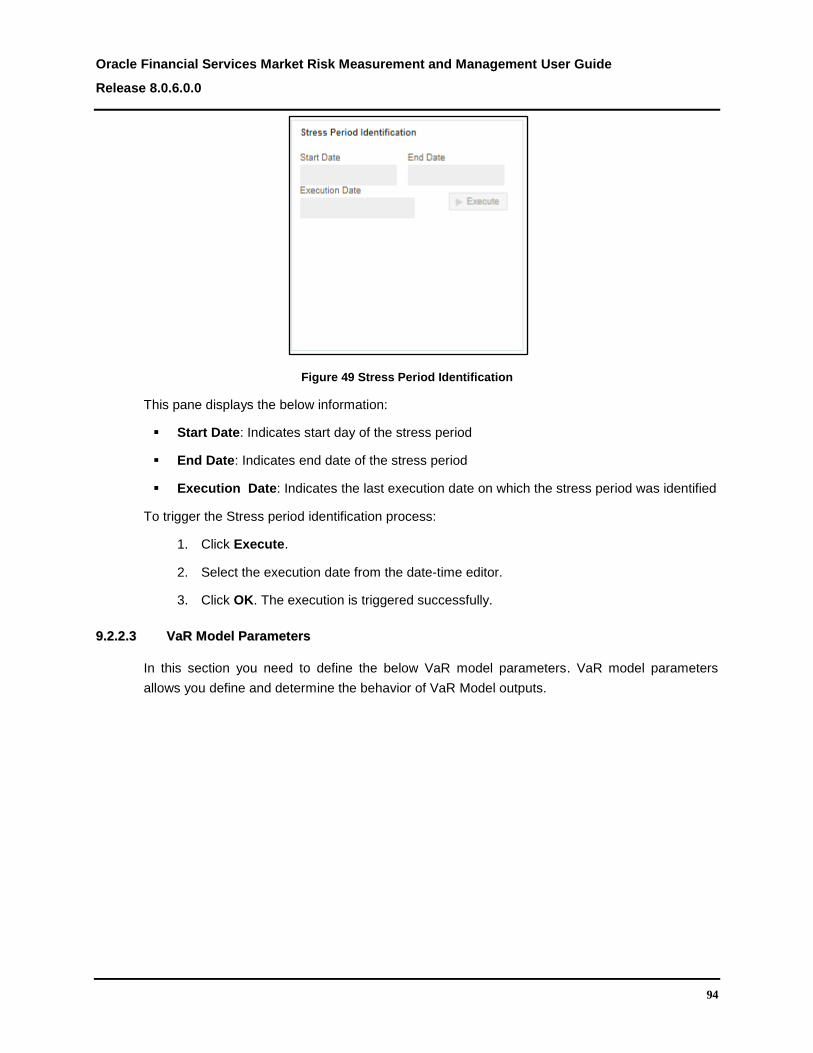
Oracle Financial Services Market Risk Measurement and Management User Guide
Release 8.0.6.0.0
94
Figure 49 Stress Period Identification
This pane displays the below information:
Start Date: Indicates start day of the stress period
End Date: Indicates end date of the stress period
Execution Date: Indicates the last execution date on which the stress period was identified
To trigger the Stress period identification process:
1. Click Execute.
2. Select the execution date from the date-time editor.
3. Click OK. The execution is triggered successfully.
99..22..22..33 VVaaRR MMooddeell PPaarraammeetteerrss
In this section you need to define the below VaR model parameters. VaR model parameters
allows you define and determine the behavior of VaR Model outputs.

Oracle Financial Services Market Risk Measurement and Management User Guide
Release 8.0.6.0.0
95
Figure 50 VaR Model Parameters
Horizon: It is the time horizon over which you can compute the VaR number output. Specify
the horizon in terms of days.
Confidence: Confidence is the percentage value that you need to define the VaR numbers.
Specify the confidence value required for calculating the output.
Current Observation Period: This is the current historical observation period to be
considered for computation of VaR. The current historical period starts from execution date
till the period specified in this column. Observation period is computed relative to execution
date.
Observation Period Unit: Specify the current observation period in terms of calendar days,
months or years from the drop-down list.
Differential Method: This is interpolation method used for interpolating missing values in
historical data. This parameter indicates how to construct the simulated market from
execution date’s market. You can select Absolute, or Relative. The following formula
explains the computation of scenario values under each method.
𝐴𝑏𝑠𝑜𝑙𝑢𝑡𝑒 𝑑𝑖𝑓𝑓𝑒𝑟𝑒𝑛𝑐𝑒 = 𝑅𝐹𝑡 − 𝑅𝐹𝑡−1
𝑅𝐹𝑆𝑐𝑒𝑛𝑎𝑟𝑖𝑜 𝑉𝑎𝑙𝑢𝑒 = 𝑅𝐹𝐸𝑥𝑒𝑐𝑢𝑡𝑖𝑜𝑛 𝑑𝑎𝑡𝑒 + 𝐴𝑏𝑠𝑜𝑙𝑢𝑡𝑒 𝑑𝑖𝑓𝑓𝑒𝑟𝑒𝑛𝑐𝑒
𝑅𝑒𝑙𝑎𝑡𝑖𝑣𝑒 𝑑𝑖𝑓𝑓𝑒𝑟𝑒𝑛𝑐𝑒 = (𝑅𝐹𝑡/𝑅𝐹𝑡−1) − 1
𝑅𝐹𝑆𝑐𝑒𝑛𝑎𝑟𝑖𝑜 𝑉𝑎𝑙𝑢𝑒 = 𝑅𝐹𝐸𝑥𝑒𝑐𝑢𝑡𝑖𝑜𝑛 𝑑𝑎𝑡𝑒 (1 + 𝑅𝑒𝑙𝑎𝑡𝑖𝑣𝑒 𝑑𝑖𝑓𝑓𝑒𝑟𝑒𝑛𝑐𝑒)
Where, RF is the risk factor, and t is the number of execution days.

Oracle Financial Services Market Risk Measurement and Management User Guide
Release 8.0.6.0.0
96
99..22..22..44 AAnnaallyyzzee BByy
In this pane you can select the dimensions for analyzing the VaR and ES numbers. Analyze By
enables you to view VaR outputs at different granularity. For a selected dimension the application
creates the tree structure of its nodes and provide the output.
For Example, Instrument Type and Currency is selected in Analyze By in the same sequence. If a
portfolio has two instrument types such as Zero Coupon Bond and Equity Forward, and has two
currencies such as INR and USD. Then the application generates VaR numbers at following
granularity.
VaR at Group level
VaR for Zero Coupon Bond with both currency
VaR for Equity Forward with both currency
VaR for Zero Coupon Bond and INR
VaR for Zero Coupon Bond and USD
VaR for Equity Forward and INR
VaR for Equity Forward and USD
You can change the sequence of selected dimension by using drag and drop feature of the user
interface.
Figure 51 Analyze By
99..22..22..55 OOuuttppuutt MMeettrriiccss
This section allows you to select the list of desired outputs mentioned below.

Oracle Financial Services Market Risk Measurement and Management User Guide
Release 8.0.6.0.0
97
Figure 52 Output Metrics
The outputs are:
ES and VaR: This option calculates the Expected Shortfall (ES) and Value at Risk (VaR)
using the current observation period.
VaR is computed as maximum amount of potential loss that can occur for given confidence
and time horizon.
ES is computed using the following equation:
𝐸𝑆 = √(𝐸𝑆𝑇(𝑃))2
+ ∑ (𝐸𝑆𝑇(𝑃, 𝑗)√(𝐿𝐻𝑗 − 𝐿𝐻𝑗−1)
𝑇)
2
𝑗≥2
Where,
ES is the regulatory liquidity-adjusted expected shortfall;
T is the length of the base horizon;
𝐸𝑆𝑇(𝑃) is the expected shortfall at horizon T of a portfolio P;
𝐸𝑆𝑇(𝑃, 𝑗) is the expected shortfall at horizon T of a portfolio P with respect to shocks for
subset of risk factors Q (j), with all other risk factors held constant;
Q (j) is the subset of risk factors whose liquidity horizon is at least as long as 𝐿𝐻𝑗
𝐿𝐻𝑗 is the liquidity horizon j as specified by in the Liquidity Horizon user interface
Stress Calibrated for ES: This selection provides you the option to identify the stress
period, or select the system identified stress period.
If you choose to define the observation period, toggle the Identified Period button and
provide the Observation Start Date and Observation End Date.

Oracle Financial Services Market Risk Measurement and Management User Guide
Release 8.0.6.0.0
98
If you select System Identified Period, then the stress period start and end date
computed in the Stress Period Identification grid will be considered for computation.
Stress calibrated ES is computed using following equation
Stress calibrated ES = ES𝑅,𝑆 ES𝐹,𝐶
ES𝑅,𝐶
Where,
ES𝑅,𝑆 is Expected short fall for reduced set of risk factor and stress observation period
ES𝐹,𝐶 is Expected short fall for full set of risk factor and current observation period
ES𝑅,𝐶 is Expected short fall for reduced set of risk factor and current observation period
NOTE: For Reduced set ES Metrix calculation (ES(R, C)), reduced set Validation Result must have
Valid status.
Internally Modelled Capital Charge: If you select this option, specify the Relative weight
assigned to the firms internal model. This output is required to compute Internally Modelled
Capital Charge (IMCC).
IMCC is computed using following equation:
𝐼𝑀𝐶𝐶 = 𝜌 (𝐼𝑀𝐶𝐶(𝐶)) + (1 − 𝜌) (∑ 𝐼𝑀𝐶𝐶(𝐶𝑖)
𝑅
𝑖=1
)
Where,
𝐼𝑀𝐶𝐶(𝐶) is Stress calibrated ES
𝐼𝑀𝐶𝐶(𝐶𝑖) is stress calibrated ES with respect to shocks for broad risk factors class i with
all other risk factor held constant.
i is broad regulatory risk classes: interest rate risk, equity risk, foreign exchange risk,
commodity risk and credit spread risk
𝜌 is the relative weight assigned to the firm’s internal model
Stress Capital Add-on Charge: Select this option to set computation of stress scenario
capital charge (SES) with execution.
Stress capital add-on is computed using following equation
𝑆𝐸𝑆 = √∑ 𝑆𝐸𝑆𝑁𝑀,𝑖
𝐿
𝑖=1
+ ∑ 𝑆𝐸𝑆𝑁𝑀,𝑗
𝐾
𝑗=1
Where,
L is non-modellable idiosyncratic risk factor
K is non-modellable non idiosyncratic risk factor

Oracle Financial Services Market Risk Measurement and Management User Guide
Release 8.0.6.0.0
99
𝑆𝐸𝑆𝑁𝑀,𝑋 is the stress scenario capital charge for non-modellable risk factor X, with
respect to shock for X risk factor with all other risk factors held constant
Aggregated Charge: Select this option to set computation of Aggregated Charge with
execution. Computation of aggregated charge requires a multiplier. Multiplier is the number
which is associated with number of exception arrived in Model Validation. Select the
business definition defined in Model Validation module from the drop down box, to add a
multiplier. If not selected system will take 1.5 as default value of multiplier.
Aggregated Charge is computed using following equation
𝐴𝑔𝑔𝑟𝑒𝑔𝑎𝑡𝑒𝑑 𝐶ℎ𝑎𝑟𝑔𝑒 = 𝑚𝑎𝑥{𝐼𝑀𝐶𝐶𝑡−1 + 𝑆𝐸𝑆𝑡−1; 𝑚𝑐 ∙ 𝐼𝑀𝐶𝐶𝑎𝑣𝑔 + 𝑆𝐸𝑆𝑎𝑣𝑔}
Where,
IMCC and SES average is average taken over 60-days
𝑚𝑐 is multiplier derived from backtesting model.
See Exception Probability and Multiplier for details.
Validation RS Risk Factor Flag: Selecting this option enables you to check the validity of
reduced set with execution. Validation logic is as specified in Risk Factor Reduced Set
Identification.
NOTE: If there is any dependency between two outputs, then the application auto selects the related
output. For example, if you select Internally Modelled Capital Charge, then the application
auto selects ES and VaR and Stress Calibrated for ES.
99..22..22..66 PPrriicciinngg PPoolliiccyy
It allows you to select the pricing policy models and methods to be used for instrument pricing.
You can either download, or define the pricing policy. See section Pricing Policy in Instrument
Valuation chapter for details.
99..22..33 PPrroocceedduurree ffoorr CCrreeaattiinngg aa BBuussiinneessss DDeeffiinniittiioonn iinn MMaarrkkeett RRiisskk HHiissttoorriiccaall SSiimmuullaattiioonn
The defined executions are listed in the Market Risk Historical Simulation summary screen. Click
either Portfolio or Trading Desk tabs to view the list. Each Business Definition is executed as a
separate run. The new business definition screen is shown below:

Oracle Financial Services Market Risk Measurement and Management User Guide
Release 8.0.6.0.0
100
Figure 53 Market Risk Historical Simulation – New Business Definition
The following table describes the fields in the business definition window:
Fields Description
Fields marked in red asterisk(*) are mandatory
Name* Enter the name of the business definition.
Description Provide a description for the business definition.
Reporting Currency*
It is the currency in which all the output for given
definition will be computed. Select the currency type
from the drop-down list.
Version Displays the workflow version of the business definition.
Workflow Status Displays the workflow status of the business definition.
Risk Factor Reduced
Set Identification
Displays the last successful execution date of risk factor
identification.
Select whether you want to download or define the risk
factor parameters.

Oracle Financial Services Market Risk Measurement and Management User Guide
Release 8.0.6.0.0
101
Fields Description
Fields marked in red asterisk(*) are mandatory
Horizon Specify the horizon in terms of days.
Confidence (%) Specify the confidence level for computation.
Current Observation
Period
Specify the current observation period for computation
of VaR
Observation Period Unit Specify the unit for current observation period in terms
of days, months or year
Differential Method Select the differential method from the drop-down list.
Analyze By Select dimensions for analyzing the VaR and ES
numbers from the drop-down list.
Stress Period
Identification
Displays the start data and end date of the stress
period. Specify the start and end date for stress period
execution.
Output Metrics Select the list of desired outputs.
Pricing Policy Select the models and methods to be used for
instrument pricing.
Execution Summary
Displays the execution history of the business
scenarios. Select the execution to be marked as EOD
execution.
Table 16 Fields and their Descriptions in Historical Simulation-Business Definition Window
Follow the below steps to create a new business definition in Market Risk-Historical Simulation:
1. Click the business approach from the Market Risk-Historical Simulation summary
screen, for which the business definition needs to be created.
2. Click New Business Definition. A new tab is created.
3. Click on the new tab, and provide details in the Name, Description fields.
4. In the Currency field, select the currency type from the drop-down list.
5. Identify the reduced set of risk factors. See Risk Factor Reduced Set Identification for
details.
6. Provide stress period start and end date and execute Stress Factor Identification.
See Stress period Identification for details.

Oracle Financial Services Market Risk Measurement and Management User Guide
Release 8.0.6.0.0
102
7. Provide details for the fields Horizon, Confidence, and Current Observation Period
in VaR Model Parameters pane. See VaR Model Parameters for details.
8. Select the dimensions in the Analyze By pane. See Analyze By for details.
9. Select Download or Define in the Pricing Policy pane, and specify models and
methods to be used for instrument pricing. See Pricing Policy for details.
10. Select the list of desired outputs in the Output Metrics pane. See Output Metrics for
details.
11. Click Save and Submit.
12. Click Execute to trigger an adhoc run. A pop up message with a date-time editor is
displayed. Specify the date on which the execution needs to be performed and click
OK. The execution is triggered.
13. After executing the Business Definition, select any one execution for a given date as EOD
execution.

Oracle Financial Services Market Risk Measurement and Management User Guide
Release 8.0.6.0.0
103
1100 MMaarrkkeett RRiisskk-- MMoonnttee CCaarrlloo SSiimmuullaattiioonn
The Market Risk- Monte Carlo Simulation module enables you to derive counterparty risk
measures and Monte-Carlo VaR at counterparty and trade level. This chapter includes:
Overview
Creating and Executing a Business Definition
1100..11 OOvveerrvviieeww
The module enables the application to calculate counterparty risk quantities, which provide a
measure of the adjustments that should be made to the value of deals, to predict the possibility of
a counterparty defaulting.
Valuation (XVA) adjustments such as Credit Valuation Adjustment (CVA), Debt Valuation
Adjustment (DVA), Funding Valuation Adjustment (FVA). CVA, DVA and FVA provide a
single value which can be used as an adjustment to the total value of a set of positions in a
portfolio, taking into account collateral that may be posted between the counterparties as
determined by the Credit Support Annex (CSA) agreements.
Future exposures such as Potential Future Exposure (PFE), Expected Positive Exposure
EPE, Expected Negative Exposure (ENE), and Expected Exposure (EE). They provide a
measure of the potential loss or gain due to future market changes and are reported as a
table of values for user-specified future observation dates.
Trade level present value (PV) and Value-at-Risk (VaR)
Counterparty risk values are portfolio-level measures such as values for groups of trades
instead of as single quantities for each trade. Future exposures are computed using
American Monte Carlo techniques, for a user-specified number of Monte Carlo paths and
set of future observation dates. To do this, a global hybrid model must be constructed and
used by all the trades in the simulation. The hybrid model consists of a set of individual
factor models that simulate the dynamics of underlying’s of the selected trades.
The inputs required to set up a calculation of counterparty risk are:
Definitions for all the counterparties that will be used by the trades in the calculation.
Each trade must identify which counterparty, netting set and which CSA i.e. sub-netting
set it is associated with, and be able to identify the list of underlying’s used by that
trade.
Counterparties are organized into the following hierarchy for aggregation of results:
Parent counterparty: At the top level of the hierarchy, there is a list of separate
counterparty entities. Each Counterparty is considered as a separate entity.

Oracle Financial Services Market Risk Measurement and Management User Guide
Release 8.0.6.0.0
104
Child counterparty: Within each parent counterparty, there is a list of one or multiple
child counterparties. Each child has a unique name within that parent counterparty.
Netting Agreement or Sets: Under each child counterparty there are one or multiple
netting sets. Each netting sets has an unique name within that counterparty, and
defines the level at which all the counterparty risk measures are calculated directly from
the results of netting exposures from different trades, after accounting for the
collaterals. At least one netting set must be defined for each counterparty.
Sub-Netting Agreement or Margin Set or CSA: At the lowest level of the hierarchy,
under each netting set there can be a set of margin sets. Each margin set has a unique
name within that netting set, and it is at this level that the individual parameters that
define the CSA used to calculate collateral exchange are defined. This allows you to
define separate parameters for subsets of trades that must have specialized collateral
calculation rules, while still allowing the net result of exposures and collateral from
those trades to be offset or netted with exposures from other sets of trades under the
same netting set. It is also possible to define a margin set to take into account those
trades that are not collateralized; these trades should be placed in a margin set named
"Residual".
1100..22 CCrreeaattiinngg aanndd EExxeeccuuttiinngg aa BBuussiinneessss DDeeffiinniittiioonn
This section elaborates the process of creating a business approach, and executing a business
definition. A business definition allows you to set business specific parameters required for
analysis. You need to define a business approach before creating a business definition.
1100..22..11 DDeeffiinniinngg aa BBuussiinneessss AApppprrooaacchh
Business approach enables you to analyze each module from a trading desk or portfolio
perspective. You can define a new business approach and view the existing business approach
from the Market Risk- Monte Carlo Simulation Summary screen.
Figure 54 Market Risk – Monte Carlo Simulation Summary Screen
See Instrument Valuation - Defining a Business Approach for the detailed procedure.

Oracle Financial Services Market Risk Measurement and Management User Guide
Release 8.0.6.0.0
105
1100..22..22 DDeeffiinniinngg aa NNeeww BBuussiinneessss DDeeffiinniittiioonn
In the Market Risk – Monte Carlo Simulation Summary screen, click on any business approach to
navigate to the business definition screen for the specific Portfolio or Trading Desk. Click New
Business Definition, to view the definition screen.
Figure 55 Market Risk Monte Carlo Simulation – Business Definition Screen
The screen includes the below two sections.
Trading Desk/Portfolio information: It displays the trading desk/portfolio information.
These fields are un-editable.
Business Definition: You can define one or multiple business definitions in this section.
The created definitions are displayed as tabs. Click on each tab to view details about the
business definition. You can perform the below actions in this section:
Edit a Business Definition: Only business definitions in draft stage can be edited. Click a
Business Definition in draft stage to edit.
View the Execution Summary: You can view the execution details of the business
definitions here, such as Execution ID, Execution Date, Execution Status, Workflow
Status, and End of Day (EOD) Execution. You can select any one execution for a given
date as EOD execution. All the reports use EOD run for reporting purpose. If an EOD
run has not been selected, then by the system considers the last successful execution
is as EOD run.

Oracle Financial Services Market Risk Measurement and Management User Guide
Release 8.0.6.0.0
106
Figure 56 Monte Carlo Simulation – Execution Summary
1100..22..22..11 PPuurrppoossee
This section enables you to select the various computation measures in a business definition.
You can select one or multiple purposes.
Figure 57 Monte Carlo Simulation – Purpose
You can select both CVA and PFE or Monte Carlo VaR. Each of the subsequent inputs will be
enabled or disabled based on the selected purpose.
CVA Measures
PFE Measures
Monte-Carlo VaR
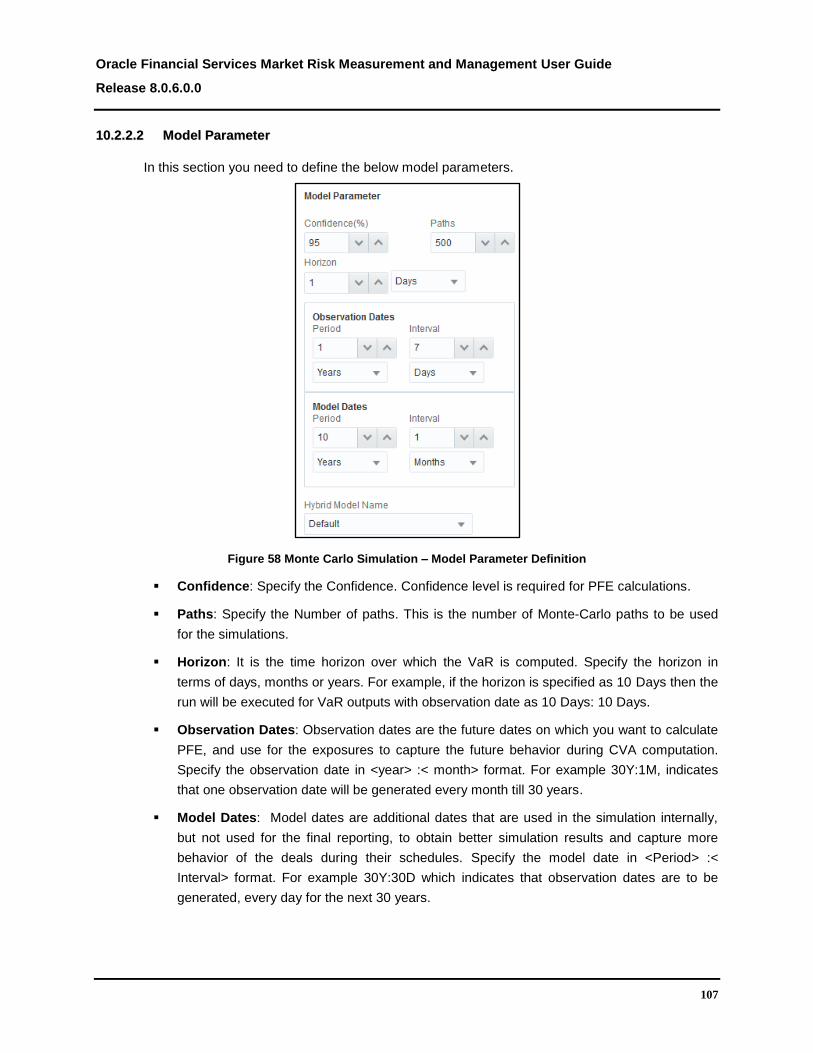
Oracle Financial Services Market Risk Measurement and Management User Guide
Release 8.0.6.0.0
107
1100..22..22..22 MMooddeell PPaarraammeetteerr
In this section you need to define the below model parameters.
Figure 58 Monte Carlo Simulation – Model Parameter Definition
Confidence: Specify the Confidence. Confidence level is required for PFE calculations.
Paths: Specify the Number of paths. This is the number of Monte-Carlo paths to be used
for the simulations.
Horizon: It is the time horizon over which the VaR is computed. Specify the horizon in
terms of days, months or years. For example, if the horizon is specified as 10 Days then the
run will be executed for VaR outputs with observation date as 10 Days: 10 Days.
Observation Dates: Observation dates are the future dates on which you want to calculate
PFE, and use for the exposures to capture the future behavior during CVA computation.
Specify the observation date in <year> :< month> format. For example 30Y:1M, indicates
that one observation date will be generated every month till 30 years.
Model Dates: Model dates are additional dates that are used in the simulation internally,
but not used for the final reporting, to obtain better simulation results and capture more
behavior of the deals during their schedules. Specify the model date in <Period> :<
Interval> format. For example 30Y:30D which indicates that observation dates are to be
generated, every day for the next 30 years.
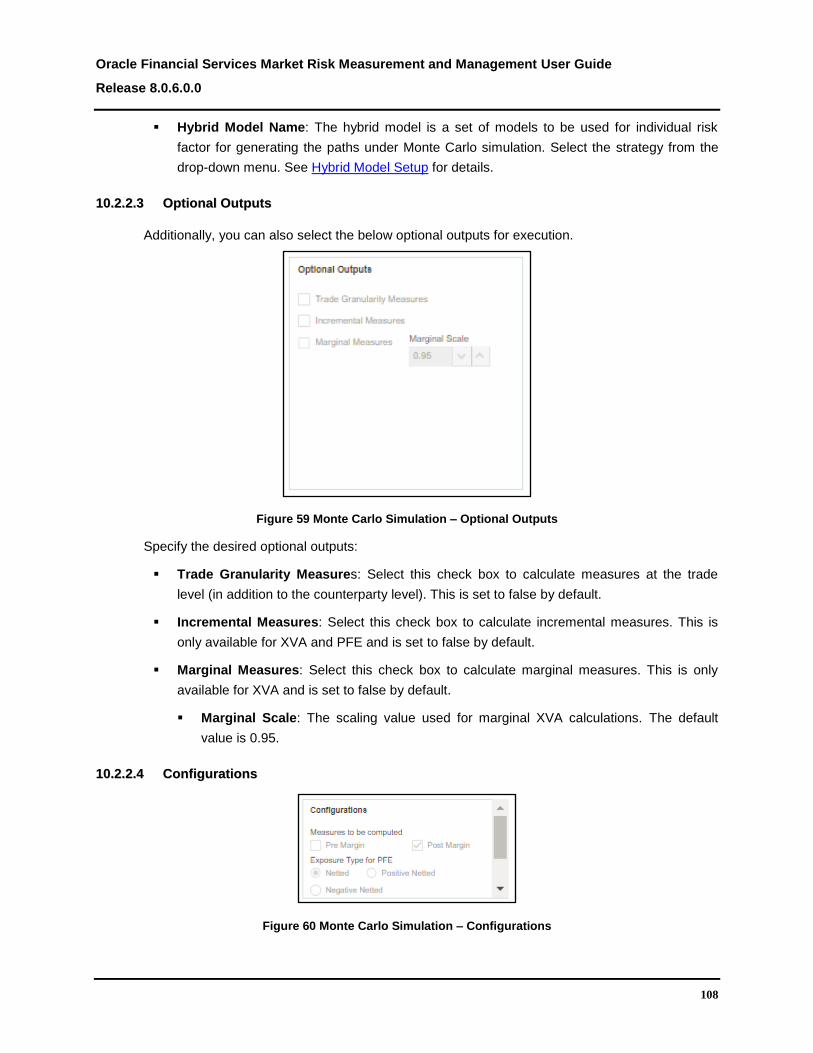
Oracle Financial Services Market Risk Measurement and Management User Guide
Release 8.0.6.0.0
108
Hybrid Model Name: The hybrid model is a set of models to be used for individual risk
factor for generating the paths under Monte Carlo simulation. Select the strategy from the
drop-down menu. See Hybrid Model Setup for details.
1100..22..22..33 OOppttiioonnaall OOuuttppuuttss
Additionally, you can also select the below optional outputs for execution.
Figure 59 Monte Carlo Simulation – Optional Outputs
Specify the desired optional outputs:
Trade Granularity Measures: Select this check box to calculate measures at the trade
level (in addition to the counterparty level). This is set to false by default.
Incremental Measures: Select this check box to calculate incremental measures. This is
only available for XVA and PFE and is set to false by default.
Marginal Measures: Select this check box to calculate marginal measures. This is only
available for XVA and is set to false by default.
Marginal Scale: The scaling value used for marginal XVA calculations. The default
value is 0.95.
1100..22..22..44 CCoonnffiigguurraattiioonnss
Figure 60 Monte Carlo Simulation – Configurations

Oracle Financial Services Market Risk Measurement and Management User Guide
Release 8.0.6.0.0
109
The application enables you to specify the following configurations:
Measures to be computed: Select pre-margin exposure or post-margin exposures to
calculate the counterparty measures. The default value is Post-Margin.
Exposure type for PFE: Select the types of exposures to be used for calculating PFE from
the below options:
Netted: It is the sum of pre-margin or post-margin exposures.
Positive Netted: It is the sum of positive exposures calculated at the netting set level.
Negative Netted: It is the sum of negative exposures calculated at the netting set level.
Align Margin Dates with Observation Dates: This option enables you to align the margin
dates of counterparty with the observation dates provided in model parameters. The default
values is Yes.
1100..22..22..55 PPrriicciinngg PPoolliiccyy
It allows you to select the pricing policy models and methods to be used for instrument pricing.
You can either download, or define the pricing policy. See section Pricing Policy in Instrument
Valuation chapter for details.
1100..22..33 PPrroocceedduurree ffoorr CCrreeaattiinngg aa BBuussiinneessss DDeeffiinniittiioonn iinn MMaarrkkeett rriisskk MMoonnttee--CCaarrlloo
SSiimmuullaattiioonn
The defined executions are listed in the Market Risk Monte Carlo Simulation summary screen.
Click either Portfolio or Trading Desk tabs to view the list. Each Business Definition is executed
as a separate run. The new business definition screen is shown below:
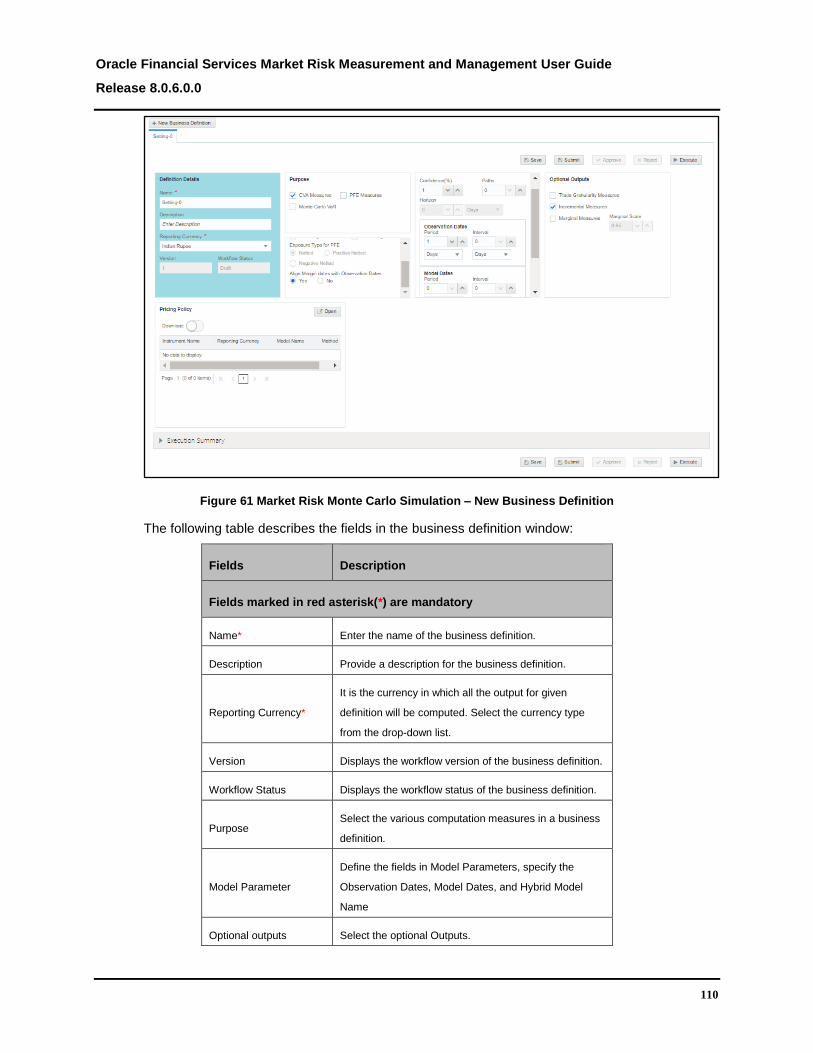
Oracle Financial Services Market Risk Measurement and Management User Guide
Release 8.0.6.0.0
110
Figure 61 Market Risk Monte Carlo Simulation – New Business Definition
The following table describes the fields in the business definition window:
Fields Description
Fields marked in red asterisk(*) are mandatory
Name* Enter the name of the business definition.
Description Provide a description for the business definition.
Reporting Currency*
It is the currency in which all the output for given
definition will be computed. Select the currency type
from the drop-down list.
Version Displays the workflow version of the business definition.
Workflow Status Displays the workflow status of the business definition.
Purpose Select the various computation measures in a business
definition.
Model Parameter
Define the fields in Model Parameters, specify the
Observation Dates, Model Dates, and Hybrid Model
Name
Optional outputs Select the optional Outputs.
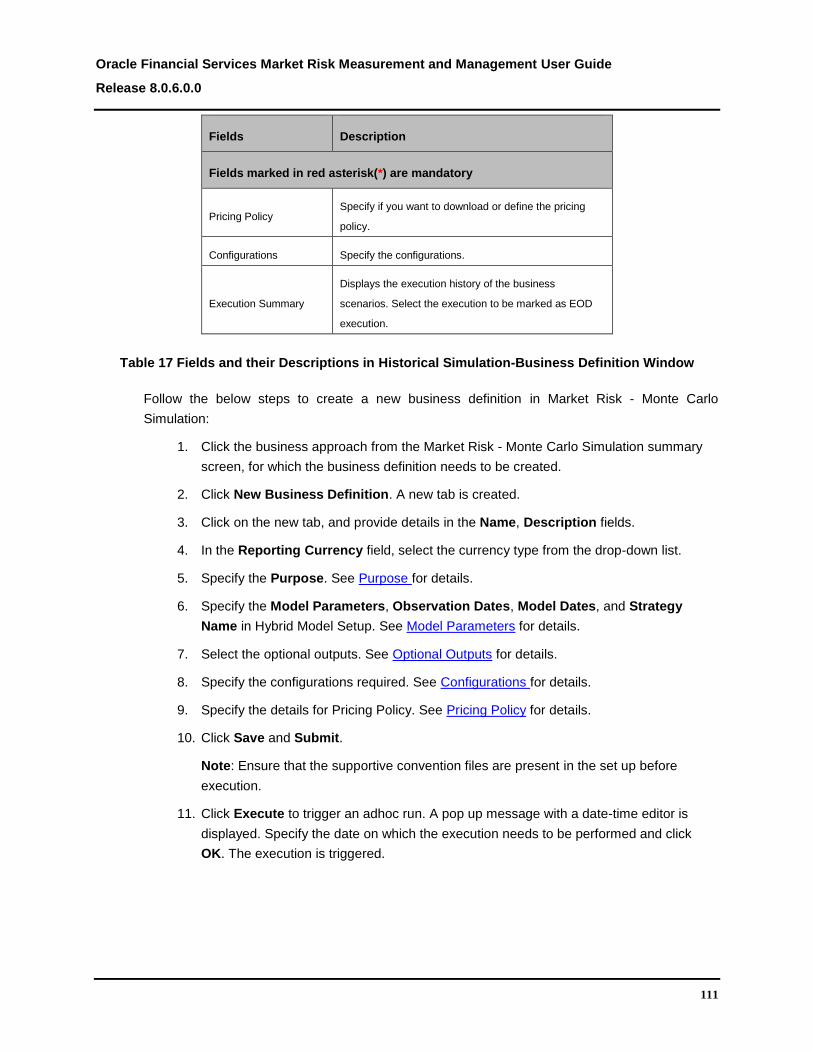
Oracle Financial Services Market Risk Measurement and Management User Guide
Release 8.0.6.0.0
111
Fields Description
Fields marked in red asterisk(*) are mandatory
Pricing Policy Specify if you want to download or define the pricing
policy.
Configurations Specify the configurations.
Execution Summary
Displays the execution history of the business
scenarios. Select the execution to be marked as EOD
execution.
Table 17 Fields and their Descriptions in Historical Simulation-Business Definition Window
Follow the below steps to create a new business definition in Market Risk - Monte Carlo
Simulation:
1. Click the business approach from the Market Risk - Monte Carlo Simulation summary
screen, for which the business definition needs to be created.
2. Click New Business Definition. A new tab is created.
3. Click on the new tab, and provide details in the Name, Description fields.
4. In the Reporting Currency field, select the currency type from the drop-down list.
5. Specify the Purpose. See Purpose for details.
6. Specify the Model Parameters, Observation Dates, Model Dates, and Strategy
Name in Hybrid Model Setup. See Model Parameters for details.
7. Select the optional outputs. See Optional Outputs for details.
8. Specify the configurations required. See Configurations for details.
9. Specify the details for Pricing Policy. See Pricing Policy for details.
10. Click Save and Submit.
Note: Ensure that the supportive convention files are present in the set up before
execution.
11. Click Execute to trigger an adhoc run. A pop up message with a date-time editor is
displayed. Specify the date on which the execution needs to be performed and click
OK. The execution is triggered.

Oracle Financial Services Market Risk Measurement and Management User Guide
Release 8.0.6.0.0
112
12. After executing the Business Definition, select any one execution for a given date as EOD
execution.
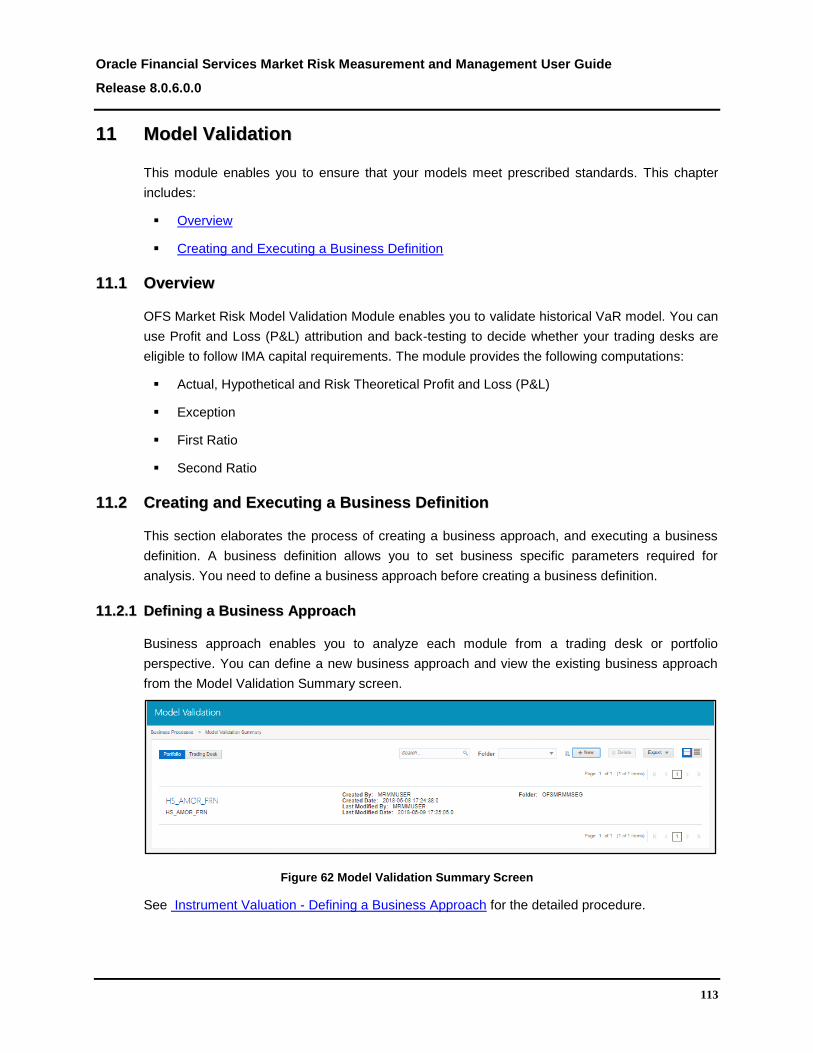
Oracle Financial Services Market Risk Measurement and Management User Guide
Release 8.0.6.0.0
113
1111 MMooddeell VVaalliiddaattiioonn
This module enables you to ensure that your models meet prescribed standards. This chapter
includes:
Overview
Creating and Executing a Business Definition
1111..11 OOvveerrvviieeww
OFS Market Risk Model Validation Module enables you to validate historical VaR model. You can
use Profit and Loss (P&L) attribution and back-testing to decide whether your trading desks are
eligible to follow IMA capital requirements. The module provides the following computations:
Actual, Hypothetical and Risk Theoretical Profit and Loss (P&L)
Exception
First Ratio
Second Ratio
1111..22 CCrreeaattiinngg aanndd EExxeeccuuttiinngg aa BBuussiinneessss DDeeffiinniittiioonn
This section elaborates the process of creating a business approach, and executing a business
definition. A business definition allows you to set business specific parameters required for
analysis. You need to define a business approach before creating a business definition.
1111..22..11 DDeeffiinniinngg aa BBuussiinneessss AApppprrooaacchh
Business approach enables you to analyze each module from a trading desk or portfolio
perspective. You can define a new business approach and view the existing business approach
from the Model Validation Summary screen.
Figure 62 Model Validation Summary Screen
See Instrument Valuation - Defining a Business Approach for the detailed procedure.

Oracle Financial Services Market Risk Measurement and Management User Guide
Release 8.0.6.0.0
114
1111..22..22 DDeeffiinniinngg aa NNeeww BBuussiinneessss DDeeffiinniittiioonn
In the Model Validation Summary screen, click on any business approach to navigate to the
business definition screen for that Portfolio/Trading Desk. Click New Business Definition, to
view the definition screen.
Figure 63 Model Validation – Business Definition Screen
The screen includes the below two sections.
Trading desk/Portfolio information: It displays the trading desk/portfolio information.
These fields are uneditable.
Business Definition: You can define one or multiple business definitions in this section.
The created definitions are displayed as tabs. Click on each tab to view details about the
business definition. You can perform the below actions in this section:
Edit a Business Definition: Only business definitions in draft stage can be edited. Click a
Business Definition in draft stage to edit.
View the Execution Summary: You can view the execution details of the business
definitions here, such as Execution ID, Execution Date, Execution Status, Workflow
Status, and End Of Day (EOD) Execution. You can select any one execution for a given
date as EOD execution. All the reports use EOD run for reporting purpose. If an EOD
run has not been selected, then by the system considers the last successful execution
is as EOD run.

Oracle Financial Services Market Risk Measurement and Management User Guide
Release 8.0.6.0.0
115
Figure 64 Model Validation – Execution Summary
1111..22..33 RRiisskk TThheeoorreettiiccaall aanndd HHyyppootthheettiiccaall DDeeffiinniittiioonn
Select the business definition created in the module Market Risk – Historical Simulation, to be
considered for Risk Theoretical and Hypothetical from the drop-down list.
Figure 65 Risk Theoretical and Hypothetical Definition
Risk Theoretical
This is the P&L calculated by the risk factors generated from the pricing models of the
trading desk. Risk Theoretical P&L is similar to Hypothetical P&L and is computed using
business definitions selected for Risk Theoretical.
Hypothetical
Actual and Hypothetical P&L are computed using business definitions selected for
Hypothetical.
Actual P&L is difference in portfolio value as off time t and time t-1, where t is any
specified historical date. Additionally, Actual P&L incorporates the change in instrument
data for calculating P&L.
Hypothetical P&L for time t is difference in portfolio value computed with market data as
off time t and instrument data as off time t, and, portfolio value computed with market

Oracle Financial Services Market Risk Measurement and Management User Guide
Release 8.0.6.0.0
116
data as off time t+1 and Instrument data as off time t. For the calculation of Hypothetical
P&L it is assumed that composition of the portfolio has not changed across the time.
NOTE: If you do not intend to use the output of Historical Simulation, then follow the below process to
upload portfolio values to be considered for model validation:
Populate data in to the Fact table (FCT_MR_PORTFOLIO_VALUE) and execute the batch
<<INFODOM>>_MRMM_MDL_VALDN_INPUT_POP to populate the
FSI_MR_PORTFOLIO_VALUE table for Model Validation Service. Use the below T2Ts for data
population:
T2T_MR_PORTFOLIO_VALUE_FCT_POP – For populating data from Portfolio Risk to
FCT population table
T2T_MR_PORTFOLIO_VAL_FSI_POP – FCT – for populating data from FCT population
table of Portfolio Risk to FSI of Model Validation
See the OFS MRMM Download specification document available in OHC Documentation Library
for the column details in FCT_MR_PORTFOLIO_VALUE table.
1111..22..44 MMooddeell PPaarraammeetteerrss
Define the parameters for model validation in this section.
Figure 66 Model Parameters
Provide the below details in this pane:
Backtesting Period: It is the period over which model is to be validated and is relative to
the execution date. Specify the backtesting period
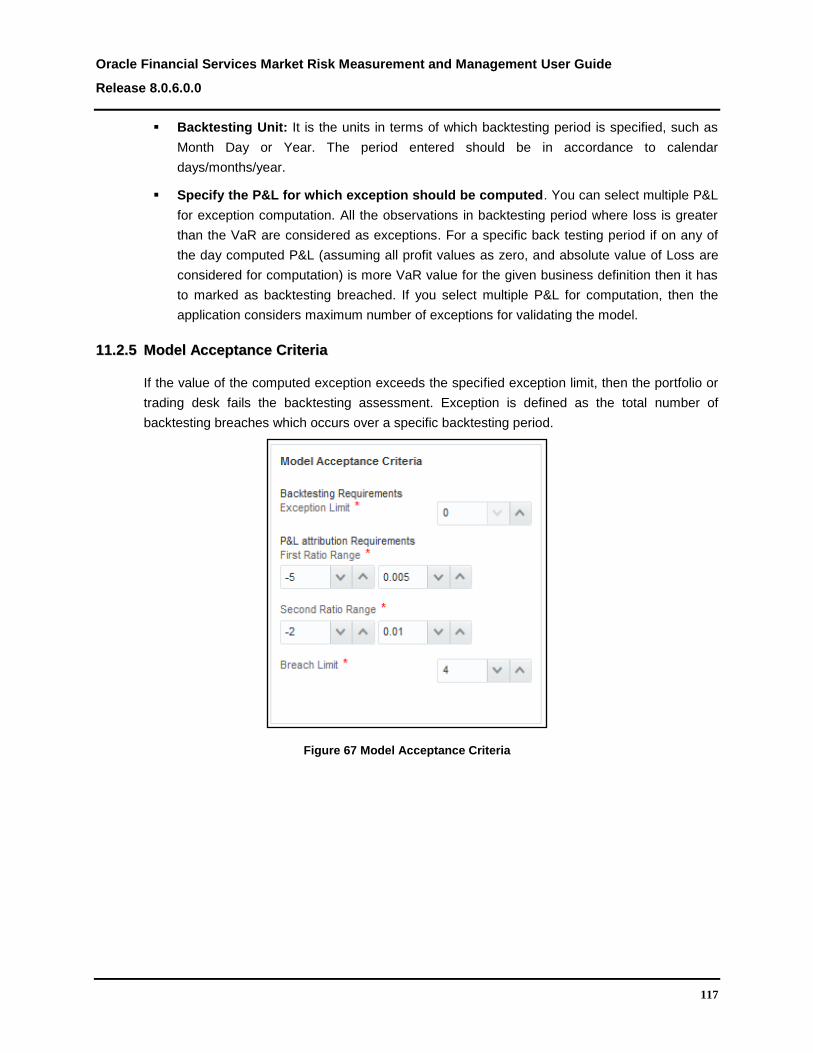
Oracle Financial Services Market Risk Measurement and Management User Guide
Release 8.0.6.0.0
117
Backtesting Unit: It is the units in terms of which backtesting period is specified, such as
Month Day or Year. The period entered should be in accordance to calendar
days/months/year.
Specify the P&L for which exception should be computed. You can select multiple P&L
for exception computation. All the observations in backtesting period where loss is greater
than the VaR are considered as exceptions. For a specific back testing period if on any of
the day computed P&L (assuming all profit values as zero, and absolute value of Loss are
considered for computation) is more VaR value for the given business definition then it has
to marked as backtesting breached. If you select multiple P&L for computation, then the
application considers maximum number of exceptions for validating the model.
1111..22..55 MMooddeell AAcccceeppttaannccee CCrriitteerriiaa
If the value of the computed exception exceeds the specified exception limit, then the portfolio or
trading desk fails the backtesting assessment. Exception is defined as the total number of
backtesting breaches which occurs over a specific backtesting period.
Figure 67 Model Acceptance Criteria

Oracle Financial Services Market Risk Measurement and Management User Guide
Release 8.0.6.0.0
118
You need to specify the below information in this grid for backtesting validation and P&L
attribution validation:
Backtesting Requirements
Exception Limit: Specify the number of exceptions allowed. If this limit is breached then
the model assessment fails.
P&L Attribution Requirements
First Ratio Range: First ratio is the mean of unexplained daily P&L (that is risk
theoretical P&L minus hypothetical P&L) over the standard deviation of hypothetical
daily P&L, for the specified backtesting period. Specify the acceptable range for first
ratio of P&L attribution. If the first ratio computed is not in the specified range then
model assessment fails.
Second Ratio Range: Second ratio is the ratio of variances of unexplained daily P&L
and variance of hypothetical daily P&L, for the specified backtesting period. Specify the
acceptable range for second ratio of P&L attribution. If second ratio computed is not in
specified range then model assessment fails.
Breach Limit: If first ratio computed is not in user specified range or second ratio
computed is not in user specified range then the model is considered as P&L breached.
If total Number of Breaches in a specific backtesting period exceeds the specified total
number of breach limit then the Portfolio / Trading Desk is considered as P&L
assessment failed.
1111..22..66 EExxcceeppttiioonn PPrroobbaabbiilliittyy aanndd MMuullttiipplliieerr
This pane displays the probability of occurrence and Multiplier values.
Figure 68 Exception Probability and Multiplier

Oracle Financial Services Market Risk Measurement and Management User Guide
Release 8.0.6.0.0
119
To add multipliers follow the below steps:
1. Click Open in the Exception Probability and Multiplier pane.
Figure 69 Adding Exception Probability and Multiplier
2. Click Add. A new row is created.
3. Provide values for the below columns:
Probability of occurrence (exact): Provide the exact probability of obtaining
corresponding number of exceptions.
Multiplier: Provide the multiplier value/multiplication factor for the capital which is
sufficient to return the model to a 99th percentile standard.
Values for the below columns are computed by the application:
Number of Exception: This is auto populated number of exceptions starting with 0
and will keep on increasing as we add rows.
Probability of rejecting model (Type 1): This is system computed column. Type 1 is
the probability that using a given number of exceptions as the cut-off for rejecting a
model will imply rejection of an accurate model. Column is reverse-cumulative of
Probability of occurrence (Column 2) starting with 100%.
Probability of accepting model (Type 2): This is system computed column. Type 2 is
the probability that using a given number of exceptions as the cut-off for rejecting a
model will imply acceptance of an inaccurate model Column is cumulative of
Probability of occurrence (Column 2) starting from 0%.
4. Click Done.
NOTE: When you add a row, it will be added as last line, and when you delete a row, the last row will
be deleted.

Oracle Financial Services Market Risk Measurement and Management User Guide
Release 8.0.6.0.0
120
1111..22..77 ZZoonnee CCllaassssiiffiiccaattiioonn
Each model is classified into three zones Green, Yellow and Red which will be identified based
on the Type 2 probability of occurrence.
Figure 70 Zone Classification
Specify the probability range for the below zones in terms of percentage:
Green
Yellow
Red
1111..22..88 PPrroocceedduurree ffoorr CCrreeaattiinngg aa BBuussiinneessss DDeeffiinniittiioonn iinn MMooddeell VVaalliiddaattiioonn
The defined executions are listed in the Model Validation summary screen. Click either Portfolio
or Trading Desk tabs to view the list. Each business definition is executed as a separate run.

Oracle Financial Services Market Risk Measurement and Management User Guide
Release 8.0.6.0.0
121
Figure 71 Business Definition – Model Validation
The following table describes the fields in the model validation new business definition window:
Fields Description
Fields marked in red asterisk(*) are mandatory
Name* Enter the name of the business definition.
Description Provide a description for the business definition.
Currency*
It is the currency in which all the output for given
definition will be computed. Select the currency type
from the drop-down list.
Version Displays the workflow version of the business definition.
Workflow Status Displays the workflow status of the business definition.
Risk Theoretical* Select the business definitions for Risk Theoretical from
the drop-down list.
Hypothetical* Select the business definitions for Hypothetical from the
drop-down list.
Backtesting Period* Provide the backtesting period

Oracle Financial Services Market Risk Measurement and Management User Guide
Release 8.0.6.0.0
122
Fields Description
Fields marked in red asterisk(*) are mandatory
Backtesting Period Unit* Select the unit for backtesting period from the drop-
down box
Backtesting
Requirements Exception
Limit*
Specify the number of exceptions allowed during
backtesting for the model validation to pass.
P&L Attribution
Requirements – First
Ratio Range*
Specify the acceptable range for first ratio of P&L
attribution.
P&L Attribution
Requirements – Second
Ratio Range*
Specify the acceptable range for second ratio of P&L
attribution.
P&L Attribution
Requirements – Breach
Limit*
Specify the number of permissible breaches
Zone Classification
Green Zone, Yellow
Zone, Red Zone*
Specify the probability range for the three zones.
Exception Probability
and Multiplier
Specify the probability of occurrence and multiplier
values.
Execution Summary
Displays the execution history of the business
scenarios. Select the execution to be marked as EOD
execution.
Table 18 Fields and their Descriptions in Model Validation-Business Definition Window
Follow the below steps to create a new business definition in Model Validation:
1. Click the business approach from the MRMM Model Validation Summary screen, for
which the business definition needs to be created.
2. Click New Business Definition. A new tab is created.
3. Click on the new tab, and provide details in the Name, Description fields.
4. In the Currency field, select the currency type from the drop-down list.
5. Select the business definitions for Risk Theoretical and Hypothetical from the drop-
down list. See Risk Theoretical and Hypothetical Definition for details.

Oracle Financial Services Market Risk Measurement and Management User Guide
Release 8.0.6.0.0
123
6. Specify the Backtesting Period, and select the P&L for which exceptions need to be
computed, in the Model Parameters pane. See Model Parameters for details.
7. Provide details for Backtesting Requirement, and P&L Attribution Requirements
fields displayed in the Model Acceptance Criteria pane. See Model Acceptance Criteria
for details.
8. Provide the probability range for the Green, Yellow and Red zones in Zone
Classification pane. See Zone Classification for details.
9. Add or remove rows based on the requirement in the Exception Probability and
Multiplier section. See Exception probability and Multiplier for details.
10. Click Save and Submit.
11. Click Execute to trigger an adhoc run. A pop up message with a date-time editor is
displayed. Specify the date on which the execution needs to be performed and click
OK. The execution is triggered.
12. After executing the business definition, select any one execution for a given date as
EOD execution.
1111..33 MMooddeell PPeerrffoorrmmaannccee OOuuttppuuttss
Following are the additional outputs computed in Model Validation module:
1. P-value
P-value is probability of experiencing k or more exceptions within model where k is total
number of observed exceptions. It is calculated for all P&Ls (Risk theoretical,
Hypothetical and Actual P&L) using the following formula.

Oracle Financial Services Market Risk Measurement and Management User Guide
Release 8.0.6.0.0
124
𝑃 − 𝑉𝑎𝑙𝑢𝑒 = ∑ 𝐶𝑛𝑖 ∗ 𝑝𝑖 ∗ (1 − 𝑝)𝑛−𝑖
𝑘
𝑖=0
Where,
P-value = probability of experiencing k or more exceptions
n = Total number of backtesting days. This is the actual number of days that are used in
backtesting. For example, if the backtesting period is 1 year but due to holidays total
number of observation points is 252, then consider 252 days for computation in this
formula)
p = (1- confidence level)
k = total number of exceptions
2. Loss Exception Deviation:
Loss Exception Deviation is the absolute average deviation of the loss exceptions from
the ES. It is to be computed for all P&Ls (risk theoretical, Hypothetical and Actual P&L)
It is calculated as follows:
Loss Exception Deviation =∑ 𝐴𝐵𝑆[(𝐿𝑜𝑠𝑠−𝑉𝑎𝑅 )𝑛
1 −𝐸𝑆]
𝑘
Where,
Loss is corresponding P&L
VaR is corresponding VaR value
ES is corresponding ES value
K = total number of exceptions
n = is total number of backtesting days
3. Average Loss Duration
Average Loss Duration is the average time interval between successive loss
exceptions. Suppose back testing was carried out for a portfolio for a period of 90 days.
The below table details the loss exceptions observed during the back testing period. It
is computed for all P&Ls (Risk Theoretical, Hypothetical and Actual P&L)
Loss Exception Time of Loss Exceptions (in days)
L1 20
L2 50
L3 60
Average Loss Duration = (20 + 30 + 10) / 3 = 20 days

Oracle Financial Services Market Risk Measurement and Management User Guide
Release 8.0.6.0.0
125
4. Loss Duration Deviation
Loss Duration Deviation refers to the standard deviation of time interval between
successive loss exceptions. It is computed for all P&Ls (Risk Theoretical, Hypothetical
and Actual P&L). It is calculated as per the formula given below:
𝐿𝑜𝑠𝑠 𝐷𝑢𝑟𝑎𝑡𝑖𝑜𝑛 𝐷𝑒𝑣𝑖𝑎𝑡𝑖𝑜𝑛 = (𝑆𝑢𝑚 𝑜𝑓 𝑆𝑞𝑢𝑎𝑟𝑒𝑑 𝐷𝑒𝑣𝑖𝑎𝑡𝑖𝑜𝑛𝑠
𝑁𝑢𝑚𝑏𝑒𝑟 𝑜𝑓 𝐸𝑥𝑐𝑒𝑝𝑡𝑖𝑜𝑛𝑠)
12⁄
The Loss Duration Deviation is calculated for the illustration as follows:
Loss
Exception
Time Interval Between Successive
Loss Exceptions (in days)
Average Loss
Duration
Deviation Squared
Deviation
L1 20 20 0 0
L2 30 20 -10 100
L3 10 20 10 100
Loss Duration Deviation = (200/3)1/2 = 8.16 days

Oracle Financial Services Market Risk Measurement and Management User Guide
Release 8.0.6.0.0
126
1122 AAnnnneexxuurree AA:: DDeettaaiillss ooff MMaarrkkeett DDaattaa
Market Data refers to the multiple types of data required from financial market to price interest
rate, equity, foreign exchange and other types of products. The following types of market data are
required by OFS MRMM application.
Rate: These are daily input of FX spot, IR cash, repo rates, and so on.
Prices: These are daily input of a number of spot prices, such as equity spot prices, bond
spot prices, and for all exchange-traded futures and options contract types
Curves: These include:
Yield curves represent the market data for the term structure of interest rates
Basic yield curve identified by currency and index
Cross currency basis curves, identified by a currency-index pair (currency-
index/currency-index)
Cross currency swap curves, identified by a currency-index pair (currency-
index/currency-index where first index is FIXED)
Single currency basis curves, identified by currency-index pair and an additional
money market index
Dividend curves: These are methods to represent the dividends for the equity, and can
be created using either dividend yields or discrete dividends that may be expressed
either as yield or absolute amounts.
Constant value: Yield represented as specific percentage of equity’s market price
on a specific date
Dividend yield: Dividend expressed as percentage of equity’s market price.
Absolute dividend: Absolute amount of dividend.
Repo and bond repo curves: Repo curves are used to model the cost of carrying a
share associated with repurchase agreements
Fair strike curves: These are used when pricing products such as EQ Variable Swap
deals. A Fair Strike curve provides market quotes for variable swaps, in the form of a
tabular list of dates and fair strike market quotes.
Volatility spread curves: These are used when pricing products such as EQ Variable
Swap deals. Volatility spread curves provide volatility basis term structures that
comprises a collection of dates and associated strike adjustments
Credit curves: These are inputs such as Recovery Rate, Credit Spread, Survival
Probabilities required by credit models for a specific counterparty.

Oracle Financial Services Market Risk Measurement and Management User Guide
Release 8.0.6.0.0
127
Real rate curves: These are nominal yield curve adjusted for inflation by a Consumer
Price Index
Commodity forward curves: These are built from the futures prices of the underlying
commodity for several contract months
Volatilities: These include:
Cap volatilities
Swaption volatilities: Swaption volatility cubes are used to aggregate a number of
swaption surfaces and generate a full 3 dimensional surface for volatility over strikes
FX Volatilities: Matrix of FX volatilities are required for use with FX options.
Equity Volatilities: Equity volatility surfaces are presented as two matrices, one for call
volatilities and one for put volatilities.
Fixings: These are historical fixing rates / spot rates/value of the following categories, for
example Libor is set, or “fixed”, every day:
Interest rate
FX spot
Inflation index
The market data is specified in a uniquely identifiable and logical form. These can be raw or
derived data and can be shocked to created different Market Scenarios i.e. one or more shifts
applied to selected market data. The above data will be sourced through stage tables. The logical
quote structure in which market data is expected is given below. When data moves from stage
table to processing, appropriate values are concatenated to form the required quote.
Type Asset
Class
Market Data
Type Code
Market Data
Type
Market Data
Description
Logical Quote structure
Curve CR CDS Single-Name
Credit Default
Swaps
Single-name
credit default
swap (Spread
and Recovery)
CR.Currency-
ReferenceEntity_DebtType_RestructuringClause.CDS
-Tenor.Indicator.QuoteType
Example: CR.USD-DELLN_SNRFOR_MR.CDS-
30Y.SPREAD.MID
Curve CR CR_IDX_SWA
P
Credit Index
Swaps
Credit index
swap (Spread
and Recovery)
CR.Currency-Index_Series_Version.CDIX-
Tenor.Indicator.QuoteType
Example: CR.EUR.ITRAXXMAIN_S15_V2.CDIX-
5Y.RECOVERY
Curve CR SP Survival
Probabilities
Survival
Probabilities
CR.Currency-
ReferenceEntity_DebtType_RestructuringClause.SP-

Oracle Financial Services Market Risk Measurement and Management User Guide
Release 8.0.6.0.0
128
Type Asset
Class
Market Data
Type Code
Market Data
Type
Market Data
Description
Logical Quote structure
Maturity.QuoteType
Example: CR.USD-AET_SNRFOR_CR.SP-20-Jun-
2013.MID
Curve EQ EQ_DIV Equity Dividends Equity Dividends EQ.Currency-{Exchange}-Ticker.DIV.[Structure]
Example: EQ.USD-NYSE-IBM.DIV.CONT
Curve INFL INFL_SEASO
NALITY
Seasonality Seasonality INFL.Currency-InflationIndex.SEASONALITY-Month
Example: INFL.USD-CPI.SEASONALITY-JAN
Curve IR BASIS_SWAP Basis Swaps Basis Swap IR.[TargetUnderlying]/[KnownUnderlying].BASIS-
Mat.QuoteType where [Underlying] = Currency-
IRIndex-IRIndexTenor
Example: IR.JPY-LIBOR-6M/JPY-LIBOR-3M.BASIS-
1M.MID
Curve IR BASIS_SWAP
_XCCY
Cross-currency
Basis Swaps
Cross-currency
basis swap
IR.[TargetUnderlying]/[KnownUnderlying].BASIS-
Mat.QuoteType where [Underlying] = Currency-
IRIndex-IRIndexTenor
Example: IR.JPY-LIBOR-3M/USD-LIBOR-3M.BASIS-
5Y.MID
Curve IR CASH Cash Cash Instrument IR.Currency-IRIndex.CASH-
InstrumentTenor.QuoteType
Example: IR.USD.LIBOR.CASH-1M.BID
Curve IR SWAP_XCCY Cross-currency
Fixed/Float
Swaps
Cross-currency
fixed-for-floating
swap
IR.[UnderlyingFixed]/[UnderlyingFloating].SWAPMarke
tType-Mat.QuoteType where [Underlying] = Currency-
IRIndex-IRIndexTenor; For [UnderlyingFixed],
IRIndexTenor is FIXED
Example: IR.TWD-FIXED/USD-LIBOR-6M.SWAP-
5Y.MID
Curve IR SWAP_XCCY
_ND
Cross-currency
Fixed/Float
Swaps-Offshore
Cross-currency
fixed-for-floating
swap – Offshore
(Non deliverable)
market
IR.[UnderlyingFixed]/[UnderlyingFloating].SWAPMarke
tType-Mat.QuoteType where [Underlying] = Currency-
IRIndex-IRIndexTenor; For [UnderlyingFixed],
IRIndexTenor is FIXED
Example: IR.TWD-FIXED/USD-LIBOR-6M.SWAPND-
7Y.MID
Curve IR SWAP_XCCY
_ONSHORE
Cross-currency
Fixed/Float
Cross-currency
fixed-for-floating
IR.[UnderlyingFixed]/[UnderlyingFloating].SWAPMarke
tType-Mat.QuoteType where [Underlying] = Currency-

Oracle Financial Services Market Risk Measurement and Management User Guide
Release 8.0.6.0.0
129
Type Asset
Class
Market Data
Type Code
Market Data
Type
Market Data
Description
Logical Quote structure
Swaps-Onshore swap – Onshore
market
IRIndex-IRIndexTenor; For [UnderlyingFixed],
IRIndexTenor is FIXED
Example: IR.TWD-FIXED/USD-LIBOR-
6M.SWAPONSHORE-4Y.MID
Price CMDT
Y
CMDTY_FWD Commodity
Forward
Commodity
Forward
CMDTY.Currency-Exchange-Symbol.FWD-
Mat.QuoteType
Example: CMDTY.USD-COMEX-GCA.FWD-28-Aug-
2013.MID
Price CMDT
Y
CMDTY_SPO
T
Commodity Spot Commodity Spot CMDTY.Currency-Exchange-
Symbol.SPOT.QuoteType
Example: CMDTY.USD-NYMEX-NG.SPOT.ASK
Price EQ EQ_FUT Equity Futures Equity Futures EQ.Currency-Exchange-ContCode.FUT-
MatCode.QuoteType
Example: EQ.USD-NYSE-ESZ12.FUT-Z12.MID
Price EQ EQ_SPOT Equity Spot Equity Spot EQ.Currency-{Exchange}-Ticker.SPOT.QuoteType
Example: EQ.USD-NYSE-IBM.SPOT.MID
Price EQ EQDIV_FUT Equity Dividends
from Equity
Dividend Futures
Equity dividend
key with the
dividend curve
stripped from
equity dividend
futures
EQ.Currency-Exchange-ContractCode.DIV.FUT-
MaturityCode.QuoteType
Example: EQ.USD-NYSE-ESZ12.DIV.FUT-Z12.MID
Price EQ EQDIV_SWAP Equity Dividends
from Equity
Dividend Swaps
Equity dividend
key with the
dividend curve
stripped from
equity dividend
swaps
EQ.Currency-{Exchange}-
Ticker.DIV.SWAP.Tenor.QuoteType
Example: EQ.USD-NYSE-IBM.DIV.SWAP.1M.MID
Price INFL INFL_BOND Inflation-Linked
Bonds
Inflation-Linked
Bonds (Price and
Yield)
INFL.Currency-Type-Issuer-InflationIndex.ILBOND-
Coupon-IssueDate.Maturity.Indicator.QuoteType
Example: INFL.JPY-JGBI-MOF-JCPI.ILBOND-
0.04234-09-Aug-2010.13-Aug-2015.Yield.MID
Price INFL INFL_YOYOP
TION
Year-on-Year
Options
Year-on-Year
Options
INFL.Currency-InflationIndex.YOYOPTION-Flavour-
Strike-Maturity.PRICE.QuoteType

Oracle Financial Services Market Risk Measurement and Management User Guide
Release 8.0.6.0.0
130
Type Asset
Class
Market Data
Type Code
Market Data
Type
Market Data
Description
Logical Quote structure
Example: INFL.EUR-EURCPI.YOYOPTION-CAP-
0.02-30Y.PRICE.MID
Price INFL INFL_ZCIIOP
TION
Zero-Coupon
Inflation-Indexed
Options
Zero-Coupon
Inflation-Indexed
Options
INFL.Currency-InfationIndex.ZCIIOPTION-Flavour-
Strike-Maturity.PRICE.QuoteType
Example: INFL.EUR-EURCPI.ZCIIOPTION-FLOOR-
0.00-7Y.PRICE.MID
Price INFL INFL_ZCIIS Zero-Coupon
Inflation-Indexed
Swaps
Zero-Coupon
Inflation-Indexed
Swaps
INFL.Currency-InflationIndex.ZCIIS-
Maturity.QuoteType
Example: INFL.EUR-HICP.ZCIIS-2Y.MID
Price IR CORP_BOND Corporate Bonds Corporate Bonds
(Price and Yield)
IR.Currency-Type-Issuer.BOND-Coupon-
IssueDate.Maturity.Indicator.QuoteType
Example: IR.USD-USCORPORATE-MSFT.BOND-
0.00875-27-SEP-2010.27-
SEP-2013.YIELD.MID
Price IR SOV_BILL Sovereign Bills Sovereign
Bills(Price and
Yield)
IR.Currency-Type-Issuer.BILL-0-
IssueDate.Maturity.Indicator.QuoteType
Example: IR.USD-USTreasury-USGovt.BILL-0-01-Apr-
2011.01-Oct-2017.Price.MID
Price IR SOV_BOND Sovereign Bonds Sovereign bonds
(Price and Yield)
IR.Currency-Type-Issuer.BOND-Coupon-
IssueDate.Maturity.Indicator.QuoteType
Example: IR.USD-USTreasury-USGovt.BOND-0.0125-
01-Apr-2011.01-Oct-2017.Price.MID
Rate FX FX_FWD Forex Forward Foreign
exchange
forward
FX.BaseCurrencyTermCurrency.FWD-
Maturity.QuoteType
Example: FX.JPYUSD.FWD-ON.MID
Rate FX FX_FWDND Forex Forward
Offshore
Foreign
exchange
forward
FX.BaseCurrencyTermCurrency.FWDND-
Maturity.QuoteType
Example: FX.GBPUSD.FWDND-18-Apr-2022.MID
Rate FX FX_FWDONS
HORE
Forex Forward
Onshore
Foreign
exchange
forward
FX.BaseCurrencyTermCurremcy.FWDONSHORE-
Maturity.QuoteType
Example: FX.EURUSD.FWDONSHORE-1Y.MID
Rate FX FX_SPOT Forex Spot Foreign
exchange spot
FX.BaseCurrencyTermCurrency-SPOT.QuoteType
Example: FX.AUDUSD-SPOT.MID

Oracle Financial Services Market Risk Measurement and Management User Guide
Release 8.0.6.0.0
131
Type Asset
Class
Market Data
Type Code
Market Data
Type
Market Data
Description
Logical Quote structure
Rate IR FRA Forward rate
agreement
Forward rate
agreement
IR.Currency-IRIndex-IRIndexTenor.FRA-
Period.QuoteType
Example: IR.GBP-LIBOR-6M.FRA-12M-18M.MID
Rate IR ON_SWAP Overnight Indexed
Swaps
Overnight
Indexed Swaps
IR.Currency-IRIndex-ON.SWAP-Tenor.QuoteType
Example: IR.USD-FEDFUNDS-ON.SWAP-5Y.BID
Rate IR SWAP Swaps Swap IR.Currency-IRIndex-IRIndexTenor.SWAP-
Tenor.QuoteType
Example: I R.CHF-LIBOR-3M.SWAP-5Y.LAST
Volatili
ty
CMDT
Y
CMDTY_VOL Commodity
Volatility
Represent a
point on a
commodity
volatility surface
CMDTY.Currency-Exchange-
Symbol.VOL::Maturity::Strike::StrikeType.QuoteType
Example: CMDTY.USD-COMEX-GCA.VOL::16-Oct-
2012::1490.58::STRIKE-ABSLT.MID
Volatili
ty
EQ EQ_SPOT_V
OL
Equity Volatility Represent a
point on an
equity volatility
surface
EQ.Currency-{Exchange}-
Ticker.SPOT.VOL.Maturity::Strike::StrikeType.QuoteT
ype
Example: EQ.USD-NYSE-
SPX.SPOT.VOL::3m::1506.527::STRIKE-ABSLT.MID
Volatili
ty
FX FX_VOL Forex Volatility Represent a
point on a FX
volatility surface
FX.BaseCurrTermCurr.VOL::Tenor::[FXStrike]::Quote
Type
Example: FX.USDJPY.VOL::1m::25D CALL::ASK
Volatili
ty
IR CAP_VOL Caps Represent a
point on a cap
volatility surface
IR.[Underlying].[Instrument]::QuoteType where
[Underlying] = Currency-IRIndex-IRIndexTenor.VOL
and [Instrument] = CAP.CapTen::CapStrike
Example: IR.USD-LIBOR-
3M.VOL.CAP::1Y::ATM::MID
Volatili
ty
IR SWPT_VOL Swaptions Rrepresent a
point on a
swaption
volatility surface
IR.[Underlying].[Instrument]::QuoteType where
[Underlying] = Currency-IRIndex-IRIndexTenor.VOL
and [Instrument] =
SWPT.SwaptionStrike::OptionTenor::SwapTenor
Example: IR.USD-LIBOR-
3M.VOL.SWPT.ATM::9Y::10Y::MID
Volatili
ty
IR SWPT_VOL_
CUBE
Swaption Cubes Represent a
point on a
swaption
IR.[Underlying].SWPT.StrikeType::Strike::OptionTenor
::SwapTenor::DataType.QuoteType where

Oracle Financial Services Market Risk Measurement and Management User Guide
Release 8.0.6.0.0
132
Type Asset
Class
Market Data
Type Code
Market Data
Type
Market Data
Description
Logical Quote structure
volatility cube [Underlying] = Currency-IRIndex-IRIndexTenor.VOL
Example: IR.USD-LIBOR-
3M.VOL.SWPT.RLTV.ATM+150bps::2Y::2Y::LOGNO
RMAL.MID
Volatili
ty
IR SWPT_VOL_
CUBE_SHIFT
Swaption Cube
Shifts
Specify a shift of
the swaption
volatility cube
IR.[Underlying].SWPT.StrikeType::Strike::OptionTenor
::SwapTenor::SHIFT where [Underlying] = Currency-
IRIndex-IRIndexTenor.VOL
Example: IR.USD-LIBOR-
3M.VOL.SWPT.RLTV.ATM+150bps::2Y::2Y::SHIFT
Table 19 Expected Logical Quote Structure for Market Data
The logical quote structure in which fixings data is expected is given below. When data moves
from stage table to processing, appropriate values are concatenated to form the required quote.
Asset
Class
Logical Quote structure Remarks
IR Currency-Interest Rate Index-Tenor Historical fixing / spot interest rate is required. Ex. USD-LIBOR-3M
FX BaseCurrencyTermCurrency-SPOT Historical spot exchange rate is required in the form “1 unit of base
currency = n unit of term currency”. Ex. AUDJPY-SPOT
INFL Currency-Inflation Index Historical value of inflation index is required. Ex. USD-CPI
Table 20 Logical Quote Structure for Fixing Data

Oracle Financial Services Market Risk Measurement and Management User Guide
Release 8.0.6.0.0
133
1133 AAnnnneexxuurree BB:: AApppprroovvaall WWoorrkkffllooww
1133..11 OOvveerrvviieeww
OFS MRMM supports approval workflows based on user roles. A one-step maker-checker
approval is supported for business assumption definition and Run definition to ensure that
computations are carried out using the right input data.
A definition goes through multiple stages, each with a different status, before it can be used for
computation. For instance, when a new business assumption is defined and saved, it will be in
‘Draft’ status. When the definition is edited and sent for authorization, the status of the definition
changes to ‘Pending Approval’ and so on. Each stage requires action from the relevant user
based on the role assigned to her. Similarly, a Run definition goes through the same stages of
approval.
1133..22 UUnnddeerrssttaannddiinngg AApppprroovvaall WWoorrkk FFllooww
The approval work flow and the logical change in each status is depicted as part of the process
flow below:
Figure 72 Approval Workflow
Each definition goes through multiple stages and has a status associated with it in each stage
and the following table explains the status at each stage.
Status Description
Draft
When a new definition is created and saved for the first time it is in ‘Draft’ status. While
in draft status, the user is allowed to make any necessary edits without a change in the
version number.
Pending Approval When a definition is sent for approval but is not yet approved by the approver the status
changes to ‘Pending Approval’. This does not result in a change in the version number.
Draft
When a definition is rejected by the approver, it changes to ‘Draft’ status and is required
to be updated or rectified. This result in a change in the version number. After the
necessary updates have been made, it goes through the approval process again. You
are allowed to delete a version in ‘Draft’ status.

Oracle Financial Services Market Risk Measurement and Management User Guide
Release 8.0.6.0.0
134
Status Description
Approved When a definition has been approved its status changes to ‘Approved’. This does not
result in a change in the version number.
The steps which explain the approval work flow process and the tasks that a user can perform
during each stage are as follows:
To create a new definition, click Add icon in the Business Assumptions Summary window. On
creation of a new definition it is in ‘Draft’ status. The icons which are enabled while a definition is
in Draft status are as follows: View, Edit, Copy, Delete, Send for Approval, and Approval
Summary.
The actions which are permissible when a definition is in ‘Draft’ status are as follows:
You can view the definition by clicking the View icon in the summary window. You cannot
edit the values in View mode.
You can edit the definition by clicking the Edit icon in the summary window and make the
required changes. This does not result in a new version.
You can copy the definition and save it with a new name by clicking the Copy icon in the
summary window. The new definition will have the same attributes as the existing definition
and will be created as version 0. This definition will be in ‘Draft’ status and the necessary
edits can be made.
You are allowed to delete any definition which is in ‘Draft’ status, by selecting the definition
from the summary window and clicking the Delete icon.
Once the definition is finalized, you can initiate the approval process by opening the
definition in edit mode and clicking the Send for Approval icon in the definition window. This
changes the status of the definition to ‘Pending Approval’.
You can view the approval workflow for the definition in the Approval Summary window, by
clicking the Approval Summary icon. This window provides details of each change in the
approval status.
Once the definition is finalized, it is sent for approval and its status changes to ‘Pending
Approval’. The icons which are enabled in the ‘Pending Approval’ status are as follows:
View, Copy, Approve, Reject, and Approval Summary.
The actions which are permissible when a definition is in ‘Pending Approval’ status are as follows:
You can view the definition by clicking the View icon in the summary window. You cannot
edit the values in View mode.
You can copy the definition and save it with a new name by clicking the Copy icon in the
summary window. The new definition will have the same attributes as the existing definition

Oracle Financial Services Market Risk Measurement and Management User Guide
Release 8.0.6.0.0
135
and will be created as version 0. This definition will be in ’Draft’ status and the necessary
edits can be made.
You can approve the definition, if you have the appropriate access rights, by clicking the
Approve icon. You are allowed to add comments. The status changes to ‘Approved’ when
you have completed the approval process.
You can reject the definition, if you have the appropriate access rights, by clicking the
Reject icon. You are allowed to add comments. Rejecting a definition changes the status
back to ‘Draft’.
You can view the approval workflow for the definition in the Approval Summary window, by
clicking the Approval Summary icon. This window provides details of each change in the
approval status. This window provides details of each change in the approval status.
NOTE: The Approve or Reject buttons are present only for users who are mapped to the MR
Approver role.
The actions which are permissible when a definition is in ‘Approved’ status are as follows:
You can view the definition by clicking the View icon in the summary window. You cannot
edit the values in View mode.
You can edit the definition by clicking the Edit icon in the summary window and make the
required changes. The definition is still in ‘In Review’ status.
You can copy the definition and save it with a new name by clicking the Copy icon in the
summary window. The new definition will have the same attributes as the existing definition
and will be created as version 0. This definition will be in ‘Draft’ status and the necessary
edits can be made.
You can view the approval workflow for the definition in the Approval Summary window, by
clicking the Approval Summary icon. This window provides details of each change in the
approval status.
Approved definition cannot be edited.

Oracle Financial Services Market Risk Measurement and Management User Guide
Release 8.0.6.0.0
136
1144 AAnnnneexxuurree CC:: LLiisstt ooff IInnssttrruummeennttss SSuuppppoorrtteedd bbyy OOFFSS MMRRMMMM
The instruments supported by MRMM are listed in this section.
List of Instruments Supported by OFS MRMM
List of Instruments Supported for Monte Carlo Simulation
1144..11 LLiisstt ooff IInnssttrruummeennttss SSuuppppoorrtteedd bbyy MMRRMMMM
OFS MRMM supports the following instruments.
Sl.
No.
Asset Class Name of the Instrument
MRMM Release
Version
1 Interest Rate Amortizing Bond 8.0.5.0.0
2 Interest Rate Basis Swap 8.0.5.0.0
3 Interest Rate Amortizing Floating Rate Note 8.0.5.0.0
4 Credit Credit Asset Swap 8.0.5.0.0
5 Equity Equity Future 8.0.5.0.0
6 Interest Rate Cross-Currency Basis Swap 8.0.5.0.0
7 Inflation Inflation Zero Coupon Swap 8.0.5.0.0
8 Interest Rate Cash Deposit 8.0.5.0.0
9 Interest Rate Certificado de Deposito Bancario 8.0.5.0.0
10 Interest Rate CapFloor 8.0.5.0.0
11 Commodity Commodity Forward 8.0.5.0.0
12 Commodity Commodity Future 8.0.5.0.0
13 Interest Rate Sovereign bond 8.0.5.0.0
14 Forex FX Forward 8.0.5.0.0
15 Interest Rate Floating Rate Note 8.0.5.0.0
16 Interest Rate Forward rate Agreement 8.0.5.0.0
17 Interest Rate Treasury Bill 8.0.5.0.0
18 Interest Rate Vanilla IR Swap 8.0.5.0.0
19 Equity Equity Variance Swap 8.0.5.0.0
20 Interest Rate Callable Bond 8.0.5.0.0

Oracle Financial Services Market Risk Measurement and Management User Guide
Release 8.0.6.0.0
137
Sl.
No.
Asset Class Name of the Instrument
MRMM Release
Version
21 Commodity Commodity American Option on Future 8.0.5.0.0
22 Interest Rate Cross-Currency Fix Float Swap 8.0.5.0.0
23 Equity Equity American Option 8.0.5.0.0
24 Forex FX American Option 8.0.5.0.0
25 Interest Rate Amortizing Swap 8.0.5.0.0
26 Commodity Commodity European Option On Spot 8.0.5.0.0
27 Equity Equity Asian Option 8.0.5.0.0
28 Forex FX Asian Option 8.0.5.0.0
29 Equity European Swaption 8.0.5.0.0
30 Interest Rate Generic Swap 8.0.5.0.0
31 Inflation Inflation Linked Bond 8.0.5.0.0
32 Forex FX European Option 8.0.5.0.0
33 Equity Equity European Option 8.0.5.0.0
34 Forex FX Variance Swap 8.0.5.0.0
35 Equity Equity Convertible Bond Option 8.0.5.0.0
36 Equity Equity Total Return Swap 8.0.5.0.0
37 Commodity Commodity Swaption 8.0.5.0.0
38 Commodity Commodity Bullet Swap 8.0.5.0.0
39 Credit Credit Default Swap - Standard North American Corporate (SNAC) 8.0.5.0.0
40 Forex FX Pivot 8.0.6.0.0
41 Forex FX Dual Target Forward 8.0.6.0.0
42 Forex FX Binary Option 8.0.6.0.0
43 Forex FX Digital 8.0.6.0.0
44 Forex FX Barrier Scripted 8.0.6.0.0
Table 21 List of Instruments Supported By MRMM

Oracle Financial Services Market Risk Measurement and Management User Guide
Release 8.0.6.0.0
138
1144..22 LLiisstt ooff IInnssttrruummeennttss SSuuppppoorrtteedd ffoorr MMoonnttee CCaarrlloo
OFS MRMM supports the following instruments for Monte Carlo Simulation:
Sl.
No.
Asset Class Name of the Instrument
MRMM Release
Version
1 Interest Rate Amortizing Bond 8.0.5.0.0
2 Interest Rate Basis Swap 8.0.5.0.0
3 Interest Rate Amortizing Floating Rate Note 8.0.5.0.0
4 Credit Credit Asset Swap 8.0.5.0.0
5 Equity Equity Future 8.0.5.0.0
6 Interest Rate Cross-Currency Basis Swap 8.0.5.0.0
7 Interest Rate Cash Deposit 8.0.5.0.0
8 Interest Rate CapFloor 8.0.5.0.0
9 Commodity Commodity Forward 8.0.5.0.0
10 Commodity Commodity Future 8.0.5.0.0
11 Interest Rate Sovereign bond 8.0.5.0.0
12 Forex FX Forward 8.0.5.0.0
13 Interest Rate Floating Rate Note 8.0.5.0.0
14 Interest Rate Forward rate Agreement 8.0.5.0.0
15 Interest Rate Treasury Bill 8.0.5.0.0
16 Interest Rate Vanilla IR Swap 8.0.5.0.0
17 Equity Equity Variance Swap 8.0.5.0.0
18 Interest Rate Callable Bond 8.0.5.0.0
19 Commodity Commodity American Option on Future 8.0.5.0.0
20 Equity Equity American Option 8.0.5.0.0
21 Forex FX American Option 8.0.5.0.0
22 Interest Rate Amortizing Swap 8.0.5.0.0
23 Commodity Commodity European Option On Spot 8.0.5.0.0
24 Forex FX Asian Option 8.0.5.0.0
25 Equity European Swaption 8.0.5.0.0

Oracle Financial Services Market Risk Measurement and Management User Guide
Release 8.0.6.0.0
139
Sl.
No.
Asset Class Name of the Instrument
MRMM Release
Version
26 Interest Rate Generic Swap 8.0.5.0.0
27 Forex FX European Option 8.0.5.0.0
28 Equity Equity European Option 8.0.5.0.0
29 Equity Equity Total Return Swap 8.0.5.0.0
30 Commodity Commodity Swaption 8.0.5.0.0
31 Commodity Commodity Bullet Swap 8.0.5.0.0
32 Credit Credit Default Swap - Standard North American Corporate (SNAC) 8.0.5.0.0
33 Forex FX Pivot 8.0.6.0.0
34 Forex FX Dual Target Forward 8.0.6.0.0
35 Forex FX Barrier Scripted 8.0.6.0.0
Table 22 List of Instruments Supported By MRMM for Monte-Carlo Simulation

Oracle Financial Services Market Risk Measurement and Management User Guide
Release 8.0.6.0.0
140
1155 AAnnnneexxuurree DD:: LLiisstt ooff MMooddeellss aanndd MMeetthhooddss
OFS MRMM supports the following models and methods:
Instrument Type Model Method Asset Class
Commodity American Option on
Future Commodity Black Model Backward Monte Carlo Commodity
Commodity American Option on
Future Commodity Black Model Forward Monte Carlo Commodity
Commodity American Option on
Future Commodity Black Model JuZhong Commodity
Commodity American Option on
Future Commodity Black Model CDVM JuZhong Commodity
Commodity Bullet Swap Commodity Black Model Forward Monte Carlo Commodity
Equity Convertible Bond Option EQ Convertible Model Backward Partial Differential
Equation Equity
Equity Convertible Bond Option EQ Convertible Model Backward Monte Carlo Equity
Equity American Option EQ Black-Scholes Model Backward Partial Differential
Equation Equity
Equity American Option EQ Black-Scholes Model CDVM JuZhong Equity
Equity American Option EQ Black-Scholes Model JuZhong Equity
Equity Asian Option EQ Deterministic Model Vecer Discrete Partial
Differential Equation Equity
Equity Total Return Swap EQ Deterministic Model Not applicable Equity
Equity Total Return Swap EQ Black-Scholes Model Backward Analytic Equity
Equity Total Return Swap EQ Black-Scholes Model Backward Finite Difference Equity
Equity Total Return Swap EQ Black-Scholes Model Backward Lattice Equity
Equity Total Return Swap EQ Black-Scholes Model Backward Partial Differential
Equation Equity
Equity Total Return Swap EQ Black-Scholes Model Backward Tree Equity
Equity Total Return Swap EQ Black-Scholes Model Forward Analytic Equity
Equity Total Return Swap EQ Black-Scholes Model Forward Monte Carlo Equity
Equity Total Return Swap EQ Bates Model Backward Finite Difference Equity

Oracle Financial Services Market Risk Measurement and Management User Guide
Release 8.0.6.0.0
141
Instrument Type Model Method Asset Class
Equity Total Return Swap EQ Bates Model Backward Monte Carlo Equity
Equity Total Return Swap EQ Bates Model Forward Monte Carlo Equity
Equity Total Return Swap EQ Dupire Model Backward Analytic Equity
Equity Total Return Swap EQ Dupire Model Backward Finite Difference Equity
Equity Total Return Swap EQ Dupire Model Backward Monte Carlo Equity
Equity Total Return Swap EQ Dupire Model Backward Partial Differential
Equation Equity
Equity Total Return Swap EQ Dupire Model Backward Tree Equity
Equity Total Return Swap EQ Dupire Model Forward Analytic Equity
Equity Total Return Swap EQ Dupire Model Forward Monte Carlo Equity
Equity Total Return Swap EQ Heston Model Backward Analytic Equity
Equity Total Return Swap EQ Heston Model Backward Finite Difference Equity
Equity Total Return Swap EQ Heston Model Backward Monte Carlo Equity
Equity Total Return Swap EQ Heston Model Backward Partial Differential
Equation Equity
Equity Total Return Swap EQ Heston Model Forward Analytic Equity
Equity Total Return Swap EQ Heston Model Forward Monte Carlo Equity
FX Asian Option FX Dupire Model Backward Analytic Forex
FX Asian Option FX Dupire Model Backward Finite Difference Forex
FX Asian Option FX Dupire Model Backward Monte Carlo Forex
FX Asian Option FX Dupire Model Backward Partial Differential
Equation Forex
FX Asian Option FX Dupire Model Backward Tree Forex
FX Asian Option FX Dupire Model Forward Analytic Forex
FX Asian Option FX Dupire Model Forward Monte Carlo Forex
FX Asian Option FX Black Model Backward Analytic Forex
FX Asian Option FX Black Model Backward Finite Difference Forex
FX Asian Option FX Black Model Backward Lattice Forex
FX Asian Option FX Black Model Backward Partial Differential Forex

Oracle Financial Services Market Risk Measurement and Management User Guide
Release 8.0.6.0.0
142
Instrument Type Model Method Asset Class
Equation
FX Asian Option FX Black Model Backward Tree Forex
FX Asian Option FX Black Model Forward Analytic Forex
FX Asian Option FX Black Model Forward Monte Carlo Forex
FX Asian Option FX Deterministic Model Not applicable Forex
FX Asian Option FX Heston Model Backward Analytic Forex
FX Asian Option FX Heston Model Backward Finite Difference Forex
FX Asian Option FX Heston Model Backward Monte Carlo Forex
FX Asian Option FX Heston Model Backward Partial Differential
Equation Forex
FX Asian Option FX Heston Model Forward Analytic Forex
FX Asian Option FX Heston Model Forward Monte Carlo Forex
Amortizing Bond IR Deterministic Model Backward Analytic Interest Rate
Amortizing Bond IR Deterministic Model Forward Analytic Interest Rate
Amortizing Bond IR LIBOR Market Model Backward Monte Carlo Interest Rate
Amortizing Bond IR LIBOR Market Model Forward Monte Carlo Interest Rate
Amortizing Bond IR Hull White 1-Factor
Model Backward Lattice Interest Rate
Amortizing Bond IR Hull White 1-Factor
Model Backward Monte Carlo Interest Rate
Amortizing Bond IR Hull White 1-Factor
Model
Backward Partial Differential
Equation Interest Rate
Amortizing Bond IR Hull White 1-Factor
Model Backward Tree Interest Rate
Amortizing Bond IR Hull White 1-Factor
Model Forward Monte Carlo Interest Rate
Amortizing Bond IR Hull White 2-Factor
Model Backward Lattice Interest Rate
Amortizing Bond IR Hull White 2-Factor
Model Backward Monte Carlo Interest Rate
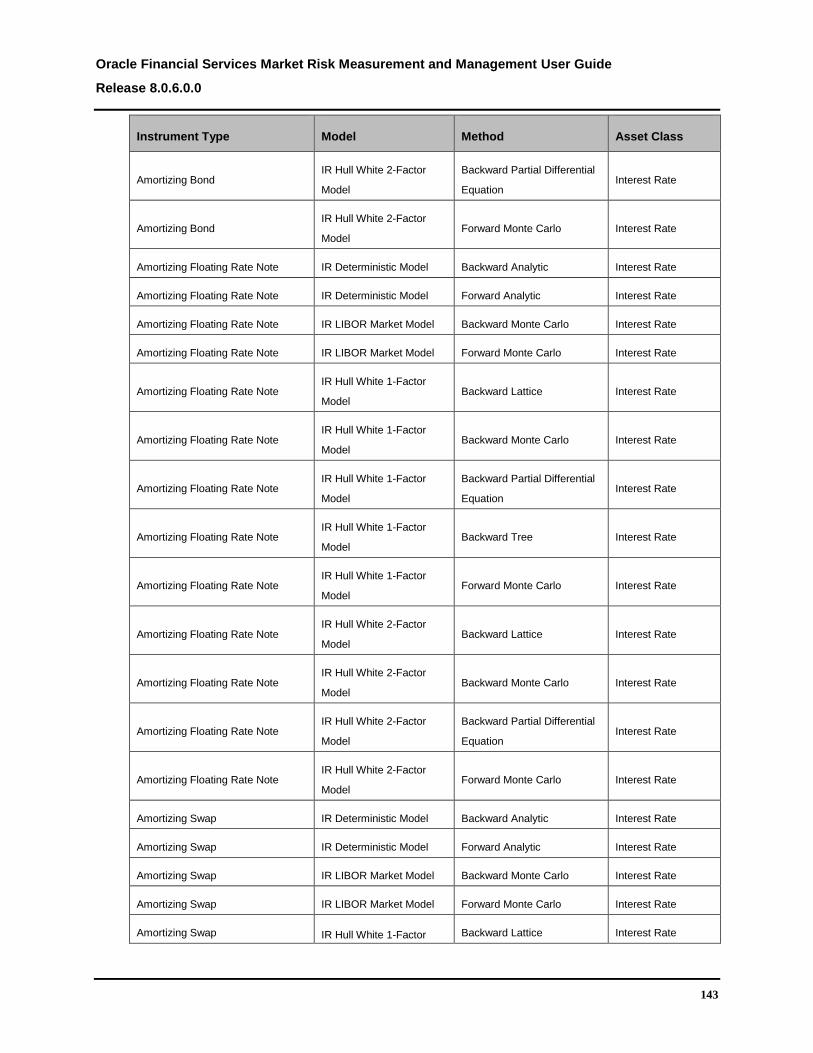
Oracle Financial Services Market Risk Measurement and Management User Guide
Release 8.0.6.0.0
143
Instrument Type Model Method Asset Class
Amortizing Bond IR Hull White 2-Factor
Model
Backward Partial Differential
Equation Interest Rate
Amortizing Bond IR Hull White 2-Factor
Model Forward Monte Carlo Interest Rate
Amortizing Floating Rate Note IR Deterministic Model Backward Analytic Interest Rate
Amortizing Floating Rate Note IR Deterministic Model Forward Analytic Interest Rate
Amortizing Floating Rate Note IR LIBOR Market Model Backward Monte Carlo Interest Rate
Amortizing Floating Rate Note IR LIBOR Market Model Forward Monte Carlo Interest Rate
Amortizing Floating Rate Note IR Hull White 1-Factor
Model Backward Lattice Interest Rate
Amortizing Floating Rate Note IR Hull White 1-Factor
Model Backward Monte Carlo Interest Rate
Amortizing Floating Rate Note IR Hull White 1-Factor
Model
Backward Partial Differential
Equation Interest Rate
Amortizing Floating Rate Note IR Hull White 1-Factor
Model Backward Tree Interest Rate
Amortizing Floating Rate Note IR Hull White 1-Factor
Model Forward Monte Carlo Interest Rate
Amortizing Floating Rate Note IR Hull White 2-Factor
Model Backward Lattice Interest Rate
Amortizing Floating Rate Note IR Hull White 2-Factor
Model Backward Monte Carlo Interest Rate
Amortizing Floating Rate Note IR Hull White 2-Factor
Model
Backward Partial Differential
Equation Interest Rate
Amortizing Floating Rate Note IR Hull White 2-Factor
Model Forward Monte Carlo Interest Rate
Amortizing Swap IR Deterministic Model Backward Analytic Interest Rate
Amortizing Swap IR Deterministic Model Forward Analytic Interest Rate
Amortizing Swap IR LIBOR Market Model Backward Monte Carlo Interest Rate
Amortizing Swap IR LIBOR Market Model Forward Monte Carlo Interest Rate
Amortizing Swap IR Hull White 1-Factor Backward Lattice Interest Rate

Oracle Financial Services Market Risk Measurement and Management User Guide
Release 8.0.6.0.0
144
Instrument Type Model Method Asset Class
Model
Amortizing Swap IR Hull White 1-Factor
Model Backward Monte Carlo Interest Rate
Amortizing Swap IR Hull White 1-Factor
Model
Backward Partial Differential
Equation Interest Rate
Amortizing Swap IR Hull White 1-Factor
Model Backward Tree Interest Rate
Amortizing Swap IR Hull White 1-Factor
Model Forward Monte Carlo Interest Rate
Amortizing Swap IR Hull White 2-Factor
Model Backward Lattice Interest Rate
Amortizing Swap IR Hull White 2-Factor
Model Backward Monte Carlo Interest Rate
Amortizing Swap IR Hull White 2-Factor
Model
Backward Partial Differential
Equation Interest Rate
Amortizing Swap IR Hull White 2-Factor
Model Forward Monte Carlo Interest Rate
Callable Bond IR Deterministic Model Backward Analytic Interest Rate
Callable Bond IR Deterministic Model Forward Analytic Interest Rate
Callable Bond IR LIBOR Market Model Backward Monte Carlo Interest Rate
Callable Bond IR LIBOR Market Model Forward Monte Carlo Interest Rate
Callable Bond IR Hull White 1-Factor
Model Backward Lattice Interest Rate
Callable Bond IR Hull White 1-Factor
Model Backward Monte Carlo Interest Rate
Callable Bond IR Hull White 1-Factor
Model
Backward Partial Differential
Equation Interest Rate
Callable Bond IR Hull White 1-Factor
Model Backward Tree Interest Rate
Callable Bond IR Hull White 1-Factor
Model Forward Monte Carlo Interest Rate
Callable Bond IR Hull White 2-Factor Backward Lattice Interest Rate

Oracle Financial Services Market Risk Measurement and Management User Guide
Release 8.0.6.0.0
145
Instrument Type Model Method Asset Class
Model
Callable Bond IR Hull White 2-Factor
Model Backward Monte Carlo Interest Rate
Callable Bond IR Hull White 2-Factor
Model
Backward Partial Differential
Equation Interest Rate
Callable Bond IR Hull White 2-Factor
Model Forward Monte Carlo Interest Rate
Certificate of Deposit IR Deterministic Model Backward Analytic Interest Rate
Certificate of Deposit IR Deterministic Model Forward Analytic Interest Rate
Certificate of Deposit IR LIBOR Market Model Backward Monte Carlo Interest Rate
Certificate of Deposit IR LIBOR Market Model Forward Monte Carlo Interest Rate
Certificate of Deposit IR Hull White 1-Factor
Model Backward Lattice Interest Rate
Certificate of Deposit IR Hull White 1-Factor
Model Backward Monte Carlo Interest Rate
Certificate of Deposit IR Hull White 1-Factor
Model
Backward Partial Differential
Equation Interest Rate
Certificate of Deposit IR Hull White 1-Factor
Model Backward Tree Interest Rate
Certificate of Deposit IR Hull White 1-Factor
Model Forward Monte Carlo Interest Rate
Certificate of Deposit IR Hull White 2-Factor
Model Backward Lattice Interest Rate
Certificate of Deposit IR Hull White 2-Factor
Model Backward Monte Carlo Interest Rate
Certificate of Deposit IR Hull White 2-Factor
Model
Backward Partial Differential
Equation Interest Rate
Certificate of Deposit IR Hull White 2-Factor
Model Forward Monte Carlo Interest Rate
Commodity Swaption Commodity Black Model Not applicable Commodity
European Swaption IR Hull White 2-Factor
Model Backward Lattice Interest Rate

Oracle Financial Services Market Risk Measurement and Management User Guide
Release 8.0.6.0.0
146
Instrument Type Model Method Asset Class
European Swaption IR Hull White 2-Factor
Model Backward Monte Carlo Interest Rate
European Swaption IR Hull White 2-Factor
Model
Backward Partial Differential
Equation Interest Rate
European Swaption IR Hull White 2-Factor
Model Forward Monte Carlo Interest Rate
European Swaption IR Hull White 1-Factor
Model Backward Lattice Interest Rate
European Swaption IR Hull White 1-Factor
Model Backward Monte Carlo Interest Rate
European Swaption IR Hull White 1-Factor
Model
Backward Partial Differential
Equation Interest Rate
European Swaption IR Hull White 1-Factor
Model Backward Tree Interest Rate
European Swaption IR Hull White 1-Factor
Model Forward Monte Carlo Interest Rate
European Swaption IR LIBOR Market Model Backward Monte Carlo Interest Rate
European Swaption IR LIBOR Market Model Forward Monte Carlo Interest Rate
Generic Swap IR Deterministic Model Backward Analytic Interest Rate
Generic Swap IR Deterministic Model Forward Analytic Interest Rate
Generic Swap IR LIBOR Market Model Backward Monte Carlo Interest Rate
Generic Swap IR LIBOR Market Model Forward Monte Carlo Interest Rate
Generic Swap IR Hull White 1-Factor
Model Backward Lattice Interest Rate
Generic Swap IR Hull White 1-Factor
Model Backward Monte Carlo Interest Rate
Generic Swap IR Hull White 1-Factor
Model
Backward Partial Differential
Equation Interest Rate
Generic Swap IR Hull White 1-Factor
Model Backward Tree Interest Rate
Generic Swap IR Hull White 1-Factor
Model Forward Monte Carlo Interest Rate

Oracle Financial Services Market Risk Measurement and Management User Guide
Release 8.0.6.0.0
147
Instrument Type Model Method Asset Class
Generic Swap IR Hull White 2-Factor
Model Backward Lattice Interest Rate
Generic Swap IR Hull White 2-Factor
Model Backward Monte Carlo Interest Rate
Generic Swap IR Hull White 2-Factor
Model
Backward Partial Differential
Equation Interest Rate
Generic Swap IR Hull White 2-Factor
Model Forward Monte Carlo Interest Rate
Table 23 List of Models and Methods

Oracle Financial Services Market Risk Measurement and Management User Guide
Release 8.0.6.0.0
148
1166 AAnnnneexxuurree EE:: MMRR RReeppoorrttss
See the OFS Market Risk Measurement and Management Analytics User Guide Release
8.0.6.0.0 on OHC Documentation Library for details about reports.

Oracle Financial Services Market Risk Measurement and Management User Guide
Release 8.0.6.0.0
149
1177 AAnnnneexxuurree FF:: DDaattaa EExxppeeccttaattiioonn
For information about stage tables in which input data of below types is expected, see OFS
MRMM Download Specification and Run chart document in MOS.
Trade Data
Market Data
Reference Data

Oracle Financial Services Market Risk Measurement and Management User Guide
Release 8.0.6.0.0
150
Oracle Financial Services Market Risk
Measurement and Management
User Guide
August 2018
Oracle Corporation
World Headquarters
500 Oracle Parkway
Redwood Shores, CA 94065
U.S.A.
Worldwide Inquiries:
Phone: +1.650.506.7000
Fax: +1.650.506.7200
oracle.com
Copyright © 2018, Oracle and/or its affiliates. All rights reserved. This document is provided for information purposes only and the
contents hereof are subject to change without notice. This document is not warranted to be error-free, nor subject to any other
warranties or conditions, whether expressed orally or implied in law, including implied warranties and conditions of merchantability or
fitness for a particular purpose. We specifically disclaim any liability with respect to this document and no contractual obligations are
formed either directly or indirectly by this document. This document may not be reproduced or transmitted in any form or by any
means, electronic or mechanical, for any purpose, without our prior written permission.
Oracle and Java are registered trademarks of Oracle and/or its affiliates. Other names may be trademarks of their respective owners.
Intel and Intel Xeon are trademarks or registered trademarks of Intel Corporation. All SPARC trademarks are used under license and
are trademarks or registered trademarks of SPARC International, Inc. AMD, Opteron, the AMD logo, and the AMD Opteron logo are
trademarks or registered trademarks of Advanced Micro Devices. UNIX is a registered trademark licensed through X/Open
Company, Ltd. 0611