Embed Size (px)
Citation preview

Table of Contents
UNITED STATES
SECURITIES AND EXCHANGE COMMISSIONWashington, D.C. 20549
FORM 10-Q
☒
QUARTERLY REPORT PURSUANT TO SECTION 13 OR 15(d) OF THE SECURITIESEXCHANGE ACT OF 1934
For the quarterly period ended November 30, 2017
or
☐
TRANSITION REPORT PURSUANT TO SECTION 13 OR 15(d) OF THE SECURITIESEXCHANGE ACT OF 1934
For the transition period from to
Commission File Number: 001-35992
Oracle Corporation(Exact name of registrant as specified in its charter)
Delaware 54-2185193
(State or other jurisdiction ofincorporation or organization)
(I.R.S. EmployerIdentification No.)
500 Oracle ParkwayRedwood City, California 94065
(Address of principal executive offices) (Zip Code)
(650) 506-7000(Registrant’s telephone number, including area code)
Indicate by check mark whether the registrant (1) has filed all reports required to be filed by Section 13 or 15(d) of the Securities Exchange Act of 1934 during thepreceding 12 months (or for such shorter period that the registrant was required to file such reports), and (2) has been subject to such filing requirements for thepast 90 days. Yes ☒ No ☐
Indicate by check mark whether the registrant has submitted electronically and posted on its corporate Web site, if any, every Interactive Data File required to besubmitted and posted pursuant to Rule 405 of Regulation S-T (§232.405 of this chapter) during the preceding 12 months (or for such shorter period that theregistrant was required to submit and post such files). Yes ☒ No ☐
Indicate by check mark whether the registrant is a large accelerated filer, an accelerated filer, a non-accelerated filer, a smaller reporting company or an emerginggrowth company. See the definitions of “large accelerated filer,” “accelerated filer,” “smaller reporting company” and “emerging growth company” in Rule 12b-2of the Exchange Act.
Large accelerated filer ☒ Accelerated filer ☐Non-accelerated filer ☐ Smaller reporting company ☐
(Do not check if a smaller reporting company) Emerging growth company ☐
If an emerging growth company, indicate by check mark if the registrant has elected not to use the extended transition period for complying with any new orrevised financial accounting standards provided pursuant to Section 13(a) of the Exchange Act. ☐
Indicate by check mark whether the registrant is a shell company (as defined in Rule 12b-2 of the Exchange Act). Yes ☐ No ☒The number of shares of registrant’s common stock outstanding as of December 11, 2017 was: 4,139,602,000.
Table of Contents
ORACLE CORPORATIONFORM 10-Q QUARTERLY REPORT
TABLE OF CONTENTS Page PART I. FINANCIAL INFORMATION
Item 1. Financial Statements (Unaudited) 3
Condensed Consolidated Balance Sheets as of November 30, 2017 and May 31, 2017 3
Condensed Consolidated Statements of Operations for the Three and Six Months Ended November 30, 2017 and 2016 4
Condensed Consolidated Statements of Comprehensive Income for the Three and Six Months Ended November 30, 2017 and 2016 5
Condensed Consolidated Statements of Cash Flows for the Six Months Ended November 30, 2017 and 2016 6
Notes to Condensed Consolidated Financial Statements 7
Item 2. Management’s Discussion and Analysis of Financial Condition and Results of Operations 25
Item 3. Quantitative and Qualitative Disclosures About Market Risk 44
Item 4. Controls and Procedures 44
PART II. OTHER INFORMATION
Item 1. Legal Proceedings 45
Item 1A. Risk Factors 45
Item 2. Unregistered Sales of Equity Securities and Use of Proceeds 45
Item 6. Exhibits 46
Signatures 47

Table of Contents
Cautionary Note on Forward-Looking Statements
For purposes of this Quarterly Report, the terms “Oracle,” “we,” “us” and “our” refer to Oracle Corporation and its consolidated subsidiaries. This Quarterly Reporton Form 10-Q contains statements that are not historical in nature, are predictive in nature, or that depend upon or refer to future events or conditions or otherwisecontain forward-looking statements within the meaning of Section 21 of the Securities Exchange Act of 1934, as amended, and the Private Securities LitigationReform Act of 1995. These include, among other things, statements regarding:
• our expectation that we will continue to acquire companies, products, services and technologies to further our corporate strategy;
• our belief that our acquisitions enhance the products and services that we can offer to customers, expand our customer base, provide greater scale to
accelerate innovation, grow our revenues and earnings, and increase stockholder value;
• our expectation that, on a constant currency basis, our total cloud and on-premise software revenues generally will continue to increase due to expected
growth from our cloud software as a service (SaaS) and cloud platform as a service (PaaS) and infrastructure as a service (IaaS) offerings, continueddemand for our on-premise software products and software license updates and product support offerings, and contributions from acquisitions;
• our expectation that we will continue to place significant strategic emphasis on growing our cloud SaaS and cloud PaaS and IaaS offerings, which has
affected the growth of our new software license revenues and hardware revenues and to a lesser extent, has also affected the growth of our softwarelicense updates and product support revenues;
• our intention that we will renew our cloud SaaS and cloud PaaS and IaaS contracts when they are eligible for renewal;
• our expectation that our hardware business will have lower operating margins as a percentage of revenues than our cloud and on-premise software
business;
• our expectation that we will continue to make significant investments in research and development and related product opportunities, including those
related to hardware products and services, and our belief that research and development efforts are essential to maintaining our competitive position;
• our expectation that our international operations will continue to provide a significant portion of our total revenues and expenses;
• the sufficiency of our sources of funding for working capital, capital expenditures, contractual obligations, acquisitions, dividends, stock repurchases, debt
repayments and other matters;
• our belief that we have adequately provided under U.S. generally accepted accounting principles for outcomes related to our tax audits and that the final
outcome of our tax related examinations, agreements or judicial proceedings will not have a material effect on our results of operations, and our belief thatour net deferred tax assets will be realized in the foreseeable future;
• our belief that the outcome of certain legal proceedings and claims to which we are a party will not, individually or in the aggregate, result in losses that
are materially in excess of amounts already recognized, if any;
• the possibility that certain legal proceedings to which we are a party could have a material impact on our future cash flows and results of operations;
• our expectations regarding the timing and amount of expenses relating to the Fiscal 2017 Oracle Restructuring Plan and the improved efficiencies in our
operations that such plan will create;
• the timing and amount of our stock repurchases, including our expectation that the levels of our future stock repurchase activity may be modified in
comparison to past periods in order to use available cash for other purposes;
1

Table of Contents
• our expectations regarding the impact of recent accounting pronouncements on our consolidated financial statements;
• our expectation that to the extent customers renew support contracts or cloud SaaS and cloud PaaS and IaaS contracts from companies that we have
acquired, we will recognize revenues for the full contracts’ values over the respective renewal periods;
• our ability to predict quarterly hardware revenues;
as well as other statements regarding our future operations, financial condition and prospects, and business strategies. Forward-looking statements may be precededby, followed by or include the words “expects,” “anticipates,” “intends,” “plans,” “believes,” “seeks,” “strives,” “estimates,” “will,” “should,” “is designed to” andsimilar expressions. We claim the protection of the safe harbor for forward-looking statements contained in the Private Securities Litigation Reform Act of 1995 forall forward-looking statements. We have based these forward-looking statements on our current expectations and projections about future events. These forward-looking statements are subject to risks, uncertainties and assumptions about our business that could affect our future results and could cause those results or otheroutcomes to differ materially from those expressed or implied in the forward-looking statements. Factors that might cause or contribute to such differences include,but are not limited to, those discussed in “Risk Factors” included in documents we file from time to time with the U.S. Securities and Exchange Commission (theSEC), including our Annual Report on Form 10-K for our fiscal year ended May 31, 2017 and our other Quarterly Reports on Form 10-Q to be filed by us in ourfiscal year 2018, which runs from June 1, 2017 to May 31, 2018.
We have no obligation to publicly update or revise any forward-looking statements, whether as a result of new information, future events or risks, except to theextent required by applicable securities laws. If we do update one or more forward-looking statements, no inference should be drawn that we will make additionalupdates with respect to those or other forward-looking statements. New information, future events or risks could cause the forward-looking events we discuss inthis Quarterly Report not to occur. You should not place undue reliance on these forward-looking statements, which reflect our expectations only as of the date ofthis Quarterly Report.
2

Table of Contents
PART I. FINANCIAL INFORMATION
Item 1. Financial Statements (Unaudited)
ORACLE CORPORATIONCONDENSED CONSOLIDATED BALANCE SHEETS
As of November 30, 2017 and May 31, 2017(Unaudited)
(in millions, except per share data) November 30, 2017
May 31, 2017
ASSETS Current assets:
Cash and cash equivalents $ 21,310 $ 21,784 Marketable securities 50,270 44,294 Trade receivables, net of allowances for doubtful accounts of $339 and $319 as of November 30, 2017 and
May 31, 2017, respectively 3,798 5,300 Inventories 436 300 Prepaid expenses and other current assets 2,731 2,837
Total current assets 78,545 74,515
Non-current assets: Property, plant and equipment, net 5,868 5,315 Intangible assets, net 6,794 7,679 Goodwill, net 42,964 43,045 Deferred tax assets 1,222 1,143 Other assets 3,369 3,294
Total non-current assets 60,217 60,476
Total assets $ 138,762 $ 134,991
LIABILITIES AND EQUITY Current liabilities:
Notes payable and other borrowings, current $ 2,499 $ 9,797 Accounts payable 554 599 Accrued compensation and related benefits 1,500 1,966 Deferred revenues 8,076 8,233 Other current liabilities 2,865 3,583
Total current liabilities 15,494 24,178
Non-current liabilities: Notes payable and other borrowings, non-current 58,170 48,112 Income taxes payable 6,082 5,681 Other non-current liabilities 2,716 2,774
Total non-current liabilities 66,968 56,567
Commitments and contingencies Oracle Corporation stockholders’ equity:
Preferred stock, $0.01 par value—authorized: 1.0 shares; outstanding: none — — Common stock, $0.01 par value and additional paid in capital—authorized: 11,000 shares; outstanding: 4,143
shares and 4,137 shares as of November 30, 2017 and May 31, 2017, respectively 28,474 27,065 Retained earnings 28,296 27,598 Accumulated other comprehensive loss (902) (803)
Total Oracle Corporation stockholders’ equity 55,868 53,860 Noncontrolling interests 432 386
Total equity 56,300 54,246
Total liabilities and equity $ 138,762 $ 134,991
See notes to condensed consolidated financial statements.
3
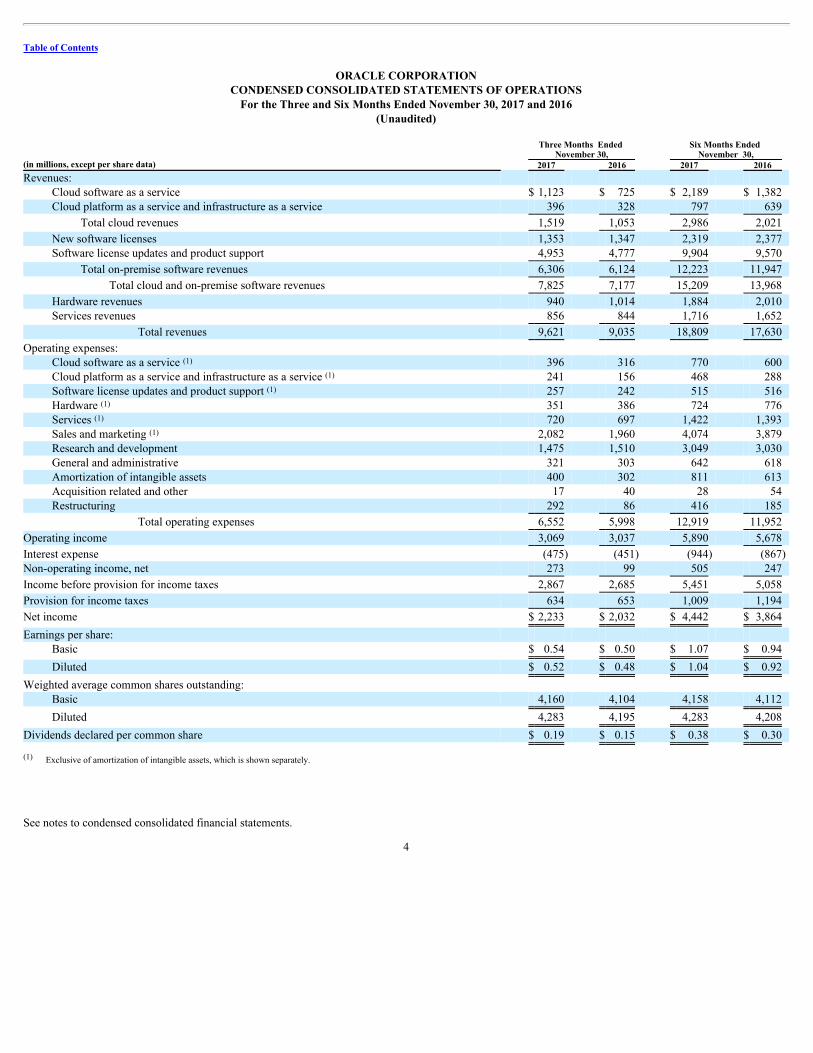
Table of Contents
ORACLE CORPORATIONCONDENSED CONSOLIDATED STATEMENTS OF OPERATIONS
For the Three and Six Months Ended November 30, 2017 and 2016(Unaudited)
Three Months Ended
November 30, Six Months Ended
November 30, (in millions, except per share data) 2017 2016 2017 2016 Revenues:
Cloud software as a service $ 1,123 $ 725 $ 2,189 $ 1,382 Cloud platform as a service and infrastructure as a service 396 328 797 639
Total cloud revenues 1,519 1,053 2,986 2,021
New software licenses 1,353 1,347 2,319 2,377 Software license updates and product support 4,953 4,777 9,904 9,570
Total on-premise software revenues 6,306 6,124 12,223 11,947
Total cloud and on-premise software revenues 7,825 7,177 15,209 13,968
Hardware revenues 940 1,014 1,884 2,010 Services revenues 856 844 1,716 1,652
Total revenues 9,621 9,035 18,809 17,630
Operating expenses: Cloud software as a service 396 316 770 600 Cloud platform as a service and infrastructure as a service 241 156 468 288 Software license updates and product support 257 242 515 516 Hardware 351 386 724 776 Services 720 697 1,422 1,393 Sales and marketing 2,082 1,960 4,074 3,879 Research and development 1,475 1,510 3,049 3,030 General and administrative 321 303 642 618 Amortization of intangible assets 400 302 811 613 Acquisition related and other 17 40 28 54 Restructuring 292 86 416 185
Total operating expenses 6,552 5,998 12,919 11,952
Operating income 3,069 3,037 5,890 5,678
Interest expense (475) (451) (944) (867) Non-operating income, net 273 99 505 247
Income before provision for income taxes 2,867 2,685 5,451 5,058
Provision for income taxes 634 653 1,009 1,194
Net income $ 2,233 $ 2,032 $ 4,442 $ 3,864
Earnings per share: Basic $ 0.54 $ 0.50 $ 1.07 $ 0.94
Diluted $ 0.52 $ 0.48 $ 1.04 $ 0.92
Weighted average common shares outstanding: Basic 4,160 4,104 4,158 4,112
Diluted 4,283 4,195 4,283 4,208
Dividends declared per common share $ 0.19 $ 0.15 $ 0.38 $ 0.30
Exclusive of amortization of intangible assets, which is shown separately.
See notes to condensed consolidated financial statements.
4
(1)
(1)
(1)
(1)
(1)
(1)
(1)

Table of Contents
ORACLE CORPORATIONCONDENSED CONSOLIDATED STATEMENTS OF COMPREHENSIVE INCOME
For the Three and Six Months Ended November 30, 2017 and 2016(Unaudited)
Three Months Ended
November 30, Six Months Ended
November 30, (in millions) 2017 2016 2017 2016 Net income $ 2,233 $ 2,032 $ 4,442 $ 3,864 Other comprehensive loss, net of tax:
Net foreign currency translation losses (40) (204) (2) (71) Net unrealized gains on defined benefit plans 11 2 18 7 Net unrealized losses on marketable securities (192) (356) (128) (213) Net unrealized gains on cash flow hedges 35 19 13 21
Total other comprehensive loss, net (186) (539) (99) (256)
Comprehensive income $ 2,047 $ 1,493 $ 4,343 $ 3,608
See notes to condensed consolidated financial statements.
5

Table of Contents
ORACLE CORPORATIONCONDENSED CONSOLIDATED STATEMENTS OF CASH FLOWS
For the Six Months Ended November 30, 2017 and 2016(Unaudited)
Six Months Ended
November 30, (in millions) 2017 2016 Cash flows from operating activities:
Net income $ 4,442 $ 3,864 Adjustments to reconcile net income to net cash provided by operating activities:
Depreciation 573 463 Amortization of intangible assets 811 613 Deferred income taxes 95 103 Stock-based compensation 822 646 Other, net 81 85 Changes in operating assets and liabilities, net of effects from acquisitions:
Decrease in trade receivables, net 1,529 1,680 Increase in inventories (135) (116) Decrease in prepaid expenses and other assets 138 321 Decrease in accounts payable and other liabilities (618) (499) Increase in income taxes payable 22 9 Decrease in deferred revenues (344) (208)
Net cash provided by operating activities 7,416 6,961
Cash flows from investing activities: Purchases of marketable securities and other investments (18,022) (10,090) Proceeds from maturities and sales of marketable securities and other investments 11,566 6,080 Acquisitions, net of cash acquired — (9,854) Capital expenditures (1,072) (1,056)
Net cash used for investing activities (7,528) (14,920)
Cash flows from financing activities: Payments for repurchases of common stock (2,454) (2,569) Proceeds from issuances of common stock 1,353 746 Shares repurchased for tax withholdings upon vesting of restricted stock-based awards (434) (188) Payments of dividends to stockholders (1,579) (1,232) Proceeds from borrowings, net of issuance costs 9,945 13,932 Repayments of borrowings (7,300) (3,750) Distributions to noncontrolling interests (34) (200)
Net cash (used for) provided by financing activities (503) 6,739
Effect of exchange rate changes on cash and cash equivalents 141 (340)
Net decrease in cash and cash equivalents (474) (1,560) Cash and cash equivalents at beginning of period 21,784 20,152
Cash and cash equivalents at end of period $ 21,310 $ 18,592
Non-cash investing and financing transactions: Fair values of restricted stock-based awards and stock options assumed in connection with acquisitions $ — $ 84 Increase (decrease) in unsettled repurchases of common stock $ 47 $ (70) Decrease in unsettled investment purchases $ (303) $ (130)
See notes to condensed consolidated financial statements.
6
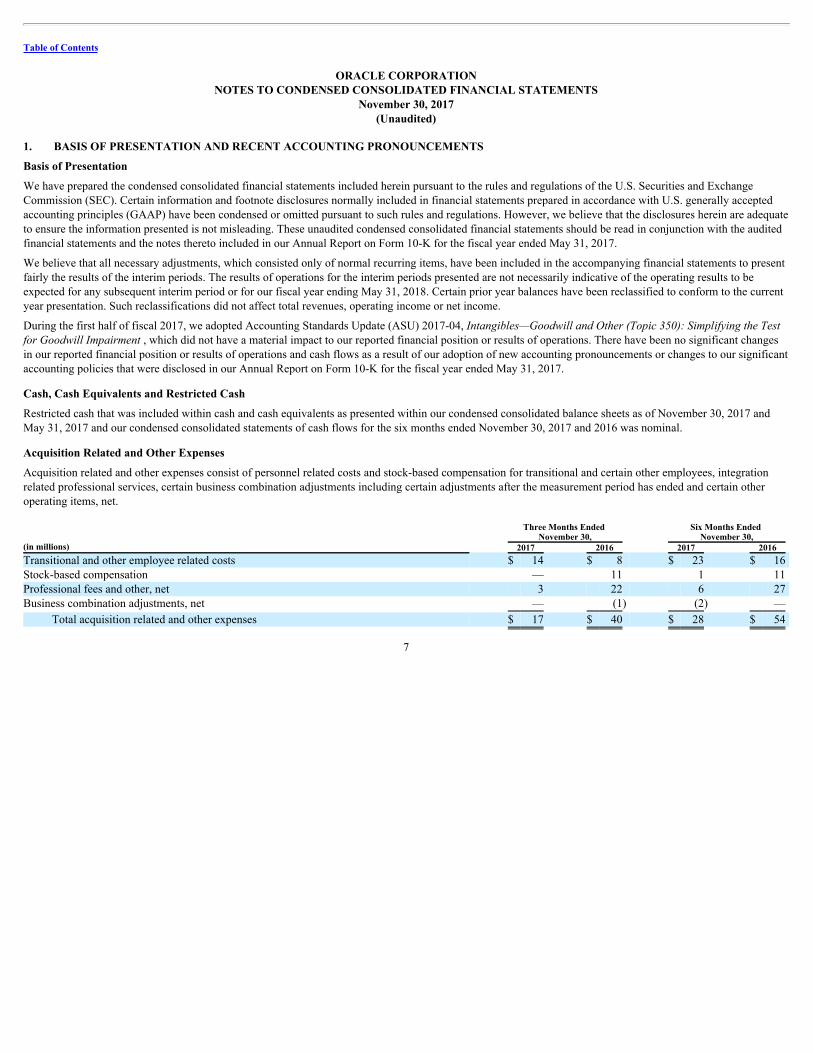
Table of Contents
ORACLE CORPORATIONNOTES TO CONDENSED CONSOLIDATED FINANCIAL STATEMENTS
November 30, 2017(Unaudited)
1. BASIS OF PRESENTATION AND RECENT ACCOUNTING PRONOUNCEMENTS
Basis of Presentation
We have prepared the condensed consolidated financial statements included herein pursuant to the rules and regulations of the U.S. Securities and ExchangeCommission (SEC). Certain information and footnote disclosures normally included in financial statements prepared in accordance with U.S. generally acceptedaccounting principles (GAAP) have been condensed or omitted pursuant to such rules and regulations. However, we believe that the disclosures herein are adequateto ensure the information presented is not misleading. These unaudited condensed consolidated financial statements should be read in conjunction with the auditedfinancial statements and the notes thereto included in our Annual Report on Form 10-K for the fiscal year ended May 31, 2017.
We believe that all necessary adjustments, which consisted only of normal recurring items, have been included in the accompanying financial statements to presentfairly the results of the interim periods. The results of operations for the interim periods presented are not necessarily indicative of the operating results to beexpected for any subsequent interim period or for our fiscal year ending May 31, 2018. Certain prior year balances have been reclassified to conform to the currentyear presentation. Such reclassifications did not affect total revenues, operating income or net income.
During the first half of fiscal 2017, we adopted Accounting Standards Update (ASU) 2017-04, Intangibles—GoodwillandOther(Topic350):SimplifyingtheTestforGoodwillImpairment, which did not have a material impact to our reported financial position or results of operations. There have been no significant changesin our reported financial position or results of operations and cash flows as a result of our adoption of new accounting pronouncements or changes to our significantaccounting policies that were disclosed in our Annual Report on Form 10-K for the fiscal year ended May 31, 2017.
Cash, Cash Equivalents and Restricted Cash
Restricted cash that was included within cash and cash equivalents as presented within our condensed consolidated balance sheets as of November 30, 2017 andMay 31, 2017 and our condensed consolidated statements of cash flows for the six months ended November 30, 2017 and 2016 was nominal.
Acquisition Related and Other Expenses
Acquisition related and other expenses consist of personnel related costs and stock-based compensation for transitional and certain other employees, integrationrelated professional services, certain business combination adjustments including certain adjustments after the measurement period has ended and certain otheroperating items, net.
Three Months Ended
November 30, Six Months Ended
November 30, (in millions) 2017 2016 2017 2016 Transitional and other employee related costs $ 14 $ 8 $ 23 $ 16 Stock-based compensation — 11 1 11 Professional fees and other, net 3 22 6 27 Business combination adjustments, net — (1) (2) —
Total acquisition related and other expenses $ 17 $ 40 $ 28 $ 54
7

Table of Contents
ORACLE CORPORATIONNOTES TO CONDENSED CONSOLIDATED FINANCIAL STATEMENTS—(Continued)
November 30, 2017(Unaudited)
Non-Operating Income, net
Non-operating income, net consists primarily of interest income, net foreign currency exchange gains (losses), the noncontrolling interests in the net profits of ourmajority-owned subsidiaries (primarily Oracle Financial Services Software Limited and Oracle Japan) and net other income (losses), including net realized gainsand losses related to all of our investments and net unrealized gains and losses related to the small portion of our investment portfolio that we classify as trading.
Three Months Ended
November 30, Six Months Ended
November 30, (in millions) 2017 2016 2017 2016 Interest income $ 279 $ 204 $ 536 $ 381 Foreign currency losses, net (7) (69) (11) (82) Noncontrolling interests in income (28) (41) (75) (76) Other income, net 29 5 55 24
Total non-operating income, net $ 273 $ 99 $ 505 $ 247
Sales of Financing Receivables
We offer certain of our customers the option to acquire our software products, hardware products and services offerings through separate long-term paymentcontracts. We generally sell these contracts that we have financed for our customers on a non-recourse basis to financial institutions within 90 days of the contracts’dates of execution. We record the transfers of amounts due from customers to financial institutions as sales of financing receivables because we are considered tohave surrendered control of these financing receivables. Financing receivables sold to financial institutions were $159 million and $1.0 billion for the three and sixmonths ended November 30, 2017, respectively, and $121 million and $1.0 billion for the three and six months ended November 30, 2016, respectively.
Recent Accounting Pronouncements
DerivativesandHedging: In August 2017, the Financial Accounting Standards Board (FASB) issued ASU 2017-12, DerivativesandHedging(Topic815):TargetedImprovementstoAccountingforHedgingActivities(ASU 2017-12), which amends and simplifies existing guidance in order to allow companies to moreaccurately present the economic effects of risk management activities in the financial statements. ASU 2017-12 is effective for us in the first quarter of fiscal 2020,and earlier adoption is permitted. We are currently evaluating the impact of our pending adoption of ASU 2017-12 on our consolidated financial statements.
RetirementBenefits: In March 2017, the FASB issued ASU 2017-07, Compensation—RetirementBenefits(Topic715):ImprovingthePresentationofNetPeriodicPensionCostandNetPeriodicPostretirementBenefitCost(ASU 2017-07), which provides guidance on the capitalization, presentation and disclosure ofnet benefit costs. ASU 2017-07 is effective for us in the first quarter of fiscal 2019. We are currently evaluating the impact of our pending adoption of ASU2017-07 on our consolidated financial statements.
IncomeTaxes: In October 2016, the FASB issued ASU 2016-16, IncomeTaxes(Topic740):Intra-EntityTransfersofAssetsOtherThanInventory(ASU2016-16), which changes the timing of when certain intercompany transactions are recognized within the provision for income taxes. ASU 2016-16 is effective forus in our first quarter of fiscal 2019 on a modified retrospective basis, and earlier adoption is permitted. We are currently evaluating the impact of our pendingadoption of ASU 2016-16 on our consolidated financial statements.
8
Table of Contents
ORACLE CORPORATIONNOTES TO CONDENSED CONSOLIDATED FINANCIAL STATEMENTS—(Continued)
November 30, 2017(Unaudited)
FinancialInstruments: In June 2016, the FASB issued ASU 2016-13, FinancialInstruments—CreditLosses(Topic326):MeasurementofCreditLossesonFinancialInstruments(ASU 2016-13), which requires measurement and recognition of expected credit losses for financial assets held. ASU 2016-13 is effectivefor us in our first quarter of fiscal 2021, and earlier adoption is permitted beginning in the first quarter of fiscal 2020. We are currently evaluating the impact of ourpending adoption of ASU 2016-13 on our consolidated financial statements.
In January 2016, the FASB issued ASU 2016-01, FinancialInstruments—Overall(Subtopic825-10):RecognitionandMeasurementofFinancialAssetsandFinancialLiabilities(ASU 2016-01), which addresses certain aspects of recognition, measurement, presentation, and disclosure of financial instruments. ASU2016-01 is effective for us in our first quarter of fiscal 2019, and earlier adoption is not permitted except for certain provisions. We currently do not expect that ourpending adoption of ASU 2016-01 will have a material effect on our consolidated financial statements.
Leases: In February 2016, the FASB issued ASU 2016-02, Leases(Topic842)and issued subsequent amendments to the initial guidance in September 2017within ASU 2017-13 (collectively, Topic 842). Topic 842 requires companies to generally recognize on the balance sheet operating and financing lease liabilitiesand corresponding right-of-use assets. Topic 842 is effective for us in our first quarter of fiscal 2020 on a modified retrospective basis, and earlier adoption ispermitted. We are currently evaluating the impact of our pending adoption of Topic 842 on our consolidated financial statements. We currently expect that most ofour operating lease commitments will be subject to the new standard and recognized as operating lease liabilities and right-of-use assets upon our adoption of Topic842, which will increase our total assets and total liabilities that we report relative to such amounts prior to adoption.
RevenueRecognition: In May 2014, the FASB issued ASU 2014-09, RevenuefromContractswithCustomers:Topic606and issued subsequent amendments tothe initial guidance in August 2015, March 2016, April 2016, May 2016, December 2016, May 2017 and September 2017 within ASU 2015-14, ASU 2016-08,ASU 2016-10, ASU 2016-12, ASU 2016-20, ASU 2017-10, ASU 2017-13 and ASU 2017-14, respectively (collectively, Topic 606). Topic 606 supersedes nearlyall existing revenue recognition guidance under GAAP. The core principle of Topic 606 is to recognize revenues when promised goods or services are transferredto customers in an amount that reflects the consideration that is expected to be received for those goods or services. Topic 606 defines a five-step process to achievethis core principle and, in doing so, it is possible more judgment and estimates may be required within the revenue recognition process than are required underexisting GAAP, including identifying performance obligations in the contract, estimating the amount of variable consideration to include in the transaction priceand allocating the transaction price to each separate performance obligation, among others. Topic 606 also provides guidance on the recognition of costs related toobtaining customer contracts. Topic 606 is effective for us as of our first quarter of fiscal 2019 using either of two methods: (1) retrospective application of Topic606 to each prior reporting period presented with the option to elect certain practical expedients as defined within Topic 606 or (2) retrospective application ofTopic 606 with the cumulative effect of initially applying Topic 606 recognized at the date of initial application and providing certain additional disclosures asdefined per Topic 606. The accounting for the recognition of costs related to obtaining customer contracts under Topic 606 is significantly different than ourcurrent capitalization policy. The adoption of Topic 606 will result in additional types of costs that will be capitalized. Additionally, it is possible that amountscapitalized will be amortized over a period longer than our current policy. We plan to adopt Topic 606 in the first quarter of fiscal 2019 pursuant to theaforementioned adoption method (1) and we do not believe there will be a material impact to our revenues upon adoption. We are continuing to evaluate the impactto our revenues and costs related to our pending adoption of Topic 606 and our preliminary assessments are subject to change.
9

Table of Contents
ORACLE CORPORATIONNOTES TO CONDENSED CONSOLIDATED FINANCIAL STATEMENTS—(Continued)
November 30, 2017(Unaudited)
2. ACQUISITIONS
Fiscal 2017 Acquisition of NetSuite Inc., a Related Party
On November 7, 2016, we completed our acquisition of NetSuite Inc. (NetSuite), a provider of cloud-based enterprise resource planning (ERP) software and relatedapplications and a related party to Oracle. We acquired NetSuite to, among other things, expand our cloud software as a service offerings with a complementary setof cloud ERP and related cloud software applications for customers.
Lawrence J. Ellison, Oracle’s Chairman of the Board and Chief Technology Officer and Oracle’s largest stockholder, is an affiliate of NetSuite’s largeststockholder, NetSuite Restricted Holdings LLC (a single member LLC investment entity whose interests are beneficially owned by a trust controlled byMr. Ellison), which owned approximately 40% of the issued and outstanding NetSuite Shares immediately prior to the conclusion of the merger.
The total purchase price for NetSuite was approximately $9.1 billion, which consisted of approximately $9.0 billion in cash and $78 million for the fair values ofrestricted stock-based awards and stock options assumed. In allocating the purchase price based on estimated fair values, we recorded approximately $6.7 billion ofgoodwill, $3.2 billion of identifiable intangible assets and $763 million of net tangible liabilities. See Note 2 of Notes to Consolidated Financial Statementsincluded in our Annual Report on Form 10-K for the fiscal year ended May 31, 2017 for additional information regarding our acquisition of NetSuite.
Other Fiscal 2017 Acquisitions
During fiscal 2017, we acquired certain companies and purchased certain technology and development assets primarily to expand our cloud-based offerings. Theseacquisitions were not significant individually or in the aggregate. We have included the financial results of the acquired companies in our condensed consolidatedfinancial statements from their respective acquisition dates, and the results from each of these companies were not individually material to our condensedconsolidated financial statements. The total of the purchase prices, certain of which were preliminary, for these acquisitions was approximately $3.0 billion, whichconsisted of approximately $3.0 billion in cash and $13 million for the fair values of restricted stock-based awards and stock options assumed. As of November 30,2017, we recorded $244 million of net tangible assets and $948 million of identifiable intangible assets, based on their estimated fair values, and $1.8 billion ofresidual goodwill related to our fiscal 2017 acquisitions. Certain amounts included in these totals were preliminary and subject to change during the respectivemeasurement periods (up to one year from the respective acquisition dates) as we obtain additional information for the preliminary fair value estimates of the assetsacquired and liabilities assumed. The primary areas of those preliminary estimates that are not yet finalized related to certain tangible assets and liabilities acquired,identifiable intangible assets, certain legal matters, income and non-income based taxes and residual goodwill.
Unaudited Pro Forma Financial Information
The unaudited pro forma financial information in the table below summarizes the combined results of operations for Oracle, NetSuite and certain other companiesthat we acquired since the beginning of fiscal 2017 that were considered relevant for the purposes of unaudited pro forma financial information disclosure as if thecompanies were combined as of the beginning of fiscal 2017. The unaudited pro forma financial information for all periods presented included the businesscombination accounting effects resulting from these acquisitions, including amortization charges from acquired intangible assets (certain of which are preliminary),stock-based compensation charges for unvested restricted stock-based awards and stock options assumed, if any, and the related tax effects as though theaforementioned companies were combined as of the beginning of fiscal 2017. The unaudited pro forma financial information as presented below is forinformational purposes only and is not
10
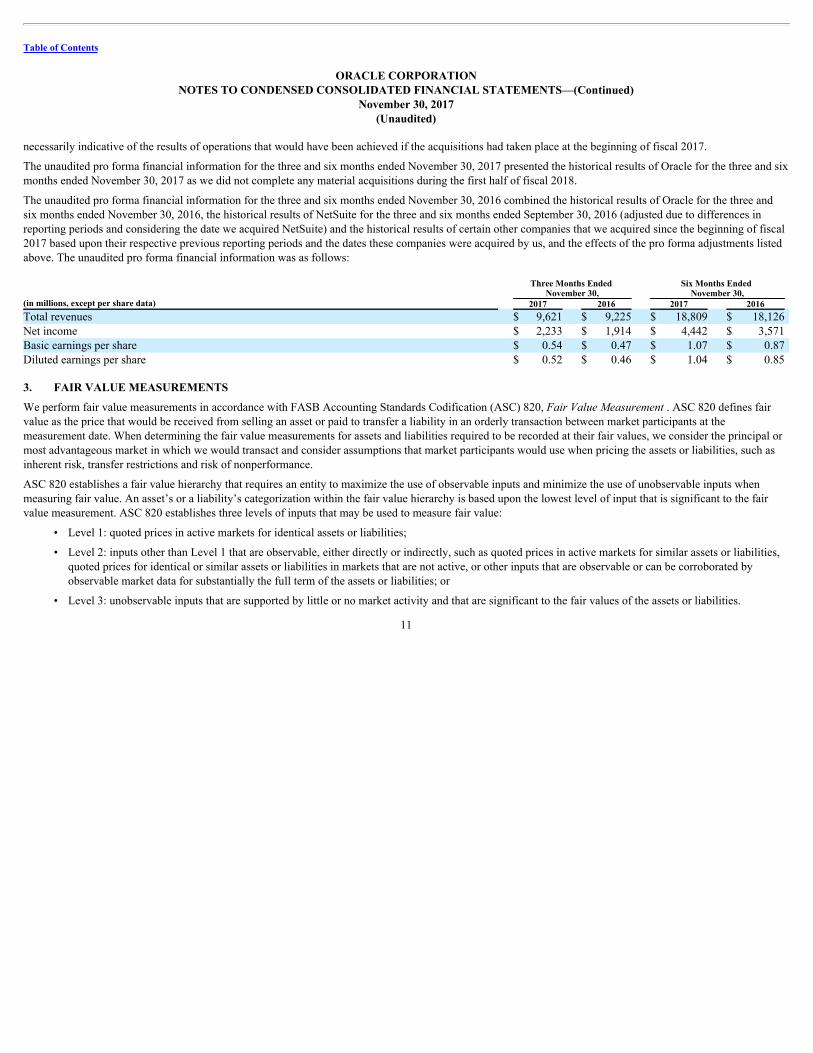
Table of Contents
ORACLE CORPORATIONNOTES TO CONDENSED CONSOLIDATED FINANCIAL STATEMENTS—(Continued)
November 30, 2017(Unaudited)
necessarily indicative of the results of operations that would have been achieved if the acquisitions had taken place at the beginning of fiscal 2017.
The unaudited pro forma financial information for the three and six months ended November 30, 2017 presented the historical results of Oracle for the three and sixmonths ended November 30, 2017 as we did not complete any material acquisitions during the first half of fiscal 2018.
The unaudited pro forma financial information for the three and six months ended November 30, 2016 combined the historical results of Oracle for the three andsix months ended November 30, 2016, the historical results of NetSuite for the three and six months ended September 30, 2016 (adjusted due to differences inreporting periods and considering the date we acquired NetSuite) and the historical results of certain other companies that we acquired since the beginning of fiscal2017 based upon their respective previous reporting periods and the dates these companies were acquired by us, and the effects of the pro forma adjustments listedabove. The unaudited pro forma financial information was as follows:
Three Months Ended
November 30, Six Months Ended
November 30, (in millions, except per share data) 2017 2016 2017 2016 Total revenues $ 9,621 $ 9,225 $ 18,809 $ 18,126 Net income $ 2,233 $ 1,914 $ 4,442 $ 3,571 Basic earnings per share $ 0.54 $ 0.47 $ 1.07 $ 0.87 Diluted earnings per share $ 0.52 $ 0.46 $ 1.04 $ 0.85 3. FAIR VALUE MEASUREMENTS
We perform fair value measurements in accordance with FASB Accounting Standards Codification (ASC) 820, FairValueMeasurement. ASC 820 defines fairvalue as the price that would be received from selling an asset or paid to transfer a liability in an orderly transaction between market participants at themeasurement date. When determining the fair value measurements for assets and liabilities required to be recorded at their fair values, we consider the principal ormost advantageous market in which we would transact and consider assumptions that market participants would use when pricing the assets or liabilities, such asinherent risk, transfer restrictions and risk of nonperformance.
ASC 820 establishes a fair value hierarchy that requires an entity to maximize the use of observable inputs and minimize the use of unobservable inputs whenmeasuring fair value. An asset’s or a liability’s categorization within the fair value hierarchy is based upon the lowest level of input that is significant to the fairvalue measurement. ASC 820 establishes three levels of inputs that may be used to measure fair value:
• Level 1: quoted prices in active markets for identical assets or liabilities;
• Level 2: inputs other than Level 1 that are observable, either directly or indirectly, such as quoted prices in active markets for similar assets or liabilities,
quoted prices for identical or similar assets or liabilities in markets that are not active, or other inputs that are observable or can be corroborated byobservable market data for substantially the full term of the assets or liabilities; or
• Level 3: unobservable inputs that are supported by little or no market activity and that are significant to the fair values of the assets or liabilities.
11

Table of Contents
ORACLE CORPORATIONNOTES TO CONDENSED CONSOLIDATED FINANCIAL STATEMENTS—(Continued)
November 30, 2017(Unaudited)
Assets and Liabilities Measured at Fair Value on a Recurring Basis
Our assets and liabilities measured at fair value on a recurring basis, excluding accrued interest components, consisted of the following (Level 1 and Level 2 inputsare defined above): November 30, 2017 May 31, 2017
Fair Value Measurements
Using Input Types Fair Value Measurements
Using Input Types (in millions) Level 1 Level 2 Total Level 1 Level 2 Total Assets:
Corporate debt securities and other $ 887 $ 47,540 $ 48,427 $ 580 $ 41,038 $ 41,618 Commercial paper debt securities — 3,443 3,443 — 5,053 5,053 Money market funds 5,500 — 5,500 3,302 — 3,302 Derivative financial instruments — — — — 40 40
Total assets $ 6,387 $ 50,983 $ 57,370 $ 3,882 $ 46,131 $ 50,013
Liabilities: Derivative financial instruments $ — $ 94 $ 94 $ — $ 191 $ 191
Our marketable securities investments consist of Tier 1 commercial paper debt securities, corporate debt securities and certain other securities. As of November 30,2017 and May 31, 2017, approximately 24% and 32%, respectively, of our marketable securities investments mature within one year and 76% and 68%,respectively, mature within one to six years. Our valuation techniques used to measure the fair values of our marketable securities that were classified as Level 1 inthe table above were derived from quoted market prices and active markets for these instruments that exist. Our valuation techniques used to measure the fairvalues of Level 2 instruments listed in the table above, the counterparties to which have high credit ratings, were derived from the following: non-binding marketconsensus prices that were corroborated by observable market data, quoted market prices for similar instruments, or pricing models, such as discounted cash flowtechniques, with all significant inputs derived from or corroborated by observable market data including LIBOR-based yield curves, among others.
Based on the trading prices of the $60.9 billion and $54.0 billion of senior notes and the related fair value hedges that were outstanding as of November 30, 2017and May 31, 2017, respectively, the estimated fair values of the senior notes and the related fair value hedges using Level 2 inputs at November 30, 2017 andMay 31, 2017 were $63.6 billion and $56.5 billion, respectively. 4. INVENTORIES
Inventories consisted of the following:
(in millions) November 30, 2017
May 31, 2017
Raw materials $ 288 $ 186 Work-in-process 35 42 Finished goods 113 72
Total inventories $ 436 $ 300
12
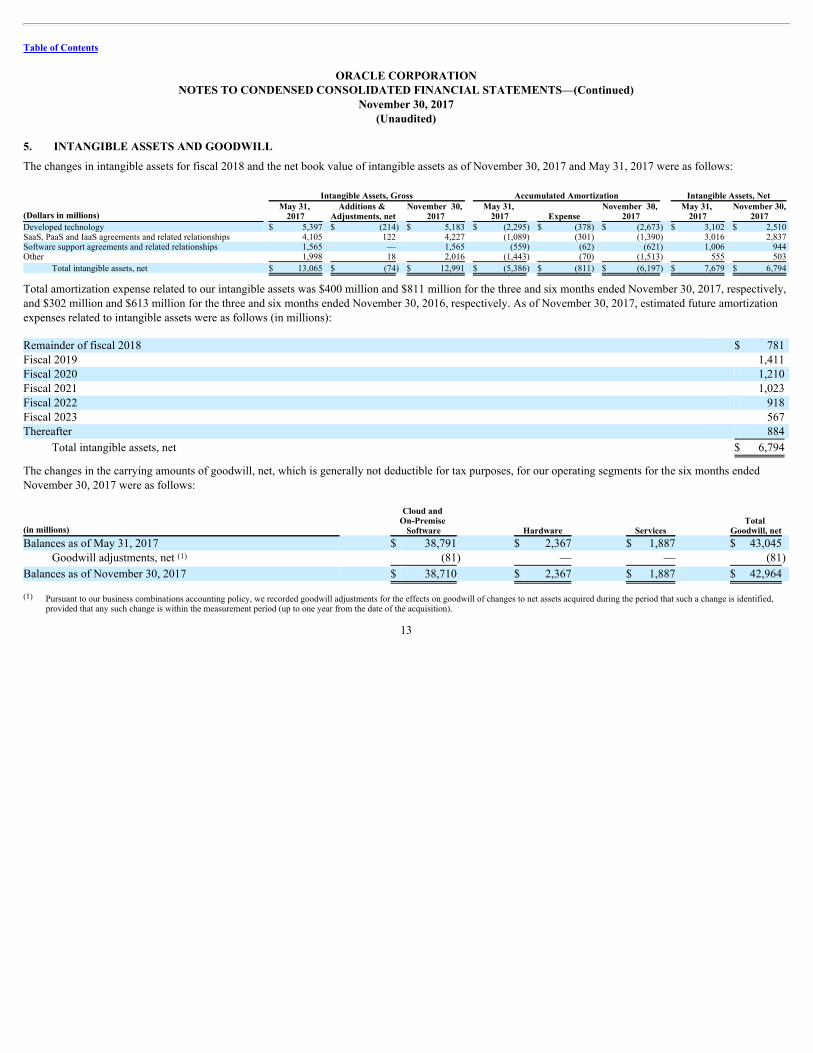
Table of Contents
ORACLE CORPORATIONNOTES TO CONDENSED CONSOLIDATED FINANCIAL STATEMENTS—(Continued)
November 30, 2017(Unaudited)
5. INTANGIBLE ASSETS AND GOODWILL
The changes in intangible assets for fiscal 2018 and the net book value of intangible assets as of November 30, 2017 and May 31, 2017 were as follows: Intangible Assets, Gross Accumulated Amortization Intangible Assets, Net
(Dollars in millions) May 31,
2017 Additions &
Adjustments, net November 30,
2017 May 31,
2017 Expense November 30,
2017 May 31,
2017 November 30,
2017 Developed technology $ 5,397 $ (214) $ 5,183 $ (2,295) $ (378) $ (2,673) $ 3,102 $ 2,510 SaaS, PaaS and IaaS agreements and related relationships 4,105 122 4,227 (1,089) (301) (1,390) 3,016 2,837 Software support agreements and related relationships 1,565 — 1,565 (559) (62) (621) 1,006 944 Other 1,998 18 2,016 (1,443) (70) (1,513) 555 503
Total intangible assets, net $ 13,065 $ (74) $ 12,991 $ (5,386) $ (811) $ (6,197) $ 7,679 $ 6,794
Total amortization expense related to our intangible assets was $400 million and $811 million for the three and six months ended November 30, 2017, respectively,and $302 million and $613 million for the three and six months ended November 30, 2016, respectively. As of November 30, 2017, estimated future amortizationexpenses related to intangible assets were as follows (in millions): Remainder of fiscal 2018 $ 781 Fiscal 2019 1,411 Fiscal 2020 1,210 Fiscal 2021 1,023 Fiscal 2022 918 Fiscal 2023 567 Thereafter 884
Total intangible assets, net $ 6,794
The changes in the carrying amounts of goodwill, net, which is generally not deductible for tax purposes, for our operating segments for the six months endedNovember 30, 2017 were as follows:
(in millions)
Cloud and On-Premise
Software Hardware Services Total
Goodwill, net Balances as of May 31, 2017 $ 38,791 $ 2,367 $ 1,887 $ 43,045
Goodwill adjustments, net (81) — — (81)
Balances as of November 30, 2017 $ 38,710 $ 2,367 $ 1,887 $ 42,964
Pursuant to our business combinations accounting policy, we recorded goodwill adjustments for the effects on goodwill of changes to net assets acquired during the period that such a change is identified,
provided that any such change is within the measurement period (up to one year from the date of the acquisition).
13
(1)
(1)
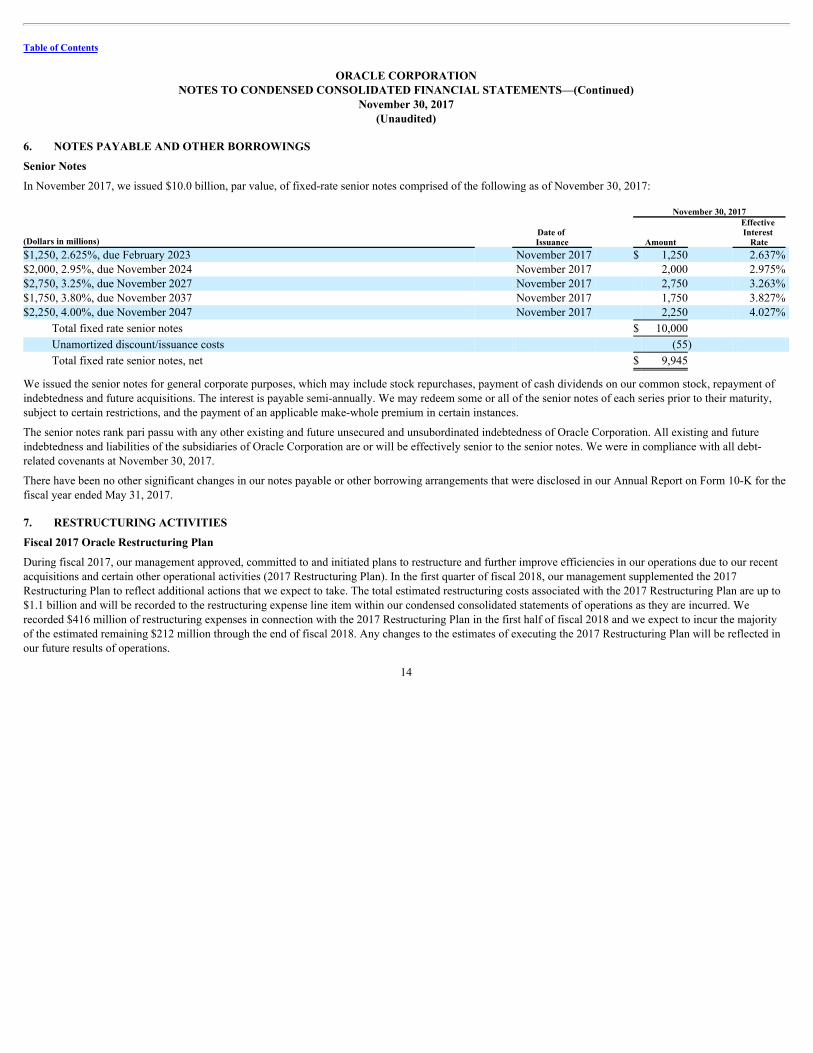
Table of Contents
ORACLE CORPORATIONNOTES TO CONDENSED CONSOLIDATED FINANCIAL STATEMENTS—(Continued)
November 30, 2017(Unaudited)
6. NOTES PAYABLE AND OTHER BORROWINGS
Senior Notes
In November 2017, we issued $10.0 billion, par value, of fixed-rate senior notes comprised of the following as of November 30, 2017: November 30, 2017
(Dollars in millions) Date of Issuance Amount
Effective Interest
Rate $1,250, 2.625%, due February 2023 November 2017 $ 1,250 2.637% $2,000, 2.95%, due November 2024 November 2017 2,000 2.975% $2,750, 3.25%, due November 2027 November 2017 2,750 3.263% $1,750, 3.80%, due November 2037 November 2017 1,750 3.827% $2,250, 4.00%, due November 2047 November 2017 2,250 4.027%
Total fixed rate senior notes $ 10,000
Unamortized discount/issuance costs (55)
Total fixed rate senior notes, net $ 9,945
We issued the senior notes for general corporate purposes, which may include stock repurchases, payment of cash dividends on our common stock, repayment ofindebtedness and future acquisitions. The interest is payable semi-annually. We may redeem some or all of the senior notes of each series prior to their maturity,subject to certain restrictions, and the payment of an applicable make-whole premium in certain instances.
The senior notes rank pari passu with any other existing and future unsecured and unsubordinated indebtedness of Oracle Corporation. All existing and futureindebtedness and liabilities of the subsidiaries of Oracle Corporation are or will be effectively senior to the senior notes. We were in compliance with all debt-related covenants at November 30, 2017.
There have been no other significant changes in our notes payable or other borrowing arrangements that were disclosed in our Annual Report on Form 10-K for thefiscal year ended May 31, 2017. 7. RESTRUCTURING ACTIVITIES
Fiscal 2017 Oracle Restructuring Plan
During fiscal 2017, our management approved, committed to and initiated plans to restructure and further improve efficiencies in our operations due to our recentacquisitions and certain other operational activities (2017 Restructuring Plan). In the first quarter of fiscal 2018, our management supplemented the 2017Restructuring Plan to reflect additional actions that we expect to take. The total estimated restructuring costs associated with the 2017 Restructuring Plan are up to$1.1 billion and will be recorded to the restructuring expense line item within our condensed consolidated statements of operations as they are incurred. Werecorded $416 million of restructuring expenses in connection with the 2017 Restructuring Plan in the first half of fiscal 2018 and we expect to incur the majorityof the estimated remaining $212 million through the end of fiscal 2018. Any changes to the estimates of executing the 2017 Restructuring Plan will be reflected inour future results of operations.
14

Table of Contents
ORACLE CORPORATIONNOTES TO CONDENSED CONSOLIDATED FINANCIAL STATEMENTS—(Continued)
November 30, 2017(Unaudited)
Summary of All Plans
Accrued May 31, 2017
Six Months Ended November 30, 2017 Accrued
November 30, 2017
Total Costs
Accrued to Date
Total Expected Program
Costs (in millions) Initial
Costs Adj. to Cost
Cash Payments Others
Fiscal 2017 Oracle Restructuring Plan Cloud and on-premise software $ 85 $ 92 $ (4) $ (105) $ 4 $ 72 $ 266 $ 300 Hardware 31 118 (4) (46) 1 100 202 241 Services 25 31 (1) (36) 1 20 88 130 Other 44 178 6 (130) (6) 92 346 443
Total Fiscal 2017 Oracle Restructuring Plan $ 185 $ 419 $ (3) $ (317) $ — $ 284 $ 902 $ 1,114
Total other restructuring plans $ 79 $ 1 $ 1 $ (24) $ 4 $ 61
Total restructuring plans $ 264 $ 420 $ (2) $ (341) $ 4 $ 345
Restructuring costs recorded for individual line items primarily related to employee severance costs.
The balances at November 30, 2017 and May 31, 2017 included $318 million and $242 million, respectively, recorded in other current liabilities, and $27 million and $22 million, respectively, recorded inother non-current liabilities.
Costs recorded for the respective restructuring plans during the current period presented.
All plan adjustments were changes in estimates whereby increases and decreases in costs were generally recorded to operating expenses in the period of adjustments.
Represents foreign currency translation and certain other adjustments.
Other restructuring plans presented in the table above included condensed information for other Oracle based plans and other plans associated with certain of our acquisitions whereby we continued to makecash outlays to settle obligations under these plans during the period presented but for which the periodic impact to our condensed consolidated statements of operations was not significant.
8. DEFERRED REVENUES
Deferred revenues consisted of the following:
(in millions) November 30, 2017
May 31, 2017
Software license updates and product support $ 5,791 $ 5,952 Cloud SaaS, PaaS and IaaS 1,273 1,192 Hardware 607 640 Services 351 382 New software licenses 54 67
Deferred revenues, current 8,076 8,233
Deferred revenues, non-current (in other non-current liabilities) 597 602
Total deferred revenues $ 8,673 $ 8,835
Deferred software license updates and product support revenues and deferred hardware revenues substantially represent customer payments made in advance forsupport contracts that are typically billed on a per annum basis in advance with corresponding revenues being recognized ratably over the support periods. Deferredcloud software as a service (SaaS) and deferred cloud platform as a service (PaaS) and infrastructure as a service (IaaS) revenues generally resulted from customerpayments made in advance for our cloud-based offerings that are recognized over the corresponding contractual term. Deferred services revenues includeprepayments for our
15
(2) (2)(3) (4) (5)
(1)
(6)
(1)
(2)
(3)
(4)
(5)
(6)

Table of Contents
ORACLE CORPORATIONNOTES TO CONDENSED CONSOLIDATED FINANCIAL STATEMENTS—(Continued)
November 30, 2017(Unaudited)
services business and revenues for these services are generally recognized as the services are performed. Deferred new software licenses revenues typically resultedfrom customer payments that relate to undelivered products or specified enhancements, customer specific acceptance provisions, time-based license arrangementsand software license transactions that cannot be separated from undelivered consulting or other services.
In connection with our acquisitions, we have estimated the fair values of the cloud SaaS, cloud PaaS and IaaS and software license updates and product supportobligations, among others, assumed from our acquired companies. We generally have estimated the fair values of these obligations assumed using a cost build-upapproach. The cost build-up approach determines fair value by estimating the costs related to fulfilling the obligations plus a normal profit margin. The sum of thecosts and operating profit approximates, in theory, the amount that we would be required to pay a third party to assume these acquired obligations. Theseaforementioned fair value adjustments recorded for obligations assumed from our acquisitions reduced the cloud SaaS, cloud PaaS and IaaS and software licenseupdates and product support deferred revenues balances that we recorded as liabilities from these acquisitions and also reduced the resulting revenues that werecognized or will recognize over the terms of the acquired obligations during the post-combination periods. 9. DERIVATIVE FINANCIAL INSTRUMENTS
We held certain derivative and non-derivative instruments that were accounted for pursuant to ASC 815, DerivativesandHedging(ASC 815) and that were utilizedin a consistent manner as of November 30, 2017 and May 31, 2017 and during the three and six months ended November 30, 2017 and 2016. These instrumentsinclude:
• interest rate swap agreements, which are used to protect us against changes in the fair values of certain of our fixed-rate borrowings due to benchmark
interest rate movements and are accounted for as fair value hedges;
• cross-currency swap agreements, which are used to manage foreign currency exchange risk by converting certain of our fixed-rate Euro-denominated
borrowings to fixed-rate U.S. Dollar denominated debt and are accounted for as cash flow hedges; and
• foreign currency borrowings, which are used to reduce the volatility in stockholders’ equity caused by the changes in the foreign currency exchange rates
of the Euro with respect to the U.S. Dollar and are accounted for as net investment hedges.
We also held certain foreign currency contracts that were not designated as hedges pursuant to ASC 815. As of November 30, 2017 and May 31, 2017, the notionalamounts of such forward contracts we held to purchase U.S. Dollars in exchange for other major international currencies were $4.0 billion and $3.4 billion,respectively, and the notional amount of forward contracts we held to sell U.S. Dollars in exchange for other major international currencies were $1.5 billion and$1.4 billion, respectively. The fair values of our outstanding foreign currency forward contracts were nominal as of November 30, 2017 and May 31, 2017. Thecash flows related to these foreign currency contracts are classified as operating activities. Net gains or losses related to these forward contracts are included innon-operating income, net.
16

Table of Contents
ORACLE CORPORATIONNOTES TO CONDENSED CONSOLIDATED FINANCIAL STATEMENTS—(Continued)
November 30, 2017(Unaudited)
See Note 11 of Notes to Consolidated Financial Statements included in our Annual Report on Form 10-K for the fiscal year ended May 31, 2017 for additionalinformation regarding the purpose, accounting and classification of our derivative and non-derivative instruments. None of our derivative instruments are used fortrading purposes. The effects of derivative and non-derivative instruments designated as hedges on certain of our condensed consolidated financial statements wereas follows as of or for each of the respective periods presented below (amounts presented exclude any income tax effects):
Fair Values of Derivative and Non-Derivative Instruments Designated as Hedges in Condensed Consolidated Balance Sheets Fair Value as of
(in millions) Balance Sheet Location November 30,
2017 May 31,
2017 Interest rate swap agreements designated as fair value hedges Other (non-current liabilities) assets $ (7) $ 40
Cross-currency swap agreements designated as cash flow hedges Other non-current liabilities $ (87) $ (191)
Foreign currency borrowings designated as net investment hedge Notes payable, non-current $ (1,051) $ (980)
Effects of Derivative and Non-Derivative Instruments Designated as Hedges on Income and Other Comprehensive Income (OCI) or Loss (OCL)
Amount of Gain (Loss) Recognized in Accumulated
OCI or OCL (Effective Portion) Location and Amount of Gain (Loss) Reclassified from
Accumulated OCI or OCL into Income (Effective Portion)
Three Months Ended
November 30, Six Months Ended
November 30,
Three Months Ended
November 30, Six Months Ended
November 30, (in millions) 2017 2016 2017 2016 2017 2016 2017 2016 Cross-currency swap agreements designated as cash flow hedges $ 19 $ (54) $ 104 $ (51) Non-operating income (expense), net $ (16) $ (73) $ 91 $ (72)
Foreign currency borrowings designated as net investment hedge $ 10 $ 44 $ (54) $ 43 Not applicable $ — $ — $ — $ —
Location and Amount of Gain
(Loss) Recognized in Income on Derivative Location and Amount of Gain (Loss) on Hedged Item
Recognized in Income Attributable to Risk Being Hedged
Three Months Ended
November 30, Six Months Ended
November 30,
Three Months Ended
November 30, Six Months Ended
November 30, (in millions) 2017 2016 2017 2016 2017 2016 2017 2016 Interest rate swap agreements designated as fair value hedges Interest expense $ (47) $ (77) $ (47) $ (68) Interest expense $ 47 $ 77 $ 47 $ 68
10. STOCKHOLDERS’ EQUITY
Common Stock Repurchases
Our Board of Directors has approved a program for us to repurchase shares of our common stock. On December 14, 2017, we announced that our Board ofDirectors approved an expansion of our stock repurchase program by an additional $12.0 billion. As of November 30, 2017, approximately $2.8 billion remainedavailable for stock repurchases pursuant to our stock repurchase program. We repurchased 50.9 million shares for $2.5 billion during the six months endedNovember 30, 2017 (including 1.5 million shares for $73 million that were repurchased but not settled) and 62.0 million shares for $2.5 billion during the sixmonths ended November 30, 2016 under the stock repurchase program.
17
Table of Contents
ORACLE CORPORATIONNOTES TO CONDENSED CONSOLIDATED FINANCIAL STATEMENTS—(Continued)
November 30, 2017(Unaudited)
Our stock repurchase authorization does not have an expiration date and the pace of our repurchase activity will depend on factors such as our working capitalneeds, our cash requirements for acquisitions and dividend payments, our debt repayment obligations or repurchases of our debt, our stock price, and economic andmarket conditions. Our stock repurchases may be effected from time to time through open market purchases or pursuant to a Rule 10b5-1 plan. Our stockrepurchase program may be accelerated, suspended, delayed or discontinued at any time.
Dividends on Common Stock
During the six months ended November 30, 2017, our Board of Directors declared cash dividends of $0.38 per share of our outstanding common stock, which wepaid during the same period.
In December 2017, our Board of Directors declared a quarterly cash dividend of $0.19 per share of our outstanding common stock. The dividend is payable onJanuary 24, 2018 to stockholders of record as of the close of business on January 10, 2018. Future declarations of dividends and the establishment of future recordand payment dates are subject to the final determination of our Board of Directors.
Fiscal 2018 Stock-Based Awards Activity, Valuation and Compensation Expense
During the first half of fiscal 2018, we issued 38 million restricted stock-based awards and 77 million stock options (consisting of 8 million service-based stockoptions (SOs) and 69 million performance-based and market-based stock options (PSOs)). Substantially all of the awards were issued as a part of our annual stock-based award process and are subject to service-based vesting restrictions, with the PSOs primarily having performance-based and market-based vesting restrictions.Our fiscal 2018 stock-based awards issuances were partially offset by forfeitures and cancellations of 13 million shares during the first half of fiscal 2018.
The RSUs and SOs that were granted during the six months ended November 30, 2017 have vesting restrictions, valuations and contractual lives of a similar natureto those described in Note 14 of Notes to Consolidated Financial Statements included in our Annual Report on Form 10-K for the fiscal year ended May 31, 2017.
The fiscal 2018 PSOs granted consist of seven numerically equivalent vesting tranches that potentially may vest. Each of six of the individual vesting tranches aregoverned by an “all or nothing” vesting schedule requiring the attainment of both a performance metric and a market capitalization metric, which may be achievedat any time, in order for each individual tranche to fully vest during a five year performance period, assuming continued employment and service through the datethe Compensation Committee of the Board of Directors certifies that the last of the two metrics for a particular tranche is attained. The seventh vesting trancherequires attainment of a market-based metric to be achieved at any time during a five year performance period and continued employment and service through thevesting date. The PSOs have contractual lives of eight years in comparison to the ten year contractual lives for the fiscal 2018 SOs issued. We estimated the fairvalues of the PSOs using a Monte Carlo simulation approach with the following assumptions: risk-free interest rate of 2.14%, expected term of 7 years, expectedvolatility of 22.44% and dividend yield of 1.49%. Stock-based compensation expense is to be recognized for each of the six performance-based and market-basedtranches once each vesting tranche becomes probable of achievement over the longer of the estimated implicit service period for performance-metric achievementor derived service period for market-based metric achievement. We have preliminarily estimated service periods for those tranches that have been deemed probableof achievement to be approximately three to five years. Stock-based compensation for the market-based tranche will be recognized using the derived service periodfor the market-based metric achievement, which we have initially estimated to be approximately three years.
18
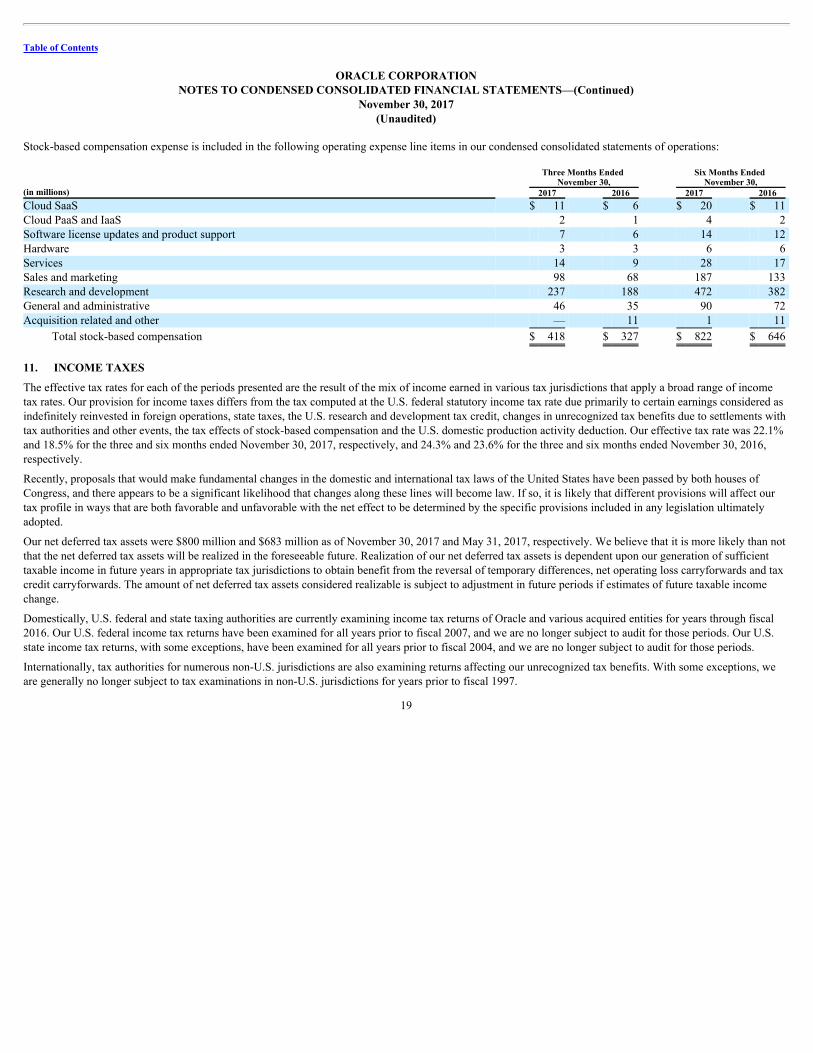
Table of Contents
ORACLE CORPORATIONNOTES TO CONDENSED CONSOLIDATED FINANCIAL STATEMENTS—(Continued)
November 30, 2017(Unaudited)
Stock-based compensation expense is included in the following operating expense line items in our condensed consolidated statements of operations:
Three Months Ended
November 30, Six Months Ended
November 30, (in millions) 2017 2016 2017 2016 Cloud SaaS $ 11 $ 6 $ 20 $ 11 Cloud PaaS and IaaS 2 1 4 2 Software license updates and product support 7 6 14 12 Hardware 3 3 6 6 Services 14 9 28 17 Sales and marketing 98 68 187 133 Research and development 237 188 472 382 General and administrative 46 35 90 72 Acquisition related and other — 11 1 11
Total stock-based compensation $ 418 $ 327 $ 822 $ 646
11. INCOME TAXES
The effective tax rates for each of the periods presented are the result of the mix of income earned in various tax jurisdictions that apply a broad range of incometax rates. Our provision for income taxes differs from the tax computed at the U.S. federal statutory income tax rate due primarily to certain earnings considered asindefinitely reinvested in foreign operations, state taxes, the U.S. research and development tax credit, changes in unrecognized tax benefits due to settlements withtax authorities and other events, the tax effects of stock-based compensation and the U.S. domestic production activity deduction. Our effective tax rate was 22.1%and 18.5% for the three and six months ended November 30, 2017, respectively, and 24.3% and 23.6% for the three and six months ended November 30, 2016,respectively.
Recently, proposals that would make fundamental changes in the domestic and international tax laws of the United States have been passed by both houses ofCongress, and there appears to be a significant likelihood that changes along these lines will become law. If so, it is likely that different provisions will affect ourtax profile in ways that are both favorable and unfavorable with the net effect to be determined by the specific provisions included in any legislation ultimatelyadopted.
Our net deferred tax assets were $800 million and $683 million as of November 30, 2017 and May 31, 2017, respectively. We believe that it is more likely than notthat the net deferred tax assets will be realized in the foreseeable future. Realization of our net deferred tax assets is dependent upon our generation of sufficienttaxable income in future years in appropriate tax jurisdictions to obtain benefit from the reversal of temporary differences, net operating loss carryforwards and taxcredit carryforwards. The amount of net deferred tax assets considered realizable is subject to adjustment in future periods if estimates of future taxable incomechange.
Domestically, U.S. federal and state taxing authorities are currently examining income tax returns of Oracle and various acquired entities for years through fiscal2016. Our U.S. federal income tax returns have been examined for all years prior to fiscal 2007, and we are no longer subject to audit for those periods. Our U.S.state income tax returns, with some exceptions, have been examined for all years prior to fiscal 2004, and we are no longer subject to audit for those periods.
Internationally, tax authorities for numerous non-U.S. jurisdictions are also examining returns affecting our unrecognized tax benefits. With some exceptions, weare generally no longer subject to tax examinations in non-U.S. jurisdictions for years prior to fiscal 1997.
19

Table of Contents
ORACLE CORPORATIONNOTES TO CONDENSED CONSOLIDATED FINANCIAL STATEMENTS—(Continued)
November 30, 2017(Unaudited)
On July 27, 2015, in AlteraCorp.v.Commissioner, the U.S. Tax Court issued an opinion related to the treatment of stock-based compensation expense in anintercompany cost-sharing arrangement. A final decision has yet to be issued by the Tax Court due to other outstanding issues related to the case. At this time, theU.S. Department of the Treasury has not withdrawn the requirement to include stock-based compensation from its regulations. We have reviewed this case and itsimpact on Oracle and concluded that no adjustment to the consolidated financial statements is appropriate at this time. We will continue to monitor ongoingdevelopments and potential impacts to our consolidated financial statements.
We are under audit by the IRS and various other domestic and foreign tax authorities with regards to income tax and indirect tax matters and are involved invarious challenges and litigation in a number of countries, including, in particular, Australia, Brazil, India, Korea, Spain and the United Kingdom, where theamounts under controversy are significant. In some, although not all, cases, we have reserved for potential adjustments to our provision for income taxes andaccrual of indirect taxes that may result from examinations by, or any negotiated agreements with, these tax authorities or final outcomes in judicial proceedings,and we believe that the final outcome of these examinations, agreements or judicial proceedings will not have a material effect on our results of operations. Ifevents occur which indicate payment of these amounts is unnecessary, the reversal of the liabilities would result in the recognition of benefits in the period wedetermine the liabilities are no longer necessary. If our estimates of the federal, state, and foreign income tax liabilities and indirect tax liabilities are less than theultimate assessment, it could result in a further charge to expense.
We believe that we have adequately provided under GAAP for outcomes related to our tax audits. However, there can be no assurances as to the possible outcomesor any related financial statement effect thereof. 12. SEGMENT INFORMATION
ASC 280, SegmentReporting, establishes standards for reporting information about operating segments. Operating segments are defined as components of anenterprise about which separate financial information is available that is evaluated regularly by the chief operating decision maker, or decision making group, indeciding how to allocate resources and in assessing performance. Our chief operating decision makers (CODMs) are our Chief Executive Officers and ChiefTechnology Officer. We are organized by line of business and geographically. While our CODMs evaluate results in a number of different ways, the line ofbusiness management structure is the primary basis for which the allocation of resources and financial results are assessed. In recent periods, customer demand hasincreased at a greater rate for cloud-based IT deployment models relative to on-premise IT deployment models. Our CODMs view the operating results of our threebusinesses and allocate resources in a manner that is consistent with the changing market dynamics that we have experienced. As a result, in the fourth quarter offiscal 2017, we updated our operating segments. The footnote information below presents the financial information provided to our CODMs for their review andassists our CODMs with evaluating the Company’s performance and allocating Company resources.
We have three businesses—cloud and on-premise software, hardware and services—each of which is comprised of a single operating segment.
Our cloud and on-premise software line of business markets, sells and delivers a broad spectrum of applications, platform and infrastructure technologies throughour cloud offerings and on-premise software offerings. Our Oracle Cloud SaaS and Cloud PaaS and IaaS offerings deliver certain of our applications, platform andinfrastructure technologies on a subscription basis via cloud-based deployment models that we host, manage and support. Our IaaS offerings also include OracleManaged Cloud Services, which are designed to provide comprehensive software and hardware management, maintenance and security services for on-premise,cloud-based or hybrid IT infrastructures. Our cloud and on-premise software business also licenses our software products, generally on a perpetual basis, includingOracle Applications, Oracle Database, Oracle Fusion
20

Table of Contents
ORACLE CORPORATIONNOTES TO CONDENSED CONSOLIDATED FINANCIAL STATEMENTS—(Continued)
November 30, 2017(Unaudited)
Middleware and Java, among others, for on-premise and other IT environments. Customers that license our software have the option to purchase software licenseupdates and product support contracts, which provide customers with rights to unspecified software product upgrades and maintenance releases, patch releases,internet access to technical content, as well as internet and telephone access to technical support personnel during the support period.
Our hardware business provides Oracle Engineered Systems, servers, storage, industry-specific hardware, virtualization software, operating systems including theOracle Solaris Operating System and management software to support diverse IT environments. Our hardware business also includes hardware support, whichprovides customers with software updates for the software components that are essential to the functionality of the hardware products, such as Oracle Solaris andcertain other software, and can include product repairs, maintenance services and technical support services.
Our services business provides services to customers and partners to help maximize the performance of their investments in Oracle applications, platform andinfrastructure technologies.
We do not track our assets for each business. Consequently, it is not practical to show assets by operating segment.
The following table presents summary results for each of our three businesses (fiscal 2017 results have been recast to conform to the current year’s presentation):
Three Months Ended
November 30, Six Months Ended
November 30, (in millions) 2017 2016 2017 2016 Cloud and on-premise software:
Revenues $ 7,834 $ 7,212 $ 15,243 $ 14,021 Cloud SaaS, PaaS and IaaS expenses 615 457 1,195 859 Software license updates and product support expenses 240 225 480 481 Sales and marketing expenses 1,776 1,633 3,460 3,229
Margin $ 5,203 $ 4,897 $ 10,108 $ 9,452
Hardware: Revenues $ 940 $ 1,014 $ 1,884 $ 2,010 Hardware products and support expenses 344 378 709 759 Sales and marketing expenses 154 202 325 404
Margin $ 442 $ 434 $ 850 $ 847
Services: Revenues $ 856 $ 844 $ 1,716 $ 1,652 Services expenses 683 667 1,348 1,333
Margin $ 173 $ 177 $ 368 $ 319
Totals: Revenues $ 9,630 $ 9,070 $ 18,843 $ 17,683 Expenses 3,812 3,562 7,517 7,065
Margin $ 5,818 $ 5,508 $ 11,326 $ 10,618
Cloud and on-premise software revenues for management reporting included revenues related to cloud and on-premise software obligations that would have otherwise been recorded by the acquired
businesses as independent entities but were not recognized in our consolidated statements of operations for the periods presented due to business combination accounting requirements. See Note 8 for anexplanation of these adjustments and the table below for a reconciliation of our total operating segment revenues to our total consolidated revenues as reported in our consolidated statements of operations.
The margins reported reflect only the direct controllable costs of each line of business and do not include allocations of product development, general and administrative and certain other allocable expenses,net. Additionally, the margins reported above do not
21
(1)
(2)
(2)
(2)
(1)
(2)
(1)
(2)
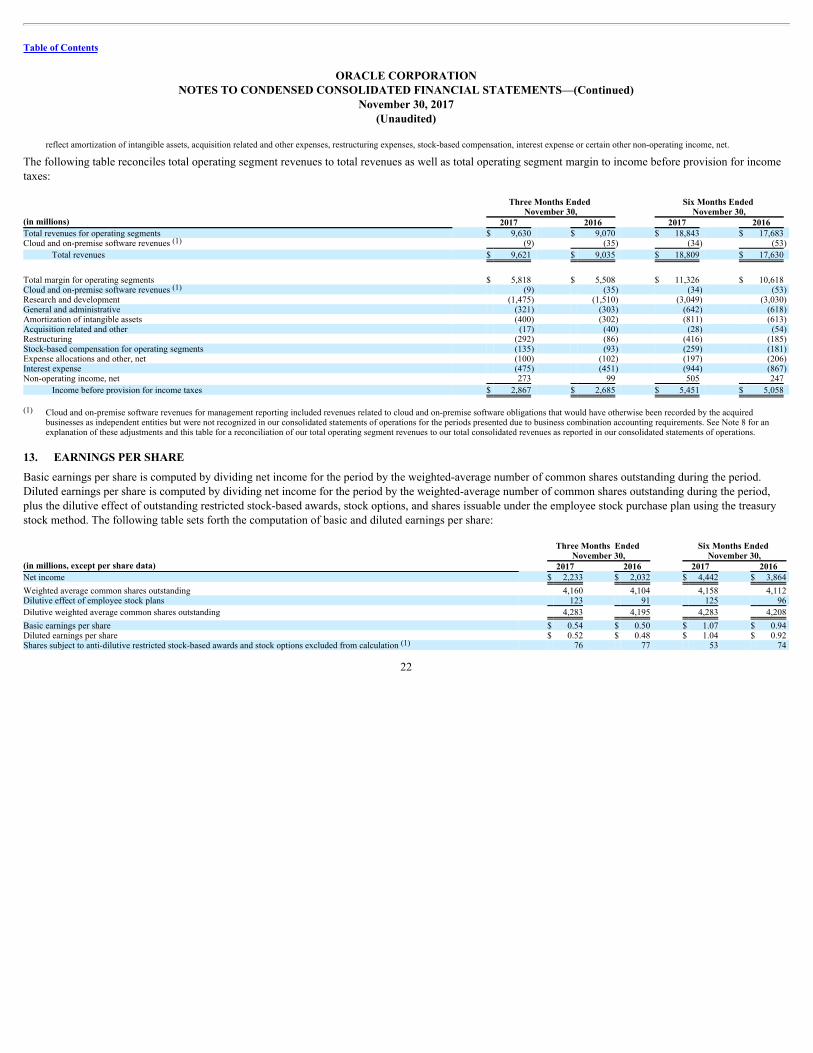
Table of Contents
ORACLE CORPORATIONNOTES TO CONDENSED CONSOLIDATED FINANCIAL STATEMENTS—(Continued)
November 30, 2017(Unaudited)
reflect amortization of intangible assets, acquisition related and other expenses, restructuring expenses, stock-based compensation, interest expense or certain other non-operating income, net.
The following table reconciles total operating segment revenues to total revenues as well as total operating segment margin to income before provision for incometaxes:
Three Months Ended
November 30, Six Months Ended
November 30, (in millions) 2017 2016 2017 2016 Total revenues for operating segments $ 9,630 $ 9,070 $ 18,843 $ 17,683 Cloud and on-premise software revenues (9) (35) (34) (53)
Total revenues $ 9,621 $ 9,035 $ 18,809 $ 17,630
Total margin for operating segments $ 5,818 $ 5,508 $ 11,326 $ 10,618 Cloud and on-premise software revenues (9) (35) (34) (53) Research and development (1,475) (1,510) (3,049) (3,030) General and administrative (321) (303) (642) (618) Amortization of intangible assets (400) (302) (811) (613) Acquisition related and other (17) (40) (28) (54) Restructuring (292) (86) (416) (185) Stock-based compensation for operating segments (135) (93) (259) (181) Expense allocations and other, net (100) (102) (197) (206) Interest expense (475) (451) (944) (867) Non-operating income, net 273 99 505 247
Income before provision for income taxes $ 2,867 $ 2,685 $ 5,451 $ 5,058
Cloud and on-premise software revenues for management reporting included revenues related to cloud and on-premise software obligations that would have otherwise been recorded by the acquired
businesses as independent entities but were not recognized in our consolidated statements of operations for the periods presented due to business combination accounting requirements. See Note 8 for anexplanation of these adjustments and this table for a reconciliation of our total operating segment revenues to our total consolidated revenues as reported in our consolidated statements of operations.
13. EARNINGS PER SHARE
Basic earnings per share is computed by dividing net income for the period by the weighted-average number of common shares outstanding during the period.Diluted earnings per share is computed by dividing net income for the period by the weighted-average number of common shares outstanding during the period,plus the dilutive effect of outstanding restricted stock-based awards, stock options, and shares issuable under the employee stock purchase plan using the treasurystock method. The following table sets forth the computation of basic and diluted earnings per share:
Three Months Ended
November 30, Six Months Ended
November 30, (in millions, except per share data) 2017 2016 2017 2016 Net income $ 2,233 $ 2,032 $ 4,442 $ 3,864
Weighted average common shares outstanding 4,160 4,104 4,158 4,112 Dilutive effect of employee stock plans 123 91 125 96
Dilutive weighted average common shares outstanding 4,283 4,195 4,283 4,208
Basic earnings per share $ 0.54 $ 0.50 $ 1.07 $ 0.94 Diluted earnings per share $ 0.52 $ 0.48 $ 1.04 $ 0.92 Shares subject to anti-dilutive restricted stock-based awards and stock options excluded from calculation 76 77 53 74
22
(1)
(1)
(1)
(1)

Table of Contents
ORACLE CORPORATIONNOTES TO CONDENSED CONSOLIDATED FINANCIAL STATEMENTS—(Continued)
November 30, 2017(Unaudited)
These weighted shares relate to anti-dilutive restricted service based stock-based awards and stock options (as calculated using the treasury stock method) and contingently issuable shares under PSO andPSU arrangements. Such shares could be dilutive in the future.
14. LEGAL PROCEEDINGS
Hewlett-Packard Company Litigation
On June 15, 2011, Hewlett-Packard Company, now Hewlett Packard Enterprise Company (HP), filed a complaint in the California Superior Court, County of SantaClara against Oracle Corporation alleging numerous causes of action including breach of contract, breach of the covenant of good faith and fair dealing,defamation, intentional interference with prospective economic advantage, and violation of the California Unfair Business Practices Act. The complaint alleged thatwhen Oracle announced on March 22 and 23, 2011 that it would no longer develop future versions of its software to run on HP’s Itanium-based servers, it breacheda settlement agreement signed on September 20, 2010 between HP and Mark Hurd (the Hurd Settlement Agreement), who is our Chief Executive Officer and wasboth HP’s former chief executive officer and chairman of HP’s board of directors. HP sought a judicial declaration of the parties’ rights and obligations under theHurd Settlement Agreement and other equitable and monetary relief.
Oracle answered the complaint and filed a cross-complaint, which was amended on December 2, 2011. The amended cross-complaint alleged claims includingviolation of the Lanham Act. Oracle alleged that HP had secretly agreed to pay Intel to continue to develop and manufacture the Itanium microprocessor, and hadmisrepresented to customers that the Itanium microprocessor had a long roadmap, among other claims. Oracle sought equitable rescission of the Hurd SettlementAgreement, and other equitable and monetary relief.
The court bifurcated the trial and tried HP’s causes of action for declaratory relief and promissory estoppel without a jury in June 2012. The court issued a finalstatement of decision on August 28, 2012, finding that the Hurd Settlement Agreement required Oracle to continue to develop certain of its software products foruse on HP’s Itanium-based servers and to port such products at no cost to HP for as long as HP sells those servers (the Phase One Ruling). A jury trial began onMay 23, 2016. On June 30, 2016, the jury returned a verdict in favor of HP on its claims for breach of contract and breach of the implied covenant of good faith andfair dealing and against Oracle on its claim for violation of the Lanham Act (the Phase Two Jury Verdict). The jury awarded HP damages in the amount of$3.0 billion, and HP is entitled to post-judgment interest on this award. On August 30, 2016, the court denied HP’s motion for pre-judgment interest. Judgment wasentered on October 20, 2016. Oracle posted certain court-mandated surety bonds with the court in order to proceed with its motion for a new trial and entered intorelated indemnification agreements with each of the surety bond issuing companies. Oracle filed a motion for a new trial on November 14, 2016, which was denied.
Oracle filed its notice of appeal on January 17, 2017, specifying that it was appealing the trial court’s Phase One Ruling and Phase Two Jury Verdict. OnFebruary 2, 2017, HP filed a notice of appeal of the trial court’s denial of pre-judgment interest. No amounts have been paid or recorded to our results of operationseither prior to or subsequent to the Phase One Ruling or Phase Two Jury Verdict. We continue to believe that we have meritorious defenses against HP’s claims,and we intend to present these defenses to the appellate court. Among the arguments we expect to make on appeal are the following: the trial court misappliedfundamental principles of contract law and misinterpreted the Hurd Settlement Agreement, including by disregarding the context of the Hurd Settlement Agreementand the evidence of the parties’ mutual intentions; that HP’s breach of contract claim should fail as a matter of law because HP does not claim and did not provethat Oracle failed to deliver any software under the trial court’s interpretation of the contract; that awarding HP both damages for breach of the Hurd SettlementAgreement and specific performance of that agreement constitutes an improper double recovery; and that the damages award is excessive, unsupported by theevidence, and contrary to law. We cannot currently estimate a reasonably possible range of loss for this action due to the complexities and uncertainty
23
(1)

Table of Contents
ORACLE CORPORATIONNOTES TO CONDENSED CONSOLIDATED FINANCIAL STATEMENTS—(Continued)
November 30, 2017(Unaudited)
surrounding the appeal process and the nature of the claims. Litigation is inherently unpredictable, and the outcome of the appeal process related to this action isuncertain. It is possible that the resolution of this action could have a material impact to our future cash flows and results of operations.
Derivative Litigation
On May 3, 2017, a stockholder derivative lawsuit was filed in the Court of Chancery of the State of Delaware. The derivative suit is brought by an allegedstockholder of Oracle, purportedly on Oracle’s behalf, against Oracle, our Chairman of the Board of Directors and Chief Technology Officer in his capacities as adirector, officer and an alleged controlling stockholder, one of our Chief Executive Officers (who is also a director), three other directors, and Oracle as a nominaldefendant. Plaintiff alleges that the defendants breached their fiduciary duties by causing Oracle to agree to purchase NetSuite Inc. (NetSuite) at an excessive price.Plaintiff seeks declaratory relief, an order rescinding or reforming the NetSuite transaction, unspecified monetary damages (including interest), attorneys’ fees andcosts, and disgorgement of various unspecified profits, fees, compensation, and benefits. On July 19, 2017, defendants moved to dismiss this complaint.
On July 18, 2017, a second stockholder derivative lawsuit was filed in the Court of Chancery of the State of Delaware, brought by another alleged stockholder ofOracle, purportedly on Oracle’s behalf. The suit is brought against all current members and one former member of our Board of Directors, and Oracle as a nominaldefendant. Plaintiff alleges that the defendants breached their fiduciary duties by causing Oracle to agree to purchase NetSuite at an excessive price. Plaintiff seeksdeclaratory relief, unspecified monetary damages (including interest), and attorneys’ fees and costs.
On August 9, 2017, the court consolidated the two derivative cases, and vacated the scheduling order relating to defendants’ motion to dismiss the first case. In aSeptember 7, 2017, order, the court appointed plaintiff’s counsel in the second case as lead plaintiffs’ counsel and designated the July 18, 2017 complaint as theoperative complaint. The parties agreed to a briefing schedule, which the court approved. Consistent with this schedule, the defendants filed a motion to dismiss onOctober 27, 2017, and the Plaintiffs filed an opposition on December 15, 2017. The defendants reply to the plaintiffs’ opposition is due by January 9, 2018 and oralargument is scheduled for January 25, 2018.
While Oracle continues to evaluate these claims, we do not believe this litigation will have a material impact on our financial position or results of operations.
Other Litigation
We are party to various other legal proceedings and claims, either asserted or unasserted, which arise in the ordinary course of business, including proceedings andclaims that relate to acquisitions we have completed or to companies we have acquired or are attempting to acquire. While the outcome of these matters cannot bepredicted with certainty, we do not believe that the outcome of any of these matters, individually or in the aggregate, will result in losses that are materially inexcess of amounts already recognized, if any.
24

Table of Contents
Item 2. Management’s Discussion and Analysis of Financial Condition and Results of Operations
We begin Management’s Discussion and Analysis of Financial Condition and Results of Operations with an overview of our businesses and significant trends. Thisoverview is followed by a summary of our critical accounting policies and estimates that we believe are important to understanding the assumptions and judgmentsincorporated in our reported financial results. We then provide a more detailed analysis of our results of operations and financial condition.
Business Overview
Oracle Corporation provides products and services that address all aspects of corporate information technology (IT) environments—applications, platform andinfrastructure. Our products are delivered to over 400,000 worldwide customers through a variety of flexible and interoperable IT deployment models includingon-premise, cloud-based or hybrid that enable customer choice and that best meet customer IT needs.
Our Oracle Cloud offerings provide a comprehensive and fully integrated stack of applications, platform, compute, storage and networking services in all threeprimary layers of the cloud: Software as a Service (SaaS), Platform as a Service (PaaS) and Infrastructure as a Service (IaaS). Our on-premise IT offerings includeOracle Applications, Oracle Database and Oracle Fusion Middleware software, among others; hardware products including Oracle Engineered Systems, servers,storage and industry-specific products, among others; and related support and services. We provide our cloud and on-premise offerings to businesses of many sizes,government agencies, educational institutions and resellers with a sales force positioned to offer the combinations that best suit customer needs.
Our comprehensive and fully integrated stack of Oracle Cloud SaaS, PaaS and IaaS offerings integrate the software, hardware and services on the customers’ behalfin IT environments that we deploy, support and manage for the customer. Our integrated Oracle Cloud offerings are designed to be rapidly deployable to enablecustomers shorter time to innovation; easily maintainable to reduce integration and testing work; connectable among differing deployment models to enableinterchangeability and extendibility between cloud and on-premise IT environments; compatible to easily move workloads between on-premise IT environmentsand the Oracle Cloud; cost-effective by requiring lower upfront customer investment; and to be secure, standards-based and reliable. We are a leader in the coretechnologies of cloud IT environments, including database and middleware software as well as enterprise applications, virtualization, clustering, large-scalesystems management and related infrastructure. Our products and services are the building blocks of our Oracle Cloud services, our partners’ cloud services andour customers’ cloud IT environments.
In addition to providing a broad spectrum of cloud offerings, we develop and sell our applications, platform and infrastructure products and services to ourcustomers worldwide for use in their global data centers and on-premise IT environments. An important element of our corporate strategy is to continue ourinvestments in, and innovation with respect to, our products and services that we offer through our cloud and on-premise software, hardware and servicesbusinesses. We have a deep understanding as to how applications, platform and infrastructure technologies interact and function with one another within ITenvironments. We focus our development efforts on improving the performance, security, operation and integration of these differing technologies to make themmore cost-effective and easier to deploy, manage and maintain for our customers and to improve their computing performance relative to our competitors. After theinitial purchase of Oracle products and services, our customers can continue to benefit from our research and development efforts and deep IT expertise by electingto purchase and renew Oracle support offerings for their on-premise deployments, which may include unspecified product enhancements that we periodicallydeliver to our products, and by renewing their cloud SaaS, PaaS and IaaS contracts with us.
As customers deploy with the Oracle Cloud, many are adopting a hybrid IT model whereby certain of their IT instances are deployed using the Oracle Cloud, whileother of their IT instances are deployed using Oracle on-premise offerings, with both instances designed with capabilities to be managed as though they are a singleinstance. Our Oracle Cloud at Customer program provides another deployment option for customers to utilize the Oracle Cloud Machine and Oracle DatabaseExadata Cloud Machine to bring certain Oracle Cloud SaaS, PaaS and IaaS offerings to a customer’s on-premise IT environment to meet data sovereignty, dataresidency, data
25

Table of Contents
protection and regulatory business policy requirements, among others, while benefiting from the many advantages of a cloud service.
A selective and active acquisition program is another important element of our corporate strategy. We believe that our acquisitions enhance the products andservices that we can offer to customers, expand our customer base, provide greater scale to accelerate innovation, grow our revenues and earnings, and increasestockholder value. In recent years, we have invested billions of dollars to acquire a number of companies, products, services and technologies that add to, arecomplementary to, or have otherwise enhanced our existing offerings. We expect to continue to acquire companies, products, services and technologies to furtherour corporate strategy.
In recent periods, customer demand has increased at a greater rate for cloud-based IT deployment models relative to on-premise IT deployment models. To addressthis demand, we have increased our investments in and focus on the development, marketing and sale of our cloud-based applications, platform and infrastructuretechnologies resulting in higher growth of our cloud SaaS and cloud PaaS and IaaS revenues as customer preferences have pivoted to the Oracle Cloud for newdeployments and as customers migrate to and expand with the Oracle Cloud for their existing on-premise workloads. We expect these trends to continue. Webelieve that offering customers broad, comprehensive, flexible and interoperable deployment models for our applications, platform and infrastructure technologiesis important to our growth strategy and better address customer needs relative to our competitors, many of whom provide fewer offerings and more restrictivedeployment models. We enable our customers to evolve and transform to substantially any IT deployment model at whatever pace is most appropriate for them.
We have three businesses: cloud and on-premise software; hardware; and services; each of which comprises a single operating segment. Our chief operatingdecision makers (CODMs), which include our Chief Executive Officers and Chief Technology Officer, view the operating results of our three businesses andallocate resources in a manner that is consistent with the changing market dynamics that we have experienced in recent periods. As a result, during the fourthquarter of fiscal 2017, we updated our operating segments. The discussion and analysis of financial condition and results of operations presented below providesthe current view that is utilized by our CODMs to evaluate performance and determine resource allocations and the prior periods’ results presented below wererecast to conform to the current periods’ presentation. In addition to the discussion below, Note 12 of Notes to Condensed Consolidated Financial Statements,included elsewhere in this Quarterly Report, provides additional information related to our businesses and operating segments, including the recasting of oursegments’ financial information from prior periods to conform to the current year’s presentation.
CloudandOn-PremiseSoftwareBusiness
Our cloud and on-premise software line of business, which represented 80% of our total revenues on a trailing 4-quarter basis, markets, sells and delivers a broadspectrum of applications, platform and infrastructure technologies through our cloud and on-premise software offerings.
Our Oracle Cloud SaaS, PaaS and IaaS offerings deliver applications, platform and infrastructure technologies via cloud-based deployment models that we host,manage and support and that customers access by entering into a subscription agreement with us for a stated period. Our IaaS offerings also include OracleManaged Cloud Services, which are designed to provide comprehensive software and hardware management, maintenance and security services for on-premise,cloud-based, or hybrid IT infrastructure for a stated period. The majority of our SaaS, PaaS and IaaS arrangements have an average duration of approximately threeyears and we strive to renew these contracts when they are eligible for renewal.
We offer customers the ability to license our software products including Oracle Applications, Oracle Database, Oracle Fusion Middleware and Java, among others,for on-premise and other IT environments. Our new software license transactions are generally perpetual in nature and are generally recognized when unrestrictedaccess to the software license is granted provided all other revenue recognition criteria are met. The timing of a few large software license transactions cansubstantially affect our quarterly new software licenses revenues, which is different than the typical revenue recognition pattern for our cloud-based offerings inwhich revenues are generally recognized ratably over the subscription period. New software license customers have the option to purchase software license updatesand product support contracts, which grant rights to unspecified product
26

Table of Contents
upgrades and maintenance releases and patches released during the term of the support period, as well as technical support assistance. Our software license updatesand product support contracts are generally one year in duration and are generally billed in advance of the service being performed and are generally recognized asrevenues as the software support services are delivered.
Our cloud SaaS, cloud PaaS and IaaS revenues and new software licenses revenues are affected by the strength of general economic and business conditions,governmental budgetary constraints, the strategy for and competitive position of our offerings, our acquisitions, our ability to deliver and renew our cloud contractswith our existing customers and foreign currency rate fluctuations. In recent periods, we have placed significant strategic emphasis on growing our cloud SaaS andcloud PaaS and IaaS revenues, which represented 16% of our total consolidated revenues during each of the second quarter and first half of fiscal 2018, and 12%and 11% of our total consolidated revenues during the second quarter and first half of fiscal 2017, respectively. This emphasis has affected the growth of our newsoftware licenses revenues and, to a lesser extent, has also affected the growth of our software license updates and product support revenues. We expect thesetrends will continue with the mix of this business’ revenues continuing to shift toward cloud-based services.
Our software license updates and product support revenues growth is primarily influenced by four factors: (1) the percentage of our software support contractcustomer base that renews its software support contracts and the percentage of customers that purchase software support contracts in connection with their purchaseof a new software license; (2) the pricing of new software support contracts sold in connection with the sale of new software licenses; (3) the pricing of newsoftware licenses sold; and (4) the amount of software support contracts assumed from companies we have acquired. Substantially all of our customers purchasesoftware license updates and product support contracts when they acquire on-premise new software licenses and renew their software license updates and productsupport contracts when eligible in order to benefit from Oracle’s research and development investments that are utilized as a part of unspecified periodic softwareupdates that may be released and that customers with current software support contracts are entitled to.
On a constant currency basis, we expect that our total cloud and on-premise software revenues generally will continue to increase due to:
• expected growth in our cloud SaaS offerings and our cloud PaaS and IaaS offerings;
• continued demand for our on-premise software products and related software support, including the high percentage of customers that purchase and renew
their software license updates and product support contracts; and
• contributions from our acquisitions.
We believe all of these factors should contribute to future growth in our cloud and on-premise software revenues, which should enable us to continue to makeinvestments in research and development to develop and improve our cloud and on-premise software products and services.
Our cloud and on-premise software business’ margin has historically trended upward over the course of the four quarters within a particular fiscal year due to thehistorical upward trend of our new software licenses revenues over those quarterly periods and because the majority of our costs for this business are generallyfixed in the short term.
HardwareBusiness
Our hardware business, which represented 11% of our total revenues on a trailing 4-quarter basis, provides a broad selection of hardware products and hardware-related software products including Oracle Engineered Systems, servers, storage, industry-specific hardware, virtualization software, operating systems, andmanagement software that are generally recognized as revenues upon delivery to the customer provided all other revenue recognition criteria are met, and alsoinclude related hardware support. We expect to make investments in research and development to improve existing hardware products and services and to developnew hardware products and services. The majority of our hardware products are sold through indirect channels, including independent distributors and value-addedresellers. Our hardware support offerings provide customers with
27

Table of Contents
software updates for software components that are essential to the functionality of our hardware products, such as Oracle Solaris and certain other softwareproducts, and can include product repairs, maintenance services and technical support services. Hardware support contracts are generally priced as a percentage ofthe net hardware products fees and are generally recognized as revenues as the hardware support services are delivered.
We generally expect our hardware business to have lower operating margins as a percentage of revenues than our cloud and on-premise software business due tothe incremental costs we incur to produce and distribute these products and to provide support services, including direct materials and labor costs.
Our quarterly hardware revenues are difficult to predict. Our hardware revenues, cost of hardware and hardware operating margins that we report are affected by:our ability to timely manufacture or deliver a few large hardware transactions; our strategy for and the competitive position of our hardware products relative tocompetitor offerings; customer demand for competing offerings such as PaaS and IaaS; the strength of general economic and business conditions; governmentalbudgetary constraints; whether customers decide to purchase hardware support contracts at or in close proximity to the time of hardware product sale; thepercentage of our hardware support contract customer base that renews its support contracts and the close association between hardware products, which have afinite life, and customer demand for related hardware support as hardware products age; customer decisions to either maintain or upgrade their existing hardwareinfrastructure to newly developed technologies that are available; certain of our acquisitions; and foreign currency rate fluctuations.
ServicesBusiness
Our services business helps customers and partners maximize the performance of their investments in Oracle applications, platform and infrastructure technologies.We believe that our services are differentiated based on our focus on Oracle technologies, extensive experience, and broad sets of intellectual property and bestpractices. Our services offerings include consulting services, advanced support services and education services and represented 9% of our total revenues on atrailing 4-quarter basis. Our services business has lower margins than our cloud and on-premise software and hardware businesses. Our services revenues areimpacted by our strategy for and the competitive position of our services; customer demand for our cloud and on-premise software and hardware offerings and theassociated services for these offerings; our strategic emphasis on growing our cloud revenues; certain of our acquisitions; general economic conditions;governmental budgetary constraints; personnel reductions in our customers’ IT departments; and tighter controls over discretionary spending.
Acquisitions
Our selective and active acquisition program is another important element of our corporate strategy. In recent years, we have invested billions of dollars to acquirea number of complementary companies, products, services and technologies, including NetSuite Inc. in the second quarter of fiscal 2017.
We expect to continue to acquire companies, products, services and technologies in furtherance of our corporate strategy. Note 2 of Notes to CondensedConsolidated Financial Statements included elsewhere in this Quarterly Report provides additional information related to our recent acquisitions.
We believe that we can fund our future acquisitions with our internally available cash, cash equivalents and marketable securities, cash generated from operations,additional borrowings or from the issuance of additional securities. We estimate the financial impact of any potential acquisition with regard to earnings, operatingmargin, cash flow and return on invested capital targets before deciding to move forward with an acquisition.
Critical Accounting Policies and Estimates
Our consolidated financial statements are prepared in accordance with U.S. generally accepted accounting principles (GAAP) as set forth in the FinancialAccounting Standards Board’s (FASB) Accounting Standards Codification (ASC), and we consider the various staff accounting bulletins and other applicableguidance issued by the U.S. Securities and Exchange Commission. GAAP, as set forth within the ASC, requires us to make certain estimates, judgments andassumptions. We believe that the estimates, judgments and assumptions upon which we rely are reasonable based upon information available to us at the time thatthese estimates, judgments
28

Table of Contents
and assumptions are made. These estimates, judgments and assumptions can affect the reported amounts of assets and liabilities as of the date of the financialstatements as well as the reported amounts of revenues and expenses during the periods presented. To the extent that there are differences between these estimates,judgments or assumptions and actual results, our financial statements will be affected. The accounting policies that reflect our more significant estimates,judgments and assumptions and which we believe are the most critical to aid in fully understanding and evaluating our reported financial results include:
• Revenue Recognition;
• Business Combinations;
• Goodwill and Intangible Assets—Impairment Assessments;
• Accounting for Income Taxes; and
• Legal and Other Contingencies.
In many cases, the accounting treatment of a particular transaction is specifically dictated by GAAP and does not require management’s judgment in its application.There are also areas in which management’s judgment in selecting among available alternatives would not produce a materially different result. Our seniormanagement has reviewed our critical accounting policies and related disclosures with the Finance and Audit Committee of the Board of Directors.
During the first half of fiscal 2018, there were no significant changes to our critical accounting policies and estimates. Management’s Discussion and Analysis ofFinancial Condition and Results of Operations contained in Part II, Item 7 of our Annual Report on Form 10-K for our fiscal year ended May 31, 2017 provides amore complete discussion of our critical accounting policies and estimates.
Results of Operations
ImpactsofAcquisitions
The comparability of our operating results in the second quarter and first half of fiscal 2018 compared to the same periods of fiscal 2017 was impacted by ourrecent acquisitions, including our acquisition of NetSuite Inc. during the second quarter of fiscal 2017. In our discussion of changes in our results of operationsfrom the second quarter and first half of fiscal 2018 compared to the same periods of fiscal 2017, we may qualitatively disclose the impact of our acquired productsand services (for the one-year period subsequent to the acquisition date) to the growth in certain of our businesses’ revenues where such qualitative discussionswould be meaningful for an understanding of the factors that influenced the changes in our results of operations. When material, we may also provide quantitativedisclosures related to such acquired products and services. Expense contributions from our recent acquisitions for each of the respective period comparisons maynot be separately identifiable due to the integration of these businesses into our existing operations, and/or were insignificant to our results of operations during theperiods presented.
We caution readers that, while pre- and post-acquisition comparisons, as well as any quantified amounts themselves, may provide indications of general trends, anyacquisition information that we provide has inherent limitations for the following reasons:
• any qualitative and quantitative disclosures cannot specifically address or quantify the substantial effects attributable to changes in business strategies,
including our sales force integration efforts. We believe that if our acquired companies had operated independently and sales forces had not beenintegrated, the relative mix of products and services sold would have been different; and
• although substantially all of our on-premise software license customers, including customers from acquired companies, renew their software licenseupdates and product support contracts when the contracts are eligible for renewal, and we strive to renew cloud SaaS, PaaS and IaaS contracts, theamounts shown as cloud and on-premise software deferred revenues in our “Supplemental Disclosure Related to Certain Charges” (presented below) arenot necessarily indicative of revenue improvements we will achieve upon contract renewals to the extent customers do not renew.
29
Table of Contents
Seasonality
Our quarterly revenues have historically been affected by a variety of seasonal factors, including the structure of our sales force incentive compensation plans,which are common in the technology industry. In each fiscal year, our total revenues and operating margins are typically highest in our fourth fiscal quarter andlowest in our first fiscal quarter. The operating margins of our businesses, in particular, our cloud and on-premise software business and hardware business, aregenerally affected by seasonal factors in a similar manner as our revenues as certain expenses within our cost structure are relatively fixed in the short term.
PresentationofOperatingSegmentResultsandOtherFinancialInformation
In our results of operations discussion below, we provide an overview of our total consolidated revenues, total consolidated expenses and total consolidatedoperating margin, all of which are presented on a GAAP basis. We also present a GAAP-based discussion below for substantially all of the other expense items aspresented in our condensed consolidated statement of operations that are not directly attributable to our three businesses.
In addition, we discuss below the results of each our three businesses—cloud and on-premise software, hardware and services—which are our operating segmentsas defined pursuant to ASC 280, SegmentReporting. The financial reporting for our three businesses that is presented below is presented in a manner that isconsistent with that used by our CODMs. Our operating segment presentation below reflects revenues, direct costs and sales and marketing expenses thatcorrespond to and are directly attributable to each of our three businesses. We also utilize these inputs to calculate and present a segment margin for each businessin the discussion below.
Consistent with our internal management reporting processes, the below operating segment presentation includes revenues adjustments related to cloud andon-premise software contracts that would have otherwise been recorded by the acquired businesses as independent entities but were not recognized in ourconsolidated statements of operations for the periods presented due to business combination accounting requirements. Refer to “Supplemental Disclosure Relatedto Certain Charges” below for additional discussion of these items and Note 12 of Notes to Condensed Consolidated Financial Statements included elsewhere inthis Quarterly Report for a reconciliation of the summations of our total operating segment revenues as presented in the discussion below to total revenues aspresented per our condensed consolidated statements of operations for all periods presented.
In addition, research and development expenses, general and administrative expenses, stock-based compensation expenses, amortization of intangible assets,certain other expense allocations, acquisition related and other expenses, restructuring expenses, interest expense, non-operating income, net and provision forincome taxes are not attributed to our operating segments because our management does not view the performance of our businesses including such items and/or itis impractical to do so. Refer to “Supplemental Disclosure Related to Certain Charges” below for additional discussion of certain of these items and Note 12 ofNotes to Condensed Consolidated Financial Statements included elsewhere in this Quarterly Report for a reconciliation of the summations of total segment marginas presented in the discussion below to total income before provision of income taxes as presented per our condensed consolidated statements of operations for allperiods presented.
ConstantCurrencyPresentation
Our international operations have provided and are expected to continue to provide a significant portion of each of our businesses’ revenues and expenses. As aresult, each businesses’ revenues and expenses and our total revenues and expenses will continue to be affected by changes in the U.S. Dollar against majorinternational currencies. In order to provide a framework for assessing how our underlying businesses performed excluding the effects of foreign currency ratefluctuations, we compare the percent change in the results from one period to another period in this Quarterly Report using constant currency disclosure. To presentthis information, current and comparative prior period results for entities reporting in currencies other than U.S. Dollars are converted into U.S. Dollars at constantexchange rates (i.e., the rates in effect on May 31, 2017, which was the last day of our prior fiscal year) rather than the actual exchange rates in effect during therespective periods. For example, if an entity reporting in Euros had revenues of 1.0 million Euros from products sold on November 30, 2017 and 2016, ourfinancial statements would reflect reported revenues of $1.19 million in the first half of fiscal 2018 (using 1.19 as the month-end average exchange rate for theperiod) and $1.05 million in the first half of fiscal 2017
30

Table of Contents
(using 1.05 as the month-end average exchange rate for the period). The constant currency presentation, however, would translate the results for the three and sixmonths ended November 30, 2017 and 2016 using the May 31, 2017 exchange rate and indicate, in this example, no change in revenues during the period. In eachof the tables below, we present the percent change based on actual, unrounded results in reported currency and in constant currency.
TotalRevenuesandOperatingExpenses Three Months Ended November 30, Six Months Ended November 30, Percent Change Percent Change (Dollars in millions) 2017 Actual Constant 2016 2017 Actual Constant 2016 TotalRevenuesbyGeography: Americas $ 5,306 8% 7% $ 4,936 $10,479 7% 7% $ 9,752 EMEA 2,802 10% 4% 2,557 5,341 7% 3% 4,971 Asia Pacific 1,513 -2% -2% 1,542 2,989 3% 3% 2,907
Total revenues 9,621 6% 5% 9,035 18,809 7% 5% 17,630 TotalOperatingExpenses 6,552 9% 8% 5,998 12,919 8% 7% 11,952
TotalOperatingMargin $ 3,069 1% -1% $ 3,037 $ 5,890 4% 2% $ 5,678
TotalOperatingMargin% 32% 34% 31% 32% %RevenuesbyGeography: Americas 55% 55% 56% 55% EMEA 29% 28% 28% 28% Asia Pacific 16% 17% 16% 17% TotalRevenuesbyBusiness: Cloud and on-premise software $ 7,825 9% 7% $ 7,177 $15,209 9% 7% $13,968 Hardware 940 -7% -9% 1,014 1,884 -6% -8% 2,010 Services 856 1% 0% 844 1,716 4% 2% 1,652
Total revenues $ 9,621 6% 5% $ 9,035 $18,809 7% 5% $17,630
%RevenuesbyBusiness: Cloud and on-premise software 81% 80% 81% 79% Hardware 10% 11% 10% 12% Services 9% 9% 9% 9%
Comprised of Europe, the Middle East and Africa
The Asia Pacific region includes Japan
Excluding the effects of foreign currency rate variations, our total revenues increased in the second quarter and first half of fiscal 2018 relative to the correspondingprior year periods primarily due to growth in our cloud and on-premise software revenues, partially offset by a decrease in our hardware revenues. The constantcurrency increases in our cloud and on-premise software revenues during the fiscal 2018 periods presented were attributable to growth in our cloud SaaS and cloudPaaS and IaaS revenues, growth in our software license updates and product support revenues, and revenue contributions from our recent acquisitions. The constantcurrency decreases in our hardware revenues during the fiscal 2018 periods presented were due to reductions in our hardware products revenues and hardwaresupport revenues as we continued to place emphasis on the development, marketing and sale of our cloud-based infrastructure technologies.
Excluding the effects of foreign currency rate variations, our total operating expenses increased during the second quarter and first half of fiscal 2018 relative to thecorresponding prior year periods primarily due to higher cloud SaaS and cloud PaaS and IaaS expenses resulting primarily from increased headcount andinfrastructure expenses to support the increases in our cloud SaaS and cloud PaaS and IaaS revenues; higher sales and marketing expenses; increased stock-basedcompensation expenses; increased restructuring expenses; and higher intangible asset amortization due to additional amortization from intangible assets that weacquired in connection with our acquisition of NetSuite and other recently acquired companies. These constant currency expense increases in the fiscal 2018periods presented were partially offset by certain reduced operating expenses
31
(1)
(2)
(1)
(2)

Table of Contents
during the fiscal 2018 periods relative to the corresponding prior year periods, primarily lower hardware products costs and lower hardware employee relatedexpenses, which aligned to lower hardware revenues.
In constant currency, our total operating margin and operating margin as a percentage of revenues decreased during the second quarter of fiscal 2018 as our totalexpenses, primarily cloud-based expenses, restructuring expenses and amortization of intangibles, grew at a faster rate than our total revenues in the second quarterof fiscal 2018 relative to the prior year period. In constant currency, our total operating margin increased during the first half of fiscal 2018 due to the increase inour total revenues; and operating margin as a percentage of total revenues decreased during the first half of fiscal 2018 as our total expenses grew at a faster ratethan our total revenues.
Supplemental Disclosure Related to Certain Charges
To supplement our condensed consolidated financial information, we believe that the following information is helpful to an overall understanding of our pastfinancial performance and prospects for the future. You should review the introduction under “Impact of Acquisitions” (above) for a discussion of the inherentlimitations in comparing pre- and post-acquisition information.
Our operating results reported pursuant to GAAP included the following business combination accounting adjustments and expenses related to acquisitions, as wellas certain other expense and income items that (increased) or reduced our GAAP net income:
Three Months Ended
November 30, Six Months Ended
November 30, (in millions) 2017 2016 2017 2016 Cloud and on-premise software deferred revenues $ 9 $ 35 $ 34 $ 53 Acquired deferred sales commissions amortization (5) (9) (16) (9) Amortization of intangible assets 400 302 811 613 Acquisition related and other 17 40 28 54 Restructuring 292 86 416 185 Stock-based compensation, operating segments 135 93 259 181 Stock-based compensation, R&D and G&A 283 223 562 454 Income tax effects (374) (228) (885) (486)
$ 757 $ 542 $ 1,209 $ 1,045
In connection with our acquisitions, we have estimated the fair values of the cloud SaaS and cloud PaaS and IaaS subscription obligations assumed. Due to our application of business combination accounting
rules, we did not recognize the cloud SaaS and cloud PaaS and IaaS, revenue amounts as presented in the above table that would have otherwise been recorded by the acquired businesses as independententities upon delivery of the contractual obligations. To the extent customers for which these contractual obligations pertain renew these contracts with us, we expect to recognize revenues for the fullcontracts’ values over the respective contracts’ renewal periods.
Certain acquired companies capitalized sales commissions associated with subscription agreements and amortized these amounts over the related contractual terms. Business combination accounting rulesgenerally require us to eliminate these acquired capitalized sales commissions balances as of the acquisition date and our post-combination GAAP sales and marketing expenses generally do not reflect theamortization of these acquired deferred sales commissions balances. This adjustment is intended to include, and thus reflect, the full amount of amortization related to such balances as though the acquiredcompanies operated independently in the periods presented.
Represents the amortization of intangible assets, substantially all of which were acquired in connection with our acquisitions. As of November 30, 2017, estimated future amortization expenses related tointangible assets were as follows (in millions):
Remainder of fiscal 2018 $ 781 Fiscal 2019 1,411 Fiscal 2020 1,210 Fiscal 2021 1,023 Fiscal 2022 918 Fiscal 2023 567 Thereafter 884
Total intangible assets, net $ 6,794
32
(1)
(2)
(3)
(4)(6)
(5)
(6)
(6)
(7)
(1)
(2)
(3)

Table of Contents
Acquisition related and other expenses primarily consist of personnel related costs and stock-based compensation expenses for transitional and certain other employees, integration related professionalservices, certain business combination adjustments including certain adjustments after the measurement period has ended and certain other operating items, net.
Restructuring expenses during the first half of fiscal 2018 and 2017 primarily related to employee severance in connection with our Fiscal 2017 Oracle Restructuring Plan (2017 Restructuring Plan).Additional information regarding certain of our restructuring plans is provided in the discussion below under “Restructuring Expenses”, Note 7 of Notes to Condensed Consolidated Financial Statementsincluded elsewhere in this Quarterly Report, and in Note 9 of Notes to Consolidated Financial Statements included in our Annual Report on Form 10-K for the fiscal year ended May 31, 2017.
Stock-based compensation was included in the following operating expense line items of our condensed consolidated statements of operations (in millions):
Three Months Ended
November 30, Six Months Ended
November 30, 2017 2016 2017 2016 Cloud SaaS $ 11 $ 6 $ 20 $ 11 Cloud PaaS and IaaS 2 1 4 2 Software license updates and product support 7 6 14 12 Hardware 3 3 6 6 Services 14 9 28 17 Sales and marketing 98 68 187 133
Stock-based compensation, operating segments 135 93 259 181
Research and development 237 188 472 382 General and administrative 46 35 90 72 Acquisition related and other — 11 1 11
Total stock-based compensation $ 418 $ 327 $ 822 $ 646
Stock-based compensation included in acquisition related and other expenses resulted from unvested stock options and restricted stock-based awards assumed from acquisitions whose vesting wasaccelerated generally upon termination of the employees pursuant to the terms of those stock options and restricted stock-based awards.
The income tax effects presented were calculated as if the above described charges were not included in our results of operations for each of the respective periods presented. Income tax effects for thesecond quarter and first half of fiscal 2018 were calculated based on the applicable jurisdictional tax rates applied to the items within the table above and resulted in effective tax rates of 25.2% and 25.1%,respectively, instead of 22.1% and 18.5%, respectively, which represented our effective tax rates as derived per our condensed consolidated statements of operations, primarily due to the net tax effects onstock-based compensation expense and acquisition related items, including the tax effects of amortization of intangible assets. Income tax effects for the second quarter and first half of fiscal 2017 werecalculated reflecting effective tax rates of 25.5% and 25.5%, respectively, instead of 24.3% and 23.6%, respectively, which represented our effective tax rates as derived per our condensed consolidatedstatements of operations, primarily due to the net tax effects of acquisition related items, including the tax effects of amortization of intangible assets and the net tax effects of stock-based compensation.
Cloud and On-Premise Software Business
Our cloud and on-premise software business engages in the sale, marketing and delivery of our cloud SaaS and cloud PaaS and IaaS offerings and the licensing ofour software for on-premise and other IT environments with the option to purchase software license updates and product support contracts. Our cloud SaaS andcloud PaaS and IaaS offerings are generally subscription based and generally recognized as revenues over the subscription period. New software licenses revenuesrepresent fees earned from granting customers licenses, generally on a perpetual basis, to use our database and middleware and our applications software productswithin on-premise and other IT environments and are generally recognized when unrestricted access to the software license is granted provided all other revenuerecognition criteria are met. Software license updates and product support revenues are typically generated through the sale of software support contracts related toon-premise new software licenses purchased by our customers at their option and are generally recognized as revenues ratably over the contractual term. Wecontinue to place significant emphasis, both domestically and internationally, on direct sales through our own sales force. We also continue to market our offeringsthrough indirect channels. Costs associated with our cloud and on-premise software business are included in cloud SaaS, PaaS and IaaS expenses, software licenseupdates and product support expenses, and sales and marketing expenses. These costs are largely personnel and infrastructure related including the cost ofproviding our cloud SaaS, PaaS, IaaS and
33
(4)
(5)
(6)
(7)

Table of Contents
software support offerings, salaries and commissions earned by our sales force for the sale of our cloud and software offerings, and marketing program costs. Three Months Ended November 30, Six Months Ended November 30, Percent Change Percent Change (Dollars in millions) 2017 Actual Constant 2016 2017 Actual Constant 2016 CloudandOn-PremiseSoftwareRevenues: Americas $ 4,418 9% 9% $ 4,035 $ 8,695 10% 9% $ 7,930 EMEA 2,259 12% 7% 2,008 4,279 9% 5% 3,911 Asia Pacific 1,157 -1% -1% 1,169 2,269 4% 4% 2,180
Total revenues 7,834 9% 7% 7,212 15,243 9% 7% 14,021 Expenses: Cloud SaaS, PaaS and IaaS 615 34% 33% 457 1,195 39% 38% 859 Software license updates and product support 240 7% 6% 225 480 0% -1% 481 Sales and marketing 1,776 8% 6% 1,633 3,460 7% 5% 3,229
Total expenses 2,631 13% 11% 2,315 5,135 12% 11% 4,569
TotalMargin $ 5,203 6% 5% $ 4,897 $ 10,108 7% 6% $ 9,452
TotalMargin% 66% 68% 66% 67% %RevenuesbyGeography: Americas 56% 56% 57% 56% EMEA 29% 28% 28% 28% Asia Pacific 15% 16% 15% 16% RevenuesbyOfferings: Cloud software as a service $ 1,130 49% 47% $ 759 $ 2,219 55% 54% $ 1,434 Cloud platform as a service and infrastructure as a service 398 22% 20% 328 801 25% 24% 639 New software licenses 1,353 0% -2% 1,347 2,319 -2% -4% 2,377 Software license updates and product support 4,953 4% 2% 4,778 9,904 3% 2% 9,571
Total cloud and on-premise software revenues $ 7,834 9% 7% $ 7,212 $ 15,243 9% 7% $ 14,021
%RevenuesbyOfferings: Cloud software as a service 14% 11% 15% 10% Cloud platform as a service and infrastructure as a service 5% 5% 5% 5% New software licenses 17% 18% 15% 17% Software license updates and product support 64% 66% 65% 68%
Includes cloud and on-premise software revenue adjustments related to certain cloud and software support contracts that would have otherwise been recorded as revenues by the acquired businesses asindependent entities but were not recognized in our GAAP-based consolidated statements of operations for the periods presented due to business combination accounting requirements. Such revenueadjustments were included in our operating segment results for purposes of reporting to and review by our CODMs. See “Presentation of Operating Segment Results and Other Financial Information” abovefor additional information.
Excludes stock-based compensation and certain allocations. Also excludes amortization of intangible assets and certain other GAAP-based expenses, which were not allocated to our operating segmentresults for purposes of reporting to and review by our CODMs, as further described under “Presentation of Operating Segment Results and Other Financial Information” above.
Excluding the effects of currency rate fluctuations, total revenues from our cloud and on-premise software business increased in the second quarter and first half offiscal 2018 relative to the corresponding prior year periods due to growth in our cloud SaaS and cloud PaaS and IaaS revenues, growth in our software licenseupdates and product support revenues and revenue contributions from our recent acquisitions, including our acquisition of NetSuite. The increases in our cloudSaaS and cloud PaaS and IaaS revenues during the fiscal 2018 periods presented were primarily due to the continued strategic emphasis we placed on selling,marketing and growing our cloud offerings and we expect these revenue trends will continue. The increases in software license updates and product supportrevenues during the fiscal 2018 periods presented were a result of substantially all customers electing to purchase software support contracts in conjunction withtheir purchase of new software licenses, and due to the renewal of substantially all of the software support customer base eligible for renewal during the trailing4-quarter period. During the second quarter of fiscal 2018, constant currency revenues grew in the Americas and EMEA regions and were partially offset by modestrevenue declines in the Asia Pacific region
34
(1)(1)
(1)(1)
(2)(2)
(2)(2)
(1)(1)
(1)(1)
(1)(1)
(1)
(1)
(2)
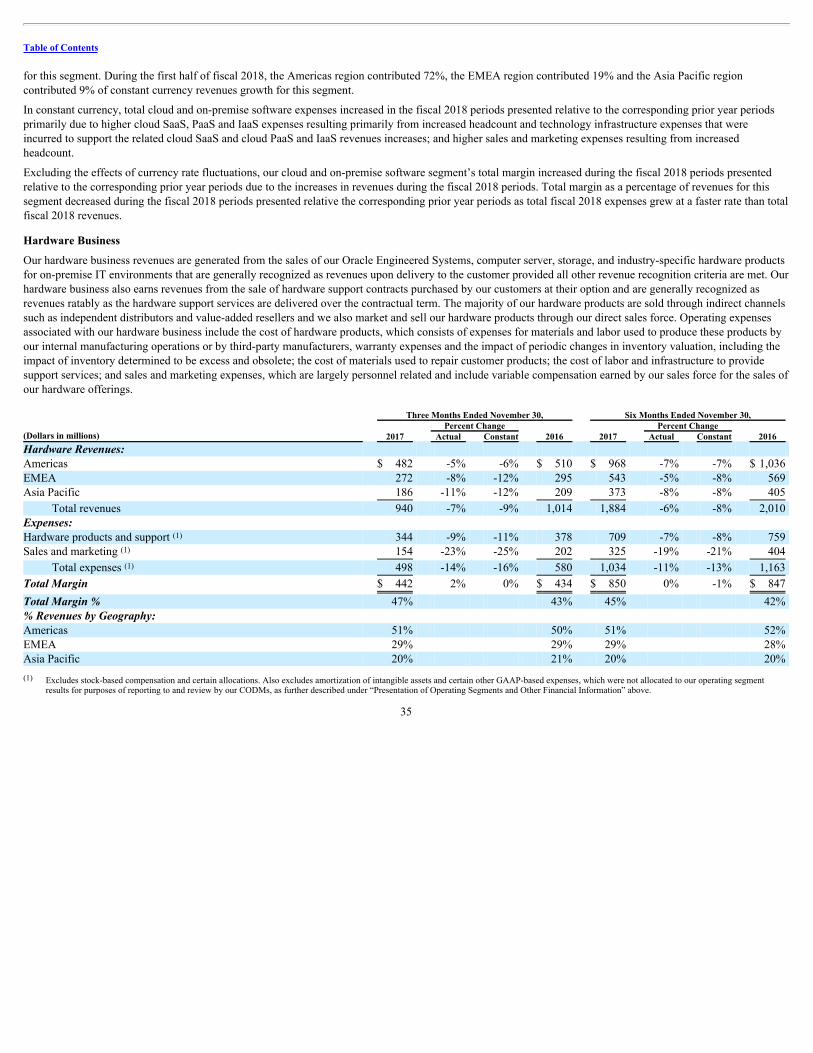
Table of Contents
for this segment. During the first half of fiscal 2018, the Americas region contributed 72%, the EMEA region contributed 19% and the Asia Pacific regioncontributed 9% of constant currency revenues growth for this segment.
In constant currency, total cloud and on-premise software expenses increased in the fiscal 2018 periods presented relative to the corresponding prior year periodsprimarily due to higher cloud SaaS, PaaS and IaaS expenses resulting primarily from increased headcount and technology infrastructure expenses that wereincurred to support the related cloud SaaS and cloud PaaS and IaaS revenues increases; and higher sales and marketing expenses resulting from increasedheadcount.
Excluding the effects of currency rate fluctuations, our cloud and on-premise software segment’s total margin increased during the fiscal 2018 periods presentedrelative to the corresponding prior year periods due to the increases in revenues during the fiscal 2018 periods. Total margin as a percentage of revenues for thissegment decreased during the fiscal 2018 periods presented relative the corresponding prior year periods as total fiscal 2018 expenses grew at a faster rate than totalfiscal 2018 revenues.
Hardware Business
Our hardware business revenues are generated from the sales of our Oracle Engineered Systems, computer server, storage, and industry-specific hardware productsfor on-premise IT environments that are generally recognized as revenues upon delivery to the customer provided all other revenue recognition criteria are met. Ourhardware business also earns revenues from the sale of hardware support contracts purchased by our customers at their option and are generally recognized asrevenues ratably as the hardware support services are delivered over the contractual term. The majority of our hardware products are sold through indirect channelssuch as independent distributors and value-added resellers and we also market and sell our hardware products through our direct sales force. Operating expensesassociated with our hardware business include the cost of hardware products, which consists of expenses for materials and labor used to produce these products byour internal manufacturing operations or by third-party manufacturers, warranty expenses and the impact of periodic changes in inventory valuation, including theimpact of inventory determined to be excess and obsolete; the cost of materials used to repair customer products; the cost of labor and infrastructure to providesupport services; and sales and marketing expenses, which are largely personnel related and include variable compensation earned by our sales force for the sales ofour hardware offerings.
Three Months Ended November 30, Six Months Ended November 30,
2017 Percent Change
2016
2017 Percent Change
2016 (Dollars in millions) Actual Constant Actual Constant HardwareRevenues: Americas $ 482 -5% -6% $ 510 $ 968 -7% -7% $ 1,036 EMEA 272 -8% -12% 295 543 -5% -8% 569 Asia Pacific 186 -11% -12% 209 373 -8% -8% 405
Total revenues 940 -7% -9% 1,014 1,884 -6% -8% 2,010 Expenses: Hardware products and support 344 -9% -11% 378 709 -7% -8% 759 Sales and marketing 154 -23% -25% 202 325 -19% -21% 404
Total expenses 498 -14% -16% 580 1,034 -11% -13% 1,163
TotalMargin $ 442 2% 0% $ 434 $ 850 0% -1% $ 847
TotalMargin% 47% 43% 45% 42% %RevenuesbyGeography: Americas 51% 50% 51% 52% EMEA 29% 29% 29% 28% Asia Pacific 20% 21% 20% 20%
Excludes stock-based compensation and certain allocations. Also excludes amortization of intangible assets and certain other GAAP-based expenses, which were not allocated to our operating segmentresults for purposes of reporting to and review by our CODMs, as further described under “Presentation of Operating Segments and Other Financial Information” above.
35
(1)
(1)
(1)
(1)
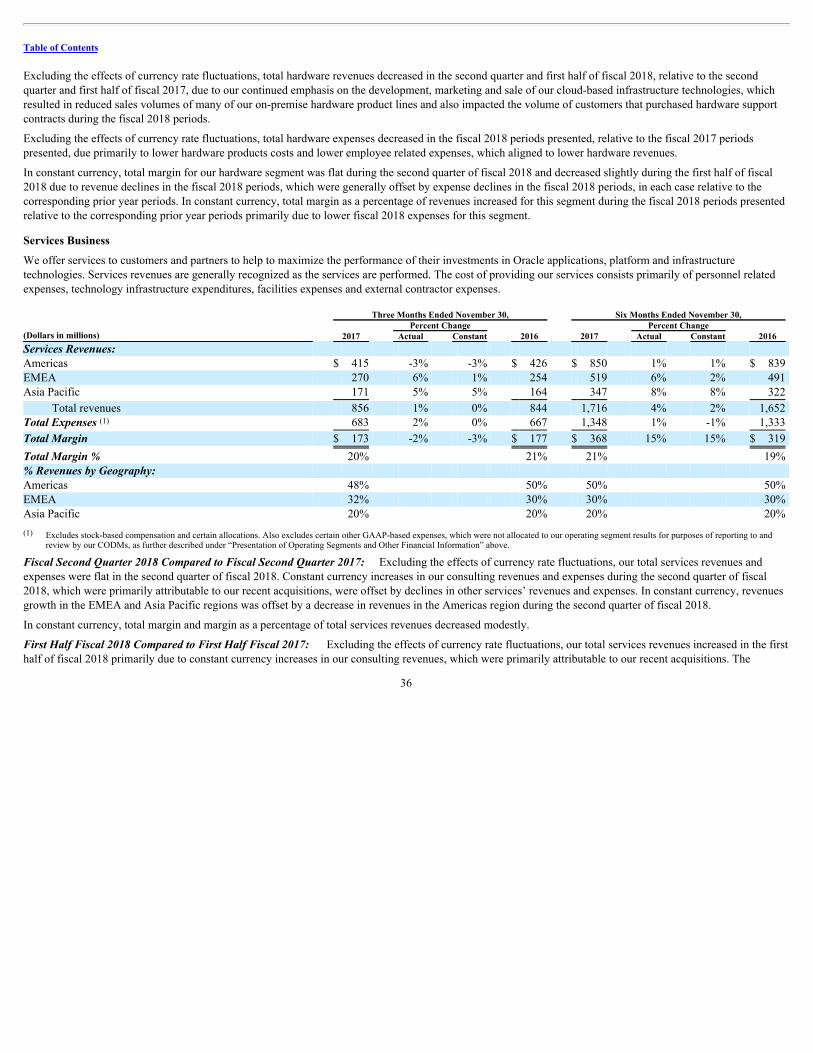
Table of Contents
Excluding the effects of currency rate fluctuations, total hardware revenues decreased in the second quarter and first half of fiscal 2018, relative to the secondquarter and first half of fiscal 2017, due to our continued emphasis on the development, marketing and sale of our cloud-based infrastructure technologies, whichresulted in reduced sales volumes of many of our on-premise hardware product lines and also impacted the volume of customers that purchased hardware supportcontracts during the fiscal 2018 periods.
Excluding the effects of currency rate fluctuations, total hardware expenses decreased in the fiscal 2018 periods presented, relative to the fiscal 2017 periodspresented, due primarily to lower hardware products costs and lower employee related expenses, which aligned to lower hardware revenues.
In constant currency, total margin for our hardware segment was flat during the second quarter of fiscal 2018 and decreased slightly during the first half of fiscal2018 due to revenue declines in the fiscal 2018 periods, which were generally offset by expense declines in the fiscal 2018 periods, in each case relative to thecorresponding prior year periods. In constant currency, total margin as a percentage of revenues increased for this segment during the fiscal 2018 periods presentedrelative to the corresponding prior year periods primarily due to lower fiscal 2018 expenses for this segment.
Services Business
We offer services to customers and partners to help to maximize the performance of their investments in Oracle applications, platform and infrastructuretechnologies. Services revenues are generally recognized as the services are performed. The cost of providing our services consists primarily of personnel relatedexpenses, technology infrastructure expenditures, facilities expenses and external contractor expenses. Three Months Ended November 30, Six Months Ended November 30, Percent Change Percent Change (Dollars in millions) 2017 Actual Constant 2016 2017 Actual Constant 2016 ServicesRevenues: Americas $ 415 -3% -3% $ 426 $ 850 1% 1% $ 839 EMEA 270 6% 1% 254 519 6% 2% 491 Asia Pacific 171 5% 5% 164 347 8% 8% 322
Total revenues 856 1% 0% 844 1,716 4% 2% 1,652 TotalExpenses 683 2% 0% 667 1,348 1% -1% 1,333
TotalMargin $ 173 -2% -3% $ 177 $ 368 15% 15% $ 319
TotalMargin% 20% 21% 21% 19% %RevenuesbyGeography: Americas 48% 50% 50% 50% EMEA 32% 30% 30% 30% Asia Pacific 20% 20% 20% 20%
Excludes stock-based compensation and certain allocations. Also excludes certain other GAAP-based expenses, which were not allocated to our operating segment results for purposes of reporting to andreview by our CODMs, as further described under “Presentation of Operating Segments and Other Financial Information” above.
FiscalSecondQuarter2018ComparedtoFiscalSecondQuarter2017: Excluding the effects of currency rate fluctuations, our total services revenues andexpenses were flat in the second quarter of fiscal 2018. Constant currency increases in our consulting revenues and expenses during the second quarter of fiscal2018, which were primarily attributable to our recent acquisitions, were offset by declines in other services’ revenues and expenses. In constant currency, revenuesgrowth in the EMEA and Asia Pacific regions was offset by a decrease in revenues in the Americas region during the second quarter of fiscal 2018.
In constant currency, total margin and margin as a percentage of total services revenues decreased modestly.
FirstHalfFiscal2018ComparedtoFirstHalfFiscal2017:Excluding the effects of currency rate fluctuations, our total services revenues increased in the firsthalf of fiscal 2018 primarily due to constant currency increases in our consulting revenues, which were primarily attributable to our recent acquisitions. The
36
(1)
(1)

Table of Contents
Americas region contributed 13%, the EMEA region contributed 24%, and the Asia Pacific region contributed 63% of the constant currency services revenuesgrowth during the first half of fiscal 2018.
In constant currency, total services expenses decreased and total margin and total margin as a percentage of revenues increased during the first half of fiscal 2018primarily due to a $30 million charge recorded during the first half of fiscal 2017, which increased our expenses in this period.
ResearchandDevelopmentExpenses: Research and development expenses consist primarily of personnel related expenditures. We intend to continue to investsignificantly in our research and development efforts because, in our judgment, they are essential to maintaining our competitive position. Three Months Ended November 30, Six Months Ended November 30, Percent Change Percent Change (Dollars in millions) 2017 Actual Constant 2016 2017 Actual Constant 2016 Research and development $ 1,238 -6% -7% $ 1,322 $ 2,577 -3% -4% $ 2,648 Stock-based compensation 237 27% 27% 188 472 23% 23% 382
Total expenses $ 1,475 -2% -3% $ 1,510 $ 3,049 1% 0% $ 3,030
%ofTotalRevenues 15% 17% 16% 17%
Excluding stock-based compensation
On a constant currency basis, total research and development expenses decreased during the second quarter of fiscal 2018 and were flat in the first half of fiscal2018, each relative to the corresponding prior year periods, primarily due to lower fiscal 2018 employee related expenses related to lower headcount resulting fromthe restructuring of certain of our research and development operations. These fiscal 2018 cost savings were partially offset by investments in the development ofour cloud-based offerings and by higher stock-based compensation during the fiscal 2018 periods relative to the corresponding prior year periods.
GeneralandAdministrativeExpenses: General and administrative expenses primarily consist of personnel related expenditures for IT, finance, legal and humanresources support functions.
Three Months Ended November 30, Six Months Ended November 30, Percent Change Percent Change (Dollars in millions) 2017 Actual Constant 2016 2017 Actual Constant 2016 General and administrative $ 275 3% 2% $ 268 $ 552 1% 0% $ 546 Stock-based compensation 46 34% 34% 35 90 25% 25% 72
Total expenses $ 321 6% 5% $ 303 $ 642 4% 3% $ 618
%ofTotalRevenues 3% 3% 3% 4%
Excluding stock-based compensation
On a constant currency basis, total general and administrative expenses increased during the fiscal 2018 periods presented relative to the corresponding prior yearperiods due primarily to increased employee related expenses associated with higher headcount and higher stock-based compensation expenses, partially offset bylower professional services expenses that were primarily legal related.
37
(1)
(1)
(1)
(1)

Table of Contents
AmortizationofIntangibleAssets: Substantially all of our intangible assets are acquired through our business combinations. We amortize our intangible assetsover, and monitor the appropriateness of, the estimated useful lives of these assets. We also periodically review these intangible assets for potential impairmentbased upon relevant facts and circumstances. Note 5 of Notes to Condensed Consolidated Financial Statements included elsewhere in this Quarterly Report hasadditional information regarding our intangible assets and related amortization. Three Months Ended November 30, Six Months Ended November 30, Percent Change Percent Change (Dollars in millions) 2017 Actual Constant 2016 2017 Actual Constant 2016 Developed technology $ 188 31% 31% $ 144 $ 378 35% 35% $ 280 SaaS, PaaS and IaaS agreements and related relationships 150 76% 76% 85 301 103% 103% 148 Software support agreements and related relationships 31 0% 0% 31 62 -2% -2% 63 Other 31 -26% -26% 42 70 -43% -43% 122
Total amortization of intangible assets $ 400 33% 33% $ 302 $ 811 32% 32% $ 613
Amortization of intangible assets increased during the fiscal 2018 periods presented relative to the corresponding prior year periods due to additional amortizationfrom intangible assets that we acquired in connection with our recent acquisitions, primarily our acquisition of NetSuite.
AcquisitionRelatedandOtherExpenses: Acquisition related and other expenses consist of personnel related costs and stock-based compensation fortransitional and certain other employees, integration related professional services, and certain business combination adjustments including certain adjustments afterthe measurement period has ended and certain other operating items, net. Stock-based compensation expenses included in acquisition related and other expensesresulted from unvested restricted stock-based awards and stock options assumed from acquisitions whereby vesting was accelerated generally upon termination ofthe employees pursuant to the original terms of those restricted stock-based awards and stock options. Three Months Ended November 30, Six Months Ended November 30, Percent Change Percent Change (Dollars in millions) 2017 Actual Constant 2016 2017 Actual Constant 2016 Transitional and other employee related costs $ 14 81% 76% $ 8 $ 23 48% 44% $ 16 Stock-based compensation — -109% -109% 11 1 -97% -97% 11 Professional fees and other, net 3 -86% -86% 22 6 -77% -77% 27 Business combination adjustments, net — -103% -103% (1) (2) * * —
Total acquisition related and other expenses $ 17 -58% -59% $ 40 $ 28 -48% -48% $ 54
Not meaningful
On a constant currency basis, acquisition related and other expenses decreased in the fiscal 2018 periods presented, relative to the corresponding prior year periods,primarily due to lower stock-based compensation expenses and lower professional fees.
38
*

Table of Contents
RestructuringExpenses: Restructuring expenses resulted from the execution of management approved restructuring plans that were generally developed toimprove our cost structure and/or operations, often in conjunction with our acquisition integration strategies. Restructuring expenses consist of employee severancecosts and may also include charges for duplicate facilities and other contract termination costs to improve our cost structure prospectively. For additionalinformation regarding our restructuring plans, see Note 7 of Notes to Condensed Consolidated Financial Statements included elsewhere in this Quarterly Reportand Note 9 of Notes to Consolidated Financial Statements included in our Annual Report on Form 10-K for the fiscal year ended May 31, 2017. Three Months Ended November 30, Six Months Ended November 30, Percent Change Percent Change (Dollars in millions) 2017 Actual Constant 2016 2017 Actual Constant 2016 Restructuring expenses $ 292 241% 227% $ 86 $ 416 125% 118% $ 185
Restructuring expenses in the fiscal 2018 and 2017 periods presented primarily related to our 2017 Restructuring Plan. Our management approved, committed toand initiated the 2017 Restructuring Plan in order to restructure and further improve efficiencies in our operations. In the first quarter of fiscal 2018, ourmanagement supplemented the 2017 Restructuring Plan to reflect additional actions that we expect to take. The total estimated restructuring costs associated withthe 2017 Restructuring Plan are up to $1.1 billion and will be recorded to the restructuring expense line item within our condensed consolidated statements ofoperations as they are incurred. The total estimated remaining restructuring costs associated with the 2017 Restructuring Plan were approximately $212 million asof November 30, 2017 and the majority of the remaining costs are expected to be incurred through the end of fiscal 2018. Our estimated costs are subject to changein future periods.
The majority of the initiatives undertaken by our 2017 Restructuring Plan were effected to implement our continued move toward developing, marketing andselling our cloud-based offerings. These initiatives impacted certain of our sales and marketing and research and development operations. Cost savings that areexpected to be realized pursuant to our 2017 Restructuring Plan initiatives are primarily expected to be offset by investments in resources and geographies that bestaddress the development, marketing and sale of our cloud-based offerings as customer preferences pivot to the Oracle Cloud.
InterestExpense: Three Months Ended November 30, Six Months Ended November 30, Percent Change Percent Change (Dollars in millions) 2017 Actual Constant 2016 2017 Actual Constant 2016 Interest expense $ 475 5% 5% $ 451 $ 944 9% 9% $ 867
Interest expense increased in the fiscal 2018 periods presented relative to the corresponding prior year periods, primarily due to higher average borrowings resultingfrom our issuance of $10.0 billion of senior notes in November 2017 (refer to Recent Financing Activities presented below for additional information), which waspartially offset by a reduction in interest expense resulting from the maturity and repayment of $3.5 billion of senior notes during the first half of fiscal 2018.
39
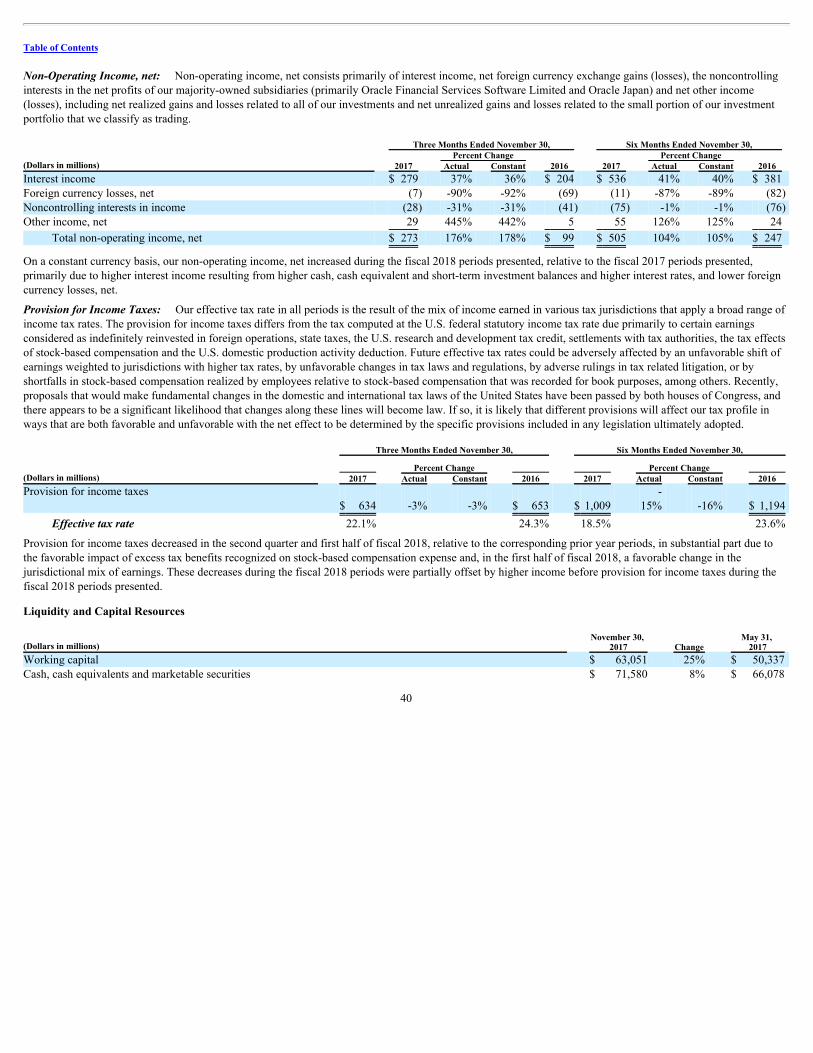
Table of Contents
Non-OperatingIncome,net: Non-operating income, net consists primarily of interest income, net foreign currency exchange gains (losses), the noncontrollinginterests in the net profits of our majority-owned subsidiaries (primarily Oracle Financial Services Software Limited and Oracle Japan) and net other income(losses), including net realized gains and losses related to all of our investments and net unrealized gains and losses related to the small portion of our investmentportfolio that we classify as trading. Three Months Ended November 30, Six Months Ended November 30, Percent Change Percent Change (Dollars in millions) 2017 Actual Constant 2016 2017 Actual Constant 2016 Interest income $ 279 37% 36% $ 204 $ 536 41% 40% $ 381 Foreign currency losses, net (7) -90% -92% (69) (11) -87% -89% (82) Noncontrolling interests in income (28) -31% -31% (41) (75) -1% -1% (76) Other income, net 29 445% 442% 5 55 126% 125% 24
Total non-operating income, net $ 273 176% 178% $ 99 $ 505 104% 105% $ 247
On a constant currency basis, our non-operating income, net increased during the fiscal 2018 periods presented, relative to the fiscal 2017 periods presented,primarily due to higher interest income resulting from higher cash, cash equivalent and short-term investment balances and higher interest rates, and lower foreigncurrency losses, net.
ProvisionforIncomeTaxes: Our effective tax rate in all periods is the result of the mix of income earned in various tax jurisdictions that apply a broad range ofincome tax rates. The provision for income taxes differs from the tax computed at the U.S. federal statutory income tax rate due primarily to certain earningsconsidered as indefinitely reinvested in foreign operations, state taxes, the U.S. research and development tax credit, settlements with tax authorities, the tax effectsof stock-based compensation and the U.S. domestic production activity deduction. Future effective tax rates could be adversely affected by an unfavorable shift ofearnings weighted to jurisdictions with higher tax rates, by unfavorable changes in tax laws and regulations, by adverse rulings in tax related litigation, or byshortfalls in stock-based compensation realized by employees relative to stock-based compensation that was recorded for book purposes, among others. Recently,proposals that would make fundamental changes in the domestic and international tax laws of the United States have been passed by both houses of Congress, andthere appears to be a significant likelihood that changes along these lines will become law. If so, it is likely that different provisions will affect our tax profile inways that are both favorable and unfavorable with the net effect to be determined by the specific provisions included in any legislation ultimately adopted. Three Months Ended November 30, Six Months Ended November 30,
Percent Change Percent Change (Dollars in millions) 2017 Actual Constant 2016 2017 Actual Constant 2016 Provision for income taxes
$ 634 -3% -3% $ 653 $ 1,009 -
15% -16% $ 1,194
Effectivetaxrate 22.1% 24.3% 18.5% 23.6%
Provision for income taxes decreased in the second quarter and first half of fiscal 2018, relative to the corresponding prior year periods, in substantial part due tothe favorable impact of excess tax benefits recognized on stock-based compensation expense and, in the first half of fiscal 2018, a favorable change in thejurisdictional mix of earnings. These decreases during the fiscal 2018 periods were partially offset by higher income before provision for income taxes during thefiscal 2018 periods presented.
Liquidity and Capital Resources
(Dollars in millions) November 30,
2017 Change May 31,
2017 Working capital $ 63,051 25% $ 50,337 Cash, cash equivalents and marketable securities $ 71,580 8% $ 66,078
40
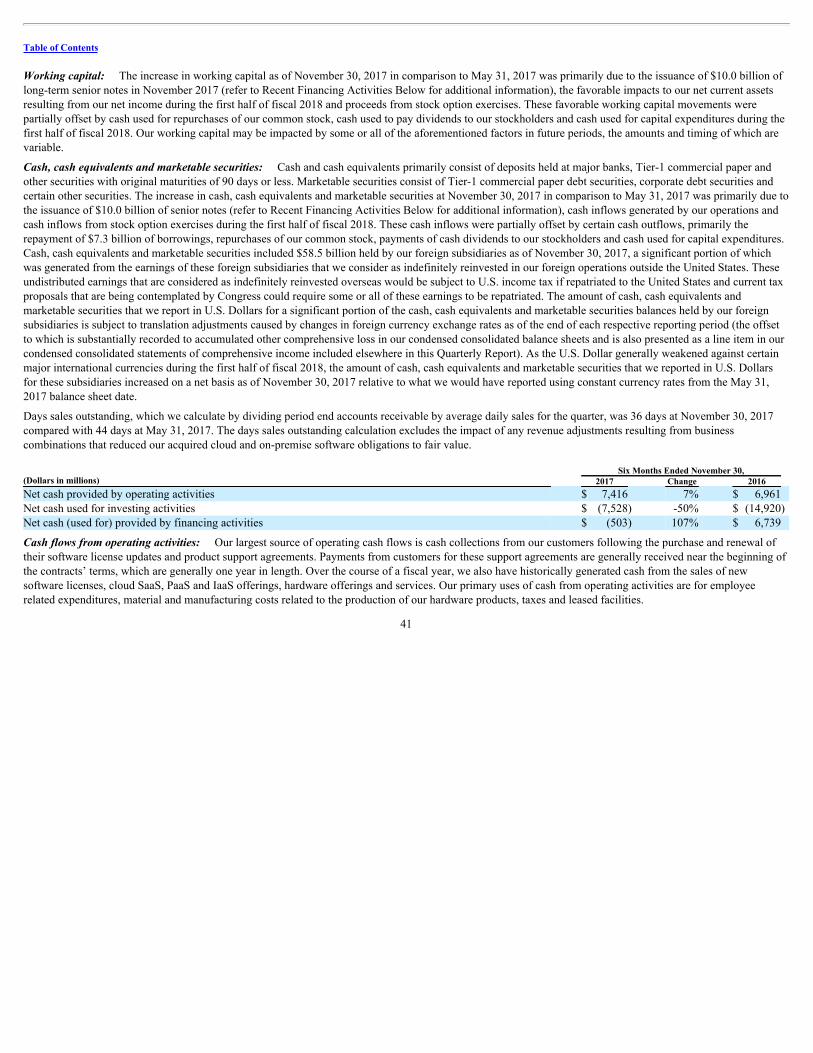
Table of Contents
Workingcapital: The increase in working capital as of November 30, 2017 in comparison to May 31, 2017 was primarily due to the issuance of $10.0 billion oflong-term senior notes in November 2017 (refer to Recent Financing Activities Below for additional information), the favorable impacts to our net current assetsresulting from our net income during the first half of fiscal 2018 and proceeds from stock option exercises. These favorable working capital movements werepartially offset by cash used for repurchases of our common stock, cash used to pay dividends to our stockholders and cash used for capital expenditures during thefirst half of fiscal 2018. Our working capital may be impacted by some or all of the aforementioned factors in future periods, the amounts and timing of which arevariable.
Cash,cashequivalentsandmarketablesecurities: Cash and cash equivalents primarily consist of deposits held at major banks, Tier-1 commercial paper andother securities with original maturities of 90 days or less. Marketable securities consist of Tier-1 commercial paper debt securities, corporate debt securities andcertain other securities. The increase in cash, cash equivalents and marketable securities at November 30, 2017 in comparison to May 31, 2017 was primarily due tothe issuance of $10.0 billion of senior notes (refer to Recent Financing Activities Below for additional information), cash inflows generated by our operations andcash inflows from stock option exercises during the first half of fiscal 2018. These cash inflows were partially offset by certain cash outflows, primarily therepayment of $7.3 billion of borrowings, repurchases of our common stock, payments of cash dividends to our stockholders and cash used for capital expenditures.Cash, cash equivalents and marketable securities included $58.5 billion held by our foreign subsidiaries as of November 30, 2017, a significant portion of whichwas generated from the earnings of these foreign subsidiaries that we consider as indefinitely reinvested in our foreign operations outside the United States. Theseundistributed earnings that are considered as indefinitely reinvested overseas would be subject to U.S. income tax if repatriated to the United States and current taxproposals that are being contemplated by Congress could require some or all of these earnings to be repatriated. The amount of cash, cash equivalents andmarketable securities that we report in U.S. Dollars for a significant portion of the cash, cash equivalents and marketable securities balances held by our foreignsubsidiaries is subject to translation adjustments caused by changes in foreign currency exchange rates as of the end of each respective reporting period (the offsetto which is substantially recorded to accumulated other comprehensive loss in our condensed consolidated balance sheets and is also presented as a line item in ourcondensed consolidated statements of comprehensive income included elsewhere in this Quarterly Report). As the U.S. Dollar generally weakened against certainmajor international currencies during the first half of fiscal 2018, the amount of cash, cash equivalents and marketable securities that we reported in U.S. Dollarsfor these subsidiaries increased on a net basis as of November 30, 2017 relative to what we would have reported using constant currency rates from the May 31,2017 balance sheet date.
Days sales outstanding, which we calculate by dividing period end accounts receivable by average daily sales for the quarter, was 36 days at November 30, 2017compared with 44 days at May 31, 2017. The days sales outstanding calculation excludes the impact of any revenue adjustments resulting from businesscombinations that reduced our acquired cloud and on-premise software obligations to fair value. Six Months Ended November 30, (Dollars in millions) 2017 Change 2016 Net cash provided by operating activities $ 7,416 7% $ 6,961 Net cash used for investing activities $ (7,528) -50% $ (14,920) Net cash (used for) provided by financing activities $ (503) 107% $ 6,739
Cashflowsfromoperatingactivities: Our largest source of operating cash flows is cash collections from our customers following the purchase and renewal oftheir software license updates and product support agreements. Payments from customers for these support agreements are generally received near the beginning ofthe contracts’ terms, which are generally one year in length. Over the course of a fiscal year, we also have historically generated cash from the sales of newsoftware licenses, cloud SaaS, PaaS and IaaS offerings, hardware offerings and services. Our primary uses of cash from operating activities are for employeerelated expenditures, material and manufacturing costs related to the production of our hardware products, taxes and leased facilities.
41
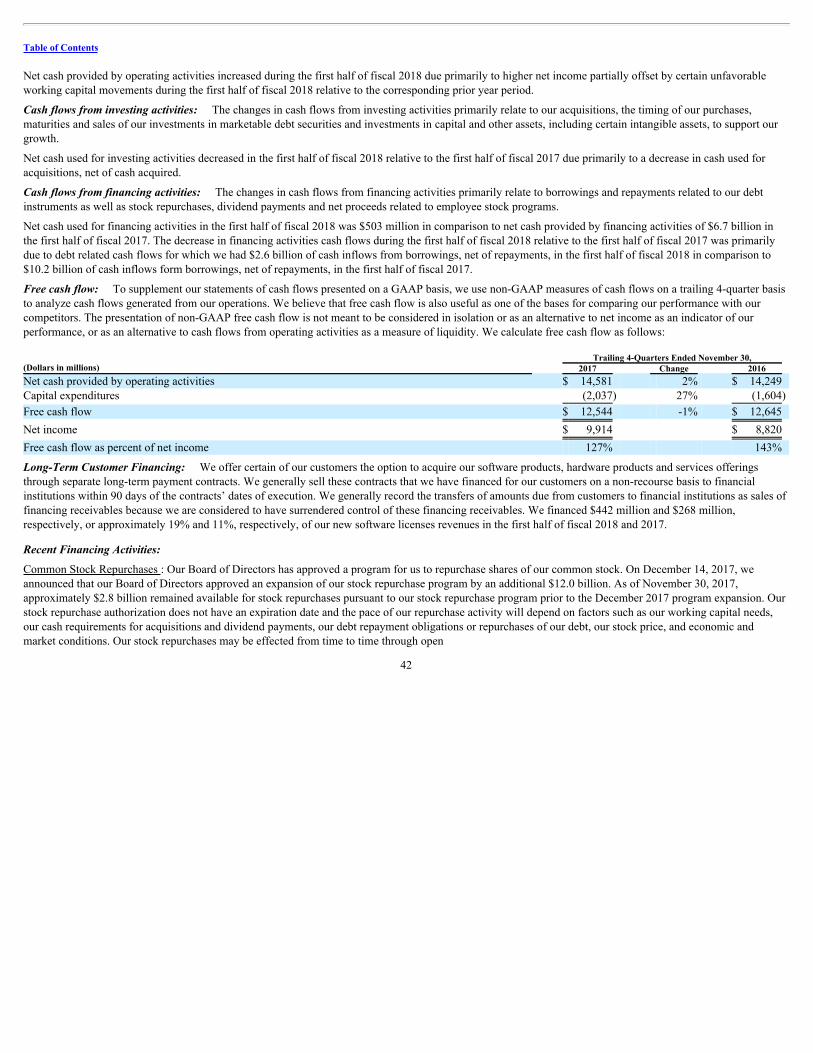
Table of Contents
Net cash provided by operating activities increased during the first half of fiscal 2018 due primarily to higher net income partially offset by certain unfavorableworking capital movements during the first half of fiscal 2018 relative to the corresponding prior year period.
Cashflowsfrominvestingactivities: The changes in cash flows from investing activities primarily relate to our acquisitions, the timing of our purchases,maturities and sales of our investments in marketable debt securities and investments in capital and other assets, including certain intangible assets, to support ourgrowth.
Net cash used for investing activities decreased in the first half of fiscal 2018 relative to the first half of fiscal 2017 due primarily to a decrease in cash used foracquisitions, net of cash acquired.
Cashflowsfromfinancingactivities: The changes in cash flows from financing activities primarily relate to borrowings and repayments related to our debtinstruments as well as stock repurchases, dividend payments and net proceeds related to employee stock programs.
Net cash used for financing activities in the first half of fiscal 2018 was $503 million in comparison to net cash provided by financing activities of $6.7 billion inthe first half of fiscal 2017. The decrease in financing activities cash flows during the first half of fiscal 2018 relative to the first half of fiscal 2017 was primarilydue to debt related cash flows for which we had $2.6 billion of cash inflows from borrowings, net of repayments, in the first half of fiscal 2018 in comparison to$10.2 billion of cash inflows form borrowings, net of repayments, in the first half of fiscal 2017.
Freecashflow: To supplement our statements of cash flows presented on a GAAP basis, we use non-GAAP measures of cash flows on a trailing 4-quarter basisto analyze cash flows generated from our operations. We believe that free cash flow is also useful as one of the bases for comparing our performance with ourcompetitors. The presentation of non-GAAP free cash flow is not meant to be considered in isolation or as an alternative to net income as an indicator of ourperformance, or as an alternative to cash flows from operating activities as a measure of liquidity. We calculate free cash flow as follows: Trailing 4-Quarters Ended November 30, (Dollars in millions) 2017 Change 2016 Net cash provided by operating activities $ 14,581 2% $ 14,249 Capital expenditures (2,037) 27% (1,604)
Free cash flow $ 12,544 -1% $ 12,645
Net income $ 9,914 $ 8,820
Free cash flow as percent of net income 127% 143%
Long-TermCustomerFinancing: We offer certain of our customers the option to acquire our software products, hardware products and services offeringsthrough separate long-term payment contracts. We generally sell these contracts that we have financed for our customers on a non-recourse basis to financialinstitutions within 90 days of the contracts’ dates of execution. We generally record the transfers of amounts due from customers to financial institutions as sales offinancing receivables because we are considered to have surrendered control of these financing receivables. We financed $442 million and $268 million,respectively, or approximately 19% and 11%, respectively, of our new software licenses revenues in the first half of fiscal 2018 and 2017.
RecentFinancingActivities:
Common Stock Repurchases : Our Board of Directors has approved a program for us to repurchase shares of our common stock. On December 14, 2017, weannounced that our Board of Directors approved an expansion of our stock repurchase program by an additional $12.0 billion. As of November 30, 2017,approximately $2.8 billion remained available for stock repurchases pursuant to our stock repurchase program prior to the December 2017 program expansion. Ourstock repurchase authorization does not have an expiration date and the pace of our repurchase activity will depend on factors such as our working capital needs,our cash requirements for acquisitions and dividend payments, our debt repayment obligations or repurchases of our debt, our stock price, and economic andmarket conditions. Our stock repurchases may be effected from time to time through open
42
Table of Contents
market purchases or pursuant to a Rule 10b5-1 plan. Our stock repurchase program may be accelerated, suspended, delayed or discontinued at any time.
Senior Notes : In November 2017, we issued $10.0 billion of senior notes comprised of the following:
• $1.25 billion of 2.625% senior notes due February 2023;
• $2.00 billion of 2.95% senior notes due November 2024;
• $2.75 billion of 3.25% senior notes due November 2027;
• $1.75 billion of 3.80% senior notes due November 2037; and
• $2.25 billion of 4.00% senior notes due November 2047.
We issued the senior notes for general corporate purposes, which may include stock repurchases, payment of cash dividends on our common stock, repayment ofindebtedness and future acquisitions. Additionally, during the first half of fiscal 2018, we repaid $3.5 billion of senior notes pursuant to their terms. Additionaldetails regarding the senior notes are included in Note 6 of Notes to Condensed Consolidated Financial Statements included elsewhere in this Quarterly Report andNote 8 of Notes to Condensed Consolidated Financial Statements included in our Annual Report on Form 10-K for the fiscal year ended May 31, 2017. There havebeen no other significant changes in our notes payable or other borrowing arrangements that were disclosed in our Annual Report on Form 10-K for the fiscal yearended May 31, 2017.
ContractualObligations: During the first half of fiscal 2018, there were no significant changes to our estimates of future payments under our fixed contractualobligations and commitments as presented in Part II, Item 7. Management’s Discussion and Analysis of Financial Condition and Results of Operations included inour Annual Report on Form 10-K for our fiscal year ended May 31, 2017.
We believe that our current cash, cash equivalents and marketable securities and cash generated from operations will be sufficient to meet our working capital,capital expenditures and contractual obligation requirements. In addition, we believe that we could fund our future acquisitions, dividend payments and repurchasesof common stock or debt with our internally available cash, cash equivalents and marketable securities, cash generated from operations, additional borrowings orfrom the issuance of additional securities.
Off-BalanceSheetArrangements: We do not have any off-balance sheet arrangements that have or are reasonably likely to have a current or future effect on ourfinancial condition, changes in financial condition, revenues or expenses, results of operations, liquidity, capital expenditures or capital resources that are materialto investors.
Restricted Stock-Based Awards and Stock Options
Our stock-based compensation program is a key component of the compensation package we provide to attract and retain certain of our talented employees andalign their interests with the interests of existing stockholders.
We recognize that restricted stock-based awards and stock options dilute existing stockholders and have sought to control the number of stock-based awardsgranted while providing competitive compensation packages. Consistent with these dual goals, our cumulative potential dilution since June 1, 2014 has been aweighted-average annualized rate of 1.2% per year. The potential dilution percentage is calculated as the average annualized new restricted stock-based awards orstock options granted and assumed, net of restricted stock-based awards and stock options forfeited by employees leaving the company, divided by the weighted-average outstanding shares during the calculation period. This maximum potential dilution will only result if all restricted stock-based awards vest and all stockoptions are exercised. Of the outstanding stock options at November 30, 2017, which generally have a ten-year exercise period, 17.3% have exercise prices higherthan the market price of our common stock on such date. In recent years, our stock repurchase program has more than offset the dilutive effect of our stock-basedcompensation program. However, we have recently reduced the level of our stock repurchases and we may modify the levels of our stock repurchases in the futuredepending on a number of factors, including the amount of cash we have available for acquisitions, to pay dividends, to repay or repurchase indebtedness or forother purposes. At November 30, 2017, the maximum potential dilution from all outstanding
43
Table of Contents
restricted stock-based awards and unexercised stock options, regardless of when granted and regardless of whether vested or unvested and including stock optionswhere the strike price is higher than the market price as of such date, was 10.5%.
Recent Accounting Pronouncements
For information with respect to recent accounting pronouncements, if any, and the impact of these pronouncements on our consolidated financial statements, if any,see Note 1 of Notes to Condensed Consolidated Financial Statements included elsewhere in this Quarterly Report.
Item 3. Quantitative and Qualitative Disclosures About Market Risk
There were no significant changes to our quantitative and qualitative disclosures about market risk during the first half of fiscal 2018. Please refer to Part II, Item7A. Quantitative and Qualitative Disclosures about Market Risk included in our Annual Report on Form 10-K for our fiscal year ended May 31, 2017 for a morecomplete discussion of the market risks we encounter.
Item 4. Controls and Procedures
EvaluationofDisclosureControlsandProcedures: Based on our management’s evaluation (with the participation of our Principal Executive Officers, one ofwhom is our Principal Financial Officer), as of the end of the period covered by this Quarterly Report, our Principal Executive Officers have concluded that our“disclosure controls and procedures” (as defined in Rules 13a-15(e) and 15d-15(e) under the Securities Exchange Act of 1934, as amended (the Exchange Act))were effective to provide reasonable assurance that the information required to be disclosed by us in our reports filed or submitted under the Exchange Act isrecorded, processed, summarized, and reported within the time periods specified in the SEC’s rules and forms and is accumulated and communicated to ourmanagement (including our Principal Executive Officers) as appropriate to allow timely decisions regarding required disclosure.
ChangesinInternalControloverFinancialReporting: There were no changes in our internal control over financial reporting that occurred during our lastfiscal quarter that have materially affected, or are reasonably likely to materially affect, our internal control over financial reporting.
InherentLimitationsonEffectivenessofControls: Our management, including our Principal Executive Officers (one of whom is our Principal FinancialOfficer), believes that our disclosure controls and procedures and internal control over financial reporting are designed to provide reasonable assurance ofachieving their objectives and are effective at the reasonable assurance level. However, our management does not expect that our disclosure controls andprocedures or our internal control over financial reporting will prevent all errors and all fraud. A control system, no matter how well-conceived and operated, canprovide only reasonable, not absolute, assurance that the objectives of the control system are met. Further, the design of a control system must reflect the fact thatthere are resource constraints and the benefits of controls must be considered relative to their costs. Because of the inherent limitations in all control systems, noevaluation of controls can provide absolute assurance that all control issues and instances of fraud, if any, have been detected. These inherent limitations include therealities that judgments in decision making can be faulty and that breakdowns can occur because of a simple error or mistake. Additionally, controls can becircumvented by the individual acts of some persons, by collusion of two or more people or by management override of the controls. The design of any system ofcontrols also is based in part upon certain assumptions about the likelihood of future events and there can be no assurance that any design will succeed in achievingits stated goals under all potential future conditions; over time, controls may become inadequate because of changes in conditions, or the degree of compliance withpolicies or procedures may deteriorate. Because of the inherent limitations in a cost-effective control system, misstatements due to error or fraud may occur and notbe detected.
44

Table of Contents
PART II. OTHER INFORMATION
Item 1. Legal Proceedings
The material set forth in Note 11 (pertaining to information regarding contingencies related to our income taxes) and Note 14 (pertaining to information regardinglegal contingencies) of Notes to Condensed Consolidated Financial Statements in Part I, Item 1 of this Quarterly Report on Form 10-Q is incorporated herein byreference.
Item 1A. Risk Factors
In addition to the other information set forth in this Quarterly Report, you should carefully consider the factors discussed in Part I, Item 1A. “Risk Factors” in ourAnnual Report on Form 10-K for our fiscal year ended May 31, 2017. The risks discussed in our Annual Report on Form 10-K could materially affect our business,financial condition and future results. The risks described in our Annual Report on Form 10-K are not the only risks facing us. Additional risks and uncertaintiesnot currently known to us or that we currently deem to be insignificant also may materially and adversely affect our business, financial condition or operatingresults in the future.
Item 2. Unregistered Sales of Equity Securities and Use of Proceeds
Our Board of Directors has approved a program for us to repurchase shares of our common stock. On December 14, 2017, we announced that our Board ofDirectors approved an expansion of our stock repurchase program by an additional $12.0 billion. As of November 30, 2017, approximately $2.8 billion remainedavailable for stock repurchases pursuant to our stock repurchase program.
Our stock repurchase authorization does not have an expiration date and the pace of our repurchase activity will depend on factors such as our working capitalneeds, our cash requirements for acquisitions and dividend payments, our debt repayment obligations or repurchases of our debt, our stock price, and economic andmarket conditions. Our stock repurchases may be effected from time to time through open market purchases or pursuant to a Rule 10b5-1 plan. Our stockrepurchase program may be accelerated, suspended, delayed or discontinued at any time.
The following table summarizes the stock repurchase activity for the three months ended November 30, 2017 and the approximate dollar value of shares that mayyet be purchased pursuant to our stock repurchase program:
(in millions, except per share amounts)
Total Numberof Shares Purchased
Average Price Paid
per Share
Total Number of Shares Purchased as Part of Publicly
Announced Program
Approximate Dollar Value of Shares that May
Yet Be Purchased Under the Program
September 1, 2017—September 30, 2017 9.1 $ 48.73 9.1 $ 4,407.7 October 1, 2017—October 31, 2017 16.2 $ 49.24 16.2 $ 3,610.0 November 1, 2017—November 30, 2017 15.4 $ 49.42 15.4 $ 2,848.4
Total 40.7 $ 49.20 40.7
45
Table of Contents
Item 6. Exhibits
ExhibitNo.
Exhibit Description
Incorporated by Reference Form File No. Exhibit Filing Date Filed By
4.14
Form of 2.625% Notes due 2023, 2.950% Notes due 2024, 3.250% Notes due2027, 3.800% Notes due 2037 and 4.000% Notes due 2047, together withOfficers’ Certificate issued November 9, 2017 setting forth the terms of theNotes
8-K
001-35992
4.1
11/9/17
Oracle Corporation
10.04*
Oracle Corporation Amended and Restated 2000 Long-Term Equity IncentivePlan, as approved on November 15, 2017
8-K
001-35992
10.04
11/17/17
Oracle Corporation
31.01‡ Rule 13a-14(a)/15d-14(a) Certification of Principal Executive Officer
31.02‡
Rule 13a-14(a)/15d-14(a) Certification of Principal Executive and FinancialOfficer
32.01†
Section 1350 Certification of Principal Executive Officers and PrincipalFinancial Officer
101‡
Interactive Data Files Pursuant to Rule 405 of Regulation S-T: (i) CondensedConsolidated Balance Sheets as of November 30, 2017 and May 31, 2017, (ii)Condensed Consolidated Statements of Operations for the three and sixmonths ended November 30, 2017 and 2016, (iii) Condensed ConsolidatedStatements of Comprehensive Income for the three and six months endedNovember 30, 2017 and 2016, (iv) Condensed Consolidated Statements ofCash Flows for the six months ended November 30, 2017 and 2016 and(v) Notes to Condensed Consolidated Financial Statements
* Indicates management contract or compensatory plan or arrangement.
‡ Filed herewith.
† Furnished herewith.
46

Table of Contents
SIGNATURES
Pursuant to the requirements of the Securities Exchange Act of 1934, Oracle Corporation has duly caused this report to be signed on its behalf by the undersigned,thereunto duly authorized.
ORACLE CORPORATION
Date: December 18, 2017 By: /s/ S AFRA A. C ATZ
Safra A. Catz
Chief Executive Officer and Director(Principal Executive and Financial Officer)
Date: December 18, 2017 By: /s/ W ILLIAM C OREY W EST
William Corey West
Executive Vice President, Corporate Controllerand Chief Accounting Officer
47
Exhibit 31.01
CERTIFICATION OF PRINCIPAL EXECUTIVE OFFICER PURSUANT TOEXCHANGE ACT RULE 13a-14(a)/15d-14(a)
AS ADOPTED PURSUANT TO SECTION 302 OF THE SARBANES-OXLEY ACT OF 2002
I, Mark V. Hurd, certify that:
1. I have reviewed this quarterly report on Form 10-Q of Oracle Corporation;
2. Based on my knowledge, this report does not contain any untrue statement of a material fact or omit to state a material fact necessary to make the statementsmade, in light of the circumstances under which such statements were made, not misleading with respect to the period covered by this report;
3. Based on my knowledge, the financial statements, and other financial information included in this report, fairly present in all material respects the financialcondition, results of operations and cash flows of the registrant as of, and for, the periods presented in this report;
4. The registrant’s other certifying officer and I are responsible for establishing and maintaining disclosure controls and procedures (as defined in Exchange ActRules 13a-15(e) and 15d-15(e)) and internal control over financial reporting (as defined in Exchange Act Rules 13a-15(f) and 15d-15(f)) for the registrantand have:
a) designed such disclosure controls and procedures, or caused such disclosure controls and procedures to be designed under our supervision, to ensure
that material information relating to the registrant, including its consolidated subsidiaries, is made known to us by others within those entities,particularly during the period in which this report is being prepared;
b) designed such internal control over financial reporting, or caused such internal control over financial reporting to be designed under our supervision, to
provide reasonable assurance regarding the reliability of financial reporting and the preparation of financial statements for external purposes inaccordance with generally accepted accounting principles;
c) evaluated the effectiveness of the registrant’s disclosure controls and procedures and presented in this report our conclusions about the effectiveness of
the disclosure controls and procedures, as of the end of the period covered by this report based on such evaluation; and
d) disclosed in this report any change in the registrant’s internal control over financial reporting that occurred during the registrant’s most recent fiscal
quarter (the registrant’s fourth fiscal quarter in the case of an annual report) that has materially affected, or is reasonably likely to materially affect, theregistrant’s internal control over financial reporting; and
5. The registrant’s other certifying officer and I have disclosed, based on our most recent evaluation of internal control over financial reporting, to theregistrant’s auditors and the Finance and Audit Committee of the registrant’s board of directors (or persons performing the equivalent functions):
a) all significant deficiencies and material weaknesses in the design or operation of internal control over financial reporting which are reasonably likely
to adversely affect the registrant’s ability to record, process, summarize and report financial information; and
b) any fraud, whether or not material, that involves management or other employees who have a significant role in the registrant’s internal control over
financial reporting. Date: December 18, 2017 By: /s/ M ARK V. H URD
Mark V. HurdChief Executive Officer and Director(Principal Executive Officer)
Exhibit 31.02
CERTIFICATION OF PRINCIPAL EXECUTIVE AND FINANCIAL OFFICER PURSUANT TOEXCHANGE ACT RULE 13a-14(a)/15d-14(a)
AS ADOPTED PURSUANT TO SECTION 302 OF THE SARBANES-OXLEY ACT OF 2002
I, Safra A. Catz, certify that:
1. I have reviewed this quarterly report on Form 10-Q of Oracle Corporation;
2. Based on my knowledge, this report does not contain any untrue statement of a material fact or omit to state a material fact necessary to make the statementsmade, in light of the circumstances under which such statements were made, not misleading with respect to the period covered by this report;
3. Based on my knowledge, the financial statements, and other financial information included in this report, fairly present in all material respects the financialcondition, results of operations and cash flows of the registrant as of, and for, the periods presented in this report;
4. The registrant’s other certifying officer and I are responsible for establishing and maintaining disclosure controls and procedures (as defined in Exchange ActRules 13a-15(e) and 15d-15(e)) and internal control over financial reporting (as defined in Exchange Act Rules 13a-15(f) and 15d-15(f)) for the registrantand have:
a) designed such disclosure controls and procedures, or caused such disclosure controls and procedures to be designed under our supervision, to ensure
that material information relating to the registrant, including its consolidated subsidiaries, is made known to us by others within those entities,particularly during the period in which this report is being prepared;
b) designed such internal control over financial reporting, or caused such internal control over financial reporting to be designed under our supervision, to
provide reasonable assurance regarding the reliability of financial reporting and the preparation of financial statements for external purposes inaccordance with generally accepted accounting principles;
c) evaluated the effectiveness of the registrant’s disclosure controls and procedures and presented in this report our conclusions about the effectiveness of
the disclosure controls and procedures, as of the end of the period covered by this report based on such evaluation; and
d) disclosed in this report any change in the registrant’s internal control over financial reporting that occurred during the registrant’s most recent fiscal
quarter (the registrant’s fourth fiscal quarter in the case of an annual report) that has materially affected, or is reasonably likely to materially affect, theregistrant’s internal control over financial reporting; and
5. The registrant’s other certifying officer and I have disclosed, based on our most recent evaluation of internal control over financial reporting, to theregistrant’s auditors and the Finance and Audit Committee of the registrant’s board of directors (or persons performing the equivalent functions):
a) all significant deficiencies and material weaknesses in the design or operation of internal control over financial reporting which are reasonably likely
to adversely affect the registrant’s ability to record, process, summarize and report financial information; and
b) any fraud, whether or not material, that involves management or other employees who have a significant role in the registrant’s internal control over
financial reporting. Date: December 18, 2017 By: /s/ S AFRA A. C ATZ
Safra A. CatzChief Executive Officer and Director(Principal Executive and Financial Officer)

Exhibit 32.01
CERTIFICATION OF PRINCIPAL EXECUTIVE OFFICERS ANDPRINCIPAL FINANCIAL OFFICER PURSUANT TO 18 U.S.C. SECTION 1350
AS ADOPTED PURSUANT TO SECTION 906 OF THE SARBANES-OXLEY ACT OF 2002
The certification set forth below is being submitted in connection with the quarterly report on Form 10-Q of Oracle Corporation for the purpose ofcomplying with Rule 13a-14(b) or Rule 15d-14(b) of the Securities Exchange Act of 1934 and Section 1350 of Chapter 63 of Title 18 of the United StatesCode.
Safra A. Catz, the Chief Executive Officer (Principal Executive Officer and Principal Financial Officer) of Oracle Corporation, and Mark V. Hurd, theChief Executive Officer (Principal Executive Officer) of Oracle Corporation, each certifies that, to the best of his or her knowledge:
1. the quarterly report fully complies with the requirements of Section 13(a) or 15(d) of the Securities Exchange Act of 1934; and
2. the information contained in the quarterly report fairly presents, in all material respects, the financial condition and results of operations of OracleCorporation.
Date: December 18, 2017 By: /s/ S AFRA A. C ATZ
Safra A. CatzChief Executive Officer and Director(Principal Executive and Financial Officer)
Date: December 18, 2017 By: /s/ M ARK V. H URD
Mark V. HurdChief Executive Officer and Director(Principal Executive Officer)
The foregoing certification is being furnished pursuant to 18 U.S.C. Section 1350. It is not being filed for purposes of Section 18 of the Securities ExchangeAct of 1934, as amended, and it is not to be incorporated by reference into any filing of Oracle Corporation, regardless of any general incorporationlanguage in such filing.