Embed Size (px)
Citation preview

UNITED STATESSECURITIES AND EXCHANGE COMMISSION
Washington, D.C. 20549
Form 10-Qý Quarterly Report Pursuant to Section 13 or 15(d) of the Securities Exchange Act of 1934
For the quarterly period ended June 30, 2016
OR
o Transition Report Pursuant to Section 13 or 15(d) of the Securities Exchange Act of 1934For the transition period to
Commission file number 001-10962
Callaway Golf Company(Exact name of registrant as specified in its charter)
Delaware 95-3797580(State or other jurisdiction of
incorporation or organization)(I.R.S. Employer
Identification No.)
2180 Rutherford Road, Carlsbad, CA 92008(760) 931-1771
(Address, including zip code, and telephone number, including area code, of principal executive offices)
Indicate by check mark whether the registrant (1) has filed all reports required to be filed by Section 13 or 15(d) of the Securities Exchange Act
of 1934 during the preceding 12 months (or for such shorter period that the registrant was required to file such reports), and (2) has been subject to such
filing requirements for the past 90 days. Yes ý No o
Indicate by check mark whether the registrant has submitted electronically and posted on its corporate Web site, if any, every Interactive Data
File required to be submitted and posted pursuant to Rule 405 of Regulation S-T (§232.405 of this chapter) during the preceding 12 months (or for such
shorter period that the registrant was required to submit and post such files). Yes ý No o
Indicate by check mark whether the registrant is a large accelerated filer, an accelerated filer, or a non-accelerated filer (as defined in Rule 12b-2
of the Exchange Act).
Large accelerated filer o Accelerated filer ý
Non-accelerated filer o (Do not check if a smaller reporting company) Smaller reporting company o
Indicate by check mark whether the registrant is a shell company (as defined in Rule 12b-2 of the Exchange Act). Yes o No ý
As of June 30, 2016, the number of shares outstanding of the Registrant’s common stock outstanding was 94,030,894.
CALLAWAY GOLF CO / 10-Q / August 1, 2016 Powered by BamSEC.comPDF page 1

PART I. FINANCIAL INFORMATION
Item 1. Financial Statements (Unaudited)CALLAWAY GOLF COMPANY
CONSOLIDATED CONDENSED BALANCE SHEETS(Unaudited)
(In thousands, except share data)
June 30,2016
December 31,2015
ASSETSCurrent assets:
Cash and cash equivalents $ 67,619 $ 49,801
Accounts receivable, net 205,058 115,607
Inventories 151,446 208,883
Income taxes receivable 2,382 487
Other current assets 12,670 16,709
Total current assets 439,175 391,487
Property, plant and equipment, net 53,399 55,808
Intangible assets, net 88,757 88,782
Goodwill 26,306 26,500
Deferred taxes, net 7,255 6,962
Investment in golf-related ventures (Note 6) 49,108 53,315
Other assets 8,525 8,370
Total assets $ 672,525 $ 631,224
LIABILITIES AND SHAREHOLDERS’ EQUITYCurrent liabilities:
Accounts payable and accrued expenses $ 106,482 $ 122,620
Accrued employee compensation and benefits 25,433 33,518
Asset-based credit facilities 5,331 14,969
Accrued warranty expense 6,172 5,706
Income tax liability 3,769 1,823
Total current liabilities 147,187 178,636
Long-term liabilities:
Income tax payable 3,325 3,476
Deferred taxes, net 34,824 35,093
Long-term incentive compensation and other 882 1,074
Commitments and contingencies (Note 9)
Shareholders’ equity:
Preferred stock, $0.01 par value, 3,000,000 shares authorized, none issued and outstanding at June 30, 2016
and December 31, 2015 — —
Common stock, $0.01 par value, 240,000,000 shares authorized, 94,214,295 and 93,769,199 shares issued at
June 30, 2016 and December 31, 2015, respectively 942 938
Additional paid-in capital 325,805 322,793
Retained earnings 171,607 101,047
Accumulated other comprehensive loss (10,356) (11,813)
Less: Common stock held in treasury, at cost, 183,401 and 2,075 shares at June 30, 2016 and December 31,
2015, respectively (1,691) (20)
Total shareholders’ equity 486,307 412,945
Total liabilities and shareholders’ equity $ 672,525 $ 631,224
The accompanying notes are an integral part of these financial statements.
5
CALLAWAY GOLF CO / 10-Q / August 1, 2016 Powered by BamSEC.comPDF page 5
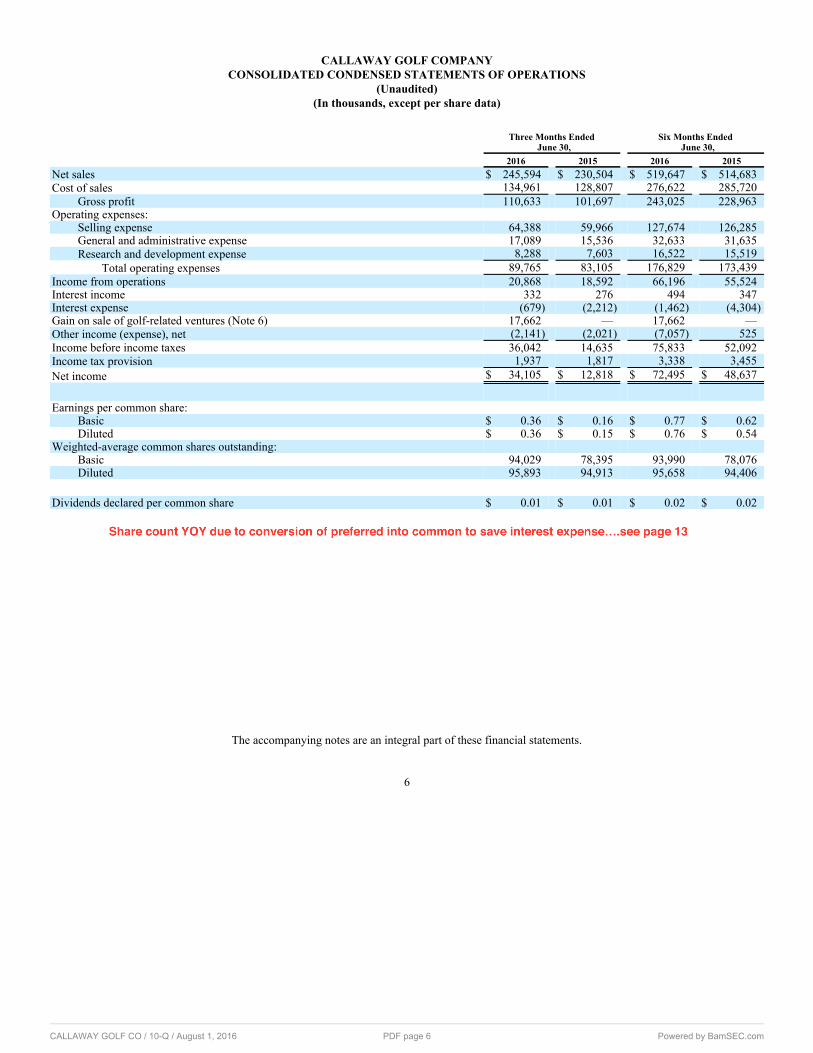
CALLAWAY GOLF COMPANYCONSOLIDATED CONDENSED STATEMENTS OF OPERATIONS
(Unaudited)(In thousands, except per share data)
Three Months EndedJune 30,
Six Months EndedJune 30,
2016 2015 2016 2015Net sales $ 245,594 $ 230,504 $ 519,647 $ 514,683
Cost of sales 134,961 128,807 276,622 285,720
Gross profit 110,633 101,697 243,025 228,963
Operating expenses:
Selling expense 64,388 59,966 127,674 126,285
General and administrative expense 17,089 15,536 32,633 31,635
Research and development expense 8,288 7,603 16,522 15,519
Total operating expenses 89,765 83,105 176,829 173,439
Income from operations 20,868 18,592 66,196 55,524
Interest income 332 276 494 347
Interest expense (679) (2,212) (1,462) (4,304)
Gain on sale of golf-related ventures (Note 6) 17,662 — 17,662 —
Other income (expense), net (2,141) (2,021) (7,057) 525
Income before income taxes 36,042 14,635 75,833 52,092
Income tax provision 1,937 1,817 3,338 3,455
Net income $ 34,105 $ 12,818 $ 72,495 $ 48,637
Earnings per common share:
Basic $ 0.36 $ 0.16 $ 0.77 $ 0.62
Diluted $ 0.36 $ 0.15 $ 0.76 $ 0.54
Weighted-average common shares outstanding:
Basic 94,029 78,395 93,990 78,076
Diluted 95,893 94,913 95,658 94,406
Dividends declared per common share $ 0.01 $ 0.01 $ 0.02 $ 0.02
The accompanying notes are an integral part of these financial statements.
6
CALLAWAY GOLF CO / 10-Q / August 1, 2016 Powered by BamSEC.comPDF page 6

CALLAWAY GOLF COMPANYCONSOLIDATED CONDENSED STATEMENTS OF CASH FLOWS
(Unaudited)(In thousands)
Six Months EndedJune 30,
2016 2015Cash flows from operating activities:
Net income $ 72,495 $ 48,637
Adjustments to reconcile net income to net cash provided by (used in) operating activities:
Depreciation and amortization 8,337 9,157
Deferred taxes (347) 145
Share-based compensation 4,329 3,561
Gain on disposal of long-lived assets and deferred gain amortization (124) (510)
Gain on sale of golf-related investments (17,662) —
Discount amortization on convertible notes — 395
Unrealized losses on foreign currency hedges 884 —
Change in assets and liabilities:
Accounts receivable, net (86,452) (112,433)
Inventories 61,843 35,166
Other assets 918 2,962
Accounts payable and accrued expenses (18,475) (9,941)
Accrued employee compensation and benefits (8,119) (9,979)
Accrued warranty expense 466 840
Income taxes receivable/payable (161) (378)
Other liabilities (171) (289)
Net cash provided by (used in) operating activities 17,761 (32,667)
Cash flows from investing activities:
Proceeds from sale of investments in golf-related ventures 23,429 —
Collection of note receivable 3,104 —
Capital expenditures (7,487) (5,912)
Investment in golf-related ventures (1,560) —
Proceeds from sales of property and equipment 20 2
Net cash provided by (used in) investing activities 17,506 (5,910)
Cash flows from financing activities:
(Repayments of) proceeds from asset-based credit facilities, net (9,638) 27,364
Acquisition of treasury stock (5,133) (1,915)
Dividends paid (1,882) (1,565)
Exercise of stock options 2,096 5,330
Net cash (used in) provided by financing activities (14,557) 29,214
Effect of exchange rate changes on cash and cash equivalents (2,892) (1,558)
Net increase (decrease) in cash and cash equivalents 17,818 (10,921)
Cash and cash equivalents at beginning of period 49,801 37,635
Cash and cash equivalents at end of period $ 67,619 $ 26,714
Supplemental disclosures:
Cash paid for income taxes, net $ 3,920 $ 3,596
Cash paid for interest and fees $ 1,109 $ 3,494
Noncash investing and financing activities:
Issuance of treasury stock for compensatory stock awards released from restriction $ 817 $ 3,669
Accrued capital expenditures at period-end $ 640 $ 553
The accompanying notes are an integral part of these financial statements.
8
CALLAWAY GOLF CO / 10-Q / August 1, 2016 Powered by BamSEC.comPDF page 8

is required to be disclosed for financial instruments measured at amortized cost. This amendment is effective for public companies for fiscal years
beginning after December 15, 2017, including interim periods within those fiscal years. The Company is currently evaluating the impact this ASU will
have on its consolidated condensed financial statements and disclosures.
In July 2015, the FASB issued ASU No. 2015-11, "Inventory (Topic 330): Simplifying the Measurement of Inventory." Topic 330, Inventory,
currently requires an entity to measure inventory at the lower of cost or market. Market could be replacement cost, net realizable value, or net realizable
value less an approximately normal profit margin. The amendments apply to inventory that is measured using first-in, first-out (FIFO) or average
cost. An entity should measure in-scope inventory at the lower of cost and net realizable value. Net realizable value is the estimated selling prices in
the ordinary course of business, less reasonably predictable costs of completion, disposal, and transportation. The amendments in this update more
closely align the measurement of inventory in GAAP with the measurement of inventory in International Financial Reporting Standards. For public
business entities, the amendments are effective for fiscal years beginning after December 15, 2016, including interim periods within those fiscal years.
The amendments should be applied prospectively with earlier application permitted as of the beginning of an interim or annual reporting period. The
Company does not expect that the adoption of this amendment will have a material impact on its consolidated condensed financial statements.
In August 2014, the FASB issued ASU No. 2014-15, "Presentation of Financial Statements—Going Concern (Subtopic 205-40): Disclosure
of Uncertainties about an Entity’s Ability to Continue as a Going Concern." This ASU is intended to define management’s responsibility to evaluate
whether there is substantial doubt about an organization’s ability to continue as a going concern and to provide related footnote disclosures, and
provides guidance to an organization’s management, with principles and definitions that are intended to reduce diversity in the timing and content
of disclosures that are commonly provided by organizations today in the financial statement footnotes. Until the issuance of this ASU, U.S. GAAP
lacked guidance about management’s responsibility to evaluate whether there is substantial doubt about the organization’s ability to continue as a going
concern or to provide related footnote disclosures. The amendments are effective for annual periods ending after December 15, 2016, and interim
periods within annual periods beginning after December 15, 2016. Early application is permitted for annual or interim reporting periods for which the
financial statements have not previously been issued. The Company does not expect that the adoption of this amendment will have a material impact
on its consolidated condensed financial statements and disclosures.
In May 2014, the FASB issued ASU No. 2014-09, "Revenue from Contracts with Customers: (Topic 606)." This ASU affects any entity that
either enters into contracts with customers to transfer goods or services or enters into contracts for the transfer of nonfinancial assets unless those
contracts are within the scope of other standards (e.g., insurance contracts or lease contracts). This ASU will supersede the revenue recognition
requirements in Topic 605, "Revenue Recognition," and most industry-specific guidance. In addition, the existing requirements for the recognition of
a gain or loss on the transfer of nonfinancial assets that are not in a contract with a customer (e.g., assets within the scope of Topic 360, "Property,
Plant, and Equipment," and intangible assets within the scope of Topic 350, "Intangibles-Goodwill and Other") are amended to be consistent with the
guidance on recognition and measurement (including the constraint on revenue) in this ASU. The core principle of the guidance is that an entity should
recognize revenue to depict the transfer of promised goods or services to customers in an amount that reflects the consideration to which the entity
expects to be entitled in exchange for those goods or services. The amendments in this ASU are effective for annual reporting periods beginning after
December 15, 2017, including interim periods within that reporting period. Early adoption is permitted only for annual reporting periods beginning
after December 15, 2016, including interim reporting periods within that reporting period. The Company is currently evaluating the impact this ASU
will have on its consolidated condensed financial statements and disclosures.
Note 2. Financing Arrangements
In addition to cash on hand, as well as cash generated from operations, the Company relies on its primary and Japan asset-based revolving credit
facilities to manage seasonal fluctuations in liquidity and to provide additional liquidity when the Company’s operating cash flows are not sufficient
to fund the Company’s requirements. As of June 30, 2016, the Company had a total of $5,331,000 in borrowings outstanding under both facilities on a
combined basis, $951,000 in outstanding letters of credit, and $67,619,000 in cash and cash equivalents. At June 30, 2015, the Company had a total of
$42,599,000 in borrowings outstanding under both facilities on a combined basis, $1,149,000 in outstanding letters of credit, and $26,714,000 in cash
and cash equivalents. The combined maximum amount that could have been outstanding under both facilities on June 30, 2016, after letters of credit,
was $148,712,000, resulting in total available liquidity including cash on hand of $216,331,000 compared to the maximum amount that could have
been outstanding under both facilities on June 30, 2015 of $161,940,000, and total available liquidity including cash on hand of $188,654,000.
11
CALLAWAY GOLF CO / 10-Q / August 1, 2016 Powered by BamSEC.comPDF page 11

borrow up to 2,000,000,000 Yen (or U.S. $19,384,000, using the exchange rate in effect as of June 30, 2016) under this credit facility over a two-year
term, and the amounts outstanding are secured by certain assets, including eligible inventory.
The Japan ABL Facility is subject to an effective interest rate equal to TIBOR plus 0.25%. At June 30, 2016, the trailing 12 month average
interest rate applicable to the Company's outstanding loans under the Japan ABL Facility together with fees was 2.56% and includes certain restrictions
including covenants related to certain pledged assets and financial performance metrics. As of June 30, 2016, the Company was in compliance with
these covenants. Borrowings outstanding under this facility as of June 30, 2016 totaled 550,000,000 Yen (or U.S. $5,331,000 using the exchange rate in
effect as of June 30, 2016), and the maximum amount that could have been outstanding at June 30, 2016 was 2,000,000,000 Yen (or U.S. $19,384,000).
Convertible Senior Notes
In 2012, the Company issued $112,500,000 of 3.75% Convertible Senior Notes (the “convertible notes”). The convertible notes were convertible
at the option of the note holder at any time on or prior to the close of business on the business day immediately preceding August 15, 2019, into shares
of common stock at an initial conversion rate of 133.3333 shares per $1,000 principal amount of convertible notes, which is equal to an aggregate
of 15,000,000 shares of common stock at a conversion price of approximately $7.50 per share, subject to customary anti-dilution adjustments. In
connection with these convertible notes, the Company incurred transactional fees of $3,537,000.
During the second half of 2015, the convertible notes were retired pursuant to certain exchange transactions and shareholder conversions, which
resulted, among other things, in the issuance of 15,000,000 shares of the Company's common stock to the note holders. In connection with the retirement
of the convertible notes, the Company recorded $108,955,000 in shareholders' equity as of December 31, 2015, net of the outstanding discount of
$3,395,000. There were no convertible notes outstanding as of June 30, 2016 and December 31, 2015.
In connection with the elimination of the convertible notes, the Company accelerated the amortization of transaction fees during the second half
of 2015. As a result, there were no transaction fees amortized during the three and six months ended June 30, 2016. Total interest and amortization
expense recognized in the three and six months ended June 30, 2015 was $1,248,000 and $2,506,000, respectively.
Note 3. Earnings per Common ShareBasic earnings per common share is computed by dividing net income by the weighted-average number of common shares outstanding for the
period.
Diluted earnings per common share reflects the potential dilution that could occur if convertible securities, or other contracts to issue common
stock, were exercised or converted into common stock. Dilutive securities are included in the calculation of diluted earnings per common share using the
treasury stock method and the if-converted method in accordance with Accounting Standards Codification ("ASC") Topic 260, “Earnings per Share.”
Dilutive securities include convertible notes, options granted pursuant to the Company’s stock option plans and outstanding restricted stock units and
performance share units granted to employees and non-employee directors (see Note 10).
Weighted-average common shares outstanding—diluted is the same as weighted-average common shares outstanding—basic in periods when a
net loss is reported or in periods when anti-dilution occurs.
13
CALLAWAY GOLF CO / 10-Q / August 1, 2016 Powered by BamSEC.comPDF page 13

The following sets forth the intangible assets by major asset class (dollars in thousands):
June 30, 2016 December 31, 2015UsefulLife
(Years) GrossAccumulatedAmortization
Net BookValue Gross
AccumulatedAmortization
Net BookValue
Non-Amortizing:
Trade name, trademark and trade dress and
other NA $ 88,590 $ — $ 88,590 $ 88,590 $ — $ 88,590
Amortizing:
Patents 2-16 31,581 31,414 167 31,581 31,389 192
Developed technology and other 1-9 7,961 7,961 — 7,961 7,961 —
Total intangible assets $ 128,132 $ 39,375 $ 88,757 $ 128,132 $ 39,350 $ 88,782
Aggregate amortization expense on intangible assets was approximately $25,000 for each of the six months ended June 30, 2016 and 2015.
Amortization expense related to intangible assets at June 30, 2016 in each of the next five fiscal years and beyond is expected to be incurred as
follows (in thousands):
Remainder of 2016 $ 26
2017 51
2018 51
2019 39
$ 167
Note 6. Investments
Investment in Topgolf International, Inc.
The Company owns a minority interest in Topgolf International, Inc., doing business as the Topgolf Entertainment Group (“Topgolf”), the owner
and operator of Topgolf entertainment centers, which ownership consists of common stock and various classes of preferred stock. In connection with
this investment, the Company has a preferred partner agreement with Topgolf in which the Company has preferred signage rights, rights as the preferred
supplier of golf products used or offered for use at Topgolf facilities at prices no less than those paid by the Company’s customers, preferred retail
positioning in the Topgolf retail stores, access to consumer information obtained by Topgolf, and other rights incidental to those listed above.
In January 2016, the Company invested an additional $1,260,000 in preferred shares of Topgolf. In February 2016, Topgolf announced that
Providence Equity Partners L.L.C. (“Providence Equity”) made a significant minority preferred stock investment in Topgolf (the “Providence Equity
Investment”). In connection with the Providence Equity Investment, Topgolf used a portion of the proceeds it received to repurchase shares from its
existing shareholders, other than Providence Equity (the “Topgolf Repurchase Program”). In April 2016, the Company sold approximately 10.0% or
$5,767,000 (on a cost basis) of its preferred shares in Topgolf under the Topgolf Repurchase Program for $23,429,000, which reduced the Company's
total investment to $48,808,000, and the Company's ownership percentage to approximately 15.0%. In connection with this sale, during the three
months ended June 30, 2016, the Company recognized a gain of approximately $17,662,000 in other income (expense).
Based upon the transactions described above, the Company estimates that the fair value of its Topgolf shares was within the range of
$207,000,000 to $217,000,000 immediately after the Providence Equity Investment and the Topgolf Repurchase Program. This fair value estimate is
based solely upon the valuations and pricing in the Providence Equity Investment and related Topgolf Repurchase Program. No discount has been
attributed to this fair value estimate for any preferred terms, including any shareholder, governance or other rights provided to Providence Equity
that may differ from those held by the Company, and no premium has been attributed to this fair value estimate for any incremental value that might
otherwise apply in the case of a change in control transaction (e.g. an initial public offering or sale of Topgolf). The Company’s Topgolf shares are
illiquid and there is no assurance that the Company could sell its shares for the estimated fair value, or at all. Further, this estimate represents the fair
value as of a point in time immediately after the Providence Equity Investment. The future value of the Company’s shares may differ materially from
the estimated fair value. The current or future fair value will be affected by many factors, including the availability of interested
15
CALLAWAY GOLF CO / 10-Q / August 1, 2016 Powered by BamSEC.comPDF page 15
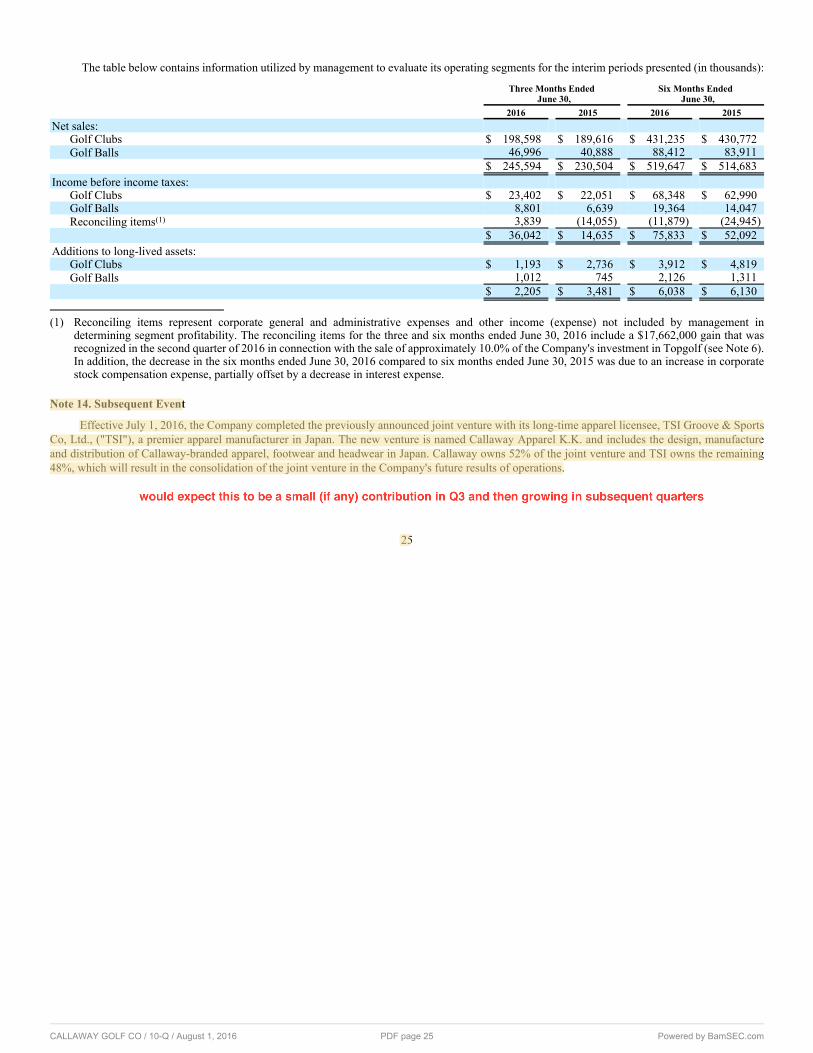
The table below contains information utilized by management to evaluate its operating segments for the interim periods presented (in thousands):
Three Months EndedJune 30,
Six Months EndedJune 30,
2016 2015 2016 2015Net sales:
Golf Clubs $ 198,598 $ 189,616 $ 431,235 $ 430,772
Golf Balls 46,996 40,888 88,412 83,911
$ 245,594 $ 230,504 $ 519,647 $ 514,683
Income before income taxes:
Golf Clubs $ 23,402 $ 22,051 $ 68,348 $ 62,990
Golf Balls 8,801 6,639 19,364 14,047
Reconciling items(1) 3,839 (14,055) (11,879) (24,945)
$ 36,042 $ 14,635 $ 75,833 $ 52,092
Additions to long-lived assets:
Golf Clubs $ 1,193 $ 2,736 $ 3,912 $ 4,819
Golf Balls 1,012 745 2,126 1,311
$ 2,205 $ 3,481 $ 6,038 $ 6,130
(1) Reconciling items represent corporate general and administrative expenses and other income (expense) not included by management in
determining segment profitability. The reconciling items for the three and six months ended June 30, 2016 include a $17,662,000 gain that was
recognized in the second quarter of 2016 in connection with the sale of approximately 10.0% of the Company's investment in Topgolf (see Note 6).
In addition, the decrease in the six months ended June 30, 2016 compared to six months ended June 30, 2015 was due to an increase in corporate
stock compensation expense, partially offset by a decrease in interest expense.
Note 14. Subsequent Event
Effective July 1, 2016, the Company completed the previously announced joint venture with its long-time apparel licensee, TSI Groove & Sports
Co, Ltd., ("TSI"), a premier apparel manufacturer in Japan. The new venture is named Callaway Apparel K.K. and includes the design, manufacture
and distribution of Callaway-branded apparel, footwear and headwear in Japan. Callaway owns 52% of the joint venture and TSI owns the remaining
48%, which will result in the consolidation of the joint venture in the Company's future results of operations.
25
CALLAWAY GOLF CO / 10-Q / August 1, 2016 Powered by BamSEC.comPDF page 25
Item 2. Management’s Discussion and Analysis of Financial Condition and Results of Operations
The following discussion should be read in conjunction with the Consolidated Condensed Financial Statements and the related notes that appearelsewhere in this report. See also “Important Notice to Investors Regarding Forward-Looking Statements” on page 2 of this report.
Results of Operations
Overview of Business and Seasonality
Products. The Company designs, manufactures and sells high quality golf clubs, golf balls, golf bags and other golf-related accessories. The Company
designs its products to be technologically advanced and in this regard invests a considerable amount in research and development each year. The
Company’s golf products are designed for golfers of all skill levels, both amateur and professional.
Operating Segments. The Company has two reportable operating segments that are organized on the basis of products, namely the golf clubs segment
and golf balls segment. The golf clubs segment consists of Callaway Golf woods, hybrids, irons and wedges and Odyssey putters. This segment also
includes other golf-related accessories described above and royalties from licensing of the Company’s trademarks and service marks as well as sales
of pre-owned golf clubs. The golf balls segment consists of Callaway Golf and Strata balls that are designed, manufactured and sold by the Company.
As discussed in Note 13 “Segment Information” to the Notes to Consolidated Condensed Financial Statements in Part I, Item 1 of this Form 10-Q, the
Company’s operating segments exclude a significant amount of corporate general administrative expenses and other income (expense) not utilized by
management in determining segment profitability.
Cost of Sales. The Company’s cost of sales is comprised primarily of material and component costs, distribution and warehousing costs, and overhead.
Due to the recent actions taken to improve manufacturing efficiencies, a greater percentage of the Company's manufacturing costs became variable in
nature and will fluctuate with sales volumes. With respect to the Company's operating segments, variable costs for golf clubs represent approximately
85% to 95% of cost of sales, and for golf balls, approximately 75% to 85%. Of these variable costs, material and component costs represent
approximately 85% to 95% for golf clubs and approximately 75% to 85% for golf balls. On a consolidated basis, over 85% of total cost of sales is
variable in nature, and of this amount, over 85% is comprised of material and component costs. Generally, the relative significance of the components
of cost of sales does not vary materially from these percentages from period to period. See "Golf Clubs and Golf Balls Segments Results for the Three
Months Ended June 30, 2016 and 2015—Segment Profitability," and "Golf Clubs and Golf Balls Segments Results for the Six Months Ended June 30,
2016 and 2015—Segment Profitability" below for further discussion of gross margins.
Seasonality. In most of the regions where the Company does business, the game of golf is played primarily on a seasonal basis. Weather conditions
generally restrict golf from being played year-round, except in a few markets, with many of the Company’s on-course customers closing for the cold
weather months. The Company’s business is therefore subject to seasonal fluctuations. In general, during the first quarter, the Company begins selling
its products into the golf retail channel for the new golf season. This initial sell-in generally continues into the second quarter. The Company’s second-
quarter sales are significantly affected by the amount of reorder business of the products sold during the first quarter. The Company’s third-quarter sales
are generally dependent on reorder business but are generally less than the second quarter as many retailers begin decreasing their inventory levels in
anticipation of the end of the golf season. The Company’s fourth-quarter sales are generally less than the other quarters due to the end of the golf season
in many of the Company’s key regions. However, fourth-quarter sales can be affected from time to time by the early launch of product introductions
related to the new golf season of the subsequent year. This seasonality, and therefore quarter-to-quarter fluctuations, can be affected by many factors,
including the timing of new product introductions as well as weather conditions. In general, because of this seasonality, a majority of the Company’s
sales and most, if not all, of its profitability occurs during the first half of the year.
Foreign Currency. A significant portion of the Company’s business is conducted outside of the United States in currencies other than the U.S. dollar.
As a result, changes in foreign currency rates can have a significant effect on the Company’s financial results. The Company enters into foreign currency
forward contracts to mitigate the effects of changes in foreign currency rates. While these foreign currency forward contracts can mitigate the effects
of changes in foreign currency rates, they do not eliminate those effects, which can be significant. These effects include (i) the translation of results
denominated in foreign currency into U.S. dollars for reporting purposes, (ii) the mark-to-market adjustments of certain intercompany balance sheet
accounts denominated in foreign currencies and (iii) the mark-to-market adjustments on the Company’s foreign currency forward contracts. In general,
the Company’s overall financial results are affected positively by a weaker U.S. dollar and are affected negatively by a stronger
26
CALLAWAY GOLF CO / 10-Q / August 1, 2016 Powered by BamSEC.comPDF page 26

U.S. dollar as compared to the foreign currencies in which the Company conducts its business. For six months ended June 30, 2016, the Company’s
reported net sales in regions outside the United States were minimally affected by the translation of foreign currency sales into U.S. dollars based on
2015 exchange rates.
Executive Summary
The strength of the Company’s 2016 product line and its continuing brand momentum allowed the Company to overcome softer than anticipated
market conditions during the second quarter and first half of 2016. As a result, the Company's net sales for the second quarter of 2016 increased to
$245.6 million from $230.5 million in the second quarter of 2015. This $15.1 million (6.5%) increase was led by an increase in net sales across all
major product categories, including woods, irons, putters and balls, and in every major region where the Company conducts its business, including the
United States, Europe, Japan and the Rest of Asia. Net sales for the first six months of 2016 increased to $519.6 million compared to $514.7 million for
the same period in 2015. This $4.9 million (1.0%) increase resulted from an increase in average selling prices across most product categories, partially
offset by a decline in sales volumes in the irons, fairway woods and hybrids categories due to a planned shift in launch timing including the extension
of product life cycles within the irons category.
The Company’s gross margin improved by 90 basis points to 45.0% for the second quarter of 2016, and 230 basis points to 46.8% for the first
six months of 2016, both as compared to the same periods in 2015. This improvement primarily resulted from operational efficiencies related to the
Company's continuous efforts to improve its manufacturing and supply chain functions, combined with more favorable product pricing. This was offset
by an increase in promotional activity compared to the same periods in 2015.
Operating expenses increased $6.7 million or 8.0% and were slightly higher as a percentage of net sales in the second quarter of 2016 compared
to the second quarter of 2015. This increase was due to a planned shift in the timing of marketing expenses from the first quarter of 2016 to the second
quarter of 2016 in order to better align marketing campaigns with the golf season, as well as a planned increase in marketing spending in general.
Operating expenses increased $3.4 million or 2.0% and were flat as a percentage of net sales for the first six months of 2016 compared to the same
period in 2015.
Interest expense decreased $1.5 million to $0.7 million for the second quarter of 2016 compared to the second quarter of 2015, and $2.8 million
to $1.5 million for the first six months of 2016 compared to the same period in 2015 due to the retirement of the Company's convertible senior notes
during the second half of 2015.
During the second quarter of 2016, the Company completed the sale of a small portion of its preferred shares of Topgolf International, Inc., doing
business as Topgolf Entertainment Group ("Topgolf") for total proceeds of $23.4 million, and recognized a gain of $17.7 million. Immediately after the
sale, the Company retained a 15% ownership of Topgolf.
Other income/expense for the second quarter of 2016 was flat compared to the second quarter of 2015, and decreased $7.6 million to expense of
$7.1 million for the first six months of 2016 compared to the same period in 2015 primarily due to an increase in net losses from the Company's foreign
currency hedging contracts.
Net income increased $21.3 million or 166.1% to $34.1 million in the second quarter of 2016, and diluted earnings per share increased by $0.21
(140%) to $0.36. Net income increased $23.9 million or 49.1% to $72.5 million in the first six months of 2016, and diluted earnings per share increased
$0.22 (41%) to $0.76. Net income and diluted earnings per share for the second quarter and first six months of 2016 include a gain of $17.7 million
($0.18 per share) from the sale of the Company’s investment in Topgolf as discussed above. In addition, the increase in net income and diluted earnings
per share in the second quarter and first six months of 2016 was due to the continued improvement in gross margin as discussed above, partially offset
by the increase in operating expenses.
In July 2016, the Company finalized an agreement to form a joint venture with its long-time apparel licensee, TSI Groove & Sports Co, Ltd.,
("TSI"), a premier apparel manufacturer in Japan. The venture is named Callaway Apparel K.K. and includes the design, manufacture, and distribution
of Callaway branded apparel, footwear and headwear in Japan. Callaway owns 52% of the joint venture and TSI owns the remaining 48%, which will
result in the consolidation of the joint venture in the Company's future results of operations. Management believes this partnership with TSI will allow
the two companies to jointly invest and grow the business going forward.
27
CALLAWAY GOLF CO / 10-Q / August 1, 2016 Powered by BamSEC.comPDF page 27

Three-Month Periods Ended June 30, 2016 and 2015
Net sales for the second quarter of 2016 increased by $15.1 million to $245.6 million compared to $230.5 million in the second quarter of
2015. Despite softer than anticipated market conditions the Company improved its market share due to the continued strength of its brand, resulting in
increases in sales across all product categories and all of the major regions that the Company conducts its business.
The Company’s net sales by operating segment are presented below (dollars in millions):
Three Months EndedJune 30, Growth
2016 2015 Dollars PercentNet sales:
Golf clubs $ 198.6 $ 189.6 $ 9.0 4.7%
Golf balls 47.0 40.9 6.1 14.9%
$ 245.6 $ 230.5 $ 15.1 6.6%
For further discussion of each operating segment’s results, see "Golf Clubs and Golf Balls Segments Results for the Three Months Ended
June 30, 2016 and 2015" below.
Net sales information by region is summarized as follows (dollars in millions):
Three Months EndedJune 30, Growth/(Decline)
2016 2015 Dollars PercentNet sales:
United States $ 127.2 $ 122.0 $ 5.2 4.3 %
Europe 36.9 35.2 1.7 4.8 %
Japan 40.6 32.4 8.2 25.3 %
Rest of Asia 20.1 19.0 1.1 5.8 %
Other countries 20.8 21.9 (1.1) (5.0)%
$ 245.6 $ 230.5 $ 15.1 6.6 %
Net sales in the United States increased $5.2 million (4.3%) to $127.2 million during the second quarter of 2016 compared to $122.0 million in
the second quarter of 2015. The Company’s sales in regions outside of the United States increased $9.9 million (9.1%) to $118.4 million for the second
quarter of 2016 compared to $108.5 million in the same quarter of 2015. The increase in sales both domestically and in the Company's foreign regions
is primarily due to the continued strength of the brand resulting in an increase in average selling prices across almost all product categories combined
with the favorable impact of changes in foreign currency rates in Japan.
Gross profit increased $8.9 million (8.8%) to $110.6 million for the second quarter of 2016 compared to $101.7 million in the second quarter
of 2015. Gross profit as a percentage of net sales (“gross margin”) increased to 45.0% in the second quarter of 2016 compared to 44.1% in the second
quarter of 2015. The increase in gross margin was primarily due to a reduction in costs driven primarily by favorable sourcing of raw materials,
combined with improved operational efficiencies and an increase in average selling prices. These increases were partially offset by an increase in
promotional activity period over period. See "Results of Operations—Overview of Business and Seasonality—Cost of Sales" above and "Golf Clubs
and Golf Balls Segments Results for the Three Months Ended June 30, 2016 and 2015—Segment Profitability" below for further discussion of gross
margin.
Selling expenses increased by $4.4 million to $64.4 million (26.2% of net sales) in the second quarter of 2016 compared to $60.0 million (26.0%
of net sales) in the second quarter of 2015. This increase was primarily due to a $3.3 million increase in marketing and tour expenses primarily due to
a shift in timing in marketing spend as well as a planned increase period over period.
General and administrative expenses increased by $1.6 million to $17.1 million (7.0% of net sales) in the second quarter of 2016 compared to
$15.5 million (6.7% of net sales) in the second quarter of 2015. This increase resulted primarily from a $0.9 million increase in stock compensation
expense, which was due to the reversal of expense in the second quarter of 2015 for awards subject to mark-to-market adjustments.
28
CALLAWAY GOLF CO / 10-Q / August 1, 2016 Powered by BamSEC.comPDF page 28

Research and development expenses increased by $0.7 million to $8.3 million (3.4% of net sales) in the second quarter of 2016 compared to $7.6
million (3.3% of net sales) in the second quarter of 2015.
Interest expense decreased by $1.5 million to $0.7 million during the second quarter of 2016 compared to $2.2 million in the second quarter of
2015 due to the savings realized in connection with the retirement of the Company's convertible notes into shares of common stock during the second
half of 2015 (see Note 2 "Financing Arrangements" to the Notes to Consolidated Condensed Financial Statements in Part 1, Item 1 of this Form 10-Q).
During the second quarter of 2016, the Company sold approximately 10.0% of its preferred shares in Topgolf for $23.4 million and recognized
a $17.7 million gain. See Note 6 “Investments” to the Notes to Consolidated Condensed Financial Statements included in Part I, Item 1, of this Form
10-Q.
Other income/expense, net increased slightly to other expense of $2.1 million in the second quarter of 2016 compared to other expense of $2.0
million in the second quarter of 2015.
The Company’s provision for income taxes increased slightly to $1.9 million in the second quarter of 2016, compared to $1.8 million in the
second quarter of 2015. Due to the impact of the Company’s valuation allowance against its U.S. deferred tax assets, the Company’s income tax
provision for the second quarter of 2016 and 2015 was primarily correlated to the pre-tax income of the Company's foreign subsidiaries. The valuation
allowance would be reversed once the Company demonstrates sufficient positive evidence that it is more likely than not that the Company will be able
to realize its deferred tax assets. Such evidence includes a sustained return to profitability in the U.S. business. The Company’s U.S. business was
profitable in 2015 and the first half of 2016. If this trend continues, the Company would be able to reverse all or a significant portion of the valuation
allowance. If the Company were to reverse the valuation allowance, the Company would realize a significant one-time, non-cash tax benefit in the
period of reversal. Prospectively, the Company would then report an effective U.S. income tax rate on a consolidated basis that is closer to its statutory
rates.
Net income for the second quarter of 2016 increased $21.3 million to $34.1 million compared to $12.8 million in the second quarter of 2015.
Diluted earnings per share increased to $0.36 in the second quarter of 2016 compared to $0.15 in the second quarter of 2015. Net income for the second
quarter of 2016 includes a $17.7 million ($0.18 per share) gain, as discussed above, from the sale of approximately 10% of the Company's investment
in Topgolf.
Golf Clubs and Golf Balls Segments Results for the Three Months Ended June 30, 2016 and 2015
Golf Clubs SegmentGolf club sales increased $9.0 million (4.7%) to $198.6 million in the second quarter of 2016 compared to $189.6 million in the second quarter
of 2015. This increase was primarily due to the continued success of the Company's brand resulting in increased sales across all product categories. Net
sales by product category is summarized as follows (dollars in millions):
Three Months EndedJune 30, Growth
2016 2015 Dollars PercentNet sales:
Woods $ 50.5 $ 49.4 $ 1.1 2.2%
Irons 63.4 59.3 4.1 6.9%
Putters 25.0 24.4 0.6 2.5%
Accessories and other 59.7 56.5 3.2 5.7%
$ 198.6 $ 189.6 $ 9.0 4.7%
The $1.1 million (2.2%) increase in net sales of woods to $50.5 million for the quarter ended June 30, 2016 compared to $49.4 million in the
comparable period in 2015 was primarily due to an increase in average selling prices partially offset by a decline in sales volumes. The increase in
average selling prices was primarily due to the success of the Company's XR 16 and Great Big Bertha drivers, which were launched at a higher selling
price than their predecessors in the prior year. The decline in sales volumes was primarily due to a shift in launch timing resulting in fewer woods
products launched during the first half of 2016 compared to the same period in the prior year, combined with the launch of the Company's XR O/S
hybrids which were a smaller line extension relative to the prior year full-line launch of XR hybrids in 2015.
29
CALLAWAY GOLF CO / 10-Q / August 1, 2016 Powered by BamSEC.comPDF page 29
Net sales of irons increased $4.1 million (6.9%) to $63.4 million for the quarter ended June 30, 2016 compared to $59.3 million in the same
period in the prior year. This was due to an improvement in both sales volumes as well as average selling prices. The increase in sales volumes was
primarily due to the year over year improvement in market share within the irons category. The increase in average selling prices was due to the success
of the current year APEX irons with no comparable premium irons launch during the same period in 2015, combined with the continued success of the
MD3 Milled wedges, which have a higher average selling price compared to the Mack Daddy 2 wedges, which were in the second year of their product
life cycle in 2015. This was partially offset by an increase in promotional expense during the second quarter of 2016 compared to the second quarter of
2015.
Net sales of putters increased $0.6 million (2.5%) to $25.0 million for the quarter ended June 30, 2016 compared to $24.4 million in the same
period in the prior year due to an increase in average selling prices with relatively flat sales volumes. The increase in average selling prices was
primarily due to a favorable shift in sales mix due to the current quarter limited launches of the Company's more premium Milled Collection RSX and
Highway 101 putters.
Net sales of accessories and other increased $3.2 million (5.7%) to $59.7 million for the quarter ended June 30, 2016 compared to $56.5 million
in the same period in the prior year, primarily due to an increase in sales of pre-owned products as well as sale of packaged sets and other accessories.
This was partially offset by a decline in sales of golf bags and footwear.
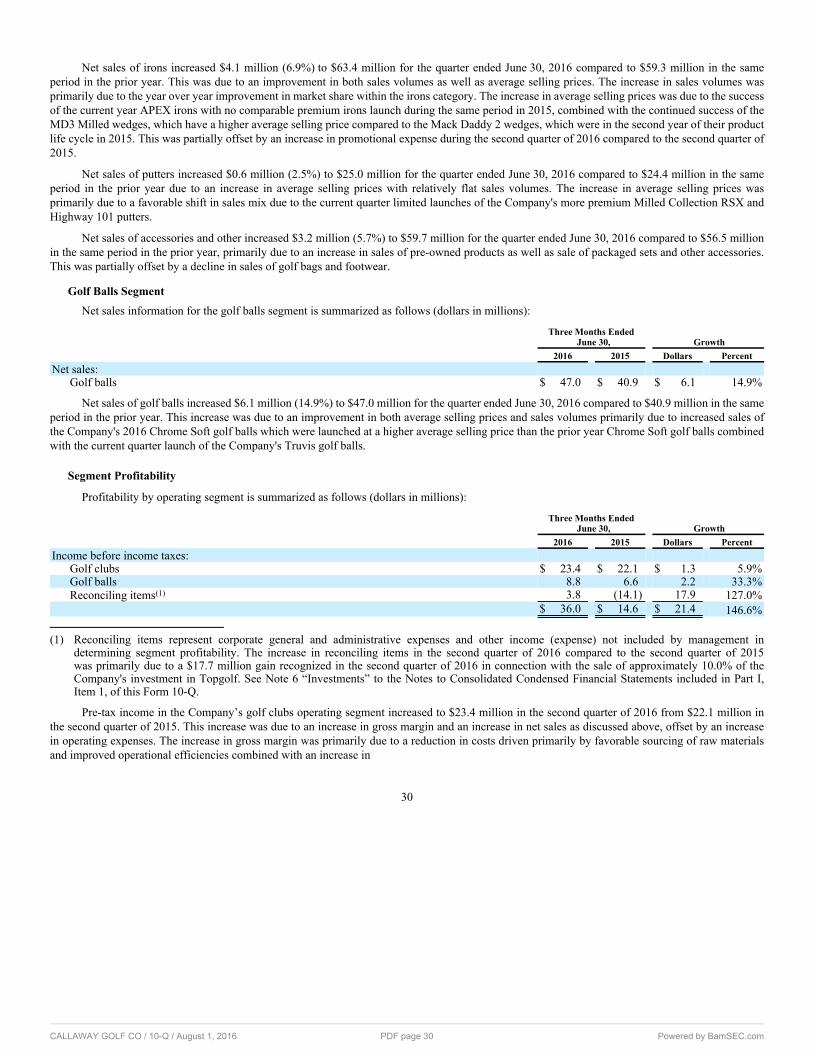
Golf Balls SegmentNet sales information for the golf balls segment is summarized as follows (dollars in millions):
Three Months EndedJune 30, Growth
2016 2015 Dollars PercentNet sales:
Golf balls $ 47.0 $ 40.9 $ 6.1 14.9%
Net sales of golf balls increased $6.1 million (14.9%) to $47.0 million for the quarter ended June 30, 2016 compared to $40.9 million in the same
period in the prior year. This increase was due to an improvement in both average selling prices and sales volumes primarily due to increased sales of
the Company's 2016 Chrome Soft golf balls which were launched at a higher average selling price than the prior year Chrome Soft golf balls combined
with the current quarter launch of the Company's Truvis golf balls.
Segment Profitability
Profitability by operating segment is summarized as follows (dollars in millions):
Three Months EndedJune 30, Growth
2016 2015 Dollars PercentIncome before income taxes:
Golf clubs $ 23.4 $ 22.1 $ 1.3 5.9%
Golf balls 8.8 6.6 2.2 33.3%
Reconciling items(1) 3.8 (14.1) 17.9 127.0%
$ 36.0 $ 14.6 $ 21.4 146.6%
(1) Reconciling items represent corporate general and administrative expenses and other income (expense) not included by management in
determining segment profitability. The increase in reconciling items in the second quarter of 2016 compared to the second quarter of 2015
was primarily due to a $17.7 million gain recognized in the second quarter of 2016 in connection with the sale of approximately 10.0% of the
Company's investment in Topgolf. See Note 6 “Investments” to the Notes to Consolidated Condensed Financial Statements included in Part I,
Item 1, of this Form 10-Q.
Pre-tax income in the Company’s golf clubs operating segment increased to $23.4 million in the second quarter of 2016 from $22.1 million in
the second quarter of 2015. This increase was due to an increase in gross margin and an increase in net sales as discussed above, offset by an increase
in operating expenses. The increase in gross margin was primarily due to a reduction in costs driven primarily by favorable sourcing of raw materials
and improved operational efficiencies combined with an increase in
30
CALLAWAY GOLF CO / 10-Q / August 1, 2016 Powered by BamSEC.comPDF page 30

average selling prices across most golf club product categories, partially offset by an increase in promotional activity period over period. The increase
in operating expenses was primarily due to a shift in timing in marketing spend as well as a planned increase period over period.
Pre-tax income in the Company’s golf balls operating segment increased to $8.8 million in the second quarter of 2016 from $6.6 million in the
second quarter of 2015. This increase was primarily due to an increase in net sales as discussed above, combined with an increase in gross margin,
offset by an increase in operating expenses. The increase in gross margin was primarily due to (i) a reduction in costs driven primarily by favorable
sourcing of raw materials, and (ii) an increase in the average selling price of Chrome Soft golf balls launched in 2016 compared to the Chrome Soft
golf balls launched in 2015. The increase in operating expenses was primarily due to a shift in timing in marketing spend as well as a planned increase
period over period.
Six-Month Periods Ended June 30, 2016 and 2015
Net sales for the six months ended June 30, 2016 increased $4.9 million to $519.6 million compared to $514.7 million for the six months ended
June 30, 2015. Despite softer than anticipated market conditions, the Company improved its market share due to the continued strength of its brand,
resulting in increased sales in both the Company's golf club and golf ball operating segments. Net sales were favorably impacted by an increase in
average selling prices across most product categories which was partially offset by a decline in sales volumes in the irons, fairway woods and hybrids
categories due to a planned shift in launch timing including the extension of product life cycles within the irons category.
The Company’s net sales by operating segment are presented below (dollars in millions):
Six Months EndedJune 30, Growth
2016 2015 Dollars PercentNet sales:
Golf clubs $ 431.2 $ 430.8 $ 0.4 0.1%
Golf balls 88.4 83.9 4.5 5.4%
$ 519.6 $ 514.7 $ 4.9 1.0%
For further discussion of each operating segment’s results, see “Golf Clubs and Golf Balls Segments Results for the Six Months Ended June 30,
2016 and 2015” below.
Net sales information by region is summarized as follows (dollars in millions):
Six Months EndedJune 30, Growth/(Decline)
2016 2015 Dollars PercentNet sales:
United States $ 287.3 $ 290.6 $ (3.3) (1.1)%
Europe 74.8 76.9 (2.1) (2.7)%
Japan 79.8 69.6 10.2 14.7 %
Rest of Asia 35.9 35.5 0.4 1.1 %
Other countries 41.8 42.1 (0.3) (0.7)%
$ 519.6 $ 514.7 $ 4.9 1.0 %
Net sales in the United States decreased $3.3 million (1.1%) to $287.3 million during the six months ended June 30, 2016 compared to $290.6
million for the six months ended June 30, 2015 primarily due to a decline in sales volumes in the irons and fairway wood and hybrids categories due to
a planned shift in launch timing including the extension of product life cycles within the irons category. The Company’s sales in regions outside of the
United States increased $8.2 million (3.7%) to $232.3 million for the six months ended June 30, 2016 compared to $224.1 million for the six months
ended June 30, 2015. This increase was primarily due to an increase in sales of drivers and golf balls in Japan.
31
CALLAWAY GOLF CO / 10-Q / August 1, 2016 Powered by BamSEC.comPDF page 31
Gross profit increased $14.1 million (6.1%) to $243.0 million for the six months ended June 30, 2016 compared to $229.0 million in the same
period of 2015, and gross margin increased to 46.8% in the first six months of 2016 compared to 44.5% for the same period in 2015. This increase in
gross margin was primarily due to a reduction in costs driven primarily by favorable sourcing of raw materials, combined with improved operational
efficiencies, and an increase in average selling prices. These increases were partially offset by an increase in promotional activity period over period.
See "Results of Operations—Overview of Business and Seasonality—Cost of Sales" above and "Golf Clubs and Golf Balls Segments Results for the
Six Months Ended June 30, 2016 and 2015—Segment Profitability" below for further discussion of gross margin.
Selling expenses increased by $1.4 million to $127.7 million (24.6% of net sales) during the six months ended June 30, 2016 compared to $126.3
million (24.5% of net sales) in the comparable period of 2015. This increase was primarily due to a $0.7 million increase in accrued employee incentive
compensation and a $0.5 million increase in marketing and tour expenses primarily due to a planned increase in marketing spend period over period.
General and administrative expenses increased by $1.0 million to $32.6 million (6.3% of net sales) during the six months ended June 30, 2016
compared to $31.6 million (6.1% of net sales) in the comparable period of 2015. This increase was primarily due to increases of $1.2 million and
$0.7 million in legal expenses and bad debt expense, respectively, due to a bad debt recovery recognized in the first quarter of 2015, in addition to an
increase of $0.8 million in professional fees. These increases were partially offset by a $1.7 million decrease in stock compensation expense as a result
of the payout of cash-settled stock awards period over period.
Research and development expenses increased by $1.0 million to $16.5 million (3.2% of net sales) during the six months ended June 30, 2016
compared to $15.5 million (3.0% of net sales) in the comparable period of 2015.
Interest expense decreased by $2.8 million to $1.5 million during the six months ended June 30, 2016 compared to $4.3 million in the comparable
period of 2015 due to the savings realized in connection with the retirement of the Company's convertible notes into shares of common stock during
the second half of 2015 (see Note 6 "Investments" to the Notes to Consolidated Condensed Financial Statements in Part 1, Item 1 of this Form 10-Q).
During the second quarter of 2016, the Company sold approximately 10.0% of its preferred shares in Topgolf for $23.4 million and recognized
a $17.7 million gain. See Note 6 “Investments” to the Notes to Consolidated Condensed Financial Statements included in Part I, Item 1, of this Form
10-Q.
Other income/expense, net decreased to other expense of $7.1 million during the six months ended June 30, 2016 compared to other income of
$0.5 million in the comparable period of 2015. This $7.6 million decrease was due to an increase in net losses from non-designated foreign currency
hedging contracts.
The Company’s provision for income taxes decreased slightly to $3.3 million for the six months ended June 30, 2016, compared to $3.5 million
in the comparable period of 2015. Due to the effects of the Company’s valuation allowance against its U.S. deferred tax assets, the Company’s income
tax provision for 2016 and 2015 is correlated to the pre-tax income of the Company's foreign subsidiaries. The valuation allowance would be reversed
once the Company demonstrates sufficient positive evidence that it is more likely than not that the Company will be able to realize its deferred tax
assets. Such evidence includes a sustained return to profitability in the U.S. business. The Company’s U.S. business was profitable in 2015 and the first
half of 2016. If this trend continues, the Company would be able to reverse all or a significant portion of the valuation allowance. If the Company were
to reverse the valuation allowance, the Company would realize a significant one-time, non-cash tax benefit in the period of reversal. Prospectively, the
Company would then report an effective U.S. income tax rate on a consolidated basis that is closer to its statutory rates.
Net income for the six months ended June 30, 2016 increased by $23.9 million to $72.5 million compared to $48.6 million in the comparable
period of 2015. Diluted earnings per share increased to $0.76 in the first six months of 2016 compared to $0.54 in the same period in 2015. Net income
in the first half of 2016 includes a $17.7 million ($0.18 per share) gain, as discussed above, from the sale of approximately 10% of the Company's
investment in Topgolf.
Golf Clubs and Golf Balls Segments Results for the Six Months Ended June 30, 2016 and 2015
Golf Clubs Segment
Golf club sales increased $0.4 million to $431.2 million in the first six months of 2016 compared to the same period in 2015 primarily due to the
continued success of the Company's brand resulting in increased average selling prices across all product
32
CALLAWAY GOLF CO / 10-Q / August 1, 2016 Powered by BamSEC.comPDF page 32

categories, partially offset by a decline in sales volumes in the irons and fairway wood and hybrids categories due to a planned shift in launch timing
including the extension of product life cycles within the irons category.
Net sales information by product category is summarized as follows (dollars in millions):
Six Months EndedJune 30, Growth/(Decline)
2016 2015 Dollars PercentNet sales:
Woods $ 136.5 $ 138.9 $ (2.4) (1.7)%
Irons 122.6 120.8 1.8 1.5 %
Putters 54.8 55.4 (0.6) (1.1)%
Accessories and other 117.3 115.7 1.6 1.4 %
$ 431.2 $ 430.8 $ 0.4 0.1 %
Net sales of woods decreased $2.4 million (1.7%) to $136.5 million for the six months ended June 30, 2016 compared to the same period in the
prior year. This decrease resulted from a decline in sales volume partially offset by an increase in average selling prices. The decrease in sales volumes
was primarily due to a shift in launch timing resulting in fewer woods products launched during the first half of 2016 compared to the prior year. The
increase in average selling prices was primarily due to the success of the current year XR 16 drivers, which were launched at a higher selling price than
their predecessor XR drivers, combined with the continued success of the Great Big Bertha drivers which had a higher average selling price than the
Company's premium drivers launched in the prior year.
Net sales of irons increased $1.8 million (1.5%) to $122.6 million for the six months ended June 30, 2016 compared to the same period in the
prior year. This was due to an increase in average selling prices partially offset by a decline in sales volumes. The increase in average selling prices
was due to the success of the more premium APEX irons with no comparable launch during the first half of 2015, combined with the continued success
of the MD3 Milled wedges, which have a higher average selling price compared to the Mack Daddy 2 wedges, which were in the second year of their
product life cycle in 2015. The decline in sales volumes was primarily due to a strategic shift in launch timing including the extension of product
life cycles. In 2016, the Company launched its XR O/S irons which were a smaller line extension compared to the prior year, full-line launch of the
Company's XR irons.
Net sales of putters decreased $0.6 million (1.1%) to $54.8 million for the six months ended June 30, 2016 compared to the same period in the
prior year due to a decline in sales volumes partially offset by an increase in average selling prices. The decline in sales volume was primarily due to
the 2016 launch of the Company's White Hot RX putters which were a smaller launch compared to the full line of Odyssey Works putters launched in
the prior year. The increase in average selling prices was primarily due to the limited offerings of the Company's Toe Up putters, which had a higher
average selling price than the Company's core putters offered in the prior year, combined with the launch of the more premium Milled Collection RSX
and Highway 101 putters during the current year.
Net sales of accessories and other products increased $1.6 million (1.4%) to $117.3 million for the six months ended June 30, 2016 compared
to the same period in the prior year. This increase was driven by an increase in sales of pre-owned products, partially offset by a decrease in sales of
footwear, GPS devices and golf bags.
Golf Balls Segment
Net sales information for the golf balls segment is summarized as follows (dollars in millions):
Six Months EndedJune 30, Growth
2016 2015 Dollars PercentNet sales:
Golf balls $ 88.4 $ 83.9 $ 4.5 5.4%
Net sales of golf balls increased $4.5 million (5.4%) to $88.4 million for the six months ended June 30, 2016 compared to $83.9 million in the
same period in the prior year due to an increase in average selling prices partially offset by a decline in sales volumes. The increase in average selling
prices was primarily due to an increase in the sales price of the Company's 2016 Chrome
33
CALLAWAY GOLF CO / 10-Q / August 1, 2016 Powered by BamSEC.comPDF page 33

Soft golf balls combined with sales of the Company's Truvis golf balls during the current year. The decline in sales volume was primarily due to a
decline in sales of the Company's SMU balls during the first six months of 2016 compared to the same period in 2015.
Segment Profitability
Profitability by operating segment is summarized as follows (dollars in millions):
Six Months EndedJune 30, Growth
2016 2015 Dollars PercentIncome before income taxes:
Golf clubs $ 68.3 $ 63.0 $ 5.3 8.4%
Golf balls 19.4 14.0 5.4 38.6%
Reconciling items(1) (11.9) (24.9) 13.0 52.2%
$ 75.8 $ 52.1 $ 23.7 45.5%
(1) Reconciling items represent corporate general and administrative expenses and other income (expense) not included by management in
determining segment profitability. The increase in reconciling items in the first six of 2016 compared to the same period in the prior year was
primarily due to a $17.7 million gain recognized in the second quarter of 2016 in connection with the sale of approximately 10.0% of the
Company's investment in Topgolf, combined with an increase in corporate stock compensation expense, partially offset by a decrease in interest
expense.
Pre-tax income in the Company’s golf clubs operating segment increased to $68.3 million for the six months ended June 30, 2016 from $63.0
million for the comparable period in the prior year. This increase was due to an increase in gross margin and an increase in net sales as discussed above,
offset by an increase in operating expenses, which was primary due to the timing of marketing expenses. The increase in gross margin was primarily
due to (i) a reduction in costs driven primarily by the favorable sourcing of raw materials, combined with improved operational efficiencies resulting
from the favorable absorption of fixed charges; (ii) an increase in average selling prices across most golf club product categories. These increases were
partially offset by an increase in promotional activity period over period.
Pre-tax income in the Company’s golf balls operating segment increased to $19.4 million for the six months ended June 30, 2016 from $14.0
million for the comparable period in the prior year. This increase was primarily due to an increase in net sales as discussed above, combined with an
increase in gross margin. Operating expenses increased slightly period over period. The increase in gross margin was primarily due to (i) a reduction in
costs driven primarily by the favorable sourcing of raw materials, and (ii) an increase in the average selling price of Chrome Soft golf balls launched in
2016 compared to the Chrome Soft golf balls launched in 2015.
Financial Condition
The Company’s cash and cash equivalents decreased $17.8 million to $67.6 million at June 30, 2016 from $49.8 million at December 31, 2015.
Cash provided by operating activities improved to $17.8 million during the first six months of 2016 compared to cash used of $32.7 million during
the comparable period of 2015. This improvement was primarily due to the earlier timing of product launches in 2016 resulting in lower inventory
levels as of June 30, 2016 compared to June 30, 2015, combined with a decline in accounts receivable resulting from the earlier launch timing as
well as overall improvements in the Company's cash conversion cycle. During the six months ended June 30, 2016, the Company used its cash and
cash equivalents and proceeds of $23.4 million from the sale of investments in golf-related ventures, in addition cash from operating activities to pay
down its credit facilities as well as to fund $7.5 million in capital expenditures and $1.6 million in golf-related ventures. Management expects to fund
the Company’s future operations from current cash balances and cash provided by its operating activities combined with borrowings under its credit
facilities, as deemed necessary. See Note 2 "Financing Arrangements" to the Note to Consolidated Condensed Financial Statements in Part I, Item 1
and "Liquidity and Capital Resources" in Part I, Item 2 of this Form 10-Q for further information on the ABL Facility.
The Company’s accounts receivable balance fluctuates throughout the year as a result of the general seasonality of the Company’s business. The
Company’s accounts receivable balance will generally be at its highest during the first and second
34
CALLAWAY GOLF CO / 10-Q / August 1, 2016 Powered by BamSEC.comPDF page 34
quarters due to the seasonal peak in the golf season, and it will generally decline significantly during the third and fourth quarters as a result of an
increase in cash collections and lower sales. As of June 30, 2016, the Company’s net accounts receivable increased to $205.1 million from $115.6
million as of December 31, 2015. The increase in accounts receivable reflects the general seasonality of the business and was primarily attributable to
net sales of $245.6 million during the second quarter of 2016 compared to net sales of $153.3 million during the fourth quarter of 2015. The Company’s
net accounts receivable as of June 30, 2016 decreased by $15.3 million compared to the Company’s net accounts receivable as of June 30, 2015. This
decrease was primarily attributable to the timing of cash receipts due to the earlier timing of product launches in 2016 compared to 2015 combined with
an overall improvement in payment terms.
The Company’s inventory balance fluctuates throughout the year as a result of the general seasonality of the Company’s business and is also
affected by the timing of new product launches. Generally, the Company’s buildup of inventory levels begins during the fourth quarter and continues
heavily into the first quarter as well as into the beginning of the second quarter in order to meet demand during the height of the golf season. Inventory
levels start to decline toward the end of the second quarter and are at their lowest during the third quarter. Inventory levels are also impacted by
the timing of new product launches. The Company’s inventory decreased to $151.4 million as of June 30, 2016 compared to $208.9 million as of
December 31, 2015. This decrease was primarily due to improved inventory management combined with the general seasonality of the Company's
business. The Company’s inventory as of June 30, 2016 decreased by $20.0 million compared to the Company's inventory as of June 30, 2015 primarily
due to the earlier timing of product launches in 2016 compared to 2015 combined with improved inventory management period over period.
Liquidity and Capital Resources
The information set forth in Note 2 “Financing Arrangements” to the Notes to Consolidated Condensed Financial Statements included in Part
I, Item 1, of this Form 10-Q is incorporated herein by this reference.
Liquidity
The Company’s principal sources of liquidity consist of its existing cash balances, funds expected to be generated from operations and its credit
facilities. Based upon the Company’s current cash balances, its estimates of funds expected to be generated from operations in 2016, and current and
projected availability under its credit facilities, the Company believes that it will be able to finance current and planned operating requirements, capital
expenditures, contractual obligations and commercial commitments for at least the next 12 months.
The Company’s ability to generate sufficient positive cash flows from operations is subject to many risks and uncertainties, including future
economic trends and conditions, demand for the Company’s products, foreign currency exchange rates, and other risks and uncertainties applicable
to the Company and its business (see “Risk Factors” contained in Part I, Item 1A of the Company's Annual Report on Form 10-K for the year ended
December 31, 2015). If the Company is unable to generate sufficient cash flows to fund its business due to a decline in sales or otherwise and is unable
to reduce its manufacturing costs and operating expenses to offset such decline, the Company will need to increase its reliance on its credit facilities
for needed liquidity. If the credit facilities are not then available or sufficient and the Company could not secure alternative financing arrangements, the
Company’s future operations would be materially adversely affected.
To further enhance its liquidity position and make strategic investments, the Company may obtain additional financing, which could consist of
equity or debt financing from public and/or private credit and capital markets. In 2014, the Company filed a universal shelf registration statement with
the Commission for the future sale of up to $200.0 million of debt securities, common stock, preferred stock, depositary shares, warrants, rights, stock
purchase contracts, stock purchase units and units. The securities may be offered from time to time, separately or together, directly by the Company or
through underwriters, dealers or agents at amounts, prices, interest rates and other terms to be determined at the time of the offering.
In connection with the Company's investment in Topgolf International, Inc., doing business as the Topgolf Entertainment Group (“Topgolf”),
in April 2016, Topgolf repurchased shares from its existing shareholders. The Company sold $5.8 million of its preferred shares in Topgolf in
connection with this repurchase program, and received cash proceeds of $23.4 million. For further discussion, see Note 6 "Investments" in the Notes to
Consolidated Condensed Financial Statements in Part 1, Item 1 of this Form 10-Q.
As of June 30, 2016, approximately 59% of the Company’s total cash is held in regions outside of the United States. If the Company were to
repatriate such cash, outside of settling intercompany balances during the normal course of operations, it would
35
CALLAWAY GOLF CO / 10-Q / August 1, 2016 Powered by BamSEC.comPDF page 35

need to accrue and pay incremental U.S. federal and state income taxes, reduced by the current amount of available U.S. federal and state net operating
loss and tax credit carryforwards. The Company has not, nor does it intend to, repatriate funds to the United States to satisfy domestic liquidity
needs arising in the ordinary course of business, including liquidity needs associated with its domestic debt service requirements. In 2015 and 2014,
the Company ceased its business operations in Thailand and Malaysia, respectively, and accordingly, the Company no longer maintains a permanent
reinvestment assertion with respect to these two entities. The Company intends to repatriate the undistributed earnings from these two entities to the
United States at the time that the winding-down process has been completed. Accordingly, the Company has accrued for the estimated incremental
U.S. income taxes related to reversing its permanent indefinite reinvestment assertion. However, these incremental U.S. income taxes are expected
to be offset by the utilization of the Company's cumulative U.S. net operating losses. Except for the Company's foreign subsidiaries in Thailand and
Malaysia, the Company considers the undistributed earnings of its foreign subsidiaries to be permanently reinvested and, accordingly, no U.S. income
taxes have been provided thereon.
Other Significant Cash and Contractual Obligations
The table set forth below summarizes certain significant cash obligations as of June 30, 2016 that could affect the Company’s future liquidity.
Payments Due By Period
TotalLess than
1 Year 1-3 Years 4-5 YearsMore than
5 Years(in millions)
Japan ABL Facility 5.3 5.3 — — —
Capital leases(1)
0.5 0.2 0.3 — —
Operating leases(2)
17.9 6.6 7.0 3.0 1.3
Unconditional purchase obligations(3)
69.4 44.6 23.2 1.6 —
Uncertain tax contingencies(4) 3.3 0.3 0.7 0.2 2.1
Total $ 96.4 $ 57.0 $ 31.2 $ 4.8 $ 3.4
(1) Amounts represent future minimum lease payments. Capital lease obligations are included in accounts payable and accrued expenses and other
long-term liabilities in the accompanying consolidated condensed balance sheets.
(2) The Company leases certain warehouse, distribution and office facilities, vehicles and office equipment under operating leases. The amounts
presented in this line item represent commitments for minimum lease payments under non-cancelable operating leases.
(3) During the normal course of its business, the Company enters into agreements to purchase goods and services, including purchase commitments
for production materials, endorsement agreements with professional golfers and other endorsers, employment and consulting agreements, and
intellectual property licensing agreements pursuant to which the Company is required to pay royalty fees. It is not possible to determine the
amounts the Company will ultimately be required to pay under these agreements as they are subject to many variables including performance-
based bonuses, severance arrangements, the Company’s sales levels, and reductions in payment obligations if designated minimum performance
criteria are not achieved. The amounts listed approximate minimum purchase obligations, base compensation, and guaranteed minimum royalty
payments the Company is obligated to pay under these agreements. The actual amounts paid under some of these agreements may be higher or
lower than the amounts included. In the aggregate, the actual amount paid under these obligations is likely to be higher than the amounts listed as a
result of the variable nature of these obligations. In addition, the Company also enters into unconditional purchase obligations with various vendors
and suppliers of goods and services in the normal course of operations through purchase orders or other documentation or that are undocumented
except for an invoice. Such unconditional purchase obligations are generally outstanding for periods less than a year and are settled by cash
payments upon delivery of goods and services and are not reflected in this line item.
(4) Amount represents the current and non-current portions of uncertain income tax positions as recorded on the Company's consolidated condensed
balance sheet as of June 30, 2016. Amounts exclude uncertain income tax positions that the Company would be able to offset against deferred
taxes. For further discussion see Note 8 “Income Taxes” to the Notes to Consolidated Condensed Financial Statements in Part I, Item 1 of this
Form 10-Q.
During its normal course of business, the Company has made certain indemnities, commitments and guarantees under which it may be required
to make payments in relation to certain transactions. These include (i) intellectual property indemnities to the
36
CALLAWAY GOLF CO / 10-Q / August 1, 2016 Powered by BamSEC.comPDF page 36