Embed Size (px)
Citation preview
A Study of Plot Ratio and Building Height Restrictions in Densifying Cities Using 3D Spatial Analysis Technology: A
Case Study of Parramatta
Pernille Christensena, Jian Guob
a. School of the Built Environment, University of Technology Sydneyb. Department of Building and Real Estate, The Hong Kong Polytechnic University
Abstract:
As urban areas continue to grow globally they face enormous challenges in terms of land supply.
The City of Parramatta has been identified as a major growth area for the Sydney Metropolitan
area. With a current population forecast for 2016 of 236,272, the City is forecast to grow to
397,339 by 2036, a 68.17% increase over 20 years (Forecast.id, 2016). Over the past 50 years,
the City of Parramatta has seen a 72% increase of hot days (over 35 oC), increasing from 7.4
days in 1967 to 12.7 days in 2015. Temperature impacts are therefore a significant planning
factor that must be considered when evaluating future redevelopment proposals for the
Parramatta CBD area. This study uses 3D GIS to simulate the impacts of various development
densities on temperature and to demonstrate how the use of 3D technology can assist planners
and developers in making better informed decisions. Three scenarios with different plot ratios
and building heights were digitally simulated in the Parramatta Square mixed-use redevelopment
area and compared to understand the urban heat implications of each scenario. Because the
insolation factor (a measure of the solar radiation that reaches the earth's surface, measured by
the amount of solar energy received per square centimetre per minute) can only be calculated
using 3D models, this research offers an innovative approach to understanding how various
redevelopment scenarios will impact the urban temperature of the area. Preliminary findings
indicate that when the plot ratio and building height are increased, less ground area experiences
long-hour sunlight exposure. Simultaneously, the percentage of the total area exposed to long-
hour sunlight was decreased sharply. For urban areas experiencing severe heat and increased
population growth, perhaps a re-evaluation of development patterns may help address some of
the associated impacts.
Key words: 3D model, Parramatta, 3D spatial analysis, Plot ratio and building height
1
1. Introduction
As urban areas continue to grow globally they face enormous challenges in terms of land supply.
The City of Parramatta has been identified as a major growth area for the Sydney Metropolitan
area, with an expected population growth 68.17% over the next 20 years. Significant steps have
been taken to reconsider local planning regulations for the CBD area so that the City can better
accommodate this anticipated increase in demand for residential units and office space. Among
the key areas of concern for the Parramatta City Council is that the urban renewal strategy for of
the CBD consider the impacts of climate change related temperature increases and urban heat
island effect, which has increasingly impacted the City as temperatures continue to rise annually
in Australia. It is anticipated that an urban resilience-focused approach will needed to address the
likely impact of the increased urbanization and densification on the urban heat island effect of
the CBD, understanding how new development will impact the temperature factor (insolation,
solar radiation, and heat island). For this reason, the impact of new development of the
temperature factor should be among the most important issues considered by the Council when
assessing the redevelopment plans for the Parramatta area.
Although several studies have been conducted to explore the feasibility of increasing
development intensity by assessing environmental impacts, infrastructure capacity and public
consultation, these reviews and assessments were conducted using 2D Geographical Information
Systems (GIS). Since the spatial distribution of land in the real world is three-dimensional, 3D
GIS can help us investigate the world with a more accurate three-dimensional perspective and
thereby make better informed decisions. This study aims to investigate the viability and impacts
of minor relaxations of plot ratio and building height restrictions (PR/BH) for the Parramatta
Square area based on the 3D models and using 3D spatial analyses, such as shadow effects and
insolation factors.
Three scenarios with different PR/BH were digitally simulated and compared in this study.
Insolation was simulated for each scenario to understand how new developments might impact
the ground temperature for city occupants in each development scenario. Findings indicate that
when the plot ratio and building height are increased, less ground area experiences long-hour
sunlight exposure. Simultaneously, the percentage of the total area exposed to long-hour sunlight
2

was decreased sharply. For urban areas experiencing severe heat and increased population
growth, perhaps a re-evaluation of development patterns may help address some of the
associated impacts.
2. Background
Australia has one of the highest rates of urbanisation in the world, with 89.4% of its population
living in urban areas in 2015. This represents an annual population growth of 1.2% in urban
areas from 2010 to 2015 (The World Bank, 2016). The City of Parramatta is experiencing higher
than average population growth, with a population of 203,183 in 2011, a current population of
236,272 in 2016, and is a projected population of 397,339 in 2036, a 95.56% growth over 25
years and 68.17% increase over 20 years, respectively, representing and annual growth rate of
2.72% (Forecast.id, 2016). Residential development forecasts for the City of Parramatta assumes
that the number of dwellings in City of Parramatta will increase by an average of 3,275
dwellings annually, up to 157,294 dwellings in 2036. The distribution of these dwellings will
vary by suburb, will an anticipate 328% increase in dwellings in the CBD (See Figure 1, below),
and as high as a 1219387% increase in dwellings in the Sydney Olympic Park suburb (ibid,
2016).
The City of Parramatta has taken significant steps to accommodate this growth and anticipate the
increased demand for residential units, as well as office space in which this population will work.
Urban Growth has developed a Draft Parramatta Road Urban Transformation Strategy, which
highlights particular redevelopment areas along the Parramatta Road corridor (which begins in
Camperdown and finishes at the intersection with Woodville Road and Church Street in
Parramatta) to improve the connection between the Sydney CBD and Parramatta CBD areas.
The redevelopment of the Parramatta Road corridor will feed directly into one of Australia’s
largest urban renewal projects, Parramatta Square. Parramatta Square is a 3 ha mixed use
redevelopment precinct located in Parramatta CBD, bounded by Church, Macquarie, Smith and
Darcy Streets. The aim of the Parramatta City Council is to transform the Parramatta CBD into
“a vibrant mixed-use hub, accommodating a substantial new public domain with more than
240,000sqm of mixed-use development and new Council facilities.” An animation video of the
proposed Parramatta Square development can be found here (City of Parramatta, 2016)
3

One of the key areas of concern for the Parramatta City Council is that the urban renewal of the
CBD also offer possible solutions to the heat island effect, which has increasingly impacted the
City as temperatures continue to rise annually in Australia. As noted by Councillor Tony
Hadchiti, president of the Western Sydney Regional Organisation of Councils (WSROC), the
"[u]rban heat is an issue for all cities, but western Sydney's unique geography and lack of sea
breeze means the region is already much hotter than its eastern counterparts" (Cormack, 2016).
For the western suburbs of Sydney the number of hot days1 has increased by 60% over the period
from 1970 to 2011; this increase is in part caused by the urban heat island effect and in part by
the underlying increase in temperatures due to climate change. As of 2012, Parramatta
experienced four times as many hot days as Sydney, up from three times as many in the 1970s
(Steffen and Hughes, 2012). The Lord Mayor of Parramatta Cr Paul Garrard recently noted that,
1 Hot days are defined as days with temperature reaching over 35°C (Steffen and Hughes, 2012).
4
Figure 1: City of Parramatta Dwellings - % Change 2011- 2036 (Source: Forecast.id, 2016)
on average, “Parramatta experiences around thirteen days per year which are 35 degrees and
over, compared to Sydney which averages around four,” (26 Nov 2015 press release). Trendline
analysis of the temperature data confirms that there were 12.7 days above 35 oC in 2015. When
compared to 1967, when Parramatta experienced 7.4 days above 35 oC, this represents a 72%
increase in hot days from 1967 to 2015 in the Parramatta area. To put the severity of this
increase in perspective, the City of Sydney CBD area experienced only 3.5 hot days in 2015,
which means the Parramatta CBD has 3.6 times the number of hot days than the Sydney CBD in
2015.
With the scale of growth likely to exacerbate the urban heat island effect of the CBD,
understanding how new development will impact the temperature factor (insolation, solar
radiation, and heat island) in the CBS should be among the most important issues considered by
the Council when assessing the redevelopment plans for the Parramatta area. This research
investigates three different Plot Ratios/Building Height (PR/BH) scenarios for the development
patterns of Church Street in Parramatta Square to understand how various development pattern
decisions will impact the urban temperature factor. Insolation was simulated for each scenario to
understand how new developments might impact the ground temperature for city occupants.
3. Literature Review
The majority of studies exploring the feasibility of increasing development intensity have
assessed environmental impacts, infrastructure capacity and public consultation; however, these
studies were conducted using 2D Geographical Information Systems (GIS). With the rapid
development of 3D GIS technology, a growing number of researchers are applying this
technology to support various decision-making processes for urban development.
In urban planning, decision and policy makers are often faced with the problems of dealing with
systems in which natural and human factors are interrelated and lack of realistic representations
of reality. Ranzinger and Gleixner (1997) described that urban planners and architects have used
2D drawing plans and building elaborate models from wood and pasteboard to convey their ideas
for decades. However, all these methods generally have some drawbacks, such as realistic
impression, easy adaption to changes or simple comparison between different variants.
5

Therefore, the old methodology could not meet the demand of more influence in planning
processes, the advanced technologies (e.g. GIS and remote sensing) are highly necessary to be
introduced in current stage. Over the past decade, efforts have been made to provide improved
solutions in the form of 3D spatial analysis for urban settings. For example, Zhang et al. (2004)
analyzed urban development issues based on 3D city models. They outlined a series of possible
3D spatial analyses, including visibility, flood, energy, solar panel, and air pollution. Similarly,
Mak et al. (2005) used 3D GIS to construct, assess, and analyze the city skyline of Hong Kong.
The results showed that 3D GIS is effective in implementing the recommendations of Hong
Kong urban design guidelines, such as the measurement of building height and the visibility of
ridgeline and skyline Some researchers focused on other issues, such as climate (Li et al., 2004)
and urban routes (Thill et al., 2011). In addition, Leszek (2015) recently highlighted the
technological trend of 3D spatial analysis for urban development.
Although these studies focused on applying 3D spatial analysis technologies to solve some of the
issues in urban development, few studies have emphasized the issue of development control –
the effect of relaxation of the maximum PR/BH constraints on the environment. Therefore, in our
study, we will focus on the research of investigating the viability of minor relaxation of
maximum PR/BH restrictions using 3D models and spatial analyses technology.
4. Research Methodology
The framework of this study is presented in Figure 2. There were four main steps in this study.
First, a 3D model of Parramatta was established based on the relevant information and available
3D spatial data. Second, 3D spatial analysis was conducted to assess the impacts of various
scenarios in terms of Insolation. Third, based on three different Plot Ratios/Building Height
(PR/BH) scenarios, a comparative study was conducted to evaluate how the relaxation of PR/BH
would affect the surrounding areas and total sunlight changes. Finally, the discussion and
conclusion should be addressed.
The 2D Map (Figure 3) & 3D model of the City of Parramatta CBD (Figure 4), as of April 2016,
was provided by the Parramatta local government; this included the general footprint of all CBD
buildings, overall height of buildings, and other related information. Because the City Council
6

specifically identified the Church Street area as an area in transition, and one which they were
particularly interested in understanding the impact of varying PR/BH allowances, this was the
chosen for the study area. The current 3D model of the Church Street area is shown in Figure 5.
Figure 2: Framework of the study
3D Modeling
The final 3D model of the Church Street area was then overlaid onto a 2D map of the Parramatta
CBD to offer context to the model (Figure 6). To compare with the impacts of the PR/BH
restrictions, three scenarios with different PR/BH were built for the Church Street area.
Scenario 1 (S1) (Figure 7) is the original plan according to the current 3D data
Scenario 2 (S2) (Figure 8) is further increased by 20% for each building based on S1
Scenario 3 (S3) (Figure 9) is further increased by 50% for each building based on S1
7

Figure 3: 2D map of Parramatta
Figure 4: 3D model of Parramatta
8

Figure 5: Overlay of 3D of Church Street model onto 2D Parramatta map
Figure 6: 3D model of Church Street (Part of Parramatta)
9
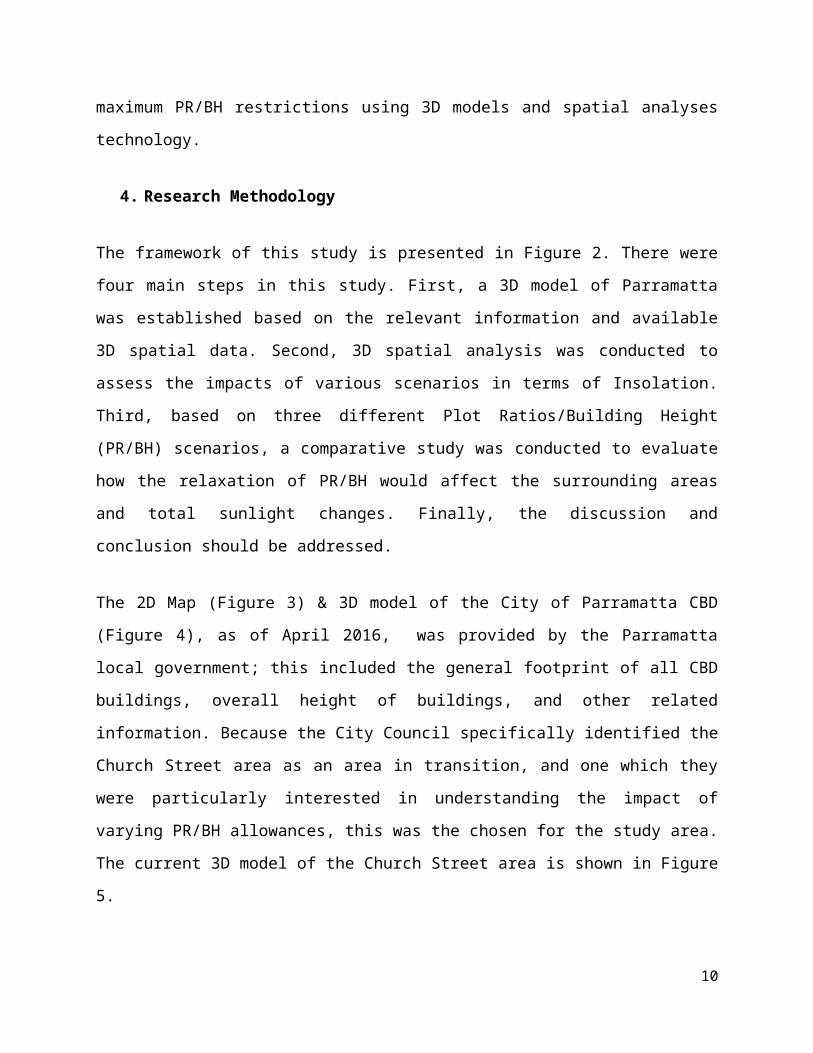
Figure 7: Scenario 1 (original plot ratio and building height)
Figure 8: Scenario 2 with increased plot ratio and building height (20% increased yellow parts)
10

Figure 9: Scenario 3 with further increased plot ratio and building height (50% increased, red parts)
5. 3D Spatial Analysis and Experimental Results
As part of electromagnetic radiation emitted by the sun, sunlight is visible during the day when
the sun is above the horizon of the Earth. Sunlight altitude and azimuth can by simulated in 3D
models (using Australia Bureau of Meteorology data input) to accurately represent how and from
where building experience sunlight exposure on any given day of the year. Shadow areas are
described as areas where the sunlight is obstructed by an opaque object. In 3D models, shadow
areas can be simulated behind any 3D volume when a light is simulated in front of it. Shadow
and sunlight hours are two important factors in environmental assessment for urban planning.
Insolation is normally used to measure the distribution of sunshine duration in a particular area.
The effects of sunlight hours and the distribution of sunlight in summer, with minor relaxations
of PR/BH, were compared using the following pairings of S2 versus S1, and S3 versus S1. With
careful consideration, the Church Street area was chosen as the analysis region (Figure 10). The
comparative analysis was based on the solar azimuth and altitude (20° was used as the setting in
accordance to Parramatta’s location). Finally, the average sunlight hours per day and related
locations were determined in summer for S1, S2, and S3 (Figures. 11-13). In addition, the
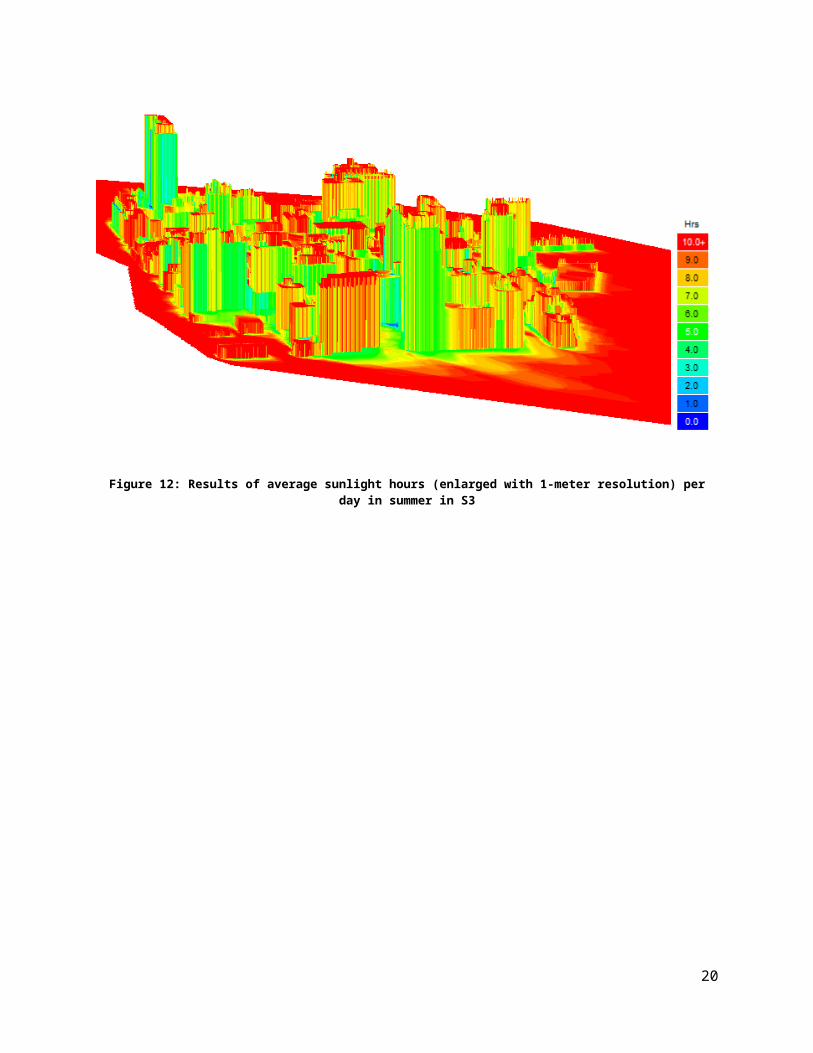
shadow simulation for a chosen day, from the morning to evening, is presented in Figure 14.
11

Figure 10: Analysis region with green for insolation analysis in summer
12

Figure 11: Results of average sunlight hours (enlarged with 1-meter resolution) per day in summer in S1
13

Figure 12: Results of average sunlight hours (enlarged with 1-meter resolution) per day in summer in S2
14

Figure 13: Results of average sunlight hours (enlarged with 1-meter resolution) per day in summer in S3
15

Figure 14: Shadow simulation
16

Table 1: Comparison of the distribution for the insolation during S1, S2, and S3
Hours
S1 S2 S3 S2 vs S1 S3 vs S1 S3 vs S2
Percentage
(%)
Percentage
(%)
Percentage
(%)
Percentage
(%)
Percentage
(%)
Percentage
(%)
0-1 0.05 0.11 0.25 0.06 0.2 0.14
1-2 0.26 0.33 0.59 0.07 0.33 0.26
2-3 0.32 0.41 0.92 0.09 0.6 0.51
3-4 0.61 0.85 1.29 0.24 0.68 0.44
4-5 1.2 1.39 2.12 0.19 0.92 0.73
5-6 2.43 2.70 3.73 0.27 1.3 1.03
6-7 2.85 3.25 4.27 0.4 1.42 1.02
7-8 4.37 4.73 5.62 0.36 1.25 0.89
8-9 6.25 6.49 6.58 0.24 0.33 0.09
9-10 9.26 9.27 9.79 0.01 0.53 0.52
10-11 44.59 45.35 44.41 0.76 -0.18 -0.94
11-12 27.82 25.12 20.43 -2.7 -7.39 -4.69
17

Table 1 compares Figures 12 and 13 to the base mode (Figure 11). When visually comparing the
blue areas (which represent ground and façade areas catching sunlight hours for 0-2 hours) in
Figures 11-13, it is clear that more areas are experiencing a shadow effect and receiving less
exposure to directly hot summer sunlight. This is reinforced by the quantitative data captured in
the model, shown in Table 1 as statistical representations, which indicate that there is an increase
of up to 3% of areas experiencing direct sunlight less than 2 hours/day.
Similarly, as shown in Figure 13, the green areas (which represent ground and façade areas
catching sunlight over the course of one full day is in the range of 4-6 hours) have also visually
increased when compared to the base scenario represented (S1 in Figure 11). The trend is again
reinforced by the quantitative capture of data as presented in Table 1, where the highlighted
green rows indicate that in S3 the ground and façade areas catching 4-6 hours sunlight over the
course of a single day have increased 13% and 10%, respectively, when compared to S1 and S2.
Conversely, the ground and façade areas catching sunlight more than 10 hours over the course of
a single day decreases as the building height is increased. When the building height increased,
more shadows are generated; therefore, the ground and façade areas experiencing long hours of
direct sunlight exposure are decreased. This is particularly evident when looking at the red areas
representing 11-12 hours of exposure. As seen in Table 1, S3 has almost a 74% reduction in
ground and façade areas experiencing direct sunlight exposure for extended periods of 11-12
hours in a single day when compared to the base model, and also sees a significant decrease of
almost 47% when compared to S2.
The ground and façade areas of the buildings (especially the side face) catching sunlight hours
gradually decrease as the surrounding building heights are increased. The comparison of these
models therefore indicates that the Parramatta CBD area could possibly benefit from the
increased building height, as increased building heights may reduce the direct irradiation time of
the sunlight resulting in correspondingly decreased temperatures in the CBD and immediately
surrounding areas. The City Council should consider whether shadowing effect from buildings
could be as one of series of tools to reduce experienced temperatures for residents and visitors of
the Parramatta CBD area.
18

6. Discussion and Conclusions
To probe the effects of minor relaxation of the maximum PR/BH restrictions of Church Street
area, 3D modeling and simulation technology were applied. Shadow and insolation were
considered, and the analysis of this factor was limited to the Church Street area in this study. The
authors acknowledge that the limited area of this study may be considered a limitation of the
study, and recommend that a broader spatial analyses related to urban heat island and other
environmental factors should be investigated and applied in a larger study area, ideally the entire
Parramatta CBD area, in the future. Furthermore, additional details of buildings, such as
materials and colour, could also be considered in further studies as these also have the ability to
impact spatial temperature.
In this study, 3D modeling and spatial analysis technology were used to conduct simulations
based on 3D models. 3D models have been demonstrated to improve the public's understanding
of the impact of developments in other countries, as they can provide more vivid visualizations
than 2D GIS plans, which some community members may struggle to understand.
The effects of increasing the plot ratios and building heights on shadow and insolation for the
Church Street area was successfully simulated and analysed for the three scenarios. The findings
of insolation spatial analysis indicate that a minor relaxation of the maximum of plot ratios and
building heights regulations would lead to the following conclusions.
(a) Summer conditions were considered for the Church Street area because of the extreme
heat experienced in the City over recent years. Through shadow and insolation analysis,
the average sunlight hours per day and corresponding percentages for different categories
of sunlight hours were calculated, and the results were presented as figures and in a
comparative table. A clear trend was identified which indicates that when the PR/BH was
increased, the areas catching the shortest sunlight exposure (1-2 hours) were gradually
increased, while the areas catching the longest sunlight exposure (10-12 hours) were
significantly reduced.
(b) There was a dramatic drop of about 74% in areas catching 11-12 hours of direct sunlight
per day, when compare S2 to S1, when the building heights were increased by 50%
19
above the currently allowed height (S1). The decrease in direct sunlight exposure should
also lead to correspondingly decreased temperatures in the CBD and surrounding areas.
(c) Compared to S1, additional gross floor area of commercial space, residential units or
mixed-use space can be offered through the increased BH/PR scenarios in S2 and S3.
This could help meet growing demands for office space and residential units as the City
experiences growth in the following decades.
This study concludes that significant impacts can be identified related to the shadow and
insolation effects under the three scenarios. The findings indicate that the government or the
public could assess the environmental impact of land development density from a holistic view,
and make effective and future-sighted decisions to improve the overall urban resilience of the
City of Parramatta by testing potential development patterns using 3D simulation models and the
results of 3D spatial analysis. Furthermore, the methodology proposed in this study can also be
applied in other urban renewal cases or for new development areas in other densely populated
cities.
7. References:
City of Parramatta. (2016). Parramatta Square – A world-class civic heart. Retrieved 17.
October, 2016 from: http://www.cityofparramatta.com.au/transformation/parramatta-square/
Cormack, L. (2016). Sydney area an 'urban heat island' vulnerable to extreme temperatures.
Sydney Morning Herald. January 14, 2016. Retrieved 17. October, 2016 from:
http://www.smh.com.au/environment/sydney-area-an-urban-heat-island-vulnerable-to-
extreme-temperatures-20160113-gm4v14.html
Forecast.id. (2016). Population Forecasts: City of Parramatta. Retrieved 17. October, 2016
from: http://forecast.id.com.au/parramatta/home
Leszek, K. (2015). Environmental and urban spatial analysis based on a 3D city model.
Computational Science and Its Applications, 9157, 633-645.
Li, W., Putra, S. Y. and Yang, P. P.-J. (2004). GIS analysis for the climatic evaluation of 3D
urban geometry - The development of GIS analytical tools for sky view factor. Proceedings
of GISDECO.
20
Mak, A. S.-H., Yip, E. K.-M. and Lai, P.-C. (2005). Developing a city skyline for Hong Kong
using GIS and urban design guidelines. URISA Journal, 17(1), 33-42.
Ranzinger, M. and Gleixner, G. (1997). GIS Datasets for 3D urban planning. Computers,
Environment and Urban Systems, 21(2), 159-173.
Steffen, W. and Hughes, L. (2012). The Critical Decade: New South Wales climate impacts and
opportunities. Climate Commission Secretariat (Department of Climate Change and Energy
Efficiency): Canberra. Retrieved 17. October, 2016 from:
https://www.climatecouncil.org.au/uploads/111b148abf6c2b7e08e25cc5f6612fdc.pdf
The World Bank. (2016). The World DataBase: World Development Indicators. Retrieved 17.
October from: http://databank.worldbank.org/data/home.aspx
Thill, J.-C., Dao, T. H. D. and Zhou, Y. H. (2011). Traveling in the three-dimensional city: appli
cations in route planning, accessibility assessment, location analysis, and beyond. Journal o
f Transport Geography, 19, 405-421.
Zhang, X., Zhu, Q. and Wang, J. W. (2004). 3D city models based spatial analysis to urban
design. Geographic Information Sciences, 10(1), 82-86.
21


![[Location and Site] · Web viewSince the site is located in urban area wildlife are going to appear; there are the typical wildlife that you see on a day to day bases such as cats,](https://img.dokumen.tips/doc/110x75/612f413f1ecc51586943531a/location-and-site-web-view-since-the-site-is-located-in-urban-area-wildlife-are.jpg)