Embed Size (px)
Citation preview
OPTIONS FOR REDUCING MOISTURE AND ASH CONTENT
IN FOREST BIOMASS HARVESTING SYSTEMS
by
JASON BLAINE CUTSHALL
(Under the Direction of W. Dale Greene)
ABSTRACT
Renewable energy sources are increasingly important as part of a 21st century energy solution.
Wood energy facilities prefer clean, dry raw material to maximize energy content and minimize
ash remaining after combustion. This dissertation assessed properties and production costs of
chipping and grinding systems processing whole trees and residues from roundwood and clean
chipping operations. Moisture content was reduced from 53% for freshly felled trees to 43%
and 39% for trees allowed to dry transpirationally for 4 and 8 weeks, respectively prior to a
whole‐tree chipping operation. Drying did not significantly change the ash content (<0.7%)
associated with this feedstock. Truck payloads were 16% and 24% lower for material dried 4
and 8 weeks compared to green material, thus increasing hauling costs by $0.80 per ton (field
condition) for each subsequent 4‐week drying period. Transpirational drying increased the
energy content of delivered chips by approximately 1,200 BTU/lb. While drying stems up to
eight weeks increased on‐board costs $0.68 on a field ton basis, it reduced those costs by $7.83
on a bone dry ton basis and by $0.47 on a million BTU basis. Data on production and the
properties of chip and wood residue products were used to estimate costs per million BTU for
forest biomass harvesting systems including conventional roundwood, clean chipping, whole‐
tree chipping, and screened and unscreened grinders processing logging and clean chip residue.
Delivered costs for these systems were evaluated for a range of values for moisture content,
ash content, tract size, tons of biomass removed per acre and at grinding decks, truck payload,
haul distance, and diesel fuel price. Delivered cost per mmBTU decreased by over 50% for all
systems as moisture content decreased from 55% to 30%. Whole tree chipping provided the
lowest cost option ($4.39 per mmBTU) at ash content levels less than 1%, and unscreened
grinding of clean chip residue produced the least expensive option at 5% ash ($2.87 per
mmBTU). Tract size had minimal effects on any operation until the acreage declined below 40
acres. Clean chipping and roundwood systems were considerably more expensive than whole‐
tree chipping operations on all tract sizes. Costs declined significantly as truck payload
increased and/or haul distance decreased. Optimizing truck payload to attain legal weight
limits by lowering tare weight and/or increasing trailer volume capacity is an opportunity for
forest biomass harvesting system managers to achieve lower costs especially when dealing with
drier material or low‐density screened roundwood grindings. Fuel price increases directly
increase cut and haul costs and limit economical haul distances accordingly.
Index Words: forest biomass harvesting, chipping, grinding, moisture content, ash content

OPTIONS FOR REDUCING MOISTURE AND ASH CONTENT
IN FOREST BIOMASS HARVESTING SYSTEMS
by
JASON BLAINE CUTSHALL
B.S., Mississippi State University, 1996
MBA, Mississippi State University, 1997
M.S., Mississippi State University, 1999
A Dissertation Submitted to the Graduate Faculty of The University of Georgia in Partial
Fulfillment of the Requirements for the Degree
DOCTOR OF PHILOSOPHY
ATHENS, GEORGIA
2012

© 2012
Jason Blaine Cutshall
All Rights Reserved

OPTIONS FOR REDUCING MOISTURE AND ASH CONTENT
IN FOREST BIOMASS HARVESTING SYSTEMS
by
JASON BLAINE CUTSHALL
Major Professor: W. Dale Greene
Committee: Michael Clutter Jacek Siry Sudhagar Mani Electronic Version Approved: Maureen Grasso Dean of the Graduate School The University of Georgia August 2012

iv
ACKNOWLEDGEMENTS
When I began considering a return to academia to pursue a doctorate degree, Dr. Dale
Greene at UGA was the first person that came to mind and who I first contacted. It was truly an
honor and privilege to have worked with someone so well respected in the forest resources
community. Dale, I appreciate the hospitality you and your family showed me over the past
three years, especially when you opened up your home to me after my residency in Athens.
Thank you for your patience, friendship, and mentorship as my Major Professor.
I also owe a great deal of gratitude to Shawn Baker for his friendship, advice, technical
assistance, and hospitality. I was very fortunate to work with someone like Shawn who was
capable of debugging stubborn SAS code in only a matter of minutes and was always willing to
provide helpful suggestions. Thank you, Shawn, for also allowing me to occasionally “crash” at
your house during my visits to Athens.
Thanks to Warnell Dean Dr. Michael Clutter, Dr. Jacek Siry, and Dr. Sudhagar Mani for
serving on my graduate advisory committee and offering helpful comments and suggestions.
Successful field research projects do not often occur without the support of others.
Special thanks go to Grant Harvey and Blayne Harrington with Plum Creek Timber Company and
to Robbie Shepherd with Shepherd Brothers Logging for their help with our chipping study and
to Bill Scott with Collum’s Lumber Company in Allendale, SC for his help with our lengthy
grinding study. I also appreciate the field work assistance from fellow Warnell graduate
students and staff Cory Dukes, Arthur Williams, Andres Enrich, and Rich Molpus. My graduate

v
program and research would not have been possible without funding from the Southeastern
SunGrant Center.
In closing, I want to recognize and thank my loving and supportive wife, Kelly. Kelly
recognized those times when I needed extra support, encouragement, and protection from
distractions – especially during my residency in Athens and in the final months of completing
my dissertation – and guarded my writing time and working space. Kelly also deserves a lot of
credit for the patience she showed for three years by simply letting some things go that
normally would merit immediate attention and for being a great single parent during my time
in Athens. I love you, Kelly, and the unconditional love and support you give me.

vi
TABLE OF CONTENTS
Page
ACKNOWLEDGEMENTS ................................................................................................................. iv
LIST OF TABLES .............................................................................................................................. ix
LIST OF FIGURES ............................................................................................................................. x
CHAPTER
1 INTRODUCTION AND LITERATURE REVIEW ................................................................. 1
1.1 Introduction ..................................................................................................... 1
1.2 Wood Energy Facilities ..................................................................................... 2
1.3 Harvesting Operations ..................................................................................... 7
1.4 Forest Landowners ......................................................................................... 10
1.5 References ..................................................................................................... 12
2 TRANSPIRATIONAL DRYING EFFECTS ON ENERGY AND ASH CONTENT FROM WHOLE‐TREE SOUTHERN PINE PLANTATION CHIPPING OPERATIONS ..................... 17 2.1 Abstract .......................................................................................................... 18
2.2 Introduction ................................................................................................... 19
2.3 Methods ......................................................................................................... 22
2.4 Results and Discussion ................................................................................... 26
2.5 Summary ........................................................................................................ 33
2.6 Acknowledgements ........................................................................................ 34
2.7 References ..................................................................................................... 34
vii
3 FACTORS AFFECTING COSTS OF FOREST BIOMASS HARVESTING SYSTEMS AND THEIR IMPLICATIONS FOR STAKEHOLDERS .......................................................................... 44
3.1 Abstract .......................................................................................................... 45
3.2 Introduction ................................................................................................... 46
3.2.1 Wood Energy Facilities .......................................................................... 47
3.2.2 Harvesting Operations .......................................................................... 52
3.2.3 Forest Landowners ................................................................................ 55
3.3 Methods ......................................................................................................... 58
3.3.1 Harvesting Systems ............................................................................... 58
3.3.2 Product Analysis .................................................................................... 58
3.3.3 Production Analysis ............................................................................... 59
3.3.4 Cost Estimation ..................................................................................... 59
3.3.5 Nutrient Removals ................................................................................ 61
3.4 Results ............................................................................................................ 62
3.4.1 Moisture Content .................................................................................. 62
3.4.2 Ash Content .......................................................................................... 62
3.4.3 Tract Size ............................................................................................... 63
3.4.4 Tons per Acre and Tons per Landing .................................................... 63
3.4.5 Truck Payload ........................................................................................ 64
3.4.6 Distance to Market ............................................................................... 65
3.4.7 Fuel Prices ............................................................................................. 65
3.4.8 Cost Summary by System ...................................................................... 66
3.4.9 Nutrient Removals ................................................................................ 66

viii
3.5 Summary ........................................................................................................ 67
3.6 Acknowledgements ........................................................................................ 69
3.7 References ..................................................................................................... 69
4 SUMMARY .................................................................................................................. 87
4.1 Transpirational Drying for Whole‐Tree Chipping ........................................... 87
4.2 Comparisons of Forest Biomass Harvesting Systems .................................... 88
APPENDICES ..................................................................................................................... 91
A. Conventional roundwood logging base sensitivity model ................................... 92
B. Clean chipping base sensitivity model ................................................................. 93
C. Whole‐tree chipping (50% MC) base sensitivity model ....................................... 94
D. Whole‐tree chipping (40% MC) base sensitivity model ....................................... 95
E. Roundwood residue grinding base sensitivity model .......................................... 96
F. Roundwood residue grinding (screened) base sensitivity model ........................ 97
G. Clean chip residue grinding base sensitivity model ............................................. 98
H. Clean chip residue grinding (screened) base sensitivity model ........................... 99
I. Assumptions and Likely Conditions for Table 3.4 Delivered Cost Rankings ...... 100

ix
LIST OF TABLES
Page
Table 2.1. Machine rate assumptions and cost inputs by machine. ............................................ 37
Table 2.2. Observed rainfall and comparison of moisture content for tree disk samples collected periodically during four and eight week drying periods and wood chips harvested fresh and allowed to field dry four and eight weeks .................................................. 38
Table 2.3. Truck payloads, chipper productivity, chipper utilization, and chipper fuel
consumption of a whole‐tree chipping operation processing fresh, four and eight week dried material. .................................................................................................... 39
Table 2.4. Chip size distribution, bark, foliage, ash, nutrient, and energy content of whole‐tree
chips fresh and that transpirationally dried in the field for four and eight weeks. ..... 40 Table 2.5. Estimates of hourly costs, costs per loaded field ton and bone dry ton, and costs per
loaded mmBTU, of a whole‐tree chipping operation processing fresh and four and eight week dried material. ........................................................................................... 41
Table 2.6. Transportation costs for whole tree chips produced from stems chipped green, dried
four weeks and dried eight weeks. .............................................................................. 42 Table 3.1. Machine rate cost assumptions for machines in conventional roundwood, whole‐tree
chipping, clean chipping, screened grinding, and unscreened grinding systems. ....... 74 Table 3.2. Ranges of variables by harvesting system used to determine cost sensitivity. ........... 75 Table 3.3. Delivered cost estimates ($/mmBTU) by levels of ash content. .................................. 76 Table 3.4. Table 3.4. Ranking (lowest=1) of delivered cost estimates ($/field ton and $/mmBTU)
for biomass harvesting systems under likely conditions. ............................................ 77 Table 3.5. Nutrient content of materials produced by whole‐tree chipping operations and
screened and unscreened residue grinding operations processing roundwood and clean chipped residues. ................................................................................................ 78
Table 3.6. Estimated bone dry tons of biomass and pounds of N, P, and K removed per acre
from forest biomass harvesting systems. .................................................................... 79

x
LIST OF FIGURES
Page
Figure 2.1. Average moisture content of wood chips harvested fresh and allowed to dry four and eight weeks. ......................................................................................................... 43
Figure 3.1. Delivered cost estimates ($/mmBTU) for increasing levels of moisture content ...... 80 Figure 3.2. Delivered cost estimates ($/mmBTU) for increasing tract sizes................................. 81 Figure 3.3. Delivered cost estimates ($/mmBTU) for increasing amounts of field tons removed per acre ....................................................................................................................... 82 Figure 3.4. Delivered estimates ($/mmBTU) for increasing amounts of field tons per landing for grinding operations ..................................................................................................... 83 Figure 3.5. Delivered cost estimates ($/mmBTU) for increasing net tons of truck payload ........ 84 Figure 3.6. Delivered cost estimates ($/mmBTU) for increasing distance to market (miles) ...... 85 Figure 3.7. Delivered cost estimates ($/mmBTU) for increasing diesel fuel prices ...................... 86
1
CHAPTER 1
INTRODUCTION AND LITERATURE REVIEW
1.1 Introduction
Higher market prices for fossil fuels as well as proposed policy changes to support
renewable energy use and to reduce carbon emissions have recently led to a large number of
bioenergy projects being announced which will consume woody biomass. Projects recently
announced for North America will substantially increase wood energy capacity and may
consume more than 60 million green tons of woody biomass feedstock (RISI 2011). Woody
biomass from forest residues has long been underutilized due to limited access and high costs
associated with collection and transportation (Evans 2008). A survey of top state forestry
officials identified the highly capital intensive nature of harvesting and transportation of woody
biomass from forests as the top constraint to expanding this new industry (Aguilar and Garrett
2009).
Harvesting systems utilizing whole‐tree chippers and grinders are used to convert
woody biomass into a suitable feedstock for wood energy facilities. A system harvesting
roundwood products typically piles logging residue (slash) for later collection by a biomass
harvesting system using a grinder or chipper. This dissertation compares a range of likely forest
biomass harvesting systems, including whole‐tree chipping, clean chipping, conventional
roundwood, and residue grinding to determine how each system may affect woody biomass
energy facilities, biomass harvesting firms, and forest landowners.
2
1.2 Wood Energy Facilities
The forest products industry today purchases most raw materials on a green ton basis
for convenience and to encourage the delivery of freshly cut wood. Wood energy facilities are
likely to prefer drier raw material to maximize energy content. They also often prefer feedstock
with a minimum of dirt or grit so that the ash remaining after combustion is reduced. Moisture
content and ash content are especially important issues where logging residues such as limbs,
tops, and understory stems are collected because moisture and ash affect energy value. Wood
energy facilities are also concerned with the elemental or nutrient content of woody biomass
feedstocks due to its effect on emissions affecting air quality (Obernberger et al. 1997).
When woody biomass feedstocks will be combusted to provide energy it is
advantageous to have low moisture content to increase their energy value (BTU). The heating
value of any fuel is the energy released per unit mass or per unit volume of the fuel when the
fuel is completely burned (ANSI/ASABE S593.1 2011). Woody biomass has one of the highest
energy contents of all biomass sources with over 25 million BTUs per oven‐dry ton (Boundy et
al. 2011). The moisture content of solid biomass influences the net calorific value and the
combustion efficiency (Kristensen and Kofman 2000). Woody biomass products with particle
sizes too small or too large negatively influence handling, combustion characteristics, and
emissions. (Paulrud and Nilsson 2004).
A higher energy value results in greater burning efficiency. Wood energy markets
(biorefineries, pellet manufacturers, wood‐fired electric plants, and wood to liquid fuel
processes) are often interested in procuring raw material that has lower moisture content than
green wood to obtain a higher energy value. The transportation of bioenergy feedstocks has
3
been found to be inherently more costly than fossil fuels because per unit energy density of
fossil fuels is two to three times that of biomass (Young 1980). Each 10% reduction in moisture
content can increase the net energy content of the wood by approximately 850 BTU (Ince
1979). Freshly felled trees have a moisture content of approximately 50% (wet basis) – this
varies somewhat by species and region – but if allowed to dry for at least four weeks before
delimbing and processing, moisture content can be reduced to as little as 30‐35% (Stokes et al.
1993). This delayed delimbing and bucking is known by several names but we will refer to it as
transpirational drying. Loblolly pine (Pinus taeda) stems dry at a greater rate with limbs intact
than as delimbed stems, they dry more during summer months, and most moisture reduction
occurs during the first 30 days of drying (Klepac et al. 2008).
While reducing moisture content is important, keeping ash content low in combustible
woody fuels is also vital. Ash is formed from mineral matter during combustion and can cause
slagging, which is the coating of internal surfaces in boilers from deposition of ash particles. Ash
is a crucial aspect of the concept of sustainable, carbon neutral thermal biomass utilization and
may be recycled where appropriate in forests and on agricultural land or put in a landfill
(Narodoslawsky and Obernberger 1996).
Woody biomass with higher ash content is considered of poorer quality because it
results in poorer combustion performance and increases maintenance and disposal costs
caused by glass or slag deposits formed within some burning mechanisms (Sarenbo 2009). The
biomass harvesting system employed, the type of woody biomass material, and the manner
and duration of how woody biomass is stored and/or piled on‐site can all affect moisture and
ash content (Obernberger et al. 1997, Pettersson and Nordfjell 2007). Öhman et al. (2004)

4
observed ash content for different types of woody biomass used to make pellets and found that
while ash deposits were affected both by burner and feedstock types, stem wood based
material produced less ash than bark and logging residues. The wood pelletizing process is less
forgiving of ash, as is the burning of woody biomass in stoker grate boilers where slag deposits
are prone to form. More technologically advanced circulating fluidized bed boilers tolerate a
greater amount of ash than stoker grate boilers (van den Broek et al. 1996).
Wu et al. (2011) measured moisture content from three different sizes of chips oven
drying them for 24 hours at 105 degrees C and determined size distribution by screening chips
in a horizontal classifier. The smallest and largest size chips (0‐20mm and 40‐100mm,
respectively) had moisture contents higher than what is considered acceptable chips (20‐
40mm).
Spinelli et al. (2011) determined particle‐size distribution, fiber and bark content, and
heating value of a wide sample of wood chips collected from 60 operating commercial biomass
terminals in northern Italy. High quality (clean, dry) and low cost biomass feedstock from
sawmill residues were the preferred feedstock for bioenergy facilities. This study found that
logging residues such as tops and branches could be obtained at a low cost, but did not match
the same quality specifications. Small conifer and broadleaf trees from thinning operations and
broadleaf trees from traditional coppice stands provide good product quality, but were costly
to harvest.
Ragland et al. (1991) found that thermal property values such as specific heat, thermal
conductivity, and emissivity vary with moisture content, temperature, and degree of thermal
degradation by up to one order of magnitude. The carbon content of dry wood varies from
5
about 47 to 53 percent due to varying lignin and extractives content. Mineral content of wood
is less than 1%, but it can be over 10 times that value in bark. The composition of mineral
matter can vary between and within each tree.
Lehtikangas (2001) tested nine pellet assortments, made of fresh and stored sawdust,
bark and logging residues for moisture content, heating value and contents of ash, sulfur,
chlorine, and Klason lignin. The heating value was highest in logging residue pellets. Ash
content was highest in the bark and logging residue pellets, implying higher sintering risk
compared with sawdust pellets. The results indicated that bark pellets had the highest
durability, whereas sawdust pellets had the lowest. The study concluded that bark and logging
residues are suitable raw materials for pellet production, especially if the ash content is
controlled.
Filbakk et al. (2011) conducted a study on how bark content affected the quality of
pellets. Pellets from pinewood containing zero, five, 10, 30 and 100 percent bark were
produced and their quality parameters were evaluated. Pellets made from pure bark had the
best mechanical properties compared with pellets made of wood containing various
concentrations of bark.
Nurmia and Hillebrand (2007) studied fuel properties of small‐sized whole‐tree fuel
stocks in roadside and in‐stand storages. The significance of pile cover, season, and storage site
on moisture content and heating value of Scots pine (P. sylvestris) and pubescent birch (Betula
pubescence) fuel stocks were observed. When the fuel stocks were placed in a well‐ventilated
location moisture content could be lowered below the 40% mark during one summer period.
Covered the piles had 6% lower moisture content than non‐covered piles. Multi‐tree harvested

6
stemwood with no limbs seasoned equally well as the whole trees both in roadside and in‐
stand trials because the processing of multi‐tree bunches caused some debarking to take place.
As a result, the transpirational drying capability of whole trees was equalized by the
evaporation of moisture via the open wood surface. Both assortments reached moisture
contents below 30% in in‐stand conditions during one summer’s seasoning.
Suadicani and Gamborg (1999) found that when freshly felled trees were chipped, the
loss of plant essential nutrients (calcium, magnesium, potassium and nitrogen) was significantly
greater compared to the removal of nutrients when summer dried trees were chipped. The size
distribution of the chips was significantly improved when the trees were left for summer drying.
The moisture content dropped significantly from an average in the two trials of 57% of total
weight to 42% of total weight after summer drying. The net caloric value per unit of weight
increased significantly in the chips of summer dried wood. Net caloric value based on dry
weight was slightly reduced during the drying period due to the loss of energy rich extractives.
Summer drying ensures reduction in the loss of plant essential nutrients caused by the removal
of biomass from the stand.
Roser et al. (2011 a) investigated methods to promote the natural drying of wood for
bioenergy purposes. The effects on the drying process through covering the wood piles and
partial debarking of stems were tested to identify methods to reduce the moisture content of
the woody material in storage. Drying trials were established in Finland, Italy, and Scotland
utilizing alder, beech, pine, and spruce. The study indicated that natural drying was a practical
and effective method to enhance the energy efficiency of wood based fuel products in all the
regions studied.

7
1.3 Harvesting Operations
A number of different biomass harvesting and transportation system configurations that
can supply renewable energy facilities already exist, but each operates with a different
incoming feedstock (residues, understory, standing trees, etc.), produces a product that differs
in its characteristics (moisture content, particle size and uniformity, ash content, etc.), and
differs in productivity and costs (Hartsough and Yomogida 1996). Few studies have examined
methods that could improve woody biomass characteristics in the field to add value to the
feedstock required by bioenergy facilities.
The timber harvesting and wood supply chain in the United States is globally
competitive and well positioned to add woody biomass to the list of products it delivers.
However, there are some significant issues to be addressed to support these new wood‐using
industries. Most traditional forest industries (paper and building products) purchase their raw
material today on a green ton basis. Unlike some wood consuming mill in the Pacific Northwest
that base payments on bone dry tons, most wood consuming mills in the US South exclusively
use green tons. There are several advantages to this method, including automated weighing of
trucks and the incentive a green ton basis provides to logging contractors to deliver fresh wood
to markets. Fresh wood provides higher pulp and tall oil yields in most pulp processes as well
as limiting checking and blue stain issues with sawtimber. Under existing green ton payment
systems at biomass receiving facilities in the U.S. South, dried material results in lower truck
payloads, thus higher trucking costs when evaluated on a green ton basis.
Different approaches for harvesting woody biomass for energy have been studied for
decades. Koch (1980) described numerous methods for harvesting biomass, including chipping

8
whole trees at the stump, extracting sawlogs at the landing and processing limbs and tops,
chipping residues at a wood consuming mill, and transporting complete boles to a mill for
merchandizing. Arola and Miyata (1981) reported on cost and productivity data for five
different harvesting methods from conventional logging operations to a land clearing operation
for site conversion.
A one‐pass harvesting system harvests all products concurrently. Harvesting and
recovering roundwood and woody biomass are performed in separate passes in a two‐pass
harvesting system. Watson et al. (1986 a) compared a conventional harvesting system with
one and two pass biomass harvesting systems with the one‐pass system having the best
utilization and lowest costs.
Cubbage and Greene (1989) compared estimated costs for seven conventional logging
systems for a variety of conventional and biomass harvests. Highly mechanized systems using
feller‐bunchers and grapple skidders were the least costly. Tract size did not greatly influence
costs but the study design did not evaluate small harvest blocks.
Goulding and Twaddle (1990) studied approaches to improve conventional harvesting
methods that lead to increased production of energy wood as a by‐product of integrated
systems. Economically successful systems were ones where the biomass component was kept
attached to conventional products for as long as possible and increased biomass recovery was a
consequence of improvements to one or more of the conventional harvesting tasks, i.e.
delimbing and bucking.
Puttock (1995) examined two different approaches for estimating costs of producing
conventional products and fuel wood with integrated harvesting systems. A marginal cost

9
approach completely allocates the cost of common harvesting activities such as felling,
forwarding and processing to conventional products, whereas a joint product approach
distributes production costs among conventional products and fuel wood. Production costs are
highly variable depending on the type of harvesting employed and the ratio of conventional
products to fuel wood.
Roser et al. (2011 b) estimated the feasibility and cost level of selected supply chains for
chips. While results showed that supply chains have to be tailored to local conditions, distance
from receiving facilities, and product quality, overall, chipping at the landing seems was the
best option. Angus‐Hankin et al. (1995) studied various forms of fuel wood transportation
systems, comparing their costs and payloads. The inherent low bulk density of woody biomass
was a substantial drawback to reaching the maximum legal weight before exceeding legal truck
and/or trailer dimensions. Moreover, a desire to minimize moisture content to increase
product quality of the material prior to transport placed further constraints on achieving
optimal truck payloads.
A GIS‐based model for energy wood supply chains simulated costs for several supply
chains in a study area in eastern Finland and found that more simple supply chains such as
transporting loose residues by truck and chipping at the plant offered the lowest total costs at
haul distances less than 60 kilometers. The amount of packing density and the ability to use full
load capacity were more important for haul distances over 60 kilometers (Tahvanainen and
Anttila 2011).
Yoshioka et al. (2006) developed and monitored a harvesting and transporting system
for logging residues to determine the feasibility of the system based on cost, energy, and CO2.

10
Their results suggested that a chipper should be incorporated into the system as early as
possible and that high capacity trailers and highly‐maintained forest roads were effective
measures to reduce the total cost.
Patterson et al. (2011) examined five forest biomass collection systems. Two of the
systems utilized a chipper, one with thinning material and one with thinning residues. The
other three systems utilized horizontal grinders to process roundwood logging residues. The
chipping systems produced material with a higher energy content (8,168 vs. 7,785 BTU/lb) and
lower ash content (1.2% vs. 4.5%) than the material produced by grinding systems processing
roundwood residues.
1.4 Forest Landowners
Ninety percent of responding family and institutional forest landowners and public
forestland managers in the U.S. South reported a willingness to sell to energy facilities if
desirable prices were offered and all owners who previously sold timber to an energy facility
were satisfied with the experience. Only 3.5% of respondents were unwilling to sell timber to
an energy company, with only one of these respondents listing timber production as a primary
objective (Conrad et al. 2011).
An Alabama survey indicated that most family forest landowners were willing to supply
both timber and harvest residues for energy production with their willingness positively
correlated with owned acreage, valuable markets, and the opportunity to contribute to local
economic development and global climate change. Three‐quarters of the Alabama respondents
indicated willingness to manage their land for biomass production, compared with 43% of
respondents who actively managed their land (Paula et al. 2011).
11
A study to assess factors affecting Arkansas, Florida, and Virginia nonindustrial private
forest landowners’ willingness to supply woody biomass for bioenergy showed that the
majority of the landowners in the study area regarded energy security as critical for both
national security and a healthy economy. A significant number of landowners were either
uncertain or not familiar with the idea of producing alternative energy from cellulosic biomass.
Older forest landowners were skeptical about wood‐based energy, but the study’s “willingness
to supply” model indicated that younger landowners with large timber holdings were more
likely to supply woody biomass. Landowners with wildlife management objectives were likely
to supply woody biomass (Joshi and Mehmood 2011).
Forest landowners in Sweden reported that the price paid for forest biomass did not
determine whether or not they would sell their forest biomass material. Potential losses in soil
productivity negatively influenced their decision to sell the material and Swedish forest
landowners who do sell reported that clearing the forest floor from residues was the primary
reason (Bohlin and Roos 2002).
Recovering biomass presents forest landowners with an opportunity to utilize this
material instead of piling and/or burning it prior to replanting. Furthermore, this practice tends
to increase the plantable area and studies have shown that recovering harvesting residues and
unmerchantable stems may reduce site preparation cost (Miller et al. 1987, Watson et al. 1986
(b), Ragan et al. 1987, Watson and Stokes 1989, and Westbrook 2008). Watson and Stokes
(1989) reported a 25% reduction in site preparation cost due to the removal of residues and
unmerchantable stems. Westbrook (2008) found up to 38% reduction in site preparation costs
when understory material was removed from the site during harvesting.

12
Some concerns for forest landowners regarding energy wood harvesting were the
removal of excessive amounts of logging residue because of perceived negative effects to
wildlife habitat, nutrient cycling, and water quality. A study conducted in Maine by Briedis et al.
(2011) found that an average of 45% of the logging residue was left on sites harvested for
traditional forest products and energy wood and between 16 and 50% was left on skid trails.
Shorter rotations and an increase in utilization could lower site nutrient availability.
Management of site nutrients via fertilization increases in importance as the proportion of
nutrients removed increases unless nutrients are not a limiting factor on particular sites. The
potential loss of nutrients from a site largely depends upon the distribution of biomass
component such as stems, bark, branches, and foliage. The increase in loss of nutrients in
harvested materials accompanying a change in utilization standards depends upon the
distribution of biomass between the various components of the forest: stemwood, stembark,
the stump (unharvested portion of the bole), branches of various dimensions, roots of various
dimensions, and foliage (Kimmins 1977).
Some southern U.S. pine forests that are relatively unproductive prior to harvesting may
be at risk of further productivity losses due to intensive harvesting treatments with slash
removal and fertilization is often required to improve site productivity (Scott and Dean 2006).
1.5 References
Aguilar, F. and H.E. Garrett. 2009. Perspectives of woody biomass for energy: Survey of state foresters, state energy biomass contacts, and National Council of Forestry Association executives. Journal of Forestry 107(6):297‐306. Angus‐Hankin, C., B. Stokes, and A. Twaddle. 1995. The transportation of fuelwood from forest to facility. Biomass and Bioenergy 9(1‐5):191‐203.

13
ANSI/ASABE Standards. 2011. American Society for Agricultural & Biological Engineers, St. Joseph, MI: ASABE S593.1. Arola, R.A. and E.S. Miyata. 1981. Harvesting wood for energy. US For. Serv. Res. Pap. NC‐200. 25p. Bohlin, F. and A. Roos. 2002. Wood fuel supply as a function of forest owner preferences and management styles. Biomass and Bioenergy 22(4):237–249. Boundy, B., S. Diegel, L. Wright, and S. Davis. 2011. Biomass energy data book: edition 4. Oak Ridge National Laboratory, Oak Ridge, Tennessee, USA. Briedis, J.I., J.S. Wilson, J.G. Benjamin, and R.G. Wagner. 2011. Biomass retention following whole‐tree, energy wood harvests in central Maine: Adherence to five state guidelines. Biomass and Bioenergy 35(8):3552–3560. Conrad, J.L., M.C. Bolding, R.L. Smith, and W.M. Aust. 2011. Wood‐energy market impact on competition, procurement practices, and profitability of landowners and forest products industry in the U.S. South. Biomass and Bioenergy 35(1):280‐287. Cubbage, F.W. and W.D. Greene. 1989. Conventional and biomass harvesting costs by forest tract size. Biomass 20(3‐4):219‐228. Evans, A.M. 2008. Synthesis of knowledge from woody biomass removal case studies. Santa Fe, NM. The Forest Guild. 39p. Filbakk, T., R. Jirjis, J. Nurmi, and O. Høibø. 2011. The effect of bark content on quality parameters of Scots pine (Pinus sylvestris L.) pellets. Biomass and Bioenergy 35(8):3342–3349. Goulding, C.J. and A.A. Twaddle. 1990. Harvesting whole trees with processing and log allocation (in the forest) to conventional and energy products. Biomass. 22(1‐4):145‐158. Hartsough, B., D. Yomogida. 1996. Compilation of state‐of‐the‐art mechanization technologies for short‐rotation woody crop production. Davis, CA: University of California, Biological and Agriculture Engineering Department. In cooperation with: Electric Power Research Institute; U.S. Department of Agriculture, Forest Service, Southern Research Station. 66 p. Ince, P.J. 1979. How to estimate recoverable heat energy in wood or bark fuels. USDA For. Serv. Gen. Tech. Rep. FPL 29. Forest Products Lab., Madison, WI. 10 p. Joshi, O. and S.R. Mehmood. 2011. Factors affecting nonindustrial private forest landowners’ willingness to supply woody biomass for bioenergy. Biomass and Bioenergy 35(1):186‐192.

14
Kimmins, J.P. 1977. Evaluation of the consequences for future tree productivity of the loss of nutrients in whole‐tree harvesting. Forest Ecology and Management 1(1976‐1977):169‐183. Klepac, J., B. Rummer, and F. Seixas. 2008. Seasonal effects on moisture loss of loblolly pine. Proc. of the 31st Annual Meeting of the Council on Forest Engineering, Charleston, SC, June 2008. 53‐61. Kristensen, E.F. and P.D. Kofman. 2000. Pressure resistance to air flow during ventilation of different types of wood fuel chip. Biomass and Bioenergy 18(3):175–180. Koch, P. 1980. Harvesting energy chips from forest residues—Some concepts from the southern pine regions. US For. Serv. Gen. Tech. Rep. CO‐33. 25p. Lehtikangas, P. 2001. Quality properties of pelletised sawdust, logging residues and bark. Biomass and Bioenergy 20(5):351‐360. Miller, D.E., T.J. Straka, B.J. Stokes, and W.F. Watson. 1987. Productivity and cost of conventional understory biomass harvesting systems. Forest Products Journal 37(5):39‐43. Narodoslawsky, M. and I. Obernberger. 1996. From waste to raw material—the route from biomass to wood ash for cadmium and other heavy metals. Journal of Hazardous Materials 50(2‐3):157‐168. Nurmia, J. and K. Hillebrand. 2007. The characteristics of whole‐tree fuel stocks from silvicultural cleanings and thinnings. Biomass and Bioenergy 31(6):381–392. Obernberger, I., F. Biedermann, W. Widmann, and R. Riedl. 1997. Concentrations of inorganic elements in biomass fuels and recovery in the different ash fractions. Biomass and Bioenergy. 12(3):211‐224. Öhman, M., C. Boman, H. Hedman, A. Nordin, and D. Boström. 2004. Slagging tendencies of wood pellet ash during combustion in residential pellet burners. Biomass and Bioenergy 27(6): 585–596. Patterson, D, J. Hartley, and M. Pelkki. 2011. Size, moisture content, and British thermal unit value of processed in‐woods residues: five case studies. Forest Products Journal 61(4):316‐320. Paula, A.L., C. Bailey, R.J. Barlow, and W. Morse. 2011. Landowner willingness to supply timber for biofuel: results of an Alabama survey of family forest landowners. Southern Journal of Applied Forestry 35(2):93‐97. Paulrud, S. and Nilsson C. 2004. The effects of particle characteristics on emissions from burning wood fuel powder. Fuel 83(7‐8):813‐821.

15
Pettersson, M. and T. Nordfjell. 2007. Fuel quality changes during seasonal storage of compacted logging residues and young trees. Biomass and Bioenergy 31(11‐12):782‐792. Puttock, G.D. 1995. Estimating cost for integrated harvesting and related forest management activities. Biomass and Bioenergy 8(2):73‐79. Ragan, J.R., W.F. Watson, and B.J. Stokes. 1987. Impact of intensive utilization of regeneration operations. Proceedings of the 1987 International Winter Meeting of the American Society of Agricultural Engineers. St. Joseph, MI. p 1‐23. Ragland, K.W. and D. J. Aerts. 1991. Properties of wood for combustion analysis. Bioresource Technology 37(2):161‐168. RISI. 2011. Wood Biomass Market Report. August 2011. 4(8):7 p. (a) Röser, D., B. Mola‐Yudego, L. Sikanen, R. Prinz, D. Gritten, B. Emer, K. Väätäinen, and A. Erkkilä. 2011. Natural drying treatments during seasonal storage of wood for bioenergy in different European locations. Biomass and Bioenergy 35(10):4238–4247. (b) Röser, D., L. Sikanen, A. Asikainen, H. Parikka, and K. Väätäinen. 2011. Productivity and cost of mechanized energy wood harvesting in Northern Scotland. Biomass and Bioenergy 35(11):4570–4580. Sarenbo, S. 2009. Wood ash dilemma‐reduced quality due to poor combustion performance. Biomass and Bioenergy 33(9):1212‐1220. Scott, D.A. and T.J. Dean. 2006. Energy trade‐offs between intensive biomass utilization, site productivity loss, and ameliorative treatments in loblolly pine plantations. Biomass and Bioenergy 30(12):1001–1010. Spinelli, R., C. Nati, L. Sozzi, N. Magagnotti, and G. Picchi. 2011. Physical characterization of commercial woodchips on the Italian energy market. Fuel 90(6):2198–2202. Stokes, B.J., T.P. McDonald, and T. Kelley. 1993. Transpirational drying and costs for transporting woody biomass – a preliminary review. Proc. of IEA/BA Task IX, Aberdeen, UK. 16 p. Suadicani, K. and C. Gamborg. 1999. Fuel quality of whole‐tree chips from freshly felled and summer dried Norway spruce on a poor sandy soil and a rich loamy soil. Biomass and Bioenergy 17(3):199‐208. TAPPI. 1985. Sampling and preparing wood for analysis. T 257 cm‐85. 5 p.
16
Tahvanainen, T. and P. Anttila. 2011. Supply chain cost analysis of long‐distance transportation of energy wood in Finland. Biomass and Bioenergy 35(8):3360–3375. van den Broek, R., A. Faaij, and A. van Wijk. 1996. Biomass combustion for power generation. Biomass and Bioenergy 11(4):271‐281. (a) Watson, W.F., B.J. Stokes, and I.W. Savelle. 1986. Comparisons of two methods of harvesting biomass for energy. Forest Products Journal 36(4):63‐68. (b) Watson, W.F., D.E. Miller, B.J. Stokes, and M.L. Broussard. 1986. Energy budget for an energywood harvesting system. Proceedings of the 1986 Southern Forest Biomass Workshop. Norris, TN. Tennessee Valley Authority. p. 103‐105. Watson, W.F. and B.J. Stokes. 1989. Harvesting small stems – a Southern USA perspective. Proceedings of the International energy Agency. Auburn, AL. USDA For Serv So Res Sta. p. 131‐139. Westbrook, M.D. 2008. Forest biomass recovery by adding small chippers to tree‐length harvesting systems in planted pine stands of the southern USA. M.S. Thesis. The University of Georgia. 59 p. Wu, M.R., D.L. Schott, and G. Lodewijks. 2011. Physical properties of solid biomass. Biomass and Bioenergy 35(5):2093‐2105. Yoshioka, T., K. Aruga, T. Nitami, S. Hideo, and H. Kobayashi. 2006. A case study on the costs and the fuel consumption of harvesting, transporting, and chipping chains for logging residues in Japan. Biomass and Bioenergy 30(4):342‐348. Young, H.E. 1980. Biomass utilization and management implications. Weyerhaeuser Science Symposium 3, Forest‐to‐Mill Challengers of the Future. Weyerhaeuser. 16 p.

17
CHAPTER 2
TRANSPIRATIONAL DRYING EFFECTS ON ENERGY AND ASH CONTENT
FROM WHOLE‐TREE SOUTHERN PINE PLANTATION CHIPPING OPERATIONS1
_________________________________
1 Cutshall, J.B, W.D. Greene, and S.A. Baker. Accepted by Southern Journal of Applied Forestry. Reprinted here with permission of the publisher.
18
TRANSPIRATIONAL DRYING EFFECTS ON ENERGY AND ASH CONTENT
FROM WHOLE‐TREE SOUTHERN PINE PLANTATION CHIPPING OPERATIONS
2.1 ABSTRACT
Wood energy facilities prefer clean, dry raw material to maximize energy content and minimize
the ash remaining after combustion. We allowed felled loblolly pine trees to transpirationally
dry in‐field for 4 and 8 weeks during late summer in central Georgia. We then compared costs
of whole‐tree chipping and transportation as well as the energy, ash, bark, and nutrient
contents of the chips produced. Moisture content was reduced from 53% for freshly felled
trees to 43% and 39% for trees allowed to dry for 4 and 8 weeks, respectively. Transpirational
drying did not significantly change the ash content (<0.7%). Truck payloads were 16% and 24%
lower for material dried 4 and 8 weeks compared to green material, thus increasing hauling
costs by $0.80 per ton (field condition) for each subsequent 4‐week drying period. Drying
increased the energy content of delivered chips by approximately 1,200 BTU/lb. While drying
stems up to eight weeks increased on‐board costs $0.68 on a field ton basis, it reduced those
costs by $7.83 on a bone dry ton basis and by $0.47 on a million BTU basis. Transpirational
drying for 4 weeks or more appears to be a promising method for increasing the energy content
without increasing the ash content of woody feedstocks.
Keywords: biomass, harvesting, cost, transpirational drying, energy content

19
2.2 INTRODUCTION
Higher market prices for fossil fuels, as well as proposed policy changes to support
renewable energy use and reduce carbon emissions, have recently led to a large number of
bioenergy projects that will consume woody biomass. Projects recently announced for North
America will substantially increase wood energy capacity and will potentially consume more
than 60 million green tons of wood biomass feedstock (RISI 2011). A survey of top state
forestry officials identified the highly capital intensive nature of harvesting and transportation
of woody biomass from forests as the top constraint to expanding this new industry (Aguilar
and Garrett 2009).
Harvesting systems that could supply renewable energy facilities already exist, but each
operates with a different incoming feedstock (residues, understory, standing trees, etc.) and
produces a product that differs in its characteristics (moisture content, particle size and
uniformity, ash content, etc.). Few studies have examined methods that could improve woody
biomass characteristics in the field to add value to the feedstock required by bioenergy facilities
(Stokes et al. 1993, Pettersson and Nordfjell 2007, Klepac et al. 2008, Patterson et al. 2010,
Patterson et al. 2011).
The timber harvesting and wood supply chain in the United States is globally
competitive and well positioned to add woody biomass to the list of products it delivers.
However, there are some significant issues to be addressed to support these new wood‐using
industries. Most traditional forest industries (paper and building products) purchase their raw
material today on a green ton basis. Unlike some wood‐consuming mills in the Pacific
20
Northwest that base payments on bone dry tons, most wood‐consuming mills in the US South
exclusively use green tons.
There are several advantages to this method, including automated weighing of trucks
and the incentive a green ton basis provides to logging contractors to deliver fresh wood to
markets. Fresh wood provides higher pulp and tall oil yields in most pulp processes as well as
limiting checking and blue stain issues with sawtimber. Under existing green ton payment
systems at biomass receiving facilities in the U.S. South, dried material results in lower truck
payloads, thus higher trucking costs.
Where woody biomass feedstocks will be combusted to provide energy it is generally
advantageous to have low moisture content to increase their potential energy value (BTU). A
higher energy value more often than not results in greater burning efficiency. Wood energy
markets (biorefineries, pellet manufacturers, wood‐fired electric plants, and wood to liquid fuel
processes) are often interested in procuring raw material that has lower moisture content than
green wood in order to obtain a higher energy value or to reduce drying costs during
manufacture. The transportation of bioenergy feedstocks is inherently more costly than fossil
fuels because per unit energy density of fossil fuels is two to three times that of biomass (Young
1980). Each 10% reduction in moisture content can increase the energy content of the wood by
approximately 850 BTU (Ince 1979). Freshly felled trees have a moisture content of
approximately 50% (wet basis) – this varies somewhat by species and region – but if allowed to
dry for at least four weeks before delimbing and processing, moisture content can be reduced
to as little as 30‐35% (Stokes et al. 1993). This delayed delimbing and bucking is known by
several names but we will refer to it as transpirational drying. Loblolly pine (Pinus taeda L.)

21
stems dry at a greater rate with limbs intact than as delimbed stems, they dry more during
summer months, and most moisture reduction occurs during the first 30 days drying (Klepac et
al. 2008).
Wider use of transpirational drying could have several significant benefits for wood
energy markets. For example, it lowers moisture content without consuming any wood or fossil
energy. It also eliminates the need to transport the water contained in green material, thus
increasing the net energy content of each truck payload. This could lead to fewer truck trips
needed to move the same energy content to markets, thus saving fuel and further improving
net energy ratios. On the other hand, drier material will weigh less and unless trucking
equipment is modified to compensate this can lead to truck payloads that are less than the
legally allowed maximum. In addition, logging contractors commonly report a much shorter
operating life for chipper knives between sharpening when processing dried material, which
increases maintenance costs and reduces knife life. This can also reduce chipper productivity
due to reduced mechanical availability. Finally, chipping drier material could negatively impact
fuel consumption per green ton if the chipper increases the amount of work to produce the
same volume.
While reducing moisture content is important, keeping ash content low in combustible
woody fuels is also vital. Woody biomass with higher ash content is considered to have poorer
quality because it results in poorer combustion performance, and increases maintenance and
disposal costs caused by glass or slag (heavy) deposits formed within some burning mechanisms
(Sarenbo 2009). The biomass harvesting system employed, the type of woody biomass
material, and the manner and duration of how woody biomass is stored and/or piled on‐site are
22
all factors that can affect moisture and ash content (Obernberger et al. 1997, Pettersson and
Nordfjell 2007). Öhman et al. (2004) observed ash content for different types of woody
biomass used to make pellets and found that while ash deposits were affected both by burner
and feedstock types, stem wood based material produced less ash than bark and logging
residues. The wood pelletizing process is less forgiving of ash, as is the burning of woody
biomass in stoker grate boilers where slag deposits are prone to form. More technologically
advanced circulating fluidized bed boilers tolerate a greater amount of ash than stoker grate
boilers (van den Broek et al. 1996).
This study assessed if increased drying times for loblolly pine were correlated with
reduced moisture content while not increasing ash content, in addition to the effect of in‐field
drying on chip properties such as particle size, bark content, and nutrient content. The study
also assessed how transpirational drying of trees up to 8 weeks impacts harvesting production
and costs per ton and per unit of energy content.
2.3 METHODS
The study was conducted from August through October 2010 on a 113‐acre, 14 year‐old
loblolly pine stand in Jones County, Georgia that was scheduled for a first commercial thinning
using a row plus selection method. The harvesting system consisted of a Tigercat 718 rubber‐
tired feller‐buncher, a Caterpillar 525 grapple skidder, a Tigercat 230B knuckleboom loader, and
a 600‐horsepower Morbark 40/36 drum‐style chipper. The stand was divided into three
roughly 37 acre harvest units that were randomly assigned to one of three harvest treatments.
Trees from rows (or corridors) on two 37‐acre units were felled and bunched in the harvested
row and allowed to transpirationally dry for four and eight weeks, respectively, prior to

23
chipping. After drying, trees were skidded to the landing by the grapple skidder and chipped
during a commercial first thinning of the entire stand. The feller‐buncher thinned a third unit
(approximately 37 acres) of green material concurrently with the chipping operation to provide
a comparison of freshly felled trees to the transpirationally dried material. The whole‐tree
chips produced from the study were delivered to a local pulp mill for use as boiler fuel.
We obtained climate data, including daily temperature, precipitation, and relative
humidity, from the National Weather Service (www.nws.gov) for Macon, GA for each day
during the drying periods. The study site was approximately 15 miles from Macon. We also
located a rain gauge on the study site to monitor weekly rainfall during the drying periods.
Weather radar was monitored to identify rain events on our site that might not be measured at
the Macon station.
To track changes in moisture content during the two drying periods, we removed six 1‐
inch thick disks from the middle of felled trees in each treatment unit on a weekly to
semiweekly basis. Moisture content samples collected from the middle of a tree best represent
whole‐tree moisture content (Antony et al. 2012). Different trees were sampled on each visit.
The disks were weighed immediately in the field, then transferred to a 105ºC oven for a
minimum of 24 hours, and reweighed to determine the field moisture content. We use the
term “field” to reference the moisture content of any material at the time of chipping and use
“green” wood to refer to freshly felled wood with the highest moisture content observed in the
field which served as our control.
To quantify production impacts, we used work sampling and time study methods similar
to those reported by Baker et al. (2010) to record data on the harvesting system. Continuous
24
activity data were recorded separately for each drying treatment. Machine activity codes were
recorded for the chipper on‐site every two minutes for the duration of the field study to
establish mechanical availability, utilization, and sources of delay. These machine activity codes
included chipping, which represented productive time, and various delays such as mechanical
delays, waiting on trucks, waiting on the knuckleboom loader, waiting on trees, waiting with
chipper turned off, and miscellaneous delays. We used a stopwatch to record the time to load
each truck in the field and obtained load weights from weight scale tickets as each load was
delivered. The chipping contractor used chip trailers of various lengths. We measured trailer
dimensions and calculated net pounds per cubic foot instead of total net tons (gross vehicle
weight minus truck and trailer tare weight) to compare truck load weights. We measured the
chipper’s daily fuel consumption with a fuel meter attached to the contractor’s fuel pump.
We collected and prepared all chip samples for laboratory analysis following the
Technical Association of the Pulp and Paper Industry (TAPPI) standard for sampling and
preparing wood for analysis (TAPPI 1985). During the loading of each truck, we used a 6‐inch
diameter PVC pipe with an elbow to collect samples from the chip stream. Samples were
collected several times during the loading of a van and mixed to obtain a composite sample.
From this composite sample we collected one 4‐5 lb grab sample of chips which was placed in a
kraft paper bag. The bag was immediately weighed to determine the field (or wet) weight of
chips. The bags were later transferred to a 105ºC oven for a minimum of 24 hours and
reweighed to determine the field moisture content.
Five dried bags were randomly selected from each harvesting treatment for further
analysis. These bags were fractioned, with roughly one‐eighth of the sample processed through
25
a 1 mm screen Wiley mill and transferred to the University of Georgia Plant, Soil, and Water Lab
for determination of energy, ash, and nutrient concentrations. The remaining contents of the
bag were transferred to a William’s chip size classifier following the TAPPI standard for chip
classification (TAPPI 1999). The sample was oscillated in one dimension for ten minutes to
separate the chips based on their length. Four classification screens with round holes were
used to determine the size distribution: 45 mm, 15 mm, 7 mm, and 3 mm. Foliage was
removed from the sample by hand and weighed separately. Bark was separated by hand and
weighed separately from wood for chips collected on the 45 mm, 15 mm, and 7 mm trays.
We compared production data using analysis of variance with Tukey’s range test used
for means comparison (Oehlert 2000). Production data consisted of field pounds per cubic foot
of trailer, loading time, chipper utilization, and tons per productive machine hour. Wood chip
data were limited to five samples per treatment, necessitating use of Kruskal‐Wallis exact test
for comparison (α < 0.05) (Hollander and Wolfe 1999). Work sampling data were analyzed
using chi‐square test to look for differences in the distribution of work amongst categories (α <
0.05).
Hourly operating costs were calculated using the machine rate approach with 85%
availability assumed for all machinery in each of the three drying periods (Miyata 1980).
Additional assumptions for all machines included: labor rate of $16.00/SMH, labor fringe
expenses of 40% of the base rate of pay, combined interest, insurance, and taxes of 10% of
average annual investment, lubrication costs 37% of fuel expense, and off‐road diesel costs of
$3.40 per gallon. Individual machine assumptions are listed in Table 2.1. We modified a
version of the Auburn Harvesting Analyzer (Tufts et al. 1985) to determine cut‐and‐load costs

26
for each of the three treatments. Adjustments were made to the program to allow for
differences in lab‐derived moisture content, ash content, and BTU (oven dry, o.d.) among
treatments. We considered a “field ton” to be a ton of wood with the observed moisture
content for a specific treatment (green, 4‐week, or 8‐week). A bone dry ton (BDT) is a ton of
wood with zero moisture content. We also evaluated costs on an energy content (million BTU)
basis.
We compared haul costs per field ton‐mile and per field ton for delivering chips to a
facility 50 miles away in trailers 42 feet long. Cost per ton‐mile is the unit of freight
transportation equivalent to a ton of freight moved one mile. Recent analysis of the long‐haul
trucking industry found average cost per mile of $1.49 (Fender and Pierce 2011). We assumed
this base cost and added an additional 15 percent for costs associated with low speed and off‐
road travel.
2.4 RESULTS AND DISCUSSION
Daily temperature averaged 76°F during the 8‐week drying period. The average high
temperature was 89°F and the average low temperature was 63°F. The highest reported
temperature during the 8‐week drying period was 98°F and the lowest was 41°F. During the
first 30 days of the 8‐week drying period, the average high and low temperatures were 93°F
and 68°F, respectively. The average daily temperature was 71°F during the 4‐week drying
period (second 30 days of the 8‐week period) with average high and low temperatures of 85°F
and 56°F, respectively. The highest reported temperature during the 4‐week drying period was
97°F and the lowest was 40°F.

27
Daily relative humidity averaged 66% during the 8‐week drying period, with a high of
98% and low of 41%. Relative humidity averaged 67% during the 4‐week drying period with a
high of 97% and low of 36%.
Rainfall measured by the National Weather Service and verified by the on‐site rain
gauge was 7.1 inches for the 8‐week drying period and 5.2 inches for the 4‐week drying period
(Table 2.2). We observed approximately three inches of rainfall during the first 37 days of the 8‐
week drying period. Over three inches of rain fell on day 38 of the 8‐week drying period which
was day 10 of the 4‐week drying period. Another inch of rain fell over the next three days
which was two weeks prior to the start of the chipping operation.
The tree‐disk samples collected to monitor moisture content while felled trees were
drying showed a high rate of moisture loss during the first 30 days (Table 2.2). This result
agrees with previous findings for transpirational drying in loblolly pine (Stokes et al. 1993,
Klepac et al. 2008). A number of factors could have contributed to the increase (from 31% to
41%) in moisture content for the eight‐week disk samples during the last three weeks of the
study. One disk sample collected on October 11 had a moisture content of 56%, higher than
any other disk sample taken for all treatments. This could have resulted from human error.
Removing this outlier from the data lowered moisture content from 41% to 38%, which more
closely aligned with chips that dried 8 weeks (39%). The position of a thinned row in relation to
sunlight availability, position of sampled stems within the felled piles, daily temperature, and
recent rainfall may have influenced moisture content. Lower average daily temperatures of
approximately 10°F combined with over four inches of rainfall during the final three weeks of
the drying period may have caused an increase in moisture content. Stems dried four weeks

28
maintained a steady reduction in moisture content, unlike the 8‐week‐old disk samples which
showed consistently lower moisture content through the first six weeks before increasing over
the final two weeks. Inferences associated with these different patterns cannot clearly be
explained because we collected a relatively small number of disks (n=6) at each sampling
interval.
Moisture content of the chips varied significantly based on the length of time that
transpirational drying took place (Figure 2.1). Each subsequent four‐week drying period
significantly decreased the moisture content of chips produced (p < 0.05), with the largest
reduction from 53 percent to 43 percent occurring during the first four‐week period. During
the second four‐week period, the moisture content fell another four percent to 39 percent
which was still found to be a statistically significant reduction. Chip sample results differed
slightly from the disk samples (Table 2.2). However, as the chip samples represent larger,
aggregate samples of multiple trees taken throughout the chipping process, we consider them a
better representation of the true average moisture content.
Drying time of the material had a significant impact on the productivity of the chipper as
measured by field tons produced per productive hour (Table 2.3). Chipper productivity
measured in terms of field tons was significantly lower with feedstock dried eight weeks than
with either four‐week‐old or green material (p < 0.05). After converting the material produced
to a dry ton basis the productivity from the green treatment is significantly lower (34 dry
tons/PMH) than from either of the dried treatments (38 dry tons/PMH). This result should be
viewed with caution, because a different loader operator fed the chipper for two of the five
days during the green treatment chipping period. The less experienced replacement loader

29
operator averaged 5 dry tons/PMH lower production than the normal operator (p < 0.05).
Average loading time was 20 minutes for the eight and four week material but was 22 minutes
for the green material.
Utilization data showed that the chipper spent a significantly higher percentage of its
time chipping when in the oldest and driest treatment (eight weeks) compared to either the
four‐week old or green material (p < 0.05). Most of the difference came from mechanical
delays in the green and four‐weeks‐old treatment and handling by a less‐experienced
replacement operator during some of the green treatment. The mechanical delays were not
attributed to the type of material being processed. Given the short timeframe of this study, it is
uncertain that this result would be repeated over a longer time period.
The field weight of chips in pounds per cubic foot (lbs/cu.ft.) of trailer decreased
significantly, from 15.56 field lbs/cu.ft. to 14.50 field lbs/cu.ft. (Table 3), as drying time was
extended from 4 to 8 weeks (p < 0.05). For example, the weight of a 40 foot trailer with a
capacity of 2720 cubic feet would weigh 25.0 tons when loaded with green chips and 19.7 tons
with material allowed to dry for 8 weeks. When examining the weight of materials in the trailer
on a dry‐ton basis, there was no significant difference in the dry pounds per cubic foot among
treatments (8.56, 8.85, and 8.80 lbs/cu.ft.). Thus the volume of material in the trailer did not
differ across the treatments, although the weight was lowered due to the reduced moisture
content.
Insufficient fuel measurements were available to allow for a statistical test of fuel
consumption between the treatments. Observed fuel consumption based on field tons
produced varied little (0.37 gallons per field ton for green material, 0.34 for 4‐week‐old
30
material, and 0.36 for 8‐week‐old material). When based on oven dry tons, fuel consumption
was 0.80 gallons per oven dry ton for green material and 0.60 for both 4 and 8‐week old
material. These consumption differences between the field ton and oven dry ton bases are
explained by the differing moisture contents of each treatment. Furthermore, we observed
that, unlike the regular loader operator, for some of the green treatment, the different
operator did not turn off the chipper while waiting for extended periods of time.
We intended to monitor knife wear, but the duration of the study did not require a
sufficient number of knife changes in any treatment to allow for statistical analysis. Knife
changes were dictated by the crew foreman/chipper operator who changed knives at his
discretion. Both the eight and four week treatments saw knife changes once during the
duration of the study, after ten and fifteen loads respectively, while the knives were not
changed during chipping of the green treatment (28 truck loads). Future studies could be
strengthened to more adequately determine knife wear and its effects on chip quality by
implementing more focused study designs for this particular chipping variable and covering
longer operating periods (Nati et al. 2010).
There were no significant differences in chip size distribution among treatments (Table
2.4), but bark content for the 8‐week drying period (9.0%) was significantly lower than that for
the green and four week material (13.4% and 11.6%, respectively). This was likely due to the
fact that bark tends to loosen and fall off as pine stems get drier. Bark has lower energy
content than “white wood,” so these bark losses may actually improve energy content per oven
dry pound. Foliage, ash content, and nutrient content did not vary by drying time.

31
BTU per field lb was significantly lower (3,737) for material loaded green (freshly
chipped) than that of material dried for the four and eight weeks (4,947 and 4,979,
respectively). However, once water was removed there were no significant differences
between either energy content per o.d. lb or ash content per o.d. lb for chips in the three
treatments. Energy content for chips was consistent with previous tests on pine feedstocks
(Baker et al. 2010). Ash contents of less than one percent are also in‐line with previous studies
on field‐run whole‐tree chips (Baker, et al. 2011). Previous studies did not measure ash content
with transpirationally dried stems, but given its importance, we wanted to determine if it
changed with drying time.
The total costs per scheduled machine hour for the feller‐buncher and skidder were
assumed to be consistent across all three treatments (Table 2.5). Total cost/SMH for the
chipper and knuckleboom loader were lower for processing green material than for material
dried four or eight weeks due to slightly lower utilization necessary to handle green material.
Total cost/SMH for the operation increased 3% when handling 4‐week‐old material and 4.5%
when handling 8‐week‐old material, compared against chipping green material.
The cost per loaded field ton for harvesting material dried four and eight weeks was
higher at $18.77 (2.3%) and $18.98 (3.7%), respectively, than for harvesting green material
($18.30). These costs include $4.31 per ton in overhead and profit. Average truck payloads (for
a 42‐foot trailer) were 26.46 field tons for green material, 22.26 for 4‐week material, and 20.16
for 8‐week material (Table 2.6). Transport costs per field ton‐mile were highest for 8‐week‐old
material at $0.17, followed by 4‐week‐old and green material at $0.15 and $0.13, respectively.

32
Costs per field ton for a 50‐mile haul had similar results. Transporting 8‐week material cost the
most at $8.48, followed by $7.68 for 4‐week material, and $6.46 for green material.
Conversely, the cost per loaded bone dry ton (BDT) for harvesting green material was
about 25% higher ($38.94) than for harvesting material dried eight weeks ($31.11). Cost per
loaded BDT was $32.93 for harvesting material dried four weeks. Truck payloads did not differ
between the three treatments on a BDT basis (Table 2.3), thus transport costs per BDT are the
same at about $0.28 per BDT‐mile or between $13.57 and $14.04 per BDT for a 50‐mile haul
distance.
Delivered costs on a field ton basis for eight‐week‐old material were 10.8% higher
($27.48) than for green material ($24.80), with $2.00 of the cost difference resulting from
hauling cost differences. On a dry ton basis, however, there were no transport cost differences
between treatments, and green material delivered cost was 17.4% higher ($52.94) than
material dried 8 weeks ($45.11). Hourly production efficiency driven by moisture content
contributed less to cost differences than truck payload differences. Opting for higher volume
capacity truck and trailer combinations to maximize legal truck payloads offers an opportunity
to offset some of the costs associated with delivering dried woody biomass. If full legal
payloads could be hauled from each of the three treatments, much of the cost disparity derived
from a field ton comparison would disappear, while the cost advantages of drier material would
increase based on a BDT comparison.
Whereas cost per loaded field ton was higher for dried material compared with green
material, the cost per loaded mmBTU was highest for green material at $2.39, followed by
$1.99 for 4‐week material, and $1.92 for 8‐week material. Truck payloads per mmBTU did not

33
differ between treatments with each treatment averaging roughly 200 mmBTU per load.
Hauling costs were $0.86 per mmBTU in each treatment. Allowing stems to transpirationally
dry for up to 8 weeks significantly reduced moisture content and increased energy value, thus a
lower cost per loaded mmBTU should be expected.
2.5 SUMMARY
Transpirational drying in late summer for periods of at least four weeks resulted in
significant reductions in moisture content with no increase in ash content of the feedstock
produced. The first four weeks of drying resulted in the greatest reduction in moisture content
(from 53% to 43%) with the additional four weeks producing a smaller, but still significant
reduction to 39%.
Chipping productivity as measured in field tons per hour was greatest for green
material, but when compared in bone dry tons, the drying treatments produced slightly more
than the green treatment (38 BDT/hr vs 34 BDT/hr). This result translated to widely different
costs for material depending upon the unit of measure. The current convention in southern
timber operations pays for material on a green ton basis, in which case significant savings are
possible by harvesting and chipping green material. Much of this savings is due to transport
cost, which is higher in dried material due to an inability to obtain full legal payloads.
Examining material on a dry ton or mmBTU basis, however, changes the cost implications
substantially. Dried material represented a reduction in cost on a BDT or energy content basis
of roughly 15%. Improvements in trucking infrastructure could allow for full utilization of legal
payloads for dried chips and further increase these cost savings.

34
Chip size distribution, ash content, nutrient content, and amount of foliage did not
significantly differ among treatments. Bark content was significantly lower only for material
dried for 8 weeks as compared to 4 weeks or freshly felled. This was likely due to bark slippage
occurring during skidding and loading activities. While oven dry energy values for chips did not
differ significantly between treatments, energy content on a field condition basis were over
30% higher for chips produced from material dried at least 4 weeks compared to green
material.
Using transpirational drying in woody biomass harvesting operations may improve
product quality by increasing energy values without increasing ash content. Trees that have
been dried in the field to reduce moisture content cost more to harvest and transport than
fresh material when based on a wet or field condition ton basis, but will cost less when based
on energy content. Harvesting firms that deploy this strategy in a wood supply system that
utilizes an energy content payment system, as opposed to a wet weight‐based payment system,
could take advantage of potential economic advantages of transpirationally drying stems in the
field before processing and transportation.
2.6 ACKNOWLEDGEMENTS
This study was funded by financial support from the Southeastern SunGrant Center associated
with the US Department of Energy and US Department of Agriculture.
2.7 REFERENCES
Aguilar, F. and H.E. Garrett. 2009. Perspectives of woody biomass for energy: Survey of state foresters, state energy biomass contacts, and National Council of Forestry Association executives. Journal of Forestry. 107(6):297‐306.

35
Antony, F., L. Schimleck, and R. Daniels. 2012. Identification of representative sampling heights for specific gravity and moisture content in plantation‐grown loblolly pine (Pinus taeda). Canadian Journal of Forest Research. 42(3): 574‐584. Baker, S.A., M.D. Westbrook, and W.D. Greene. 2010. Evaluation of integrated harvesting systems in pine stands of the southern United States. Biomass and Bioenergy. 34(5):720‐727. Baker, S.A., W.D. Greene, and A. Wilson. 2011. Fuels characteristics of woods‐run whole tree southern pine chips. Biomass and Bioenergy. 37: 67‐72. Fender, K.J. and D.A. Pierce. 2011. An analysis of the operational costs of trucking: A 2011 update. American Transportation Research Institute, Arlington, VA. 25 p. Hollander, M. and D. Wolfe. 1999. Nonparametric statistical methods. 2nd Edition. Wiley and Sons. New York, NY. 787 p. Ince, P.J. 1979. How to estimate recoverable heat energy in wood or bark fuels. USDA For. Serv. Gen. Tech. Rep. FPL 29. Forest Products Lab., Madison, WI. 10 p. Klepac, J., B. Rummer, and F. Seixas. 2008. Seasonal effects on moisture loss of loblolly pine. Proc. of the 31st Annual Meeting of the Council on Forest Engineering, Charleston, SC, June 2008. 53‐61. Miyata, E.S. 1980. Determining fixed and operating costs of logging equipment. USDA Forest Serv. TR‐NC‐55, North Central Expt. Sta., St. Paul, MN. 14 p. Nati, C., R. Spinelli, and P. Fabbri. 2010. Wood chips size distribution in relation to blade wear and screen use. Biomass and Bioenergy. 34(5):583‐587. Obernberger, I., F. Biedermann, W. Widmann, and R. Riedl. 1997. Concentrations of inorganic elements in biomass fuels and recovery in the different ash fractions. Biomass and Bioenergy. 12(3):211‐224. Oehlert, G.W. 2000. A first course in design and analysis of experiments. W.H. Freeman and Company. New York. 600 p. Öhman, M., C. Boman, H. Hedman, A. Nordin, and D. Boström. 2004. Slagging tendencies of wood pellet ash during combustion in residential pellet burners. Biomass and Bioenergy. 27(6): 585–596. Patterson, D., J. Hartley, M. Pelkki, and P. Steele. 2010. Effects of 9 Months of Weather Exposure on Slash Bundles in the Mid‐South. Forest Products Journal. 60(3):221‐225.
36
Patterson, D, J. Hartley, and M. Pelkki. 2011. Size, moisture content, and British thermal unit value of processed in‐woods residues: five case studies. Forest Products Journal. 61(4):316‐320. Pettersson, M., and T. Nordfjell. 2007. Fuel quality changes during seasonal storage of compacted logging residues and young trees. Biomass and Bioenergy. 31(11‐12):782‐792. RISI. 2011. Wood Biomass Market Report. August 2011. 4(8):7 p. Sarenbo, S. 2009. Wood ash dilemma‐reduced quality due to poor combustion performance. Biomass and Bioenergy. 33(9):1212‐1220. Stokes, B.J., T.P. McDonald, and T. Kelley. 1993. Transpirational drying and costs for transporting woody biomass – a preliminary review. Proc. of IEA/BA Task IX, Aberdeen, UK. 16 p. TAPPI. 1985. Sampling and preparing wood for analysis. T 257 cm‐85. 5 p. TAPPI. 1999. Natural dirt in wood chips. T 265 cm‐99. 8 p. Tufts, R.A., B.L. Lanford, W.D. Greene, and J.O. Burrows. 1985. Auburn harvesting analyzer. The Compiler 1985. Forest Resources Systems Institute, Florence, AL. 3(2):14–5. van den Broek, R., A. Faaij, and A. van Wijk. 1996. Biomass combustion for power generation. Biomass and Bioenergy. 11(4):271‐281. Young, H.E. 1980. Biomass utilization and management implications. Weyerhaeuser Science Symposium 3, Forest‐to‐Mill Challengers of the Future. Weyerhaeuser. 16 p.

37
Table 2.1. Machine rate assumptions and cost inputs by machine.
Machine
Purchase Price
Salvage Value
Economic Life (yrs)
Availability (%SMH)
Fuel
(gal/PMH)
Maintenance &
Repair (% Depreciation)
Chipper
$460,000
30% 5 85% 29.60
90%
Feller‐buncher
$200,000
20%
4
85%
8.14
100%
Skidder
$180,000 25%
4 85% 7.77
90%
Loader $150,000
30% 5 85% 7.40
90%

38
Table 2.2. Observed rainfall and comparison of moisture content for tree disk samples collected periodically during four and eight week drying periods and wood chips harvested fresh and allowed to field dry four and eight weeks.
Disk Samples2
Chip Samples
Date
Rain(in.)
Avg. Temp.
Avg. Rel. Hum.
8 wk disk
4 wk disk
Green disk
8 wk chip
4 wk chip
Green chip
19‐Aug
0 86o1 73%1 46%±2.9 ‐ ‐ ‐ ‐ ‐
14‐Sep
2 81o 70% 36%±3.9 47%±2.7 ‐ ‐ ‐ ‐
24‐Sep
0 79o 64% 31%±6.6 41%±3.5 ‐ ‐ ‐ ‐
1‐Oct
5 72o 74% 40%±5.5 35%±7.3 ‐ ‐ ‐ ‐
11‐Oct
0 64o 64% 41%±7.7 32%±5.3 48%±2.5 39% ‐ ‐
14‐Oct
0 67o 66% ‐ ‐ ‐ ‐ 43% ‐
19‐Oct
0 58o 62% ‐ ‐ ‐ ‐ ‐ 53%
1Average daily temperature and relative humidity for August, 19. Each subsequent value is the average daily measure for the period between sample collection dates. 2Disk sample moisture content plus standard error at 95% confidence.
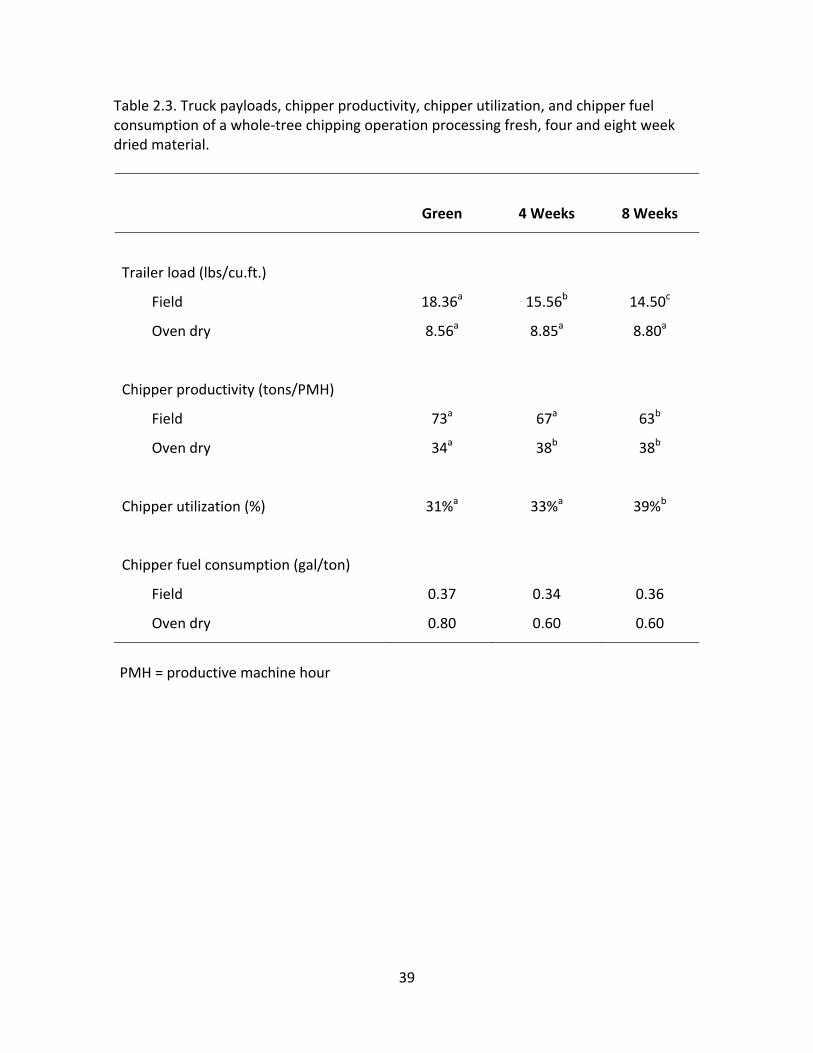
39
Table 2.3. Truck payloads, chipper productivity, chipper utilization, and chipper fuel consumption of a whole‐tree chipping operation processing fresh, four and eight week dried material.
Green
4 Weeks
8 Weeks
Trailer load (lbs/cu.ft.)
Field
Oven dry
18.36a
8.56a
15.56b
8.85a
14.50c
8.80a
Chipper productivity (tons/PMH)
Field
Oven dry
73a
34a
67a
38b
63b
38b
Chipper utilization (%)
31%a
33%a
39%b
Chipper fuel consumption (gal/ton)
Field
Oven dry
0.37
0.80
0.34
0.60
0.36
0.60
PMH = productive machine hour
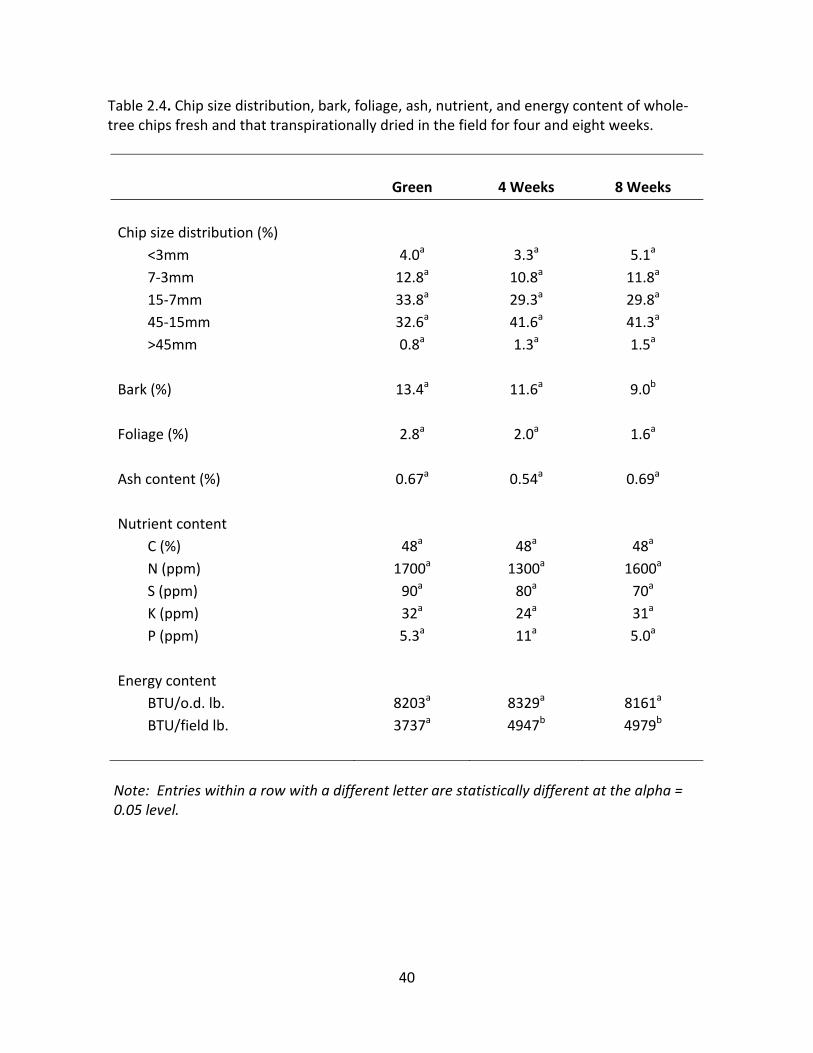
40
Table 2.4. Chip size distribution, bark, foliage, ash, nutrient, and energy content of whole‐tree chips fresh and that transpirationally dried in the field for four and eight weeks.
Green 4 Weeks
8 Weeks
Chip size distribution (%)
<3mm 7‐3mm 15‐7mm 45‐15mm >45mm
4.0a 12.8a 33.8a 32.6a 0.8a
3.3a 10.8a 29.3a 41.6a 1.3a
5.1a 11.8a 29.8a 41.3a 1.5a
Bark (%) 13.4a 11.6a
9.0b
Foliage (%) 2.8a 2.0a
1.6a
Ash content (%) 0.67a 0.54a
0.69a
Nutrient content
C (%) N (ppm) S (ppm) K (ppm) P (ppm)
48a 1700a 90a 32a 5.3a
48a 1300a 80a 24a 11a
48a 1600a 70a 31a 5.0a
Energy content
BTU/o.d. lb. BTU/field lb.
8203a 3737a
8329a 4947b
8161a 4979b
Note: Entries within a row with a different letter are statistically different at the alpha = 0.05 level.
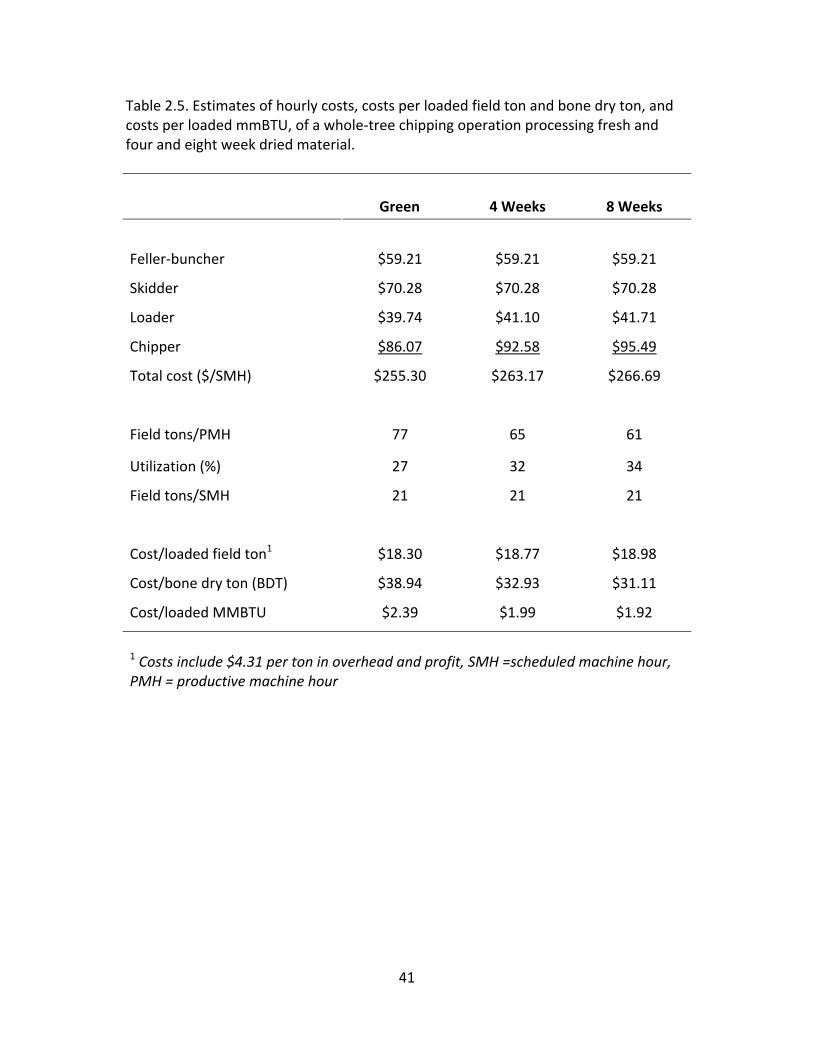
41
Table 2.5. Estimates of hourly costs, costs per loaded field ton and bone dry ton, and costs per loaded mmBTU, of a whole‐tree chipping operation processing fresh and four and eight week dried material.
Green 4 Weeks
8 Weeks
Feller‐buncher
$59.21
$59.21
$59.21
Skidder $70.28 $70.28 $70.28
Loader $39.74 $41.10 $41.71
Chipper $86.07 $92.58 $95.49
Total cost ($/SMH) $255.30 $263.17 $266.69
Field tons/PMH 77 65 61
Utilization (%) 27 32 34
Field tons/SMH 21 21 21
Cost/loaded field ton1 $18.30 $18.77 $18.98
Cost/bone dry ton (BDT) $38.94 $32.93 $31.11
Cost/loaded MMBTU $2.39 $1.99 $1.92
1 Costs include $4.31 per ton in overhead and profit, SMH =scheduled machine hour, PMH = productive machine hour
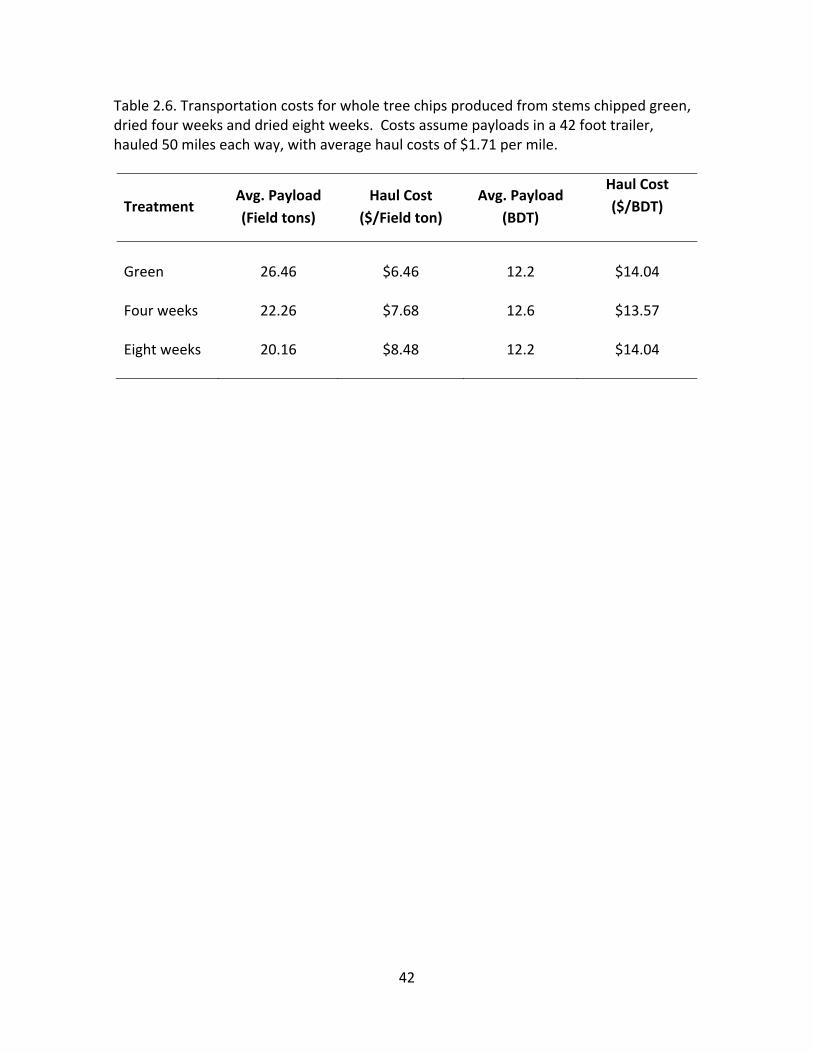
42
Table 2.6. Transportation costs for whole tree chips produced from stems chipped green, dried four weeks and dried eight weeks. Costs assume payloads in a 42 foot trailer, hauled 50 miles each way, with average haul costs of $1.71 per mile.
Treatment Avg. Payload (Field tons)
Haul Cost ($/Field ton)
Avg. Payload (BDT)
Haul Cost($/BDT)
Green
26.46
$6.46
12.2
$14.04
Four weeks
22.26
$7.68
12.6
$13.57
Eight weeks 20.16 $8.48 12.2 $14.04

43
Figure 2.1. Average moisture content of wood chips harvested fresh and allowed to dry four and eight weeks. Values in parenthesis indicate minimum and maximum values. Different letters indicate significantly different values (α < 0.05).
0.00%
10.00%
20.00%
30.00%
40.00%
50.00%
60.00%
Green 4 weeks 8 weeks
Moisture Co
nten
t (% wet basis)
53%a
(49‐57%)43%b
(30‐49%) 39%c
(29‐50%)

44
CHAPTER 3
FACTORS AFFECTING COSTS OF FOREST BIOMASS HARVESTING SYSTEMS
AND THEIR IMPLICATIONS FOR STAKEHOLDERS1
_________________________________
1 Cutshall, J, D. Greene, S. Baker, M. Clutter, J. Siry, and S. Mani. To be submitted to Biomass and Bioenergy.

45
FACTORS AFFECTING COSTS OF FOREST BIOMASS HARVESTING SYSTEMS
AND THEIR IMPLICATIONS FOR STAKEHOLDERS
3.1 ABSTRACT
In this paper we compare a range of likely forest biomass harvesting systems including whole‐
tree chipping, clean chipping, conventional roundwood, and residue grinding to determine how
each system affects woody biomass energy facilities, biomass harvesting firms, and forest
landowners. Data on production and the properties of chip and wood residue products were
used to estimate costs per million BTU for forest biomass harvesting systems including
conventional roundwood, clean chipping, whole‐tree chipping, and screened and unscreened
grinders processing logging and clean chip residue. Delivered costs for these systems were
evaluated for a range of values for moisture content, ash content, tract size, tons of biomass
removed per acre and at grinding decks, truck payload, haul distance, and diesel fuel price.
Delivered cost per mmBTU decreased by over 50% for all systems as moisture content
decreased from 55% to 30%. Whole tree chipping provided the lowest cost option ($4.39 per
mmBTU) at ash content levels less than 1%, and unscreened grinding of clean chip residue
produced the least expensive option at 5% ash ($2.87 per mmBTU). Tract size had minimal
effects on any operation until the acreage declined below 40 acres. Clean chipping and
roundwood systems were considerably more expensive than whole‐tree chipping operations on
all tract sizes. Costs declined significantly as truck payload increased and/or haul distance
decreased. Optimizing truck payload to attain legal weight limits by lowering tare weight

46
and/or increasing trailer volume capacity is an opportunity for forest biomass harvesting system
managers to achieve lower costs especially when dealing with drier material or low‐density
screened roundwood grindings. Fuel price increases directly increase cut and haul costs and
limit economical haul distances accordingly.
Index Words: forest biomass harvesting, chipping, grinding, moisture content, ash content
3.2 INTRODUCTION
Higher market prices for fossil fuels as well as proposed policy changes to support
renewable energy use and to reduce carbon emissions have recently led to a large number of
bioenergy projects being announced which will consume woody biomass. Projects recently
announced for North America could substantially increase wood energy capacity and
potentially consume more than 60 million green tons of woody biomass feedstock (RISI 2011).
Woody biomass from forest residues has long been underutilized due to limited access and high
costs associated with collection and transportation (Evans 2008). A survey of top state forestry
officials recently identified high harvesting and transportation costs for woody biomass from
forests as the top constraint to expanding this new industry (Aguilar and Garrett 2009).
Harvesting systems utilizing whole‐tree chippers and grinders convert woody biomass
into a suitable feedstock for wood energy facilities. A system harvesting roundwood products
typically piles logging slash for later collection by a biomass harvesting system using a grinder or
chipper. In this paper we compare a range of likely forest biomass harvesting systems,
including whole‐tree chipping, clean chipping, conventional roundwood, and residue grinding to

47
determine how each system affects woody biomass energy facilities, biomass harvesting firms,
and forest landowners.
3.2.1 Wood Energy Facilities
The forest products industry today purchases most raw materials on a green ton basis
for convenience and to encourage the delivery of freshly cut wood. Wood energy facilities are
likely to prefer drier raw material to maximize energy content. They also often prefer feedstock
with a minimum of dirt or grit so that the ash remaining after combustion is reduced. Moisture
content and ash content are especially important issues where logging residues such as limbs,
tops, and understory stems are collected because moisture and ash affect energy value. Wood
energy facilities are also concerned with the elemental or nutrient content of woody biomass
feedstocks due to its effect on emissions affecting air quality (Obernberger et al. 1997).
When woody biomass feedstocks will be combusted to provide energy it is
advantageous to have low moisture content to increase their energy value (BTU). The heating
value of any fuel is the energy released per unit mass or per unit volume of the fuel when the
fuel is completely burned (ANSI/ASABE S593.1 2011). Woody biomass has one of the highest
energy contents of all biomass sources with over 25 million BTUs per oven‐dry ton (Boundy et
al. 2011). The moisture content of solid biomass influences the net calorific value and the
combustion efficiency (Kristensen and Kofman 2000). Woody biomass products with particle
sizes too small or too large negatively influence handling, combustion characteristics, and
emissions (Paulrud and Nilsson 2004).
A higher energy value results in greater burning efficiency. Wood energy markets
(biorefineries, pellet manufacturers, wood‐fired electric plants, and wood to liquid fuel
48
processes) are often interested in procuring raw material that has lower moisture content than
green wood to obtain a higher energy value. The transportation of bioenergy feedstocks has
been found to be inherently more costly than fossil fuels because per unit energy density of
fossil fuels is two to three times that of biomass (Young 1980). Each 10% reduction in moisture
content can increase the net energy content of the wood by approximately 850 BTU (Ince
1979). Freshly felled trees have a moisture content of approximately 50% (wet basis) – this
varies somewhat by species and region – but if allowed to dry for at least four weeks before
delimbing and processing, moisture content can be reduced to as little as 30‐35% (Stokes et al.
1993). This delayed delimbing and bucking is known by several names but we will refer to it as
transpirational drying. Loblolly pine (Pinus taeda) stems dry at a greater rate with limbs intact
than as delimbed stems, they dry more during summer months, and most moisture reduction
occurs during the first 30 days of drying (Klepac et al. 2008).
While reducing moisture content is important, keeping ash content low in combustible
woody fuels is also vital. Ash is formed from mineral matter during combustion and can cause
slagging, which is the coating of internal surfaces in boilers from deposition of ash particles. Ash
is a crucial aspect of the concept of sustainable, carbon neutral thermal biomass utilization and
may be recycled where appropriate in forests and on agricultural land or put in a landfill
(Narodoslawsky and Obernberger 1996).
Woody biomass with higher ash content is considered of poorer quality because it
results in poorer combustion performance and increases maintenance and disposal costs
caused by glass or slag deposits formed within some burning mechanisms (Sarenbo 2009). The
biomass harvesting system employed, the type of woody biomass material, and the manner

49
and duration of how woody biomass is stored and/or piled on‐site can all affect moisture and
ash content (Obernberger et al. 1997, Pettersson and Nordfjell 2007). Öhman et al. (2004)
observed ash content for different types of woody biomass used to make pellets and found that
while ash deposits were affected both by burner and feedstock types, stem wood based
material produced less ash than bark and logging residues. The wood pelletizing process is less
forgiving of ash, as is the burning of woody biomass in stoker grate boilers where slag deposits
are prone to form. More technologically advanced circulating fluidized bed boilers tolerate a
greater amount of ash than stoker grate boilers (van den Broek et al. 1996).
Wu et al. (2011) measured moisture content from three different sizes of chips oven
drying them for 24 hours at 105 degrees C and determined size distribution by screening chips
in a horizontal classifier. The smallest and largest size chips (0‐20mm and 40‐100mm,
respectively) had moisture contents higher than what is considered acceptable chips (20‐
40mm).
Spinelli et al. (2011) determined particle‐size distribution, fiber and bark content, and
heating value of a wide sample of wood chips collected from 60 operating commercial biomass
terminals in northern Italy. High quality (clean, dry) and low cost biomass feedstock from
sawmill residues were the preferred feedstock for bioenergy facilities. This study found that
logging residues such as tops and branches could be obtained at a low cost, but did not match
the same quality specifications. Small conifer and broadleaf trees from thinning operations and
broadleaf trees from traditional coppice stands provide good product quality, but were costly
to harvest.

50
Ragland et al. (1991) found that thermal property values such as specific heat, thermal
conductivity, and emissivity vary with moisture content, temperature, and degree of thermal
degradation by up to one order of magnitude. The carbon content of dry wood varies from
about 47 to 53 percent due to varying lignin and extractives content. Mineral content of wood
is less than 1%, but it can be over 10 times that value in bark. The composition of mineral
matter can vary between and within each tree.
Lehtikangas (2001) tested nine pellet assortments, made of fresh and stored sawdust,
bark and logging residues for moisture content, heating value and contents of ash, sulfur,
chlorine, and Klason lignin. The heating value was highest in logging residue pellets. Ash
content was highest in the bark and logging residue pellets, implying higher sintering risk
compared with sawdust pellets. The results indicated that bark pellets had the highest
durability, whereas sawdust pellets had the lowest. The study concluded that bark and logging
residues are suitable raw materials for pellet production, especially if the ash content is
controlled.
Filbakk et al. (2011) conducted a study on how bark content affected the quality of
pellets. Pellets from pinewood containing zero, five, 10, 30 and 100 percent bark were
produced and their quality parameters were evaluated. Pellets made from pure bark had the
best mechanical properties compared with pellets made of wood containing various
concentrations of bark.
Nurmia and Hillebrand (2007) studied fuel properties of small‐sized whole‐tree fuel
stocks in roadside and in‐stand storages. The significance of pile cover, season, and storage site
on moisture content and heating value of Scots pine (P. sylvestris) and pubescent birch (Betula

51
pubescence) fuel stocks were observed. When the fuel stocks were placed in a well‐ventilated
location moisture content could be lowered below the 40% mark during one summer period.
Covered the piles had 6% lower moisture content than non‐covered piles. Multi‐tree harvested
stemwood with no limbs seasoned equally well as the whole trees both in roadside and in‐
stand trials because the processing of multi‐tree bunches caused some debarking to take place.
As a result, the transpirational drying capability of whole trees was equalized by the
evaporation of moisture via the open wood surface. Both assortments reached moisture
contents below 30% in in‐stand conditions during one summer’s seasoning.
Suadicani and Gamborg (1999) found that when freshly felled trees were chipped, the
loss of plant essential nutrients (calcium, magnesium, potassium and nitrogen) was significantly
greater compared to the removal of nutrients when summer dried trees were chipped. The size
distribution of the chips was significantly improved when the trees were left for summer drying.
The moisture content dropped significantly from an average in the two trials of 57% of total
weight to 42% of total weight after summer drying. The net caloric value per unit of weight
increased significantly in the chips of summer dried wood. Net caloric value based on dry
weight was slightly reduced during the drying period due to the loss of energy rich extractives.
Summer drying ensures reduction in the loss of plant essential nutrients caused by the removal
of biomass from the stand.
Roser et al. (2011 a) investigated methods to promote the natural drying of wood for
bioenergy purposes. The effects on the drying process through covering the wood piles and
partial debarking of stems were tested to identify methods to reduce the moisture content of
the woody material in storage. Drying trials were established in Finland, Italy, and Scotland
52
utilizing alder, beech, pine, and spruce. The study indicated that natural drying was a practical
and effective method to enhance the energy efficiency of wood based fuel products in all the
regions studied.
3.2.2 Harvesting Operations
A number of different biomass harvesting and transportation system configurations that
can supply renewable energy facilities already exist, but each operates with a different
incoming feedstock (residues, understory, standing trees, etc.), produces a product that differs
in its characteristics (moisture content, particle size and uniformity, ash content, etc.), and
differs in productivity and costs (Hartsough and Yomogida 1996). Few studies have examined
methods that could improve woody biomass characteristics in the field to add value to the
feedstock required by bioenergy facilities.
The timber harvesting and wood supply chain in the United States is globally
competitive and well positioned to add woody biomass to the list of products it delivers.
However, there are some significant issues to be addressed to support these new wood‐using
industries. Most traditional forest industries (paper and building products) purchase their raw
material today on a green ton basis. Unlike some wood consuming mill in the Pacific Northwest
that base payments on bone dry tons, most wood consuming mills in the US South exclusively
use green tons. There are several advantages to this method, including automated weighing of
trucks and the incentive a green ton basis provides to logging contractors to deliver fresh wood
to markets. Fresh wood provides higher pulp and tall oil yields in most pulp processes as well
as limiting checking and blue stain issues with sawtimber. Under existing green ton payment

53
systems at biomass receiving facilities in the U.S. South, dried material results in lower truck
payloads, thus higher trucking costs when evaluated on a green ton basis.
Different approaches for harvesting woody biomass for energy have been studied for
decades. Koch (1980) described numerous methods for harvesting biomass, including chipping
whole trees at the stump, extracting sawlogs at the landing and processing limbs and tops,
chipping residues at a wood consuming mill, and transporting complete boles to a mill for
merchandizing. Arola and Miyata (1981) reported on cost and productivity data for five
different harvesting methods from conventional logging operations to a land clearing operation
for site conversion.
A one‐pass harvesting system harvests all products concurrently. Harvesting and
recovering roundwood and woody biomass are performed in separate passes in a two‐pass
harvesting system. Watson et al. (1986 a) compared a conventional harvesting system with
one and two pass biomass harvesting systems with the one‐pass system having the best
utilization and lowest costs.
Cubbage and Greene (1989) compared estimated costs for seven conventional logging
systems for a variety of conventional and biomass harvests. Highly mechanized systems using
feller‐bunchers and grapple skidders were the least costly. Tract size did not greatly influence
costs but the study design did not evaluate small harvest blocks.
Goulding and Twaddle (1990) studied approaches to improve conventional harvesting
methods that lead to increased production of energy wood as a by‐product of integrated
systems. Economically successful systems were ones where the biomass component was kept
attached to conventional products for as long as possible and increased biomass recovery was a
54
consequence of improvements to one or more of the conventional harvesting tasks, i.e.
delimbing and bucking.
Puttock (1995) examined two different approaches for estimating costs of producing
conventional products and fuel wood with integrated harvesting systems. A marginal cost
approach completely allocates the cost of common harvesting activities such as felling,
forwarding and processing to conventional products, whereas a joint product approach
distributes production costs among conventional products and fuel wood. Production costs are
highly variable depending on the type of harvesting employed and the ratio of conventional
products to fuel wood.
Roser et al. (2011 b) estimated the feasibility and cost level of selected supply chains for
chips. While results showed that supply chains have to be tailored to local conditions, distance
from receiving facilities, and product quality, overall, chipping at the landing seems was the
best option. Angus‐Hankin et al. (1995) studied various forms of fuel wood transportation
systems, comparing their costs and payloads. The inherent low bulk density of woody biomass
was a substantial drawback to reaching the maximum legal weight before exceeding legal truck
and/or trailer dimensions. Moreover, a desire to minimize moisture content to increase
product quality of the material prior to transport placed further constraints on achieving
optimal truck payloads.
A GIS‐based model for energy wood supply chains simulated costs for several supply
chains in a study area in eastern Finland and found that more simple supply chains such as
transporting loose residues by truck and chipping at the plant offered the lowest total costs at
haul distances less than 60 kilometers. The amount of packing density and the ability to use full

55
load capacity were more important for haul distances over 60 kilometers (Tahvanainen and
Anttila 2011).
Yoshioka et al. (2006) developed and monitored a harvesting and transporting system
for logging residues to determine the feasibility of the system based on cost, energy, and CO2.
Their results suggested that a chipper should be incorporated into the system as early as
possible and that high capacity trailers and highly‐maintained forest roads were effective
measures to reduce the total cost.
Patterson et al. (2011) examined five forest biomass collection systems. Two of the systems
utilized a chipper, one with thinning material and one with thinning residues. The other three
systems utilized horizontal grinders to process roundwood logging residues. The chipping
systems produced material with a higher energy content (8,168 vs. 7,785 BTU/lb) and lower ash
content (1.2% vs. 4.5%) than the material produced by grinding systems processing roundwood
residues.
3.2.3 Forest Landowners
Ninety percent of responding family and institutional forest landowners and public
forestland managers in the U.S. South reported a willingness to sell to energy facilities if
desirable prices were offered and all owners who previously sold timber to an energy facility
were satisfied with the experience. Only 3.5% of respondents were unwilling to sell timber to
an energy company, with only one of these respondents listing timber production as a primary
objective (Conrad et al. 2011).
An Alabama survey indicated that most family forest landowners were willing to supply
both timber and harvest residues for energy production with their willingness positively

56
correlated with owned acreage, valuable markets, and the opportunity to contribute to local
economic development and global climate change. Three‐quarters of the Alabama respondents
indicated willingness to manage their land for biomass production, compared with 43% of
respondents who actively managed their land (Paula et al. 2011).
A study to assess factors affecting Arkansas, Florida, and Virginia nonindustrial private
forest landowners’ willingness to supply woody biomass for bioenergy showed that the
majority of the landowners in the study area regarded energy security as critical for both
national security and a healthy economy. A significant number of landowners were either
uncertain or not familiar with the idea of producing alternative energy from cellulosic biomass.
Older forest landowners were skeptical about wood‐based energy, but the study’s “willingness
to supply” model indicated that younger landowners with large timber holdings were more
likely to supply woody biomass. Landowners with wildlife management objectives were likely
to supply woody biomass (Joshi and Mehmood 2011).
Forest landowners in Sweden reported that the price paid for forest biomass did not
determine whether or not they would sell their forest biomass material. Potential losses in soil
productivity negatively influenced their decision to sell the material and Swedish forest
landowners who do sell reported that clearing the forest floor from residues was the primary
reason (Bohlin and Roos 2002).
Recovering biomass presents forest landowners with an opportunity to utilize this
material instead of piling and/or burning it prior to replanting. Furthermore, this practice tends
to increase the plantable area and studies have shown that recovering harvesting residues and
unmerchantable stems may reduce site preparation cost (Miller et al. 1987, Watson et al. 1986
57
(b), Ragan et al. 1987, Watson and Stokes 1989, and Westbrook 2008). Watson and Stokes
(1989) reported a 25% reduction in site preparation cost due to the removal of residues and
unmerchantable stems. Westbrook (2008) found up to 38% reduction in site preparation costs
when understory material was removed from the site during harvesting.
Some concerns for forest landowners regarding energy wood harvesting were the
removal of excessive amounts of logging residue because of perceived negative effects to
wildlife habitat, nutrient cycling, and water quality. A study conducted in Maine by Briedis et al.
(2011) found that an average of 45% of the logging residue was left on sites harvested for
traditional forest products and energy wood and between 16 and 50% was left on skid trails.
Shorter rotations and an increase in utilization could lower site nutrient availability.
Management of site nutrients via fertilization increases in importance as the proportion of
nutrients removed increases unless nutrients are not a limiting factor on particular sites. The
potential loss of nutrients from a site largely depends upon the distribution of biomass
component such as stems, bark, branches, and foliage. The increase in loss of nutrients in
harvested materials accompanying a change in utilization standards depends upon the
distribution of biomass between the various components of the forest: stemwood, stembark,
the stump (unharvested portion of the bole), branches of various dimensions, roots of various
dimensions, and foliage (Kimmins 1977).
Some southern U.S. pine forests that are relatively unproductive prior to harvesting may
be at risk of further productivity losses due to intensive harvesting treatments with slash
removal and fertilization is often required to improve site productivity (Scott and Dean 2006).
58
3.3 METHODS
3.3.1 Harvesting Systems
We calculated delivered costs per field ton and per million BTU (mmBTU) for seven
harvesting systems. We use the term “field” to reference the moisture content of any material
at the time of chipping or grinding and use “green” wood to refer to freshly felled wood with
the highest moisture content observed in the field. The harvesting systems included: (1) a
whole‐tree chipping operation producing fuel chips, (2) a clean chipping operation producing
pulp quality chips, (3) a horizontal grinding operation processing roundwood logging residues
unscreened, (4) a horizontal grinding operation processing and screening roundwood logging
residues, (5) a horizontal grinding operation processing clean chipping residues unscreened, (6)
a horizontal grinding operation processing and screening clean chipping residues, and (7) a
conventional roundwood logging operation.
3.3.2 Product Analysis
Physical properties including moisture content, ash content, energy content, and
elemental analysis were obtained from Dukes (2012) for screened and unscreened grindings
and from Cutshall et al. (in press) for whole‐tree chips. Both of these studies collected samples
and prepared them for laboratory analyses following the Technical Association of the Pulp and
Paper Industry (TAPPI) standard for sampling and preparing wood for analysis (TAPPI 1985). A
6‐inch diameter PVC pipe with an elbow was used to collect chip samples and a 5‐gallon bucket
was used to collect grinding material from each truck load. Small samples were collected
several times during the loading of a van and mixed to obtain composite samples. Grab
samples (1Kg) from the composite samples were transferred to a kraft paper bag and weighed
59
immediately to determine the field (or wet) weight of the chips or grindings. Each bag was later
transferred to a 105°C oven for a minimum of 24 hours and reweighed to determine moisture
content. A subsample of bags from each harvesting system were fractioned, processed through
a 1 mm screen Wiley mill and transferred to the University of Georgia Plant, Soil, and Water Lab
to determine energy, ash, and nutrient content.
3.3.3 Production Analysis
Production rates and truck payloads were obtained from Cutshall et al. (in press) and
Dukes (2012). These studies looked at production impacts by using work sampling and time
study methods to record data on the whole‐tree harvesting system and each grinding system.
Production rates for the clean chipping system were assumed to mirror the whole‐tree chipping
system. Continuous activity data were recorded for each system, and machine activity codes
were recorded for each processing machine on‐site every two minutes for the duration of each
field study to establish mechanical availability, utilization, and sources of delay. These machine
activity codes included chipping or grinding, representing productive time, and assorted delays
such as mechanical delays, waiting on trees or residue material, waiting on trucks, waiting on
the loaders, waiting with processing machines turned off, and miscellaneous delays. A
stopwatch was used in each study to record the time to load each truck in the field, and load
weights were obtained from truck drivers from weight scale tickets upon return to the study
site.
3.3.4 Cost Estimation
Hourly operating costs were calculated using the machine rate approach (Miyata 1980)
assuming 85% mechanical availability for all machines in each of the seven harvesting systems.

60
Additional assumptions for all machines included: labor rate of $18.00/SMH; labor
fringe/overhead expenses of 40% of the base rate of pay; combined interest, insurance, and
taxes of 15% of average annual investment; lubrication costs at 37% of fuel expense; and 2,000
scheduled machine hours per year (Table 3.1). We evaluated diesel prices ranging from $3.00
to $6.00 per gallon.
We modified a version of the Auburn Harvesting Analyzer (Tufts et al. 1985) to
determine delivered costs for each system. The model was adapted to evaluate a range of
values in lab‐derived moisture content, ash content, and energy content (BTU per oven dry
pound) among whole‐tree chipping and grinding systems based on results obtained from
Cutshall et al. (in press) and Dukes (2012). For example, whole‐tree chips ranged in moisture
content from approximately 30% to 55% and ash content varied from approximately 0.5% to
1.0%. Truck payload data from the previous studies were used to obtain ranges in load weights.
Trucks transporting whole‐tree chips ranged in net weights from 20 to 30 tons, and trucks
transporting screened roundwood residue grinding material ranged in net weights from 10 to
20 tons. We added 10% to total costs for a profit margin. Additional variables including tract
size, tons removed per acre, tons per landing, truck payload (net tons), and miles of loaded haul
distance to the receiving facility were adjusted to determine cost sensitivity (Table 3.2).
Delivered costs were calculated by adding a stumpage price of $8.00 per field ton for
the RW system and $1.00 per field ton for each grinding system. We assumed the CC system to
process 10% less material due to bark and chip sizing losses than the RW system resulting in a
stumpage price of $8.89 per field ton and the WTC system to process 25% more material than
the RW system resulting in a stumpage price of $6.40 per field ton. To further incorporate

61
biomass costs for wood energy facilities, we added an additional $5.00 per field ton to the RW
system to represent the cost of chipping roundwood at a facility. We compared delivered cost
per mmBTU data at each variable level using analysis of variance with Tukey’s range test used
for means comparison (Oehlert 2000).
3.3.5 Nutrient Removals
To illustrate incremental nutrient removals, we compared estimated N, P, and K
removals (pounds per acre) from chipping and grinding systems. We considered a pine stand
with 100 field tons per acre of total biomass material 4 inches or greater in diameter containing
10% unmerchantable hardwood and calculated BDT per acre by assuming 50% moisture
content. The 10% hardwood was assumed to be unavailable for recovery. A pine crown to
stem weight ratio of 15% from Aman (2010) was used to determine the amount of
merchantable biomass for RW and CC systems with an additional recovery rate of 85% for CC.
Full available biomass recovery was assumed for the WTC system. Removals for each grinding
system were determined by adding their respective first pass system (RW or CC) removals and
applying an assumed grinding system‐specific recovery rate. Recovery rates for the GRW,
GRW/S, GCC, and GCC/S systems were 85%, 70%, 90%, and 80%, respectively. Pounds per acre
of N, P, and K removals were calculated for each system by applying nutrient contents from
Dukes (2012) and Cutshall (in press) (Table 3.5) and BDT per acre removals. Biomass material
from the RW and CC systems were assumed to have the same elemental content as the WTC
system.

62
3.4 RESULTS
3.4.1 Moisture Content
Estimated delivered costs on an energy basis (mmBTU) for whole‐tree chipping and
screened and unscreened grinding systems were compared by increasing moisture content
(MC) from 30% to 55% (wet basis) (Figure 3.1). Delivered cost per mmBTU decreased by over
50% for all systems as moisture content decreased from 55% to 30%. The system grinding
clean chipping residues without using a screen (GCC) had the lowest estimated delivered costs
ranging from $2.68 per mmBTU at 30% MC to $4.17 at 55% MC. The grinding system
processing and screening clean chipping residues (GCC/S) and the system grinding roundwood
logging residues without using a screen (GRW) had marginally higher estimated cut and haul
costs per mmBTU, respectively, than the GCC system. The whole‐tree chipping system had the
highest costs of the “economically feasible” systems. Estimated cut and haul costs for the
system grinding and screening roundwood logging residues (GRW/S) were by far the highest.
This system was not considered to be an economically feasible biomass harvesting option.
Dukes (2012) reported that this system averaged 11.7 net tons of truck payload, a 47 minute
loading time, and 15.3 tons per productive hour. By comparison, a 780 hp grinder processing
and screening clean chip residues averaged 23.5 net tons of truck payload, a 16.9 minute
loading time, and 84.7 tons per productive hour.
3.4.2 Ash Content
Ash content, along with moisture content, is a key characteristic affecting net energy
content. The whole‐tree chipping system produced the lowest estimated delivered cost per
mmBTU at the lowest percent ash, $4.39 per mmBTU at 0.5% ash and $4.41 at 1% ash (Table
63
3.3). Cutshall et al. (in press) reported ash content of less 0.7% in whole‐tree chips. The GCC
system produced the lowest estimated delivered cost per mmBTU of $2.87 at 5% ash, but this
system also produced loads with high ash content (up to 30%). If target ash content is less than
2%, the WTC system was the lowest delivered cost option followed by the GRW/S system (Table
3.3). No other system was observed to reduce ash below 2%. If 2% ash is acceptable, then the
GCC/S system is the lowest delivered cost option at $3.33 per mmBTU. If ash content of up to
10% is acceptable, then the GRW, GCC, or GCC/S systems are options with the lowest costs
observed for the GCC system. Delivered costs for the CC and GRW/S systems were not
significantly different at α=.05.
3.4.3 Tract Size
Delivered costs per mmBTU for conventional roundwood logging (RW), whole‐tree
chipping (WTC), and clean chipping (CC) systems were compared by increasing tract size from
20 to 100 acres (Figure 3.2). Estimated delivered costs for the WTC system averaged almost
$1.00 per mmBTU less than the CC system and $0.75 per mmBTU less than the RW system for
all tract sizes. The CC and RW systems’ costs were not significantly different for any tract size.
Costs declined more (16%) as tract size increased from 20 to 60 acres, but fell only 3% when
increased from 60 to 100 acres. Harvesting systems are capital‐intensive, costly operations
requiring high productivity to maintain profitability and are thus more affected by smaller tracts
which require more frequent moving.
3.4.4 Tons per Acre and Tons per Landing
Delivered costs per mmBTU for conventional roundwood logging (RW), whole‐tree
chipping (WTC), and clean chipping (CC) systems were compared by increasing field tons
64
removed per acre from 20 to 80 tons (Figure 3.3). Estimated delivered costs for the RW and CC
systems averaged roughly $0.80 per mmBTU more than the WTC system when 60 tons per acre
were removed. Costs declined sharply (35%) as tons per acre removed increased from 20 to 50
tons but declined only 12% as tons per acre increased from 50 to 80. Delivered costs were not
significantly different between the CC and RW systems when 50 or more field tons per acre
were removed.
Delivered costs per mmBTU for each grinding system were compared by increasing tons
per landing or processing area (Figure 3.4). The unscreened system grinding clean chipping
residues (GCC) had the lowest estimated delivered costs from $3.68 per mmBTU at 20 tons per
landing to $3.17 at 250 field tons per landing. Costs for the system grinding and screening
roundwood residues (GRW/S) were the highest by a considerable margin at $5.76 per mmBTU
at 50 tons per landing and $5.13 at 250 tons. As field tons per landing increased from 50 to 250
costs for the GRW system dropped 10% followed by 11% for the GRW/S, 14% for the GCC, and
17% for the GCC/S systems. Costs for the GCC/S and GRW systems at 50 tons per landing and
the GCC/S and GCC systems at 250 tons per landing did not significantly differ.
3.4.5 Truck Payload
Delivered costs per mmBTU for each harvesting system were also compared by
increasing net tons of truck payload (Figure 3.5). The GRW, GCC, and GCC/S systems had the
lowest costs for each load size. Costs declined approximately 11% for each system as load size
increased except for the GRW/S system which declined 20%. Delivered costs for the GRW and
GCC/S systems did not significantly differ at a trucks payload of 15 tons. The GCC and GCC/S
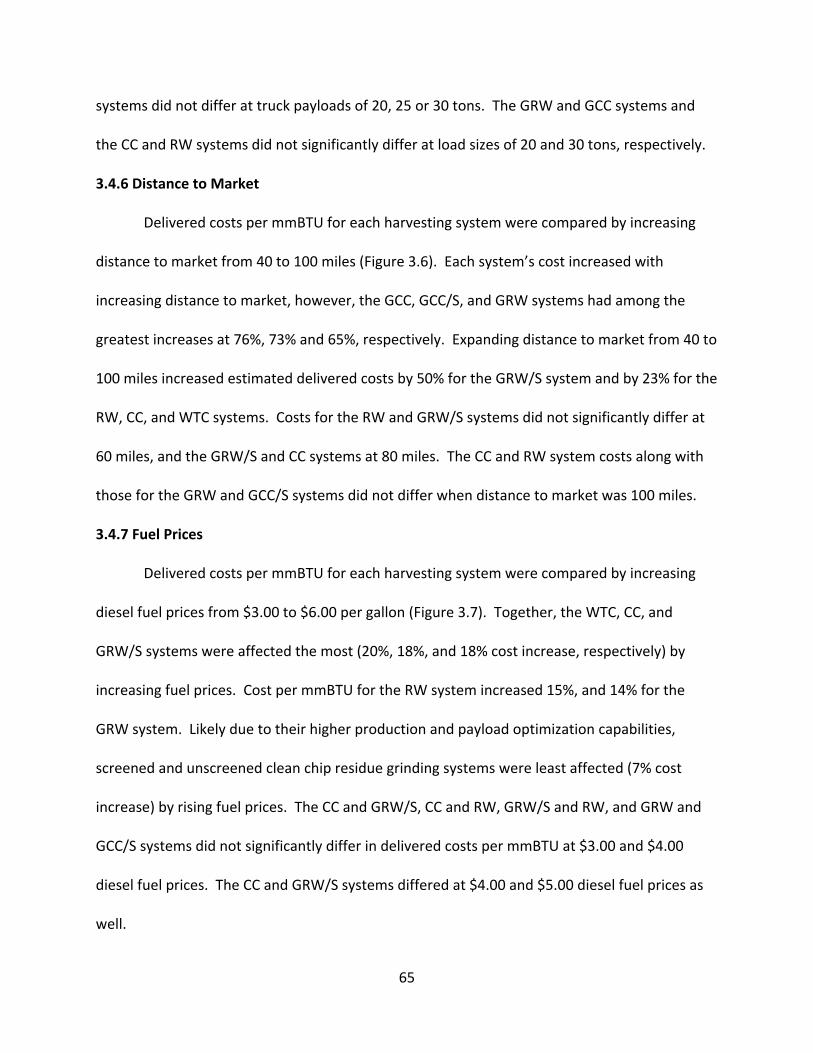
65
systems did not differ at truck payloads of 20, 25 or 30 tons. The GRW and GCC systems and
the CC and RW systems did not significantly differ at load sizes of 20 and 30 tons, respectively.
3.4.6 Distance to Market
Delivered costs per mmBTU for each harvesting system were compared by increasing
distance to market from 40 to 100 miles (Figure 3.6). Each system’s cost increased with
increasing distance to market, however, the GCC, GCC/S, and GRW systems had among the
greatest increases at 76%, 73% and 65%, respectively. Expanding distance to market from 40 to
100 miles increased estimated delivered costs by 50% for the GRW/S system and by 23% for the
RW, CC, and WTC systems. Costs for the RW and GRW/S systems did not significantly differ at
60 miles, and the GRW/S and CC systems at 80 miles. The CC and RW system costs along with
those for the GRW and GCC/S systems did not differ when distance to market was 100 miles.
3.4.7 Fuel Prices
Delivered costs per mmBTU for each harvesting system were compared by increasing
diesel fuel prices from $3.00 to $6.00 per gallon (Figure 3.7). Together, the WTC, CC, and
GRW/S systems were affected the most (20%, 18%, and 18% cost increase, respectively) by
increasing fuel prices. Cost per mmBTU for the RW system increased 15%, and 14% for the
GRW system. Likely due to their higher production and payload optimization capabilities,
screened and unscreened clean chip residue grinding systems were least affected (7% cost
increase) by rising fuel prices. The CC and GRW/S, CC and RW, GRW/S and RW, and GRW and
GCC/S systems did not significantly differ in delivered costs per mmBTU at $3.00 and $4.00
diesel fuel prices. The CC and GRW/S systems differed at $4.00 and $5.00 diesel fuel prices as
well.
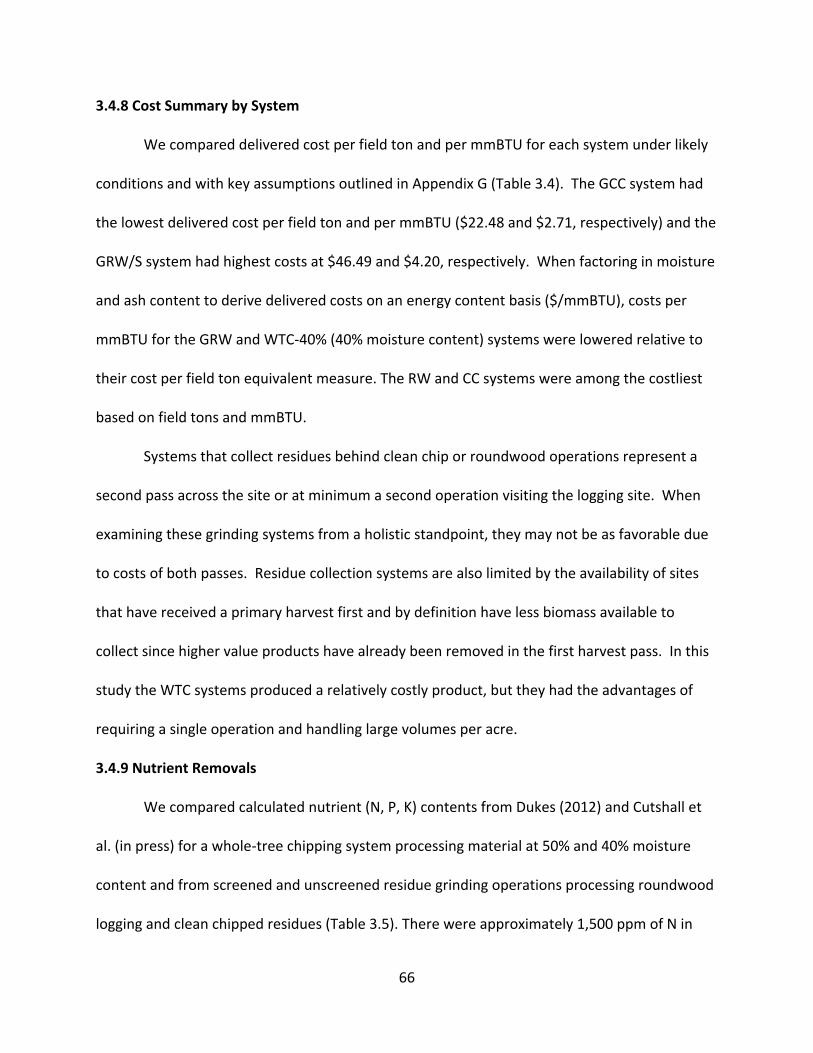
66
3.4.8 Cost Summary by System
We compared delivered cost per field ton and per mmBTU for each system under likely
conditions and with key assumptions outlined in Appendix G (Table 3.4). The GCC system had
the lowest delivered cost per field ton and per mmBTU ($22.48 and $2.71, respectively) and the
GRW/S system had highest costs at $46.49 and $4.20, respectively. When factoring in moisture
and ash content to derive delivered costs on an energy content basis ($/mmBTU), costs per
mmBTU for the GRW and WTC‐40% (40% moisture content) systems were lowered relative to
their cost per field ton equivalent measure. The RW and CC systems were among the costliest
based on field tons and mmBTU.
Systems that collect residues behind clean chip or roundwood operations represent a
second pass across the site or at minimum a second operation visiting the logging site. When
examining these grinding systems from a holistic standpoint, they may not be as favorable due
to costs of both passes. Residue collection systems are also limited by the availability of sites
that have received a primary harvest first and by definition have less biomass available to
collect since higher value products have already been removed in the first harvest pass. In this
study the WTC systems produced a relatively costly product, but they had the advantages of
requiring a single operation and handling large volumes per acre.
3.4.9 Nutrient Removals
We compared calculated nutrient (N, P, K) contents from Dukes (2012) and Cutshall et
al. (in press) for a whole‐tree chipping system processing material at 50% and 40% moisture
content and from screened and unscreened residue grinding operations processing roundwood
logging and clean chipped residues (Table 3.5). There were approximately 1,500 ppm of N in
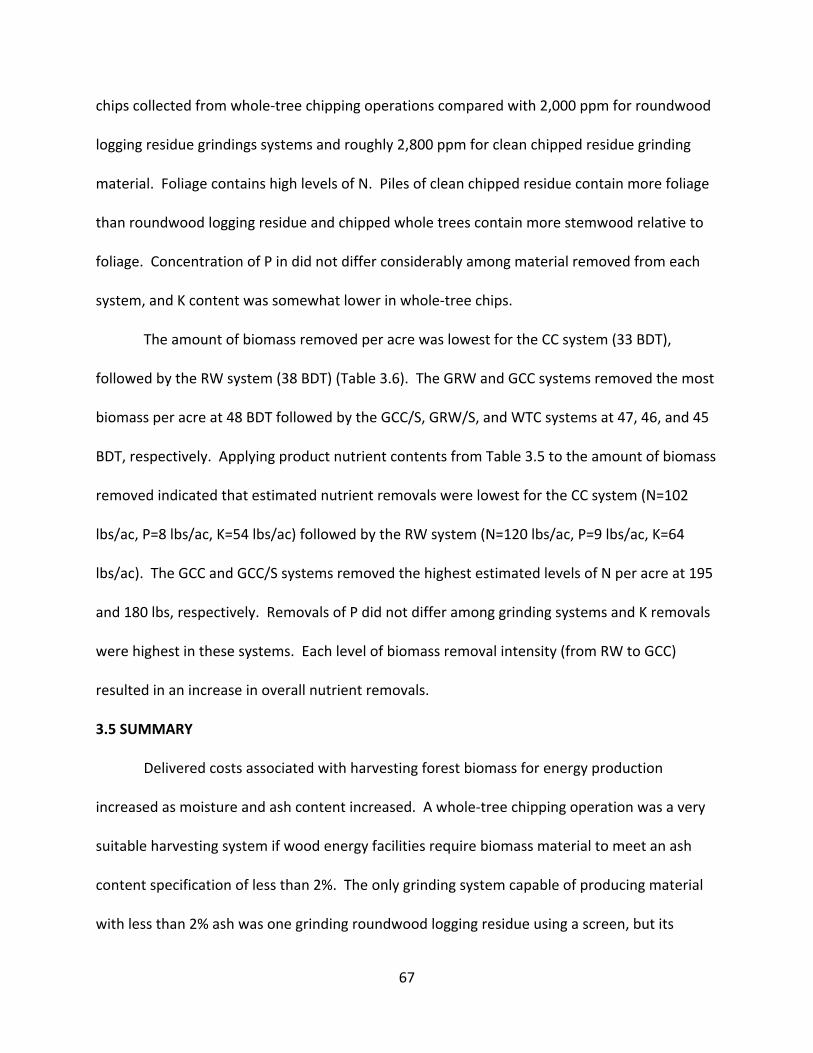
67
chips collected from whole‐tree chipping operations compared with 2,000 ppm for roundwood
logging residue grindings systems and roughly 2,800 ppm for clean chipped residue grinding
material. Foliage contains high levels of N. Piles of clean chipped residue contain more foliage
than roundwood logging residue and chipped whole trees contain more stemwood relative to
foliage. Concentration of P in did not differ considerably among material removed from each
system, and K content was somewhat lower in whole‐tree chips.
The amount of biomass removed per acre was lowest for the CC system (33 BDT),
followed by the RW system (38 BDT) (Table 3.6). The GRW and GCC systems removed the most
biomass per acre at 48 BDT followed by the GCC/S, GRW/S, and WTC systems at 47, 46, and 45
BDT, respectively. Applying product nutrient contents from Table 3.5 to the amount of biomass
removed indicated that estimated nutrient removals were lowest for the CC system (N=102
lbs/ac, P=8 lbs/ac, K=54 lbs/ac) followed by the RW system (N=120 lbs/ac, P=9 lbs/ac, K=64
lbs/ac). The GCC and GCC/S systems removed the highest estimated levels of N per acre at 195
and 180 lbs, respectively. Removals of P did not differ among grinding systems and K removals
were highest in these systems. Each level of biomass removal intensity (from RW to GCC)
resulted in an increase in overall nutrient removals.
3.5 SUMMARY
Delivered costs associated with harvesting forest biomass for energy production
increased as moisture and ash content increased. A whole‐tree chipping operation was a very
suitable harvesting system if wood energy facilities require biomass material to meet an ash
content specification of less than 2%. The only grinding system capable of producing material
with less than 2% ash was one grinding roundwood logging residue using a screen, but its

68
delivered cost was almost $1.00 per mmBTU higher than that for a whole‐tree chipping system
due to severely limited truck payloads. The least costly ($2.87 per mmBTU) option where 5%
ash content was acceptable was a system grinding clean chipped residue without screening.
Tract size had minimal effects on any operation until the acreage declined below 40
acres. Clean chipping and conventional roundwood systems were considerably more expensive
than whole‐tree chipping operations on all tract sizes.
Costs for roundwood and chipping systems sharply declined as the amount of biomass
available on site increased, especially as field tons per acre removed increased from 20 to 50.
Truck payload and haul distance had considerable effects on delivered costs. Costs were
reduced as truck payload increased and haul distance decreased. Optimizing truck payload to
meet legal weight limits by lowering tare weight and increasing trailer volume capacity is an
opportunity for forest biomass harvesting system managers to achieve lower costs especially
when dealing with drier material or screened roundwood grindings. Fuel price increases
directly increase delivered costs and limit economical haul distances accordingly.
In the U.S. South forest biomass in roundwood form, though wetter than dried chips or
grindings, is typically more abundant, has an established harvesting and transportation
infrastructure, and is perceived to be cheaper than processed biomass to cut and haul to the
first delivery point. However, delivered pulpwood prices also include stumpage of
approximately $8.00 per ton and forest residue prices generally include up to $2.00 per ton
payable to forest landowners. There is also an additional cost to wood energy facilities to
convert roundwood into chips. The combination of stumpage prices and additional processing
costs for roundwood make in‐woods chipping and grinding systems a more attractive option.

69
Nutrient removals increased as forest biomass removal intensity increased. While
silvicultural applications are largely site‐specific, fertilization of forest stands may be necessary
to maintain site productivity following two‐pass systems such as a clean chipping operation
followed by its residue removal via a grinding operation. Fertilization may not be as necessary
following conventional roundwood and whole‐tree chipping operations. The effects of specific
biomass harvesting systems on site productivity are an opportunity for future research.
3.6 ACKNOWLEDGEMENTS
This study was funded by financial support from the Southeastern SunGrant Center associated
with the US Department of Energy and US Department of Agriculture.
3.7 REFERENCES Aguilar, F. and H.E. Garrett. 2009. Perspectives of woody biomass for energy: Survey of state foresters, state energy biomass contacts, and National Council of Forestry Association executives. Journal of Forestry 107(6):297‐306. Aman, A.L. 2010. An evaluation of alternative forest biomass harvesting methods. M.S. Thesis. The University of Georgia. 90 p. Angus‐Hankin, C., B. Stokes, and A. Twaddle. 1995. The transportation of fuelwood from forest to facility. Biomass and Bioenergy 9(1‐5):191‐203. ANSI/ASABE Standards. 2011. American Society for Agricultural & Biological Engineers, St. Joseph, MI: ASABE S593.1. Arola, R.A. and E.S. Miyata. 1981. Harvesting wood for energy. US For. Serv. Res. Pap. NC‐200. 25p. Bohlin, F. and A. Roos. 2002. Wood fuel supply as a function of forest owner preferences and management styles. Biomass and Bioenergy 22(4):237–249. Boundy, B., S. Diegel, L. Wright, and S. Davis. 2011. Biomass energy data book: edition 4. Oak Ridge National Laboratory, Oak Ridge, Tennessee, USA.

70
Briedis, J.I., J.S. Wilson, J.G. Benjamin, and R.G. Wagner. 2011. Biomass retention following whole‐tree, energy wood harvests in central Maine: Adherence to five state guidelines. Biomass and Bioenergy 35(8):3552–3560. Conrad, J.L., M.C. Bolding, R.L. Smith, and W.M. Aust. 2011. Wood‐energy market impact on competition, procurement practices, and profitability of landowners and forest products industry in the U.S. South. Biomass and Bioenergy 35(1):280‐287. Cubbage, F.W. and W.D. Greene. 1989. Conventional and biomass harvesting costs by forest tract size. Biomass 20(3‐4):219‐228. Cutshall, J.B., W.D. Greene, and S.A. Baker. In Press. Transpirational drying effects on energy and ash content from whole‐tree southern pine plantation chipping operations. Accepted for publication in Southern Journal of Applied Forestry. Dukes, C. 2012. In‐wood screening of wood grindings for biomass feedstock applications. M.S. Thesis. The University of Georgia. 44 p. Evans, A.M. 2008. Synthesis of knowledge from woody biomass removal case studies. Santa Fe, NM. The Forest Guild. 39p. Filbakk, T., R. Jirjis, J. Nurmi, and O. Høibø. 2011. The effect of bark content on quality parameters of Scots pine (Pinus sylvestris L.) pellets. Biomass and Bioenergy 35(8):3342–3349. Goulding, C.J. and A.A. Twaddle. 1990. Harvesting whole trees with processing and log allocation (in the forest) to conventional and energy products. Biomass. 22(1‐4):145‐158. Hartsough, B., D. Yomogida. 1996. Compilation of state‐of‐the‐art mechanization technologies for short‐rotation woody crop production. Davis, CA: University of California, Biological and Agriculture Engineering Department. In cooperation with: Electric Power Research Institute; U.S. Department of Agriculture, Forest Service, Southern Research Station. 66 p. Ince, P.J. 1979. How to estimate recoverable heat energy in wood or bark fuels. USDA For. Serv. Gen. Tech. Rep. FPL 29. Forest Products Lab., Madison, WI. 10 p. Joshi, O. and S.R. Mehmood. 2011. Factors affecting nonindustrial private forest landowners’ willingness to supply woody biomass for bioenergy. Biomass and Bioenergy 35(1):186‐192. Kimmins, J.P. 1977. Evaluation of the consequences for future tree productivity of the loss of nutrients in whole‐tree harvesting. Forest Ecology and Management 1(1976‐1977):169‐183. Klepac, J., B. Rummer, and F. Seixas. 2008. Seasonal effects on moisture loss of loblolly pine. Proc. of the 31st Annual Meeting of the Council on Forest Engineering, Charleston, SC, June 2008. 53‐61.
71
Kristensen, E.F. and P.D. Kofman. 2000. Pressure resistance to air flow during ventilation of different types of wood fuel chip. Biomass and Bioenergy 18(3):175–180. Koch, P. 1980. Harvesting energy chips from forest residues—Some concepts from the southern pine regions. US For. Serv. Gen. Tech. Rep. CO‐33. 25p. Lehtikangas, P. 2001. Quality properties of pelletised sawdust, logging residues and bark. Biomass and Bioenergy 20(5):351‐360. Miller, D.E., T.J. Straka, B.J. Stokes, and W.F. Watson. 1987. Productivity and cost of conventional understory biomass harvesting systems. Forest Products Journal 37(5):39‐43. Miyata, E.S. 1980. Determining fixed and operating costs of logging equipment. USDA Forest Serv. TR‐NC‐55, North Central Expt. Sta., St. Paul, MN. 14 p. Narodoslawsky, M. and I. Obernberger. 1996. From waste to raw material—the route from biomass to wood ash for cadmium and other heavy metals. Journal of Hazardous Materials 50(2‐3):157‐168. Nurmia, J. and K. Hillebrand. 2007. The characteristics of whole‐tree fuel stocks from silvicultural cleanings and thinnings. Biomass and Bioenergy 31(6):381–392. Obernberger, I., F. Biedermann, W. Widmann, and R. Riedl. 1997. Concentrations of inorganic elements in biomass fuels and recovery in the different ash fractions. Biomass and Bioenergy. 12(3):211‐224. Öhman, M., C. Boman, H. Hedman, A. Nordin, and D. Boström. 2004. Slagging tendencies of wood pellet ash during combustion in residential pellet burners. Biomass and Bioenergy 27(6): 585–596. Oehlert, G.W. 2000. A first course in design and analysis of experiments. W.H. Freeman and Company. New York. 600 p. Patterson, D, J. Hartley, and M. Pelkki. 2011. Size, moisture content, and British thermal unit value of processed in‐woods residues: five case studies. Forest Products Journal 61(4):316‐320. Paula, A.L., C. Bailey, R.J. Barlow, and W. Morse. 2011. Landowner willingness to supply timber for biofuel: results of an Alabama survey of family forest landowners. Southern Journal of Applied Forestry 35(2):93‐97. Paulrud, S. and Nilsson C. 2004. The effects of particle characteristics on emissions from burning wood fuel powder. Fuel 83(7‐8):813‐821.
72
Pettersson, M. and T. Nordfjell. 2007. Fuel quality changes during seasonal storage of compacted logging residues and young trees. Biomass and Bioenergy 31(11‐12):782‐792. Puttock, G.D. 1995. Estimating cost for integrated harvesting and related forest management activities. Biomass and Bioenergy 8(2):73‐79. Ragan, J.R., W.F. Watson, and B.J. Stokes. 1987. Impact of intensive utilization of regeneration operations. Proceedings of the 1987 International Winter Meeting of the American Society of Agricultural Engineers. St. Joseph, MI. p 1‐23. Ragland, K.W. and D. J. Aerts. 1991. Properties of wood for combustion analysis. Bioresource Technology 37(2):161‐168. RISI. 2011. Wood Biomass Market Report. August 2011. 4(8):7 p. (a)Röser, D., B. Mola‐Yudego, L. Sikanen, R. Prinz, D. Gritten, B. Emer, K. Väätäinen, and A. Erkkilä. 2011. Natural drying treatments during seasonal storage of wood for bioenergy in different European locations. Biomass and Bioenergy 35(10):4238–4247. (b)Röser, D., L. Sikanen, A. Asikainen, H. Parikka, and K. Väätäinen. 2011. Productivity and cost of mechanized energy wood harvesting in Northern Scotland. Biomass and Bioenergy 35(11):4570–4580. Sarenbo, S. 2009. Wood ash dilemma‐reduced quality due to poor combustion performance. Biomass and Bioenergy 33(9):1212‐1220. Scott, D.A. and T.J. Dean. 2006. Energy trade‐offs between intensive biomass utilization, site productivity loss, and ameliorative treatments in loblolly pine plantations. Biomass and Bioenergy 30(12):1001–1010. Spinelli, R., C. Nati, L. Sozzi, N. Magagnotti, and G. Picchi. 2011. Physical characterization of commercial woodchips on the Italian energy market. Fuel 90(6):2198–2202. Stokes, B.J., T.P. McDonald, and T. Kelley. 1993. Transpirational drying and costs for transporting woody biomass – a preliminary review. Proc. of IEA/BA Task IX, Aberdeen, UK. 16 p. Suadicani, K. and C. Gamborg. 1999. Fuel quality of whole‐tree chips from freshly felled and summer dried Norway spruce on a poor sandy soil and a rich loamy soil. Biomass and Bioenergy 17(3):199‐208. TAPPI. 1985. Sampling and preparing wood for analysis. T 257 cm‐85. 5 p.

73
Tahvanainen, T. and P. Anttila. 2011. Supply chain cost analysis of long‐distance transportation of energy wood in Finland. Biomass and Bioenergy 35(8):3360–3375. Tufts, R.A., B.L. Lanford, W.D. Greene, and J.O. Burrows. 1985. Auburn harvesting analyzer. The Compiler 3(2):14–5. Forest Resources Systems Institute, Florence, AL.. van den Broek, R., A. Faaij, and A. van Wijk. 1996. Biomass combustion for power generation. Biomass and Bioenergy 11(4):271‐281. Watson, W.F., B.J. Stokes, and I.W. Savelle. 1986. Comparisons of two methods of harvesting biomass for energy. Forest Products Journal 36(4):63‐68. Watson, W.F., D.E. Miller, B.J. Stokes, and M.L. Broussard. 1986. Energy budget for an energywood harvesting system. Proceedings of the 1986 Southern Forest Biomass Workshop. Norris, TN. Tennessee Valley Authority. p. 103‐105. Watson, W.F. and B.J. Stokes. 1989. Harvesting small stems – a Southern USA perspective. Proceedings of the International energy Agency. Auburn, AL. USDA For Serv So Res Sta. p. 131‐139. Westbrook, M.D. 2008. Forest biomass recovery by adding small chippers to tree‐length harvesting systems in planted pine stands of the southern USA. M.S. Thesis. The University of Georgia. 59 p. Wu, M.R., D.L. Schott, and G. Lodewijks. 2011. Physical properties of solid biomass. Biomass and Bioenergy 35(5):2093‐2105. Yoshioka, T., K. Aruga, T. Nitami, S. Hideo, and H. Kobayashi. 2006. A case study on the costs and the fuel consumption of harvesting, transporting, and chipping chains for logging residues in Japan. Biomass and Bioenergy 30(4):342‐348. Young, H.E. 1980. Biomass utilization and management implications. Weyerhaeuser Science Symposium 3, Forest‐to‐Mill Challengers of the Future. Weyerhaeuser. 16 p.
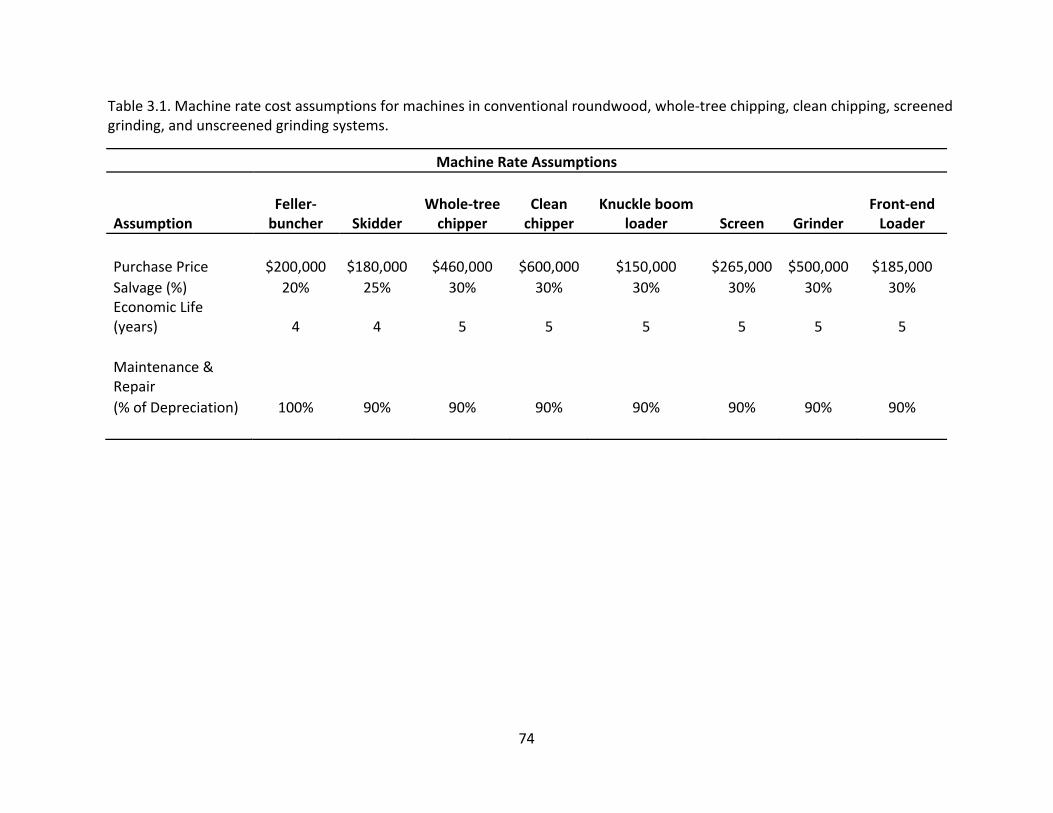
74
Table 3.1. Machine rate cost assumptions for machines in conventional roundwood, whole‐tree chipping, clean chipping, screened grinding, and unscreened grinding systems.
Machine Rate Assumptions
Assumption Feller‐buncher Skidder
Whole‐tree chipper
Clean chipper
Knuckle boom loader Screen Grinder
Front‐end Loader
Purchase Price $200,000 $180,000 $460,000 $600,000 $150,000 $265,000 $500,000 $185,000 Salvage (%) 20% 25% 30% 30% 30% 30% 30% 30% Economic Life (years) 4 4 5 5 5 5 5 5
Maintenance & Repair
100% 90% 90% 90% 90% 90% 90% 90% (% of Depreciation)
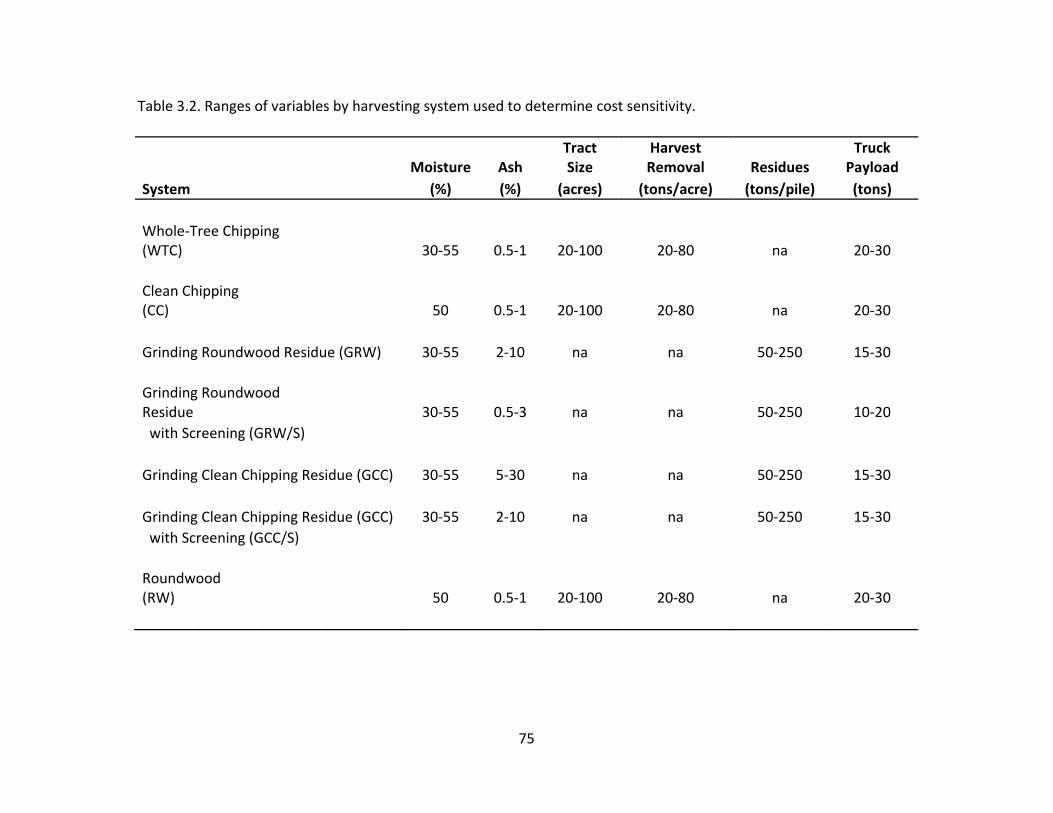
75
Table 3.2. Ranges of variables by harvesting system used to determine cost sensitivity.
Moisture Ash Tract Size
Harvest Removal Residues
Truck Payload
System (%) (%) (acres) (tons/acre) (tons/pile) (tons)
Whole‐Tree Chipping (WTC) 30‐55 0.5‐1 20‐100 20‐80 na 20‐30
Clean Chipping (CC) 50 0.5‐1 20‐100 20‐80 na 20‐30
Grinding Roundwood Residue (GRW) 30‐55 2‐10 na na 50‐250 15‐30
Grinding Roundwood Residue 30‐55 0.5‐3 na na 50‐250 10‐20 with Screening (GRW/S)
Grinding Clean Chipping Residue (GCC) 30‐55 5‐30 na na 50‐250 15‐30
Grinding Clean Chipping Residue (GCC) 30‐55 2‐10 na na 50‐250 15‐30 with Screening (GCC/S)
Roundwood (RW) 50 0.5‐1 20‐100 20‐80 na 20‐30
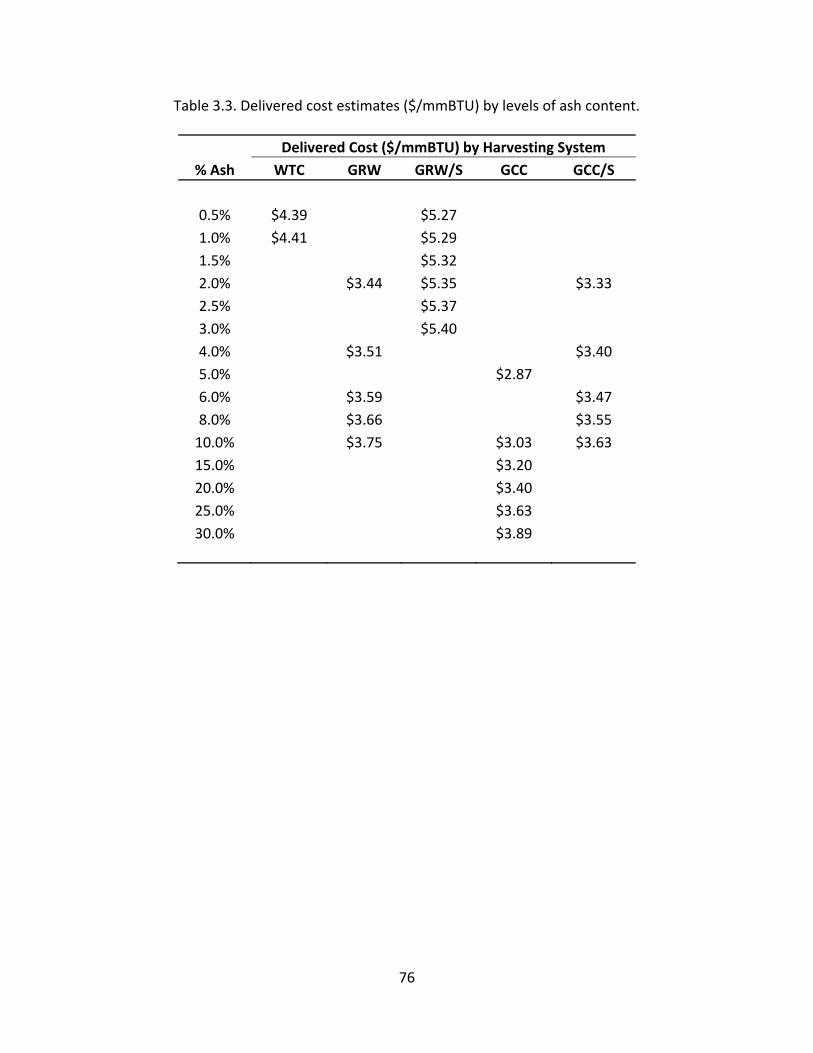
76
Table 3.3. Delivered cost estimates ($/mmBTU) by levels of ash content.
Delivered Cost ($/mmBTU) by Harvesting System % Ash WTC GRW GRW/S GCC GCC/S
0.5% $4.39 $5.27 1.0% $4.41 $5.29 1.5% $5.32 2.0% $3.44 $5.35 $3.33 2.5% $5.37 3.0% $5.40 4.0% $3.51 $3.40 5.0% $2.87 6.0% $3.59 $3.47 8.0% $3.66 $3.55 10.0% $3.75 $3.03 $3.63 15.0% $3.20 20.0% $3.40 25.0% $3.63 30.0% $3.89

77
Table 3.4. Ranking (lowest=1) of delivered cost estimates ($/field ton and $/mmBTU) for biomass harvesting systems under likely conditions.
System Delivered
Cost ($/F‐ton)Rank
Delivered Cost
($/mmBTU) Rank
GCC $22.48 1 $2.71 1 GCC/S $27.04 2 $3.05 3 GRW $28.07 3 $2.77 2 WTC‐50% $28.94 4 $3.55 5 WTC‐40% $30.36 5 $3.10 4 RW $31.07 6 $3.81 6 CC $31.20 7 $3.82 7 GRW/S $46.49 8 $4.20 8
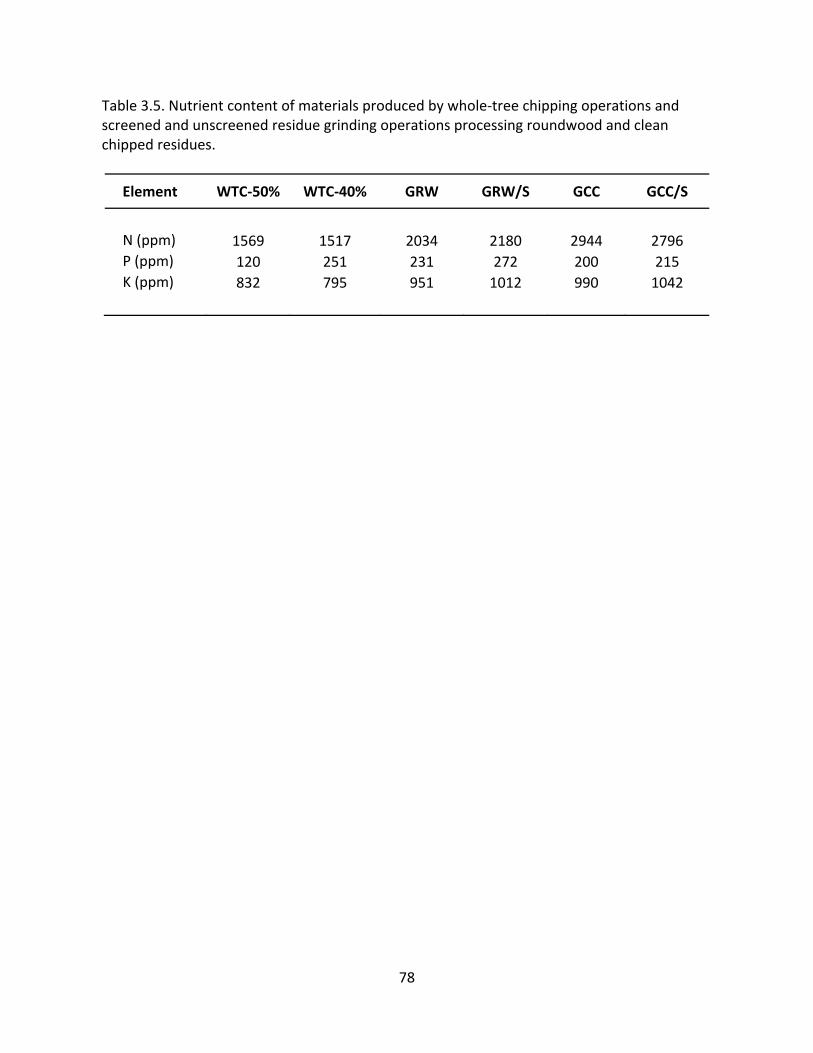
78
Table 3.5. Nutrient content of materials produced by whole‐tree chipping operations and screened and unscreened residue grinding operations processing roundwood and clean chipped residues.
Element WTC‐50% WTC‐40% GRW GRW/S GCC GCC/S
N (ppm) 1569 1517 2034 2180 2944 2796 P (ppm) 120 251 231 272 200 215 K (ppm) 832 795 951 1012 990 1042

79
Table 3.6. Estimated bone dry tons of biomass and pounds of N, P, and K removed per acre from forest biomass harvesting systems.
RW CC WTC GRW GRW/S GCC GCC/S
BDT removed/ac 38 33 45 48 46 48 47
Element (lbs/ac)
N 120 102 141 161 156 195 180
P 9 8 11 14 14 14 14
K 64 54 75 83 80 85 83

80
Figure 3.1. Delivered cost estimates ($/mmBTU) for increasing levels of moisture content.
$2
$3
$4
$5
$6
$7
30% 35% 40% 45% 50% 55%
Delivered
Cost ($/mmBT
U)
Moisture Content
GRW/S
GCCGCC/SGRW
WTC

81
Figure 3.2. Delivered cost estimates ($/mmBTU) for increasing tract sizes.
$4
$5
$6
$7
20 40 60 80 100
Delivered
Cost ($/mmBT
U)
Tract Size (acres)
RW
WTC
CC

82
Figure 3.3. Delivered cost estimates ($/mmBTU) for increasing amounts of field tons removed per acre.
$3
$4
$5
$6
$7
$8
20 30 40 50 60 70 80
Delivered
Cost ($/mmBT
U)
Field Tons Removed per Acre
CC
WTC
RW
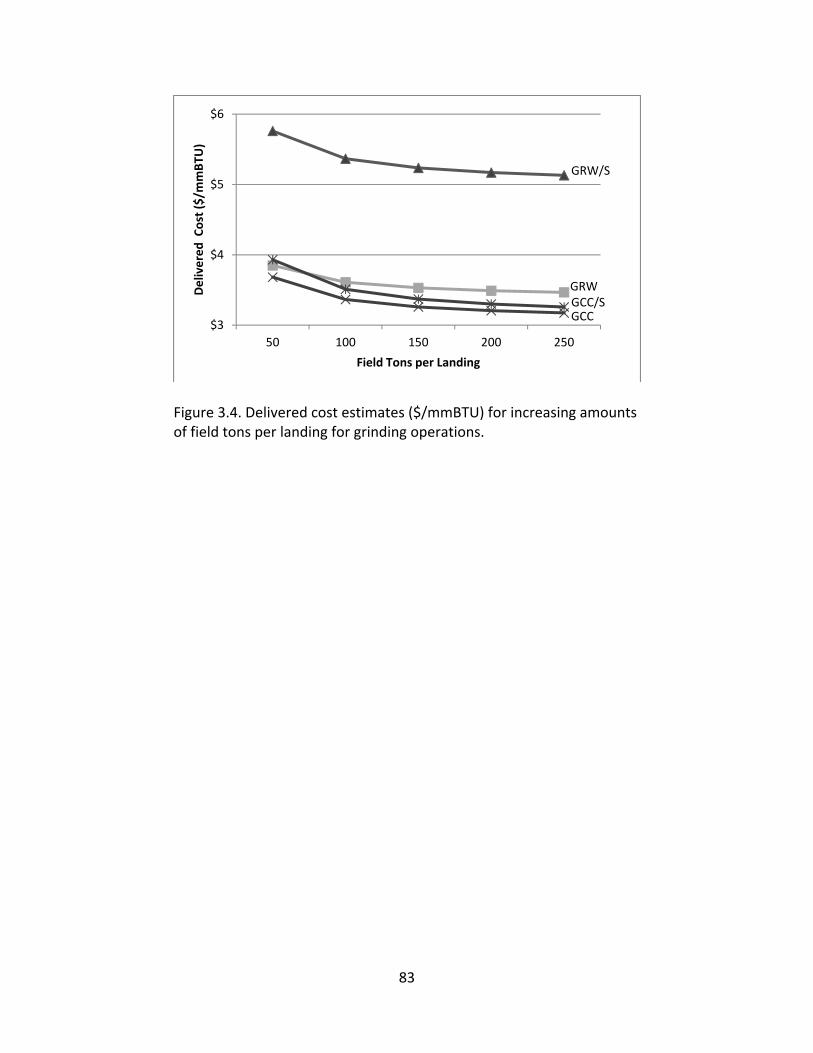
83
Figure 3.4. Delivered cost estimates ($/mmBTU) for increasing amounts of field tons per landing for grinding operations.
$3
$4
$5
$6
50 100 150 200 250
Delivered
Cost ($/mmBT
U)
Field Tons per Landing
GRW/S
GRWGCC/SGCC
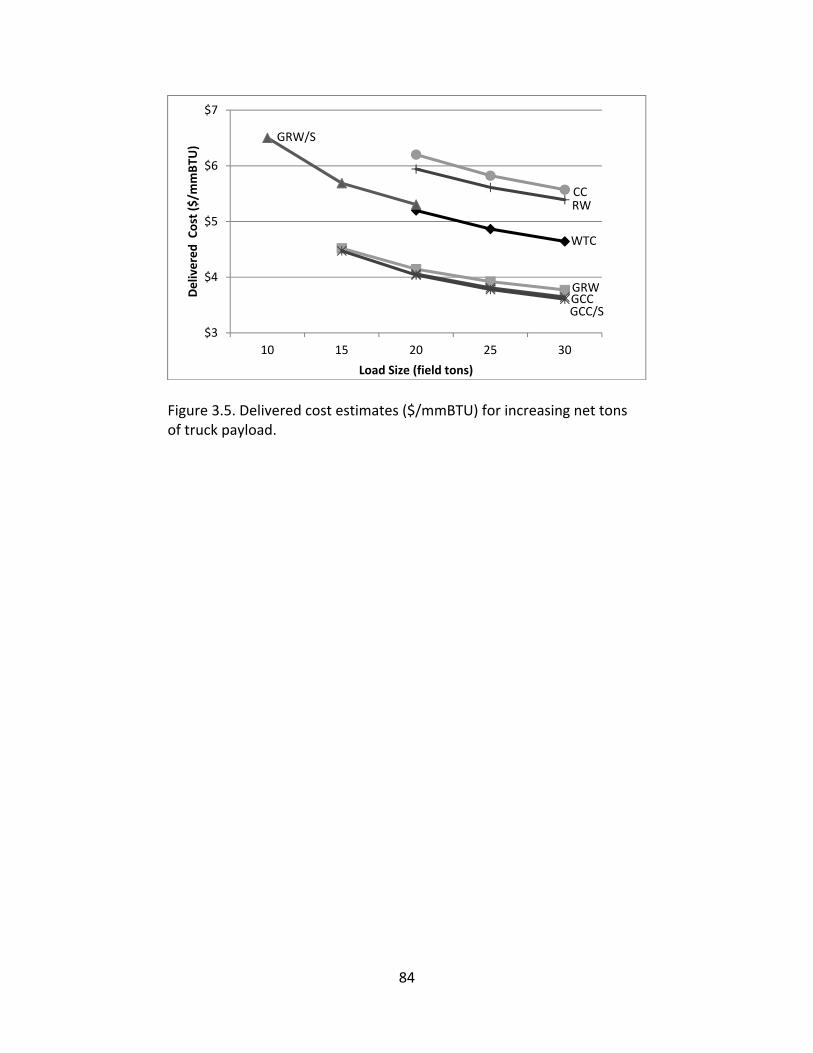
84
Figure 3.5. Delivered cost estimates ($/mmBTU) for increasing net tons of truck payload.
$3
$4
$5
$6
$7
10 15 20 25 30
Delivered
Cost ($/mmBT
U)
Load Size (field tons)
GRW/S
CC
WTC
RW
GRWGCCGCC/S

85
Figure 3.6. Delivered cost estimates ($/mmBTU) for increasing distance to market (miles).
$2
$3
$4
$5
$6
$7
40 60 80 100
Delivered
Cost ($/mmBT
U)
Distance to Market (miles)
WTC
RW
GRWGCC/SGCC
CC
GRW/S
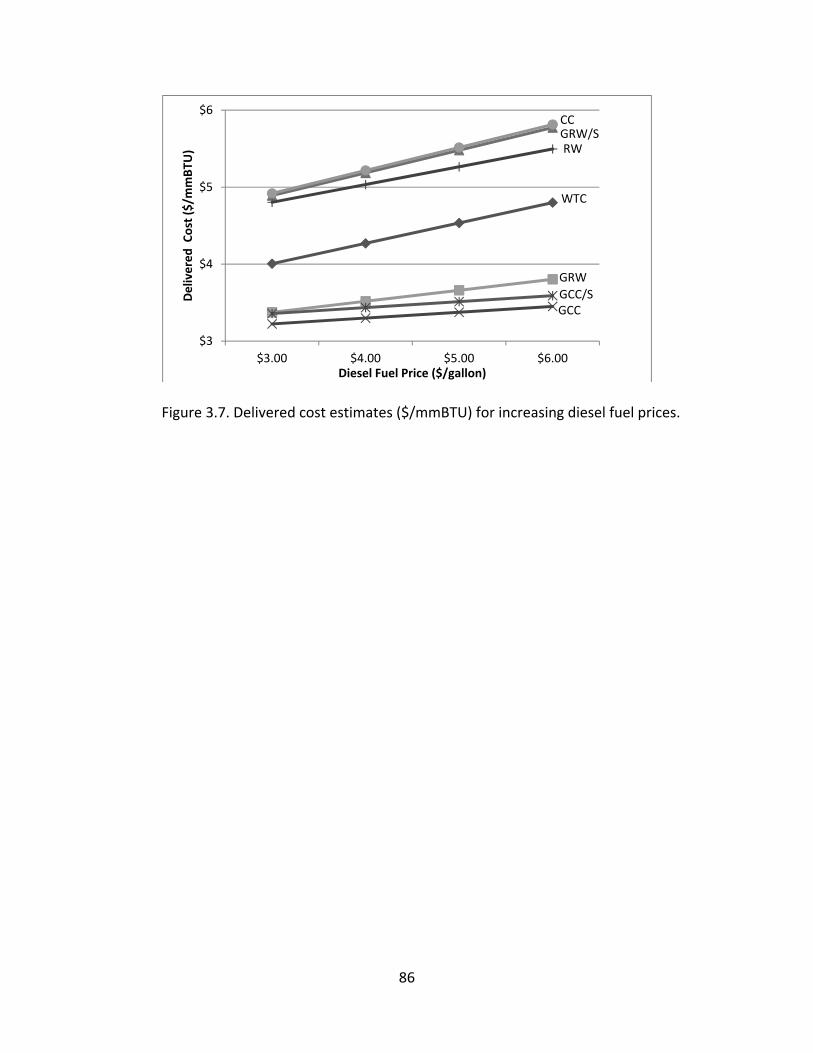
86
Figure 3.7. Delivered cost estimates ($/mmBTU) for increasing diesel fuel prices.
$3
$4
$5
$6
$3.00 $4.00 $5.00 $6.00
Delivered
Cost ($/mmBT
U)
Diesel Fuel Price ($/gallon)
GRW/SCC
WTC
RW
GRWGCC/SGCC

87
CHAPTER 4
SUMMARY
4.1 Transpirational Drying for Whole‐Tree Chipping
Transpirational drying in late summer for periods of at least four weeks resulted in
significant reductions in moisture content with no increase in ash content of the feedstock
produced. The first four weeks of drying resulted in the greatest reduction in moisture content
(from 53% to 43%) with the additional four weeks producing a smaller, but still significant
reduction to 39%.
Chipping productivity as measured in field tons per hour was greatest for green
material, but when compared in bone dry tons, the drying treatments produced slightly more
than the green treatment (38 BDT/hr vs 34 BDT/hr). This result translated to widely different
costs for material depending upon the unit of measure. The current convention in southern
timber operations pays for material on a green ton basis, in which case significant savings are
possible by harvesting and chipping green material. Much of this savings is due to transport
cost, which is higher in dried material due to an inability to obtain full legal payloads.
Examining material on a dry ton or mmBTU basis, however, changes the cost implications
substantially. Dried material represented a reduction in cost on a BDT or energy content basis
of roughly 15%. Improvements in trucking infrastructure could allow for full utilization of legal
payloads for dried chips and further increase these cost savings.

88
Chip size distribution, ash content, nutrient content, and amount of foliage did not
significantly differ among treatments. Bark content was significantly lower only for material
dried for 8 weeks as compared to 4 weeks or freshly felled. This was likely due to bark slippage
occurring during skidding and loading activities. While oven dry energy values for chips did not
differ significantly between treatments, energy content on a field condition basis were over
30% higher for chips produced from material dried at least 4 weeks compared to green
material.
Using transpirational drying in woody biomass harvesting operations may improve
product quality by increasing energy values without increasing ash content. Trees that have
been dried in the field to reduce moisture content cost more to harvest and transport than
fresh material when based on a wet or field condition ton basis, but will cost less when based
on energy content. Harvesting firms that deploy this strategy in a wood supply system that
utilizes an energy content payment system, as opposed to a wet weight‐based payment system,
could take advantage of potential economic advantages of transpirationally drying stems in the
field before processing and transportation.
4.2 Comparisons of Forest Biomass Harvesting Systems
Delivered costs associated with harvesting forest biomass for energy production
increased as moisture and ash content increased. A whole‐tree chipping operation was a very
suitable harvesting system if wood energy facilities require biomass material to meet an ash
content specification of less than 2%. The only grinding system capable of producing material
with less than 2% ash was one grinding roundwood logging residue using a screen, but its
delivered cost was almost $1.00 per mmBTU higher than that for a whole‐tree chipping system
89
due to severely limited truck payloads. The least costly ($2.87 per mmBTU) option where 5%
ash content was acceptable was a system grinding clean chipped residue without screening.
Tract size had minimal effects on any operation until the acreage declined below 40
acres. Clean chipping and conventional roundwood systems were considerably more expensive
than whole‐tree chipping operations on all tract sizes.
Costs for roundwood and chipping systems sharply declined as the amount of biomass
available on site increased, especially as field tons per acre removed increased from 20 to 50.
Truck payload and haul distance had considerable effects on delivered costs. Costs were
reduced as truck payload increased and haul distance decreased. Optimizing truck payload to
meet legal weight limits by lowering tare weight and increasing trailer volume capacity is an
opportunity for forest biomass harvesting system managers to achieve lower costs especially
when dealing with drier material or screened roundwood grindings. Fuel price increases
directly increase delivered costs and limit economical haul distances accordingly.
In the U.S. South forest biomass in roundwood form, though wetter than dried chips or
grindings, is typically more abundant, has an established harvesting and transportation
infrastructure, and is perceived to be cheaper than processed biomass to cut and haul to the
first delivery point. However, delivered pulpwood prices also include stumpage of
approximately $8.00 per ton and forest residue prices generally include up to $2.00 per ton
payable to forest landowners. There is also an additional cost to wood energy facilities to
convert roundwood into chips. The combination of stumpage prices and additional processing
costs for roundwood make in‐woods chipping and grinding systems a more attractive option.

90
Nutrient removals increased as forest biomass removal intensity increased. While
silvicultural applications are largely site‐specific, fertilization of forest stands may be necessary
to maintain site productivity following two‐pass systems such as a clean chipping operation
followed by its residue removal via a grinding operation. Fertilization may not be as necessary
following conventional roundwood and whole‐tree chipping operations. The effects of specific
biomass harvesting systems on site productivity are an opportunity for future research.

91
APPENDICES

92
Appendix A. Conventional Roundwood Logging Base Sensitivity Model
SYSTEM: Conventional Roundwood
STAND & STOCK TABLE GENERAL INFORMATION Tract Size = 60 AcresDBH Trees/Ac Tons/Tree Tons/Acre Hours/Day = 8 Moving time = 5 Hours
6 64 0.094 5.99 Days/Week = 5 Move Distance = 40 Miles8 46 0.219 10.09 Weeks/Year = 50 Distance home = 40 Miles
10 30 0.417 12.52 Scheduled Hrs/Year = 200012 20 0.524 10.49 Support: Roads to be Built:14 10 0.910 9.10 Pkups 2 $1.00 per mile Type Miles/# $/mi16 4 1.204 4.82 Foreman $5,000 per month Permanent 0 $10,00018 2 1.605 3.21 Overhead $5,000 per month Temporary 0.5 $3,00020 2 2.408 4.82 Saws 1 $2,500 each Push-out 1 $1,50022 0 0.00 Pounds/cord = 5350 Entrances 2 $2,00024 0 0.00 Pounds/tree = 899
TOTAL 178 80.00 Quad. Mean DBH = 9.35 Mill Quota (Tons per Week) = 9999
FELLING SKIDDING LOADING HAULINGMachine Productivity
BA/accum, sqft= 0.6 Avg Skid Distance Prep. Time = 12.00 Haul Distance (feet) = 880 Trees/Load = 56 (miles) = 60
DBH Min/T Hr/Ac Avg Turn Volume Cold (1=Yes) = 1 Average Speed6 0.29 0.31 (tons) = 2.75 Loading Time = 20.00 (mph) = 408 0.34 0.26 Load Size
10 0.38 0.19 (tons) = 25.012 0.43 0.14 Unloading Time14 0.47 0.08 Time per Turn Time per Load (minutes) = 3016 0.52 0.03 (minutes) = 5.61 (minutes) = 32.00 Loading Time18 2.51 0.08 (minutes) = 3020 2.88 0.1022 3.27 0.0024 3.67 0.00 Round Trip Time
TOTAL 1.20 (hours) = 4.00 Tons/PMH = 66.90 29.39 75.00 6.25 Oper Effy = 1.0 1.0 1.0 1.0
Machine Cost D ($/SMH)= 20.00 16.88 10.50 Haul Rate 1 II&T ($/SMH)= 10.50 9.70 8.10 ($/ton-mile) = 0.13 F&L ($/PMH)= 44.54 42.52 40.49 Minimum Haul M&R ($/PMH)= 23.53 17.87 11.12 (miles) = 40 Labor($/SMH)= 18.00 18.00 18.00 Labor overhead (%)= 40% 40% 40% Avail.(%) = 85 85 85 90 Number = 1 2 1 6.0
Tons Tons/SMH Cost per SMH CostFunction /PMH Avail% One All Utiliz% Fixed Oper Labor Total $/Ton
Felling 66.90 85 56.86 56.86 75 30.50 50.85 18.07 99.42 1.99 Skidding 29.39 85 24.98 49.97 85 53.16 102.65 36.14 191.95 3.84 Loading 75.00 85 63.75 63.75 67 18.60 34.39 18.07 71.06 1.42 Hauling 6.25 90 5.63 133 8.20 Support Pickups, Chainsaws, Foreman, and Overhead 1.63 Road Work 1.46 Moving 5.00 hours spent moving men & equipment to tract 0.19
System Rate (tons/SMH) = 49.97 Onboard Cost/Ton: 10.52Weekly production (tons, truck loads) = 1999 80Days required to cut tract = 13 Cut & haul Cost/Ton: 18.72
Cut & Haul Cost per mmBTU = 2.30
Minimum haul distance (miles) 40 Assumed payload (tons) 25.0Minimum haul rate ($/ton-mile) $0.14 Assumed fuel mileage (mpg) 5.5Incremental haul rate ($/ton-mile) $0.13 Assumed diesel price ($/gallon) $4.00Highway diesel price ($/gallon) $4.00Payload assumed in these rates 25
Base CaseMiles $/ton $/trip Fuel Cost Fuel % Fuel Adjust $/ton
60 $8.20 $205.00 $87.27 43% $0.00 $8.20

93
Appendix B. Clean Chipping Base Sensitivity Model
SYSTEM: Clean Chipping
HARVESTED STAND INFORMATION GENERAL INFORMATION Tract Size = 60 Acres Hours/Day = 8 Moving time = 8 Hours
Quad. Mean DBH = 8 Days/Week = 5 Move Distance = 40 Miles Weeks/Year = 50 Distance home = 40 Miles
Tons per acre removed = 80 Scheduled Hrs/Year = 2000Support: Roads to be Built:
Pred. Height = 45.46 Pkups 2 $1.00 per mile Tracts <= 40 acres $0.00 per tonPred. Whole Tree Wt. = 0.234 Foreman $5,000 per month Other tracts $0.00 per ton
Overhead $5,000 per monthTrees per acre = 342.15 Saws 1 $2,500 each Profit $1.00 per ton
Pounds/cord = 5350% Moisture Content = 0.50 Pounds/tree = 468
% Ash Content = 0.003
mmBTU/Dry Ton = 16.4 8202Mill Quota (Tons per Week) = 9999
Machine ProductivityFELLING SKIDDING LOADING CHIPPING HAULING
BA/felled bunch Avg Skid Distance Prep. Time, min. = 5 Load Size(sqft) = 0.6 (feet) = 660 Chipping time, min. = 20 (tons) = 25.0
Avg Turn Volume Loading TimeFelling time, PMH/acre 1.56 (tons) = 2.00 (minutes) = 25
Time per Turn Time per Load (minutes) = 4.89 (minutes) = 25.00 Round Trip Time
(hours) = 3.92 Tons/PMH = 51.24 Tons/PMH = 24.54 Tons/PMH = 75.00 Tons/PMH = 75.00 Tons/hour 6.38 Oper Effy = 1.0 Oper Effy = 1.0 Oper Effy = 1.2 Oper Effy = 1.0 Oper Effy = 1.0
Haul Distance (miles) = 60Average Speed (mph) = 40
Unloading Time (minutes) = 30
Machine CostFELLING SKIDDING LOADING CHIPPING
D ($/SMH)= 20.00 D ($/SMH)= 16.88 D ($/SMH)= 10.50 D ($/SMH)= 42.00 Haul Rate II&T ($/SMH)= 10.50 II&T ($/SMH)= 9.70 II&T ($/SMH)= 8.10 II&T ($/SMH)= 32.40 ($/ton-mile) = $0.13 F&L ($/PMH)= 44.54 F&L ($/PMH)= 42.52 F&L ($/PMH)= 40.49 F&L ($/PMH)= 161.97 Minimum Haul M&R ($/PMH)= 23.53 M&R ($/PMH)= 17.87 M&R ($/PMH)= 11.12 M&R ($/PMH)= 44.47 (miles) = 40 Labor($/SMH)= 18.00 Labor($/SMH)= 18.00 Labor($/SMH)= 18.00 Labor($/SMH)= 0.00 Labor overhead (%)= 40% Labor overhead (%)= 40% Labor overhead (%)= 40% Labor overhead (%)= 40% Avail.(%) = 85% Avail.(%) = 85% Avail.(%) = 85% Avail.(%) = 85% Avail.(%) = 90% Number = 1 Number = 2 Number = 1 Number = 1 Number = 4
Tons Tons/SMH Cost per SMH CostFunction /PMH Avail% One All Utiliz% Fixed Oper Labor Total $/Ton
Felling 51.24 1 43.55 43.55 45% 30.50 30.53 25.20 86.23 3.75Skidding 24.54 1 20.86 41.72 47% 53.16 56.55 50.40 160.10 6.97Loading 90.00 1 76.50 76.50 26% 18.60 13.18 25.20 56.98 2.48Chipping 75.00 1 63.75 63.75 31% 74.40 63.25 0.00 137.65 5.99Hauling 6.38 1 5.74 22.98 90% 7.33 Support Pickups, Chainsaws, Foreman, and Overhead 3.54 Road Work 0.00 Moving 8.00 hours spent moving men & equipment to tract 0.47 Profit 1.00
System Rate (tons/SMH) = 22.98Weekly production (tons, truck loads) = 919 37 Cut & Haul Cost per Field Ton = 31.52 $/BDT 63.04Days required to cut tract = 27 Cut & Load Cost per Field Ton = 24.19 $/BDT 48.39
Cut & Haul Cost per mmBTU = 3.85Cut & Load Cost per mmBTU = 2.96
Minimum haul distance (miles) 40 Assumed payload (tons) 25.0Minimum haul rate ($/ton-mile) $0.14 Assumed fuel mileage (mpg) 5.5Incremental haul rate ($/ton-mile) $0.13 Assumed diesel price ($/gallon) $3.00Highway diesel price ($/gallon) $4.00Payload assumed in these rates 25
Base CaseMiles $/ton $/trip Fuel Cost Fuel % Fuel Adjust $/ton
60 $8.20 $205.00 $87.27 43% -$21.82 $7.33

94
Appendix C. Whole‐Tree Chipping (50% MC) Base Sensitivity Model
SYSTEM: Whole Tree Chipping 50
HARVESTED STAND INFORMATION GENERAL INFORMATION Tract Size = 60 Acres Hours/Day = 8 Moving time = 8 Hours
Quad. Mean DBH = 8 Days/Week = 5 Move Distance = 40 Miles Weeks/Year = 50 Distance home = 40 Miles
Tons per acre removed = 80 Scheduled Hrs/Year = 2000Support: Roads to be Built:
Pred. Height = 45.46 Pkups 2 $1.00 per mile Tracts <= 40 acres $0.00 per tonPred. Whole Tree Wt. = 0.234 Foreman $5,000 per month Other tracts $0.00 per ton
Overhead $5,000 per monthTrees per acre = 342.15 Saws 1 $2,500 each Profit $1.00 per ton
Pounds/cord = 5350% Moisture Content = 0.50 Pounds/tree = 468
% Ash Content = 0.006
mmBTU/Dry Ton = 16.4 8202Mill Quota (Tons per Week) = 9999
Machine ProductivityFELLING SKIDDING LOADING CHIPPING HAULING
BA/felled bunch Avg Skid Distance Prep. Time, min. = 5 Load Size(sqft) = 0.6 (feet) = 660 Chipping time, min. = 20 (tons) = 25.0
Avg Turn Volume Loading TimeFelling time, PMH/acre 1.56 (tons) = 2.00 (minutes) = 25
Time per Turn Time per Load (minutes) = 4.89 (minutes) = 25.00 Round Trip Time
(hours) = 5.92 Tons/PMH = 51.24 Tons/PMH = 24.54 Tons/PMH = 75.00 Tons/PMH = 75.00 Tons/hour 4.23 Oper Effy = 1.0 Oper Effy = 1.0 Oper Effy = 1.2 Oper Effy = 1.0 Oper Effy = 1.0
Haul Distance (miles) = 100Average Speed (mph) = 40
Unloading Time (minutes) = 30
Machine CostFELLING SKIDDING LOADING CHIPPING
D ($/SMH)= 20.00 D ($/SMH)= 16.88 D ($/SMH)= 10.50 D ($/SMH)= 32.20 Haul Rate II&T ($/SMH)= 10.50 II&T ($/SMH)= 9.70 II&T ($/SMH)= 8.10 II&T ($/SMH)= 24.84 ($/ton-mile) = $0.13 F&L ($/PMH)= 44.54 F&L ($/PMH)= 42.52 F&L ($/PMH)= 40.49 F&L ($/PMH)= 161.97 Minimum Haul M&R ($/PMH)= 23.53 M&R ($/PMH)= 17.87 M&R ($/PMH)= 11.12 M&R ($/PMH)= 34.09 (miles) = 40 Labor($/SMH)= 18.00 Labor($/SMH)= 18.00 Labor($/SMH)= 18.00 Labor($/SMH)= 0.00 Labor overhead (%)= 40% Labor overhead (%)= 40% Labor overhead (%)= 40% Labor overhead (%)= 40% Avail.(%) = 85% Avail.(%) = 85% Avail.(%) = 85% Avail.(%) = 85% Avail.(%) = 90% Number = 1 Number = 2 Number = 1 Number = 1 Number = 4
Tons Tons/SMH Cost per SMH CostFunction /PMH Avail% One All Utiliz% Fixed Oper Labor Total $/Ton
Felling 51.24 1 43.55 43.55 30% 30.50 20.21 25.20 75.91 4.99Skidding 24.54 1 20.86 41.72 31% 53.16 37.43 50.40 140.99 9.27Loading 90.00 1 76.50 76.50 17% 18.60 8.72 25.20 52.52 3.45Chipping 75.00 1 63.75 63.75 20% 57.04 39.77 0.00 96.81 6.36Hauling 4.23 1 3.80 15.21 90% 13.40 Support Pickups, Chainsaws, Foreman, and Overhead 5.34 Road Work 0.00 Moving 8.00 hours spent moving men & equipment to tract 0.44 Profit 1.00
System Rate (tons/SMH) = 15.21Weekly production (tons, truck loads) = 608 24 Cut & Haul Cost per Field Ton = 44.26 $/BDT 88.51Days required to cut tract = 40 Cut & Load Cost per Field Ton = 30.86 $/BDT 61.71
Cut & Haul Cost per mmBTU = 5.43Cut & Load Cost per mmBTU = 3.78
Minimum haul distance (miles) 40 Assumed payload (tons) 25.0Minimum haul rate ($/ton-mile) $0.14 Assumed fuel mileage (mpg) 5.5Incremental haul rate ($/ton-mile) $0.13 Assumed diesel price ($/gallon) $4.00Highway diesel price ($/gallon) $4.00Payload assumed in these rates 25
Base CaseMiles $/ton $/trip Fuel Cost Fuel % Fuel Adjust $/ton100 $13.40 $335.00 $145.45 43% $0.00 $13.40
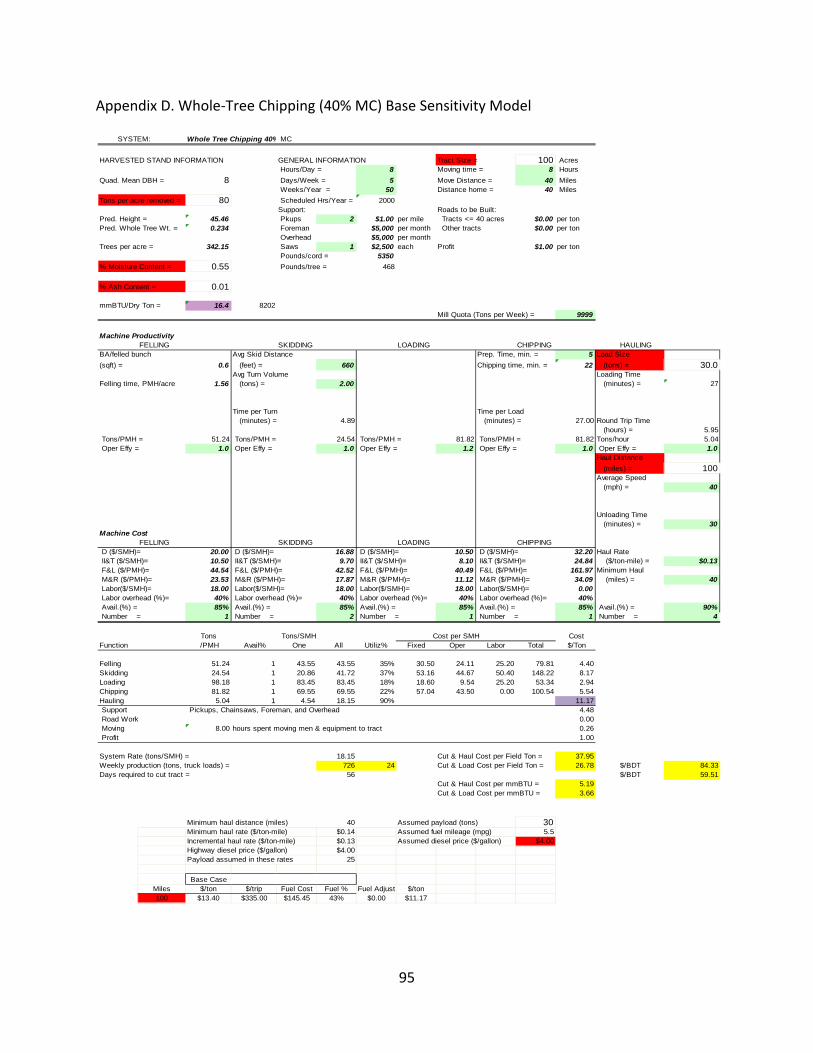
95
Appendix D. Whole‐Tree Chipping (40% MC) Base Sensitivity Model
SYSTEM: Whole Tree Chipping 40% MC
HARVESTED STAND INFORMATION GENERAL INFORMATION Tract Size = 100 Acres Hours/Day = 8 Moving time = 8 Hours
Quad. Mean DBH = 8 Days/Week = 5 Move Distance = 40 Miles Weeks/Year = 50 Distance home = 40 Miles
Tons per acre removed = 80 Scheduled Hrs/Year = 2000Support: Roads to be Built:
Pred. Height = 45.46 Pkups 2 $1.00 per mile Tracts <= 40 acres $0.00 per tonPred. Whole Tree Wt. = 0.234 Foreman $5,000 per month Other tracts $0.00 per ton
Overhead $5,000 per monthTrees per acre = 342.15 Saws 1 $2,500 each Profit $1.00 per ton
Pounds/cord = 5350% Moisture Content = 0.55 Pounds/tree = 468
% Ash Content = 0.01
mmBTU/Dry Ton = 16.4 8202Mill Quota (Tons per Week) = 9999
Machine ProductivityFELLING SKIDDING LOADING CHIPPING HAULING
BA/felled bunch Avg Skid Distance Prep. Time, min. = 5 Load Size(sqft) = 0.6 (feet) = 660 Chipping time, min. = 22 (tons) = 30.0
Avg Turn Volume Loading TimeFelling time, PMH/acre 1.56 (tons) = 2.00 (minutes) = 27
Time per Turn Time per Load (minutes) = 4.89 (minutes) = 27.00 Round Trip Time
(hours) = 5.95 Tons/PMH = 51.24 Tons/PMH = 24.54 Tons/PMH = 81.82 Tons/PMH = 81.82 Tons/hour 5.04 Oper Effy = 1.0 Oper Effy = 1.0 Oper Effy = 1.2 Oper Effy = 1.0 Oper Effy = 1.0
Haul Distance (miles) = 100Average Speed (mph) = 40
Unloading Time (minutes) = 30
Machine CostFELLING SKIDDING LOADING CHIPPING
D ($/SMH)= 20.00 D ($/SMH)= 16.88 D ($/SMH)= 10.50 D ($/SMH)= 32.20 Haul Rate II&T ($/SMH)= 10.50 II&T ($/SMH)= 9.70 II&T ($/SMH)= 8.10 II&T ($/SMH)= 24.84 ($/ton-mile) = $0.13 F&L ($/PMH)= 44.54 F&L ($/PMH)= 42.52 F&L ($/PMH)= 40.49 F&L ($/PMH)= 161.97 Minimum Haul M&R ($/PMH)= 23.53 M&R ($/PMH)= 17.87 M&R ($/PMH)= 11.12 M&R ($/PMH)= 34.09 (miles) = 40 Labor($/SMH)= 18.00 Labor($/SMH)= 18.00 Labor($/SMH)= 18.00 Labor($/SMH)= 0.00 Labor overhead (%)= 40% Labor overhead (%)= 40% Labor overhead (%)= 40% Labor overhead (%)= 40% Avail.(%) = 85% Avail.(%) = 85% Avail.(%) = 85% Avail.(%) = 85% Avail.(%) = 90% Number = 1 Number = 2 Number = 1 Number = 1 Number = 4
Tons Tons/SMH Cost per SMH CostFunction /PMH Avail% One All Utiliz% Fixed Oper Labor Total $/Ton
Felling 51.24 1 43.55 43.55 35% 30.50 24.11 25.20 79.81 4.40Skidding 24.54 1 20.86 41.72 37% 53.16 44.67 50.40 148.22 8.17Loading 98.18 1 83.45 83.45 18% 18.60 9.54 25.20 53.34 2.94Chipping 81.82 1 69.55 69.55 22% 57.04 43.50 0.00 100.54 5.54Hauling 5.04 1 4.54 18.15 90% 11.17 Support Pickups, Chainsaws, Foreman, and Overhead 4.48 Road Work 0.00 Moving 8.00 hours spent moving men & equipment to tract 0.26 Profit 1.00
System Rate (tons/SMH) = 18.15 Cut & Haul Cost per Field Ton = 37.95Weekly production (tons, truck loads) = 726 24 Cut & Load Cost per Field Ton = 26.78 $/BDT 84.33Days required to cut tract = 56 $/BDT 59.51
Cut & Haul Cost per mmBTU = 5.19Cut & Load Cost per mmBTU = 3.66
Minimum haul distance (miles) 40 Assumed payload (tons) 30Minimum haul rate ($/ton-mile) $0.14 Assumed fuel mileage (mpg) 5.5Incremental haul rate ($/ton-mile) $0.13 Assumed diesel price ($/gallon) $4.00Highway diesel price ($/gallon) $4.00Payload assumed in these rates 25
Base CaseMiles $/ton $/trip Fuel Cost Fuel % Fuel Adjust $/ton100 $13.40 $335.00 $145.45 43% $0.00 $11.17

96
Appendix E. Roundwood Residue Grinding Base Sensitivity Model
SYSTEM: G1R8U Unscreened Large Grinder With 8 Week Roundwood Debris
HARVESTED STAND INFORMATION GENERAL INFORMATIONTons per grinder setup = 150 Hours/Day = 10 Moving time = 8 Hours
Days/Week = 5 Move Distance = 40 Miles# Setups per site = 3 Weeks/Year = 50 Distance home = 40 Miles
Scheduled Hrs/Year = 2500Avg. Move Time Support: Roads to be Built:Between Setups (min.) 29 Pkups 1 $1.00 per mile Tracts <= 40 acres $0.00 per ton
Deckhand $3,200 per month Other tracts $0.00 per ton% Moisture Content = 0.30 Overhead $5,000 per month
Saws 0 $2,500 each Profit $1.00 per ton% Ash Content = 0.04
mmBTU/Dry Ton = 15.1Residue Type 0(0=Roundwood 1= Clean Chip Residue)Grinder Size LargeDebris Age, weeks 8Screened 0(0=No, 1=Yes) Mill Quota (Tons per Week) = 9999
Machine ProductivityFRONT-END LOADER GRINDER SCREEN HAULING
Avg. Tons/Bite 0.63 Prep. Time, min. = 5 Load SizeGrinding time, min. = 34.9 (tons) = 25
Bites/Hour 65.4 Loading Time (minutes) = 40
Time per Load Round Trip Time (minutes) = 39.85 (hours) = 4.16
Tons/hour = 6.00 Tons/PMH = 40.99 Tons/PMH = 43.04 Tons/PMH = 43.04 Oper Effy = 1.1 Oper Effy = 1.1 Oper Effy = 1.0 Oper Effy = 1.0
Haul Distance (miles) = 60Average Speed (mph) = 40
Unloading TimeMachine Cost (minutes) = 30 D ($/SMH)= 12.95 D ($/SMH)= 35.00 D ($/SMH)= 18.55 Haul Rate II&T ($/SMH)= 9.99 II&T ($/SMH)= 27.00 II&T ($/SMH)= 14.31 ($/ton-mile) = $0.13 F&L ($/PMH)= 45.55 F&L ($/PMH)= 157.92 F&L ($/PMH)= 35.23 Minimum Haul M&R ($/PMH)= 13.71 M&R ($/PMH)= 37.06 M&R ($/PMH)= 19.64 (miles) = 40 Labor($/SMH)= 25.20 Labor($/SMH)= 0.00 Labor($/SMH)= 0.00 Labor overhead (%)= 40% Labor overhead (%)= 40% Labor overhead (%)= 40% Avail.(%) = 85 Avail.(%) = 85 Avail.(%) = 85 Avail.(%) = 90 Number = 1 Number = 1 Number = 1 Number = 4
Tons Tons/SMH Cost per SMH CostFunction /PMH Avail% One All Utiliz% Fixed Oper Labor Total $/TonFront End 43.04 85 36.58 36.58 50 22.94 29.76 25.30 78.00 3.61Grinding 45.19 85 38.41 38.41 48 62.00 93.25 0.00 155.25 7.18Screen 43.04 0 0.00 0.00 50 0.00 0.00 0.00 0.00 0.00Hauling 6.00 90 5.40 21.61 90 8.20Support Pickups, Chainsaws, Deckhand, and Overhead 2.19Road Work 0.00Moving Setup 0.13Moving Tracts 8.00 hours spent moving men & equipment to tract 1.14Profit 1.00
System Rate (tons/SMH) = 21.61 Cut & Haul Cost per Field Ton = 23.45Weekly production (tons, truck loads) = 1081 43 Cut & Load Cost per Field Ton = 15.25Days required to cut tract = 3
Cut & Haul Cost per ODT = 33.50Cut & Load Cost per ODT = 21.79
Cut & Haul Cost per mmBTU = 2.31Cut & Load Cost per mmBTU = 1.51
Minimum haul distance (miles) 40 Assumed payload (tons) 25Minimum haul rate ($/ton-mile) $0.14 Assumed fuel mileage (mpg) 5.5Incremental haul rate ($/ton-mile) $0.13 Assumed diesel price ($/gallon) $4.00Highway diesel price ($/gallon) $4.00Payload assumed in these rates 25
Base CaseMiles $/ton $/trip Fuel Cost Fuel % Fuel Adjust $/ton
60 $8.20 $205.00 $87.27 43% $0.00 $8.20

97
Appendix F. Roundwood Residue Grinding (Screened) Base Sensitivity Model
SYSTEM: G1R8 Screened Large Grinder With 8 Week Roundwood Debris
HARVESTED STAND INFORMATION GENERAL INFORMATIONTons per grinder setup = 150 Hours/Day = 10 Moving time = 8 Hours
Days/Week = 5 Move Distance = 40 Miles# Setups per site = 3 Weeks/Year = 50 Distance home = 40 Miles
Scheduled Hrs/Year = 2500Avg. Move Time Support: Roads to be Built:Between Setups (min.) 85 Pkups 1 $1.00 per mile Tracts <= 40 acres $0.00 per ton
Deckhand $3,200 per month Other tracts $0.00 per ton% Moisture Content = 0.30 Overhead $5,000 per month
Saws 0 $2,500 each Profit $1.00 per ton% Ash Content = 0.014mmBTU/Dry Ton = 16.0Residue Type 0(0=Roundwood 1= Clean Chip Residue)Grinder Size LargeDebris Age, weeks 8Screened 1(0=No, 1=Yes) Mill Quota (Tons per Week) = 9999
Machine ProductivityFRONT-END LOADER GRINDER SCREEN HAULING
Avg. Tons/Bite 0.41 Prep. Time, min. = 5 Load SizeGrinding time, min. = 67.5 (tons) = 25
Bites/Hour 51.4 Loading Time (minutes) = 72
Time per Load Round Trip Time (minutes) = 72.47 (hours) = 4.71
Tons/hour = 5.31 Tons/PMH = 21.17 Tons/PMH = 22.23 Tons/PMH = 22.23 Oper Effy = 1.1 Oper Effy = 1.1 Oper Effy = 1.0 Oper Effy = 1.0
Haul Distance (miles) = 60Average Speed (mph) = 40
Unloading TimeMachine Cost (minutes) = 30 D ($/SMH)= 12.95 D ($/SMH)= 35.00 D ($/SMH)= 18.55 Haul Rate II&T ($/SMH)= 9.99 II&T ($/SMH)= 27.00 II&T ($/SMH)= 14.31 ($/ton-mile) = $0.13 F&L ($/PMH)= 45.55 F&L ($/PMH)= 157.92 F&L ($/PMH)= 35.23 Minimum Haul M&R ($/PMH)= 13.71 M&R ($/PMH)= 37.06 M&R ($/PMH)= 19.64 (miles) = 40 Labor($/SMH)= 25.20 Labor($/SMH)= 0.00 Labor($/SMH)= 0.00 Labor overhead (%)= 40% Labor overhead (%)= 40% Labor overhead (%)= 40% Avail.(%) = 85 Avail.(%) = 85 Avail.(%) = 85 Avail.(%) = 90 Number = 1 Number = 1 Number = 1 Number = 4
Tons Tons/SMH Cost per SMH CostFunction /PMH Avail% One All Utiliz% Fixed Oper Labor Total $/TonFront End 22.23 85 18.90 18.90 85 22.94 50.38 25.30 98.62 5.22Grinding 23.34 85 19.84 19.84 81 62.00 157.84 0.00 219.84 11.63Screen 22.23 85 18.90 18.90 85 32.86 46.64 0.00 79.50 4.21Hauling 5.31 90 4.78 19.12 89 8.20Support Pickups, Chainsaws, Deckhand, and Overhead 2.51Road Work 0.00Moving Setup 0.60Moving Tracts 8.00 hours spent moving men & equipment to tract 1.72Profit 1.00
System Rate (tons/SMH) = 18.90Weekly production (tons, truck loads) = 945 38 Cut & Haul Cost per Field Ton = 35.08Days required to cut tract = 3 Cut & Load Cost per Field Ton = 26.88
Cut & Haul Cost per ODT = 50.12Cut & Load Cost per ODT = 38.40
Cut & Haul Cost per mmBTU = 3.17Cut & Load Cost per mmBTU = 2.43
Minimum haul distance (miles) 40 Assumed payload (tons) 25Minimum haul rate ($/ton-mile) $0.14 Assumed fuel mileage (mpg) 5.5Incremental haul rate ($/ton-mile) $0.13 Assumed diesel price ($/gallon) $4.00Highway diesel price ($/gallon) $4.00Payload assumed in these rates 25
Base CaseMiles $/ton $/trip Fuel Cost Fuel % Fuel Adjust $/ton
60 $8.20 $205.00 $87.27 43% $0.00 $8.20

98
Appendix G. Clean Chip Residue Grinding Base Sensitivity Model
SYSTEM: G1C8 Screened Large Grinder With 8 Week Clean Chipped Debris
HARVESTED STAND INFORMATION GENERAL INFORMATIONTons per grinder setup = 150 Hours/Day = 10 Moving time = 8 Hours
Days/Week = 5 Move Distance = 40 Miles# Setups per site = 3 Weeks/Year = 50 Distance home = 40 Miles
Scheduled Hrs/Year = 2500Avg. Move Time Support: Roads to be Built:Between Setups (min.) 85 Pkups 1 $1.00 per mile Tracts <= 40 acres $0.00 per ton
Deckhand $3,200 per month Other tracts $0.00 per ton% Moisture Content = 0.40 Overhead $5,000 per month
Saws 0 $2,500 each Profit $1.00 per ton% Ash Content = 0.12
mmBTU/Dry Ton = 15.7
Residue Type 1(0=Roundwood 1= Clean Chip Residue)
Grinder Size Large
Debris Age, weeks 8
Screened 1(0=No, 1=Yes) Mill Quota (Tons per Week) = 9999
Machine ProductivityFRONT-END LOADER GRINDER SCREEN HAULING
Avg. Tons/Bite 1.02 Prep. Time, min. = 5 Load SizeGrinding time, min. = 16.7 (tons) = 25
Bites/Hour 83.3 Loading Time (minutes) = 22
Time per Load Round Trip Time (minutes) = 21.73 (hours) = 3.86
Tons/hour = 6.47 Tons/PMH = 85.41 Tons/PMH = 89.68 Tons/PMH = 89.68 Oper Effy = 1.1 Oper Effy = 1.1 Oper Effy = 1.0 Oper Effy = 1.0
Haul Distance (miles) = 60Average Speed (mph) = 40
Unloading TimeMachine Cost (minutes) = 30 D ($/SMH)= 12.95 D ($/SMH)= 35.00 D ($/SMH)= 0.00 Haul Rate II&T ($/SMH)= 9.99 II&T ($/SMH)= 27.00 II&T ($/SMH)= 0.00 ($/ton-mile) = $0.13 F&L ($/PMH)= 45.55 F&L ($/PMH)= 157.92 F&L ($/PMH)= 0.00 Minimum Haul M&R ($/PMH)= 13.71 M&R ($/PMH)= 37.06 M&R ($/PMH)= 0.00 (miles) = 40 Labor($/SMH)= 25.20 Labor($/SMH)= 0.00 Labor($/SMH)= 0.00 Labor overhead (%)= 40% Labor overhead (%)= 40% Labor overhead (%)= 40% Avail.(%) = 85 Avail.(%) = 85 Avail.(%) = 85 Avail.(%) = 90 Number = 1 Number = 1 Number = 1 Number = 4
Tons Tons/SMH Cost per SMH CostFunction /PMH Avail% One All Utiliz% Fixed Oper Labor Total $/TonFront End 89.68 85 76.23 76.23 26 22.94 15.40 25.30 63.64 2.73Grinding 94.16 85 80.04 80.04 25 62.00 48.25 0.00 110.25 4.73Screen 89.68 85 76.23 76.23 26 0.00 0.00 0.00 0.00 0.00Hauling 6.47 90 5.83 23.30 90 8.20Support Pickups, Chainsaws, Deckhand, and Overhead 2.03Road Work 0.00Moving Setup 0.39Moving Tracts 8.00 hours spent moving men & equipment to tract 1.14Profit 1.00
System Rate (tons/SMH) = 23.30Weekly production (tons, truck loads) = 1165 47 Cut & Haul Cost per Field Ton = 20.22Days required to cut tract = 3 Cut & Load Cost per Field Ton = 12.02
Cut & Haul Cost per ODT = 33.70Cut & Load Cost per ODT = 20.04
Cut & Haul Cost per mmBTU = 2.43Cut & Load Cost per mmBTU = 1.45
Minimum haul distance (miles) 40 Assumed payload (tons) 25Minimum haul rate ($/ton-mile) $0.14 Assumed fuel mileage (mpg) 5.5Incremental haul rate ($/ton-mile) $0.13 Assumed diesel price ($/gallon) $4.00Highway diesel price ($/gallon) $4.00Payload assumed in these rates 25
Base CaseMiles $/ton $/trip Fuel Cost Fuel % Fuel Adjust $/ton
60 $8.20 $205.00 $87.27 43% $0.00 $8.20

99
Appendix H. Clean Chip Residue Grinding (Screened) Base Sensitivity Model
SYSTEM: G1C8 Screened Large Grinder With 8 Week Clean Chipped Debris
HARVESTED STAND INFORMATION GENERAL INFORMATIONTons per grinder setup = 150 Hours/Day = 10 Moving time = 8 Hours
Days/Week = 5 Move Distance = 40 Miles# Setups per site = 3 Weeks/Year = 50 Distance home = 40 Miles
Scheduled Hrs/Year = 2500Avg. Move Time Support: Roads to be Built:Between Setups (min.) 85 Pkups 1 $1.00 per mile Tracts <= 40 acres $0.00 per ton
Deckhand $3,200 per month Other tracts $0.00 per ton% Moisture Content = 0.40 Overhead $5,000 per month
Saws 0 $2,500 each Profit $1.00 per ton% Ash Content = 0.06mmBTU/Dry Ton = 15.7Residue Type 1(0=Roundwood 1= Clean Chip Residue)Grinder Size LargeDebris Age, weeks 8Screened 1(0=No, 1=Yes) Mill Quota (Tons per Week) = 9999
Machine ProductivityFRONT-END LOADER GRINDER SCREEN HAULING
Avg. Tons/Bite 1.02 Prep. Time, min. = 5 Load SizeGrinding time, min. = 16.7 (tons) = 25
Bites/Hour 83.3 Loading Time (minutes) = 22
Time per Load Round Trip Time (minutes) = 21.73 (hours) = 3.86
Tons/hour = 6.47 Tons/PMH = 85.41 Tons/PMH = 89.68 Tons/PMH = 89.68 Oper Effy = 1.1 Oper Effy = 1.1 Oper Effy = 1.0 Oper Effy = 1.0
Haul Distance (miles) = 60Average Speed (mph) = 40
Unloading TimeMachine Cost (minutes) = 30 D ($/SMH)= 12.95 D ($/SMH)= 35.00 D ($/SMH)= 18.55 Haul Rate II&T ($/SMH)= 9.99 II&T ($/SMH)= 27.00 II&T ($/SMH)= 14.31 ($/ton-mile) = $0.13 F&L ($/PMH)= 45.55 F&L ($/PMH)= 157.92 F&L ($/PMH)= 35.23 Minimum Haul M&R ($/PMH)= 13.71 M&R ($/PMH)= 37.06 M&R ($/PMH)= 19.64 (miles) = 40 Labor($/SMH)= 25.20 Labor($/SMH)= 0.00 Labor($/SMH)= 0.00 Labor overhead (%)= 40% Labor overhead (%)= 40% Labor overhead (%)= 40% Avail.(%) = 85 Avail.(%) = 85 Avail.(%) = 85 Avail.(%) = 90 Number = 1 Number = 1 Number = 1 Number = 4
Tons Tons/SMH Cost per SMH CostFunction /PMH Avail% One All Utiliz% Fixed Oper Labor Total $/TonFront End 89.68 85 76.23 76.23 26 22.94 15.40 25.30 63.64 2.73Grinding 94.16 85 80.04 80.04 25 62.00 48.25 0.00 110.25 4.73Screen 89.68 85 76.23 76.23 26 32.86 14.26 0.00 47.12 2.02Hauling 6.47 90 5.83 23.30 90 8.20Support Pickups, Chainsaws, Deckhand, and Overhead 2.03Road Work 0.00Moving Setup 0.60Moving Tracts 8.00 hours spent moving men & equipment to tract 1.72Profit 1.00
System Rate (tons/SMH) = 23.30Weekly production (tons, truck loads) = 1165 47 Cut & Haul Cost per Field Ton = 23.03Days required to cut tract = 3 Cut & Load Cost per Field Ton = 14.83
Cut & Haul Cost per ODT = 38.39Cut & Load Cost per ODT = 24.72
Cut & Haul Cost per mmBTU = 2.60Cut & Load Cost per mmBTU = 1.67
Minimum haul distance (miles) 40 Assumed payload (tons) 25Minimum haul rate ($/ton-mile) $0.14 Assumed fuel mileage (mpg) 5.5Incremental haul rate ($/ton-mile) $0.13 Assumed diesel price ($/gallon) $4.00Highway diesel price ($/gallon) $4.00Payload assumed in these rates 25
Base CaseMiles $/ton $/trip Fuel Cost Fuel % Fuel Adjust $/ton
60 $8.20 $205.00 $87.27 43% $0.00 $8.20
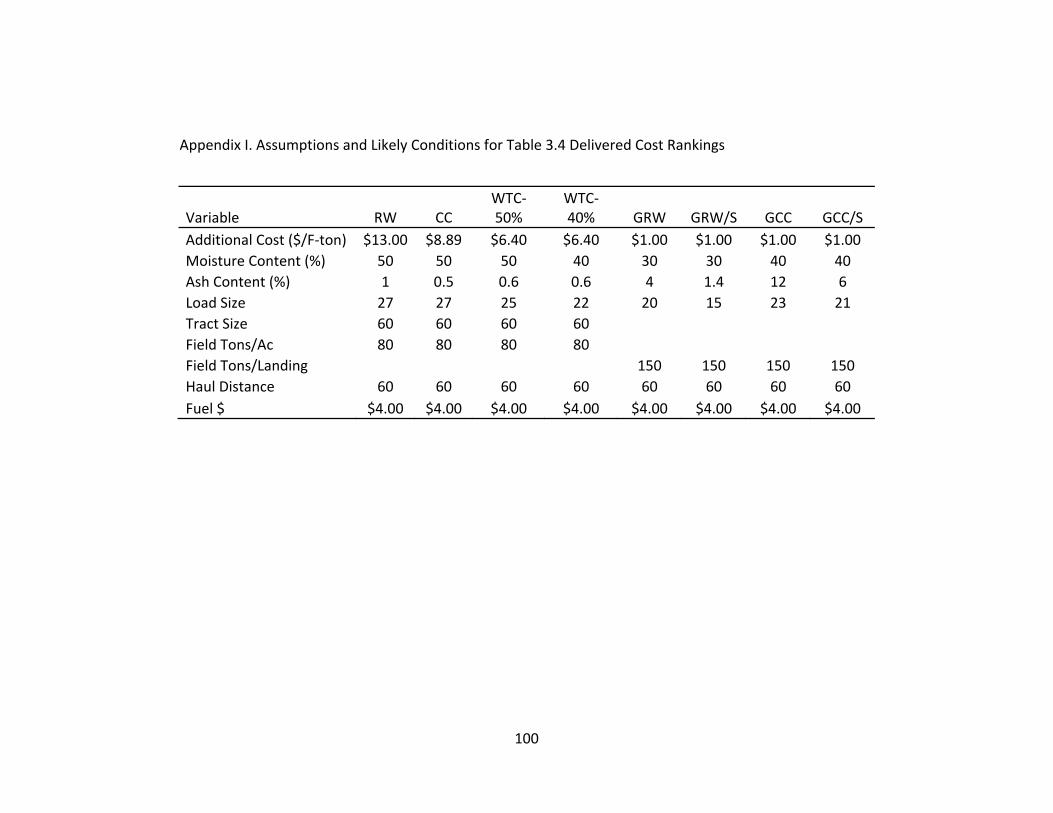
100
Appendix I. Assumptions and Likely Conditions for Table 3.4 Delivered Cost Rankings
Variable RW CC WTC‐50%
WTC‐40% GRW GRW/S GCC GCC/S
Additional Cost ($/F‐ton) $13.00 $8.89 $6.40 $6.40 $1.00 $1.00 $1.00 $1.00 Moisture Content (%) 50 50 50 40 30 30 40 40 Ash Content (%) 1 0.5 0.6 0.6 4 1.4 12 6 Load Size 27 27 25 22 20 15 23 21 Tract Size 60 60 60 60 Field Tons/Ac 80 80 80 80 Field Tons/Landing 150 150 150 150 Haul Distance 60 60 60 60 60 60 60 60 Fuel $ $4.00 $4.00 $4.00 $4.00 $4.00 $4.00 $4.00 $4.00