Embed Size (px)
Citation preview

ww
w.o
eko.
de
Options for continuing GHG abatement from CDM and JI industrial gas projects

2
The lack of ambition in emission reduction targets be-yond 2012 and the related low demand of emission re-duction certificates jeopardizes the further operation of CDM and JI project activities and even more so the development and registration of new projects. Espe-cially project activities without benefits beyond emis-sion reduction are depending at a large extent or total-ly on revenues from selling certificates on the carbon.
This study, commissioned by the Federal Ministry for the Environment, Nature Conservation, Building and Nuclear Safety (BMUB) in the framework of the CDM/JI initiative, focuses on HFC-23 and N2O CDM/JI pro-jects. The analysis however also looks at emissions from the same type of installations not covered by Kyoto Mechanisms.
The study’s findings are very clear. Maintaining the emission reductions initiated by the Kyoto mechanisms and enlarging the coverage on all relevant installations emitting HFC-23 or N20 would deliver a considerable contribution to closing the emission gap in 2020.
General conclusions of the analysis also apply to other project types with similar economic features. Detailed analysis of other project types addressing methane, CO2 or other GHGs would however have to be subject to further research activities.
In a second step the study evaluates political options to maintain and increase mitigation in the addressed installations. Options include action on international, multinational and / or domestic level.
With this study the BMUB aims to initiate discussion and evaluate solutions to preserve and increase the emission reductions in CDM and JI projects during a period of very low carbon prices.
Looking back the results show the impressive scope of emission reductions initiated via the Kyoto Mecha-nisms; looking forward the analysis shows concrete approaches to maintain and expand those reductions.
The study highlights that about 7.5 Gt CO2e could be abated in developing countries, Russia, and Ukraine, at an average cost of 0.47 EUR / tCO2e. In 2020. This would contribute about 3-5% of the global mitigation effort needed in addition to current pledges to close the gap of 8-12 Gt CO2e. Looking to costs, implemen-ted HFC-23 and adipic acid projects have very low marginal technical abatement costs at 0.06-0.07 EUR / t CO2e and make up 0.16 Gt CO2e or a third of the ove-rall GHG abatement potential of these project types.
These few figures are encouraging. Thus the questi-on how to safeguard the further operating of existing HFC-23 and N2O projects should be put on the inter-national agenda.
Both host countries and the international community have a responsibility to ensure continued GHG aba-tement in CDM and JI projects and to take actions to abate GHG emissions in new facilities. The message of this study is clear: This is possible at low or limited co-sts. The study shows several policy options, however not a silver bullet. Combining international or bilateral support with a long-term solution implemented by the host country might be the best way.
Berlin, May 2014
Silke Karcher
German Federal Ministry for the Environment, Nature Conservation, Building and Nuclear Safety
© Öko-Institut e.V.Institute for Applied EcologyMay 2014 Authors:Lambert Schneider (Consultant)Martin Cames (Öko-Institut)
This report was funded by the German Federal Mi-nistry for the Environment, Nature Conservation, Building and Nuclear Safety. The report reflects the personal views of the authors and not of the German government or any other institution.
Oeko-Institut, Berlin officeSchickler Strasse 5-710179 [email protected] Design and layout:Tobias Binnig, www.gestalter.dePicture Credit Cover: © tomas - Fotolia.com
Introductory remarks

3
The project-based market mechanisms under the Kyoto Protocol – the Clean Development Mecha-nism (CDM) and Joint Implementation (JI) – have successfully enabled the implementation of a very large number of emission reduction projects. Ho-wever, market prices for CERs and ERUs have fallen to well below 1 EUR, with severe consequences: the development of new projects has largely stopped and some already registered projects are not imple-mented; other projects have stopped the issuance of CERs and ERUs. Some projects are also at risk of stopping the abatement of GHG emissions – which is the focus of this study.
Projects that do not have significant revenues other than CERs or EURs face a particularly high risk of stopping GHG abatement. These project types constitute about 14% of the future annual emission reduction potential from all CDM and JI projects. This study focuses on the three project types with the lar-gest GHG abatement potential: HFC-23 abatement from HCFC-22 production, N2O abatement from adi-pic acid production, and N2O abatement from nitric acid production. Project types with a moderate risks of stopping GHG abatement include methane avo-idance from biomass collection, composting, manu-re management, waste water treatment, the capture of CH4 from coal mines, fossil fuel switch, demand-side energy efficiency projects which are mostly im-plemented under programmes of activities (PoAs). In contrast, renewable power, energy efficiency supply side, and other project types will likely continue GHG abatement. These project types cover about two third of the future annual emission reduction poten-tial from all CDM and JI projects.
The three industrial gas project types assessed – HFC-23, adipic acid, and nitric acid – offer a large mitigation potential at a very low cost. Over the period of 2013 to 2030, we estimate that about 7.5 Gt CO2e could be abated in developing countries, Russia, and Ukraine, at an average cost of 0.47 EUR / tCO2e. In 2020, the total GHG abatement potential amounts to about 0.4 Gt CO2e and could thus con-tribute about 3-5% of the mitigation gap of 8-12 Gt CO2e, which is deemed necessary in addition to cur-rent pledges to be on track towards meeting the 2 degree target (UNEP 2013a). Already implemented HFC-23 and adipic acid projects have very low mar-ginal technical abatement costs below 0.10 EUR / t CO2e and make up 0.16 Gt CO2e – a third of the ove-rall GHG abatement potential.
In this study, we assess five policy options for addres-sing the risk of stopping GHG abatement – regulati-ons by the host country, inclusion in domestic ETSs, domestic use of credits, international or bilateral purchase of credits, and international or bilateral funding of abatement – and recommend the follow-ing:
In the light of growing production and emissions, GHG abatement should be ensured in the long term through policies that require or incentivize GHG abatement, including plants which will be built and commissioned in the future.
Perverse incentives can undermine mitigation efforts and lead to market distortions. For HCFC-22 and adipic acid installations are vulnerable to perverse incentives. For these installations, we recommend considering only policy options that fully avoid perverse incentives. This holds for re-gulations by the host country and international or bilateral funding. For the option of inclusion in domestic ETSs, avoiding perverse incentives would require a careful design of the ETS rules. If crediting is pursued, it should not occur based on market prices but reflect technical abatement costs, transaction costs, and an incentive for the plant operators.
Ensuring continued GHG abatement in already implemented CDM projects should be prioritized over abatement in new projects.
Where possible, synergies with the Montreal Pro-tocol should be used.
Among the policy options, regulations and inclusi-on of the installations in ETSs seem best suited to address GHG emissions in the long term. Regulati-ons by the host country is a simple option that is re-latively easy to implement, does not create perverse incentives, provides for net reductions, addresses sector-wide emissions and has relatively low trans-action costs. The inclusion of the installations in ETSs could be a viable alternative for more advanced de-veloping countries that are establishing ETSs. The two non-Annex I countries in an advanced stage of introducing ETSs – China and South Korea – make up about 80% of the 2020 GHG abatement potential from HCFC-22, adipic acid and nitric acid produc-tion. However, a careful design of ETS rules is key to actually achieving the envisaged reductions which may pose more implementation challenges than re-gulations by the host country. Domestic policies to
Summary

4 purchase credits could possibly be a third alternative for N2O abatement from nitric acid production.
We recommend that industrialized countries sup-port the GHG abatement from industrial gas pro-jects. For more advanced developing countries we recommend that international support is contingent on the implementation of one of the long-term so-lutions: regulations by the host country, inclusion in domestic ETSs or, for nitric acid installations, dome-stic purchase of credits.
We recommend considering different policy options for the three project types, reflecting their specific characteristics:
For HFC-23 from HCFC-22 production we recom-mend regulating emissions under the Montreal Protocol and providing financial support through the Multilateral Fund (MLF) for GHG abatement in new facilities that have not yet installed GHG aba-tement technologies.
For N2O abatement from adipic acid production we recommend regulations by the host country or inclusion in ETSs to address GHG emissions in the long-term. All adipic acid plants are located in industrialized countries or more advanced de-veloping countries (Brazil, China, South Korea). International or bilateral support could be provi-ded temporarily through results-based funding approaches, based on the technical abatement costs, transaction costs, and an incentive for the plant operators.
For N2O abatement from nitric acid production we recommend for more advanced developing coun-tries regulations by the host country or inclusion in ETSs to address GHG emissions in the long-term. The CDM and JI could be an effective means for providing international or bilateral support of GHG abatement, through the purchase and pos-sibly voluntary cancellation of CERs or ERUs. Such purchases could occur through a dedicated win-dow for CDM and JI project types that are at risk of stopping GHG abatement. Alternatively, inter-national or bilateral support could be provided through results-based funding approaches.
In conclusion, abating GHG emissions from HCFC-22, adipic acid and nitric acid production offers a large potential at very low cost. We believe that both host countries and the international community have a responsibility for ensuring continued GHG abate-ment in stranded CDM and JI projects and to take actions to abate GHG emissions in newer facilities. We recommend combining a long-term solution im-plemented by the host country with international or bilateral support.

5
1 Introduction . . . . . . . . . . . . . . . . . . . . . . . . . . . . . . . . . . . . . . . . . . . . . . . . . . . . . . . . . . . . . . . . . . . . . . . . . . . . . . . . . . . . 6
2 Which project types are at risk of stopping GHG abatement? . . . . . . . . . . . . . . . . . . . . . . . . . . . . . . . . . . . . . . 7
2.1 Methodological approach . . . . . . . . . . . . . . . . . . . . . . . . . . . . . . . . . . . . . . . . . . . . . . . . . . . . . . . . . . . . . . . . . 7
2.2 Assessment results . . . . . . . . . . . . . . . . . . . . . . . . . . . . . . . . . . . . . . . . . . . . . . . . . . . . . . . . . . . . . . . . . . . . . . . . 9
3 Overview of the assessed project types . . . . . . . . . . . . . . . . . . . . . . . . . . . . . . . . . . . . . . . . . . . . . . . . . . . . . . . . . . 12
3.1 HFC-23 from HCFC-22 production . . . . . . . . . . . . . . . . . . . . . . . . . . . . . . . . . . . . . . . . . . . . . . . . . . . . . . . . 12
3.2 N2O from adipic acid production . . . . . . . . . . . . . . . . . . . . . . . . . . . . . . . . . . . . . . . . . . . . . . . . . . . . . . . . . 13
3.3 N2O from nitric acid production . . . . . . . . . . . . . . . . . . . . . . . . . . . . . . . . . . . . . . . . . . . . . . . . . . . . . . . . . . 13
4 GHG abatement potential and credit supply potential . . . . . . . . . . . . . . . . . . . . . . . . . . . . . . . . . . . . . . . . . . . . 16
4.1 HFC-23 from HCFC-22 production . . . . . . . . . . . . . . . . . . . . . . . . . . . . . . . . . . . . . . . . . . . . . . . . . . . . . . . . 18
4.2 N2O from adipic acid production . . . . . . . . . . . . . . . . . . . . . . . . . . . . . . . . . . . . . . . . . . . . . . . . . . . . . . . . . 20
4.3 N2O from nitric acid production . . . . . . . . . . . . . . . . . . . . . . . . . . . . . . . . . . . . . . . . . . . . . . . . . . . . . . . . . . 21
5 GHG abatement costs . . . . . . . . . . . . . . . . . . . . . . . . . . . . . . . . . . . . . . . . . . . . . . . . . . . . . . . . . . . . . . . . . . . . . . . . . . . 24
5.1 Technical abatement costs . . . . . . . . . . . . . . . . . . . . . . . . . . . . . . . . . . . . . . . . . . . . . . . . . . . . . . . . . . . . . . . 24
5.2 Transaction costs . . . . . . . . . . . . . . . . . . . . . . . . . . . . . . . . . . . . . . . . . . . . . . . . . . . . . . . . . . . . . . . . . . . . . . . . 25
5.3 Overall abatement costs . . . . . . . . . . . . . . . . . . . . . . . . . . . . . . . . . . . . . . . . . . . . . . . . . . . . . . . . . . . . . . . . . 26
6 Options for continuing GHG abatement . . . . . . . . . . . . . . . . . . . . . . . . . . . . . . . . . . . . . . . . . . . . . . . . . . . . . . . . . 29
6.1 Regulations by the host country . . . . . . . . . . . . . . . . . . . . . . . . . . . . . . . . . . . . . . . . . . . . . . . . . . . . . . . . . . 29
6.2 Inclusion in domestic ETSs . . . . . . . . . . . . . . . . . . . . . . . . . . . . . . . . . . . . . . . . . . . . . . . . . . . . . . . . . . . . . . . 29
6.3 Domestic use of credits . . . . . . . . . . . . . . . . . . . . . . . . . . . . . . . . . . . . . . . . . . . . . . . . . . . . . . . . . . . . . . . . . . 29
6.4 International or bilateral purchase credits . . . . . . . . . . . . . . . . . . . . . . . . . . . . . . . . . . . . . . . . . . . . . . . . . 30
6.5 International or bilateral funding of abatement . . . . . . . . . . . . . . . . . . . . . . . . . . . . . . . . . . . . . . . . . . . 30
6.6 Comparison of the policy options. . . . . . . . . . . . . . . . . . . . . . . . . . . . . . . . . . . . . . . . . . . . . . . . . . . . . . . . . 30
6.6.1 Long-term or temporary nature . . . . . . . . . . . . . . . . . . . . . . . . . . . . . . . . . . . . . . . . . . . . . . . . . . . 32
6.6.2 Capability and capacity . . . . . . . . . . . . . . . . . . . . . . . . . . . . . . . . . . . . . . . . . . . . . . . . . . . . . . . . . . . 32
6.6.3 Implications on global GHG emissions . . . . . . . . . . . . . . . . . . . . . . . . . . . . . . . . . . . . . . . . . . . . . 33
6.6.4 Avoidance of perverse incentives . . . . . . . . . . . . . . . . . . . . . . . . . . . . . . . . . . . . . . . . . . . . . . . . . . 34
6.6.5 Ability to address sector-wide emissions . . . . . . . . . . . . . . . . . . . . . . . . . . . . . . . . . . . . . . . . . . . 36
6.6.6 Incentives for abatement . . . . . . . . . . . . . . . . . . . . . . . . . . . . . . . . . . . . . . . . . . . . . . . . . . . . . . . . . 36
6.6.7 Transaction costs . . . . . . . . . . . . . . . . . . . . . . . . . . . . . . . . . . . . . . . . . . . . . . . . . . . . . . . . . . . . . . . . . 37
6.7 Combinations of options . . . . . . . . . . . . . . . . . . . . . . . . . . . . . . . . . . . . . . . . . . . . . . . . . . . . . . . . . . . . . . . . . 37
7 Conclusions and recommendations . . . . . . . . . . . . . . . . . . . . . . . . . . . . . . . . . . . . . . . . . . . . . . . . . . . . . . . . . . . . . 38
Acknowledgements . . . . . . . . . . . . . . . . . . . . . . . . . . . . . . . . . . . . . . . . . . . . . . . . . . . . . . . . . . . . . . . . . . . . . . . . . . . . . . . . . . . 40
References . . . . . . . . . . . . . . . . . . . . . . . . . . . . . . . . . . . . . . . . . . . . . . . . . . . . . . . . . . . . . . . . . . . . . . . . . . . . . . . . . . . . . . . . . . . . 41
Appendix 1: Information on technical abatement costs . . . . . . . . . . . . . . . . . . . . . . . . . . . . . . . . . . . . . . . . . . . . . . . . . . 43
HFC-23 from HCFC-22 production . . . . . . . . . . . . . . . . . . . . . . . . . . . . . . . . . . . . . . . . . . . . . . . . . . . . . . . . . . . . . . . . . . . . . . 43
N2O from adipic acid production . . . . . . . . . . . . . . . . . . . . . . . . . . . . . . . . . . . . . . . . . . . . . . . . . . . . . . . . . . . . . . . . . . . . . . . 44
N2O from nitric acid production . . . . . . . . . . . . . . . . . . . . . . . . . . . . . . . . . . . . . . . . . . . . . . . . . . . . . . . . . . . . . . . . . . . . . . . . 45
Content

6
The project-based market mechanisms under the Kyoto Protocol – the Clean Development Mecha-nism (CDM) and Joint Implementation (JI) – have successfully enabled the implementation of a very large number of emission reduction projects in de-veloping countries and economies in transition. By April 2014, more than 7000 projects were registered under the CDM and about 1.5 billion Certified Emis-sion Reductions (CERs) were issued. Under JI, about 600 projects were approved and more than 800 mil-lion Emission Reduction Units (ERUs) issued.
However, market prices for CERs and ERUs have fal-len to well below 1 EUR as the supply of CERs and ERUs outstrips demand. Even if new sources of de-mand emerge, such as from new emissions trading schemes (ETSs), an international agreement on avi-ation emissions, or the purchasing of them through new funds, it is questionable whether the demand from these sources will be sufficient to raise market prices, given the significant supply potential from CDM and JI. A substantial recovery of the prices appears unlikely without significant new demand sources, such as from ambitious mitigation com-mitments in the context of a 2015 climate regime, or the use of the CDM as a vehicle for results-based financing.
The current market situation has severe conse-quences for the development and operation of CDM and JI projects:
First of all, at current market prices project devel-opers do not have incentives for developing new projects. As a consequence, the development of new projects has largely stopped, including in Least Developed Countries (LDCs) in which new projects are still eligible under the EU ETS. In the first quarter of 2014, only 32 new CDM projects were published by designated operational entities (DOEs), of which two are located in LDCs (UNEP-RISOE 2014). Incentives for new projects mainly come from a few public purchase programmes, in-itiatives to use CERs for results-based funding, and projects implemented for the voluntary market.1
Secondly, some already registered or approved projects are not implemented. Some programmes of activities (PoAs) are implemented at a lower scale, since revenues from the first activities were required to implement further activities.
Thirdly, many already implemented projects stop-ped issuing CERs and ERUs. Current market prices enable only larger projects with simple monito-ring requirements to recover the costs for monito-ring emission reductions, third party verification, and issuance of CERs. Most projects that continue issuing CERs and ERUs have emission reduction purchase agreements (ERPAs) with higher prices than current market prices.
Finally, some already implemented projects may not only stop issuing CERs or ERUs but may also stop abating GHG emissions. This applies to pro-jects which require continued revenues from CERs and ERUs to cover the operational costs for conti-nued GHG abatement.
This study focuses on the latter consequence of the current market situation: already implemented pro-jects that are at risk of stopping the GHG abatement. A termination of GHG abatement in these projects could have considerable negative consequences for international efforts to address climate change because some of these projects typically offer GHG abatement at a very low cost and address GHGs with a long atmospheric lifetime. This study aims to iden-tify and discuss policy interventions which can ena-ble a continued GHG abatement in these projects.
The study first provides an overview of which pro-ject types in the CDM and JI portfolio face a risk of stopping GHG abatement (section 2). The study then focuses its further analysis on industrial gas projects, because they face a particularly high risk and have a very large GHG abatement potential. We analyse the three main industrial gas project types: HFC-23 aba-tement from HCFC-22 production, N2O abatement from adipic acid production, and N2O abatement from nitric acid production. In section 3, we provide an overview of these project types and their imple-mentation under CDM and JI. We identify their GHG abatement potential and potential credit supply up to 2030, based on bottom-up models using data on each installation (section 4), and estimate their GHG abatement costs (section 5). This information is used when we identify and discuss in section 6 policy in-terventions to ensure a continued GHG abatement. Finally, we provide conclusions and recommenda-tions (section 7).
1 Introduction
1 For example, Belgium, Norway, and Sweden recently launched new tenders to purchase CERs for compliance in the second com-mitmentperiodoftheKyotoProtocol.GermanyandtheUKlaunchedtenderswhereCERsarecancelledandusedforresults-basedfinancing.

7
2.1 Methodological approach
A great diversity of project types have been imple-mented under the CDM and JI. They vary in many aspects, including the level of GHG emission reduc-tions they deliver, their investment and operation costs, their revenues from product sales or cost sa-vings, and their costs for monitoring and verification of emission reductions. Due to these varying circum-stances, they are also differently affected by low car-bon market prices.
We therefore evaluate the risk of stopping GHG abatement for the different project types. An as-sessment for individual projects would be difficult in the absence of specific information from the pro-ject. The assessment covers all major project types in the current portfolio of CDM and JI projects, using the classification provided in the UNEP-RISOE CDM and JI pipelines (UNEP-RISOE 2014). Project types with less than 10 approved CDM or JI projects are not considered. The data used for the assessment is based on information collected by UNEP-RISOE, the evaluation of information from PDDs and monito-ring reports, interviews with market participants and information from the literature.
The assessment follows a common methodological approach, which is illustrated in the decision-tree in Figure 1. The approach aims to reflect the econo-mic and regulatory aspects which a project operator considers when deciding whether to continue or stop the GHG abatement. We do not consider other aspects in our analysis, such as reputational risks associated with the termination of a GHG emission reduction project or possibilities to use a project for promoting corporate social responsibility. Although such aspects can play a role, they are difficult to as-sess and may depend on the specific circumstances of the project concerned. Due to a lack of compre-hensive and reliable data, we also do not reflect in our analysis the varying prices that may be paid for different project types and that some project deve-lopers still benefit from higher prices due to con-tracts made before the price crash. Rather, we derive general conclusions for each project type based on the assumption that relatively low market prices would prevail.
To evaluate the risk for each project type, we use se-veral questions (see Figure 1): 1. We first assess whether regulations, safety aspects
or other policies typically require or strongly in-centivize the continuation of the GHG abatement. This differs by country and no general conclusi-ons can be drawn. Nevertheless, we take into ac-count the situation typically faced in developing countries and economies in transition.
2. If the project is not required or strongly incentivi-zed by regulations or policies, we then evaluate whether the continued operation of the project generates financial benefits other than from CERs or ERUs2. Many project types generate other re-turns, either from the generation of an income stream, such as electricity sales from renewable power generation, or from cost savings, such as reduced energy costs from energy efficiency projects. Some projects may also generate reve-nues from subsidies or incentive schemes, such as quota systems with tradable certificates; some generate non-financial benefits which provide incentives for continued operation, such as red-uced congestion from new metro lines. In con-trast, other project types do not generate other revenues than from CERs and ERUs, such as N2O abatement from nitric acid production. In the ab-sence of revenues from CERs and ERUs, these pro-jects do not have financial incentives to continue GHG abatement and hence face a high risk that GHG abatement is stopped.
3. If a project generates financial benefits other than from CERs and ERUs, a subsequent question is whether these benefits exceed the marginal co-sts of continued GHG abatement. The total costs for GHG abatement include capital expenditures (CAPEX) and operational expenditures (OPEX). However, once the capital expenditures have been spent, they are regarded as “sunk costs”. Hence, generally only operational expenditures are considered when assessing whether or not the continuation of the GHG abatement is econo-mically attractive.
If the financial benefits other than from CERs and
ERUs exceed the operational expenditures, the
2 Which project types are at risk of stopping GHG abatement?
2 Wedonotconsiderthatsomeprojectsmaygeneratecreditsunderothercreditingschemes.

8
GHG abatement is likely to continue for most project types (subject to question 5 and 6) since the project operator makes an operational profit from continued GHG abatement, even without revenues from CERs and ERUs. This holds also for situations of insolvency where a liquidator would ensure continued operation in order to reduce the losses. It is important to note that the conti-nued operation of these projects, even without revenues from CERs and ERUs, does not imply that they are not additional. When considering whether or not to proceed with the project ac-tivity, all costs – including capital expenditures – were considered, while here only OPEX and on-going financial benefits are considered.
4. If the financial revenues or savings other than from CERs and ERUs do not exceed the operati-onal costs for continued GHG abatement, the re-
venues from CERs and ERUs as well as the costs for monitoring, verification and issuance come into play. The continued GHG abatement will then only be economically attractive if all savings and revenues, including from CERs/ERUs, exceed operational expenditures for continued GHG aba-tement and transaction costs for monitoring, ve-rification and issuance. Otherwise, a termination of the GHG abatement is likely. With current stock market prices for CERs and ERUs, CER or ERU reve-nues will, for most project types, not even cover the transaction costs for monitoring, verification and issuance, and hence GHG abatement would likely be stopped.
For projects that benefit from higher CER or ERU prices, several aspects play a role: For some pro-ject types, the emission reductions are relatively small in relation to the operational expenditures
Figure 1:Decision-tree used for the assessment of the risk that different CDM and JI project types stop GHG abatement
Do safety aspects or regu-lations require or strongly incentivize continued GHG abatement?
Does the project generate financial benefits other than from CERs or ERUs?
Do the financial benefits other than from CERs or ERUs exceed the OPEX?
Can CAPEX be recovered if GHG abatement is stopped and, if so, does it exceed profits from continued GHG abatement?
Do all savings and revenues, including from CERs/ERUs, exceed the OPEX and transaction costs?
Can a profit be generated from stopping GHG abatement and investing in an alternative and, if so, does it exceed profits from continued GHG abatement?
GHG abatement is likely continued
High risk that GHG abatement is stopped
1
2
3
5
46
Yes
No
No
No
Yes
Yes
No
Yes
Yes
YesYes
Yes

9of the project. For other project types, the emissi-on reductions are very large in relation to the ope-rational expenditures, such as for N2O abatement from adipic acid production. For these projects, a small difference in the price for CERs or ERUs can make a decisive difference to whether GHG aba-tement is continued. Also the cost for monitoring, verification and issuance plays an important role. Some power generation projects are simple to monitor, whereas surveys or sampling to monitor emission reduction from dispersed installations can involve considerable costs. In this regard, pro-grammes of activities involving small dispersed installations may be more strongly affected.
5. For a few project types, a part of the CAPEX might be retrieved when installed equipment could be resold. For example, landfill energy or coal mine methane projects could potentially sell diesel ge-nerators used to produce electricity if the project were stopped. If the profit from selling the equip-ment exceeds the profit from continued GHG abatement, the GHG abatement might be stop-ped.
6. Finally, for a very few project types, GHG abate-ment might be stopped because investing in another alternative could generate larger profits than the continued GHG abatement. For examp-le, a fossil fuel fired power plant may initially have made an investment in a new boiler to enable the use of natural gas instead of diesel. While the plant still makes a profit, without revenues from CERs or ERUs, from producing power with natural gas, its profit might be larger if a new investment is made to enable again the use of diesel as a fuel.
2.2 Assessment results
The results of the assessment are shown in Table 1 for each project type. Most project types will likely continue GHG abatement without CER or ERU re-venues, mainly because the continued GHG abate-ment generates revenues or cost savings which ex-ceed the OPEX. Most renewable power projects have considerable financial revenues from electricity sales which exceed operation and maintenance costs for continued operation. Therefore, renewable power projects will usually continue operation also in the absence of revenues from CERs and ERUs. Energy efficiency projects usually generate cost savings from reduced energy consumption. Supply side en-ergy efficiency projects, such as waste heat recove-ry, would moreover require investments to reverse them. A number of other project types generate considerable cost savings, such as the replacement of clinker in cement production and the reduction of
PFC emissions from aluminium production. The pro-ject categories in Table 1 with low risks of stopping GHG abatement cover about 72% of the projects and 66% of the future annual emission reduction potential from all CDM and JI projects.
The project types with some risks of stopping GHG abatement mostly reduce CH4, such as methane avoidance from biomass collection, composting, manure management, waste water treatment, and the capture of CH4 from coal mines. Other project types in this category include some fossil fuel switch projects, where the continued use of the low carbon fuel (natural gas or oil) could depend on the reve-nues from CDM or JI, and projects providing energy efficient equipment to households, such as efficient lighting and cook stove projects implemented under PoAs, where the entities implementing the projects face considerable costs and have low or no revenues from the sale of energy efficient equipment.
Only a few project types face high risks of stopping GHG abatement. This includes mainly project types that address other gases than CO2 and CH4, such as HFC-23 from HCFC-22 production, N2O from adipic acid and nitric acid production, SF6 reduction, and flaring of CH4 from landfills. These projects typically have no or few revenues or cost savings other than from CERs or EURs. The number of projects affected is relatively small but the amount of emission red-uctions is relatively large. These project types consti-tute 2% of the approved CDM and JI projects but about 14% of the future annual emission reduction potential from all CDM and JI projects. This study focuses on the three project types that both face a high risk of stopping GHG abatement and represent large volumes of emission reductions: HFC-23 aba-tement from HCFC-22 production, N2O abatement from adipic acid production, and N2O abatement from nitric acid production.

10 Table 1:Assessment of the likelihood of stopping GHG abatement for different CDM and JI project types3
Project type
Afforestation
Biomass energy
Cement (replacement of clinker)
Coal bed/mine methane
Energy distribution (e.g. district heating)
Energy efficiency in households (e.g. lighting, cookstoves)
Energy efficiency in industry
Energy efficiency in own generation (e.g. waste heat recovery)
Energy efficiency in the service sector (e.g. street lightening)
Energy efficiency in the energy supply sector (e.g. super-critical coal power plants)
Fossil fuel switch
Fugitive (e.g. CH4 reductions from gas pipelines and oil fields)
Geothermal
HFCs (e.g. HFC-23 from HCFC-22 production)
Hydro
Landfill gas capture and flaring or energy generation
Methane avoidance (e.g. waste water treatment, manure management, composting)
N2O from nitric acid, adipic acid and caprolactam production
PFCs and SF6(e.g. aluminum production and transformers)
Reforestation
Solar
Transport
Wind
Total
Approved CDM and JI projects
12
671
27
112
62
85
176
313
28
85
114
175
38
25
2,040
424
640
150
21
42
355
30
2,406
8,031
Annual million CERs / ERUs
1
47
5
46
21
4
38
47
2
32
62
137
12
90
263
55
26
75
11
1
11
5
226
1,216
Risk for stopping abatement
Low
Low /CH4 projects:
Middle
Low
Middle / High
Low
Middle
Low
Low
Low
Low
Middle
Low
Low
High
Low
Energy: Low / Flaring: High
Low / Middle
High
PFC: LowSF6: High
Low
Low
Low
Low

11
Explanations
- Significant revenues from product sales or cost savings - Low OPEX for continued abatement
- Significant revenues from product sales or fossil fuel savings - Cost of biomass collection high for some projects- High monitoring costs for some projects
- Significant cost savings from reducing the share of clinker in cement- Low OPEX for continued abatement - Low or no revenues from electricity sales- Significant OPEX for continued abatement
- Significant revenues from product sales or cost savings- Low OPEX for continued abatement
- Significant cost savings- Low or no OPEX for continued abatement
- Significant revenues from product sales or cost savings- Low OPEX for continued abatement
- Significant revenues from product sales or cost savings- Low OPEX for continued abatement
- Significant revenues from product sales or cost savings- Low OPEX for continued abatement
- Significant revenues from product sales or cost savings- Low OPEX for continued abatement
- Strongly depends on the situation of the project: Some projects can technically not switch back, others can. Using a low carbon fossil fuel could provide cost savings or incur additional costs
- For most projects (e.g. use of associated gas) cost savings- No or low OPEX for continued abatement
- Significant revenues from product sales- Low OPEX for continued abatement
- No other revenues than CERs or ERUs- Costs for continued abatement
- Significant revenues from product sales- Low OPEX for continued abatement
- Low OPEX for continued abatement- Energy generation: Significant revenues from product sales- Flaring: No other revenues than CERs or ERUs
- Depending on the project type:- No revenues (e.g. aerobic manure management) or some revenues (e.g. biogas utilization)
- No revenues or low revenues from energy recovery from N2O decomposition- Low OPEX for continued abatement
- Low OPEX for continued abatement- PFCs from aluminium production: Significant cost savings from reduced anode effects- SF6: No or low renvenues or cost savings
- Significant revenues from product sales- Low OPEX for continued operation
- Significant revenues from product sales- Low OPEX for continued abatement
- Significant co-benefits and cost savings, established infrastructure is continued to be used
- Significant revenues from product sales- Low OPEX for continued abatement
3 SeeUNEP-RISOE(2014)forfurtherspecificationoftheprojecttypes.

12
3.1 HFC-23 from HCFC-22 production
Hydrofluorocarbon-23 (HFC-23) is a waste gas from the production of hydrochlorofluorocarbon-22 (HCFC-22), which is a GHG and an ozone-depleting substance (ODS) regulated under the Montreal Pro-tocol on Substances that Deplete the Ozone Layer. HCFCs were mainly introduced as an alternative to the highly ozone-depleting chlorofluorocarbons (CFCs) because of their lower ozone-depleting po-tential.
HFC-23 has a global warming potential (GWP) of 14,800 for the second commitment period of the Ky-oto Protocol. HFC-23 can be abated by reducing the by-product rate through process optimization and by installation of equipment to capture and destruct the HFC-23. The ratio between HFC-23 generation and HCFC-22 production, often referred to as “waste generation rate”, is typically in the range of between 1.5% and 4%, depending on how the process is ope-rated and the degree of process optimization that has been performed (McCulloch and Lindley 2007, IPCC 2006). However, higher and lower values were reported in a number of cases: one registered CDM project reported an annual value of 5.44% in 20034, in another registered CDM plant a value as low as 0.88% could be observed for a period of one month and a value of 1.06% for a period of six months5. A JI project in Russia achieved an average annual rate of 1.06% in 2004.6 These lower values were achieved through process optimization which also increases the HCFC-22 yield. However, process optimization reduces but does not eliminate HFC-23 emissions. To reduce the waste generation rate below the 1% level, thermal oxidation in a separate incinerator is required (Irving and Branscombe, 2002; TEAP/IPCC, 2005: 410). The most recent CDM methodology, version 6.0.0 of the AM0001 methodology, uses this threshold of 1%, as a conservative approach, for the baseline waste generation rate.
In developing countries, HFC-23 has largely been vented to the atmosphere prior to the CDM. General-ly, newer plants that are not eligible under the CDM
also vent HFC-23 to the atmosphere. Small amounts of HFC-23 from newer plants are reported to be sold (EIA 2013). The CDM projects have a very high perfor-mance and nearly fully eliminate HFC-23 emissions, with a remaining waste generation of usually less than 0.01%. In industrialized countries, most plants have installed HFC-23 incinerators over the past two decades. However, the average emission rate from all plants in Annex I countries still amounts to about 0.4% in 2011 – and is thus considerably higher than that of CDM plants.7 Major emitters with partially un-abated production are Russia and the United States.
Under the CDM, 19 projects were implemented. Ele-ven of the 19 projects are located in China, five are in India; South Korea, Argentina and Mexico each host one project. Under JI, two projects were implemen-ted in Russia. Another JI project is implemented in France; however, this project does not abate HFC-23 from HCFC-22 but from trifluoroacetic acid produc-tion. It is therefore not considered in our analysis.
It is not known whether any HFC-23 CDM projects stopped GHG abatement. Some plants continue to upload monitoring reports to the UNFCCC and request issuance of CERs. In these plants GHG aba-tement is continued so far. For most plants, the last issuance of CERs dates back to about one year when CERs could still be used for compliance in the EU ETS. For two plants, the last issuance dates back to more than two years. In June 2013, the Environmental Investigation Agency (EIA) reported that plant ope-rators in China and India were considering venting HFC-23, absent government regulation or additio-nal financial incentives to incinerate the by-product (EIA 2013). In November 2013, the EIA reports that government officials or plant operators declared that none of the HCFC-22 plants in India is venting HFC-23; that Chinese authorities were still conside-ring how to address the issue; that the South Korean government seems to take steps to ensure that there were no venting of HFC-23 from the plant in South Korea; and that the Mexican government has no intention of controlling HFC-23 emissions from the Mexican plant (Roberts 2013). According to industry experts, the CDM plants in China currently continue abatement.
3 Overview of the assessed project types
4 CDM-Project193,ProjectDesignDocument(PDD),page8,lastretrievedon27January2014fromhttp://cdm.unfccc.int5 Annex13tothemeetingreportofthe49thmeetingoftheMethodologiesPanel,page5,lastretrievedon2September2013from https://cdm.unfccc.int/Panels/meth/meeting/11/049/mp49_an13.pdf6 JIprojectRU1000201:“Co-destructionofHFC23andSF6atKCKKPolimerplant”,ProjectDesignDocument(PDD),page18,lastretrie-
vedon27August2013fromhttp://ji.unfccc.int/JI_Projects/ProjectInfo.html7 CalculatedbasedonreporteddatabycountriestotheUNEPOzoneSecretariatandtoUNFCCC.

133.2 N2O from adipic acid production
Adipic acid is an organic chemical that is used to produce a range of different pro4 ducts, most impor-tantly polyamide, often referred to as “nylon.” Adipic acid is a globally traded commodity with China, the EU, and the US being the largest producers. Adipic acid plants are all located in industrialized countries or in emerging economies.
Nitrous oxide (N2O) is an unwanted by-product of adipic acid production. The formation of N2O can-not be avoided; it is the result of using nitric acid to oxidize cyclohexanone and/or cyclohexanol. The amount of N2O generated is largely proportional to the amount of adipic acid produced (USEPA 2006). Generally, the amount of N2O generated varies very little over time and among plants (Schneider et al. 2010). The 2006 IPCC Guidelines for National GHG Inventories provide a default value for N2O formati-on of 300 kg N2O / t adipic acid, with an uncertainty range of +/-10% (IPCC 2006, page 3.30). The CDM methodology for adipic acid plants uses the lower end of this range, i.e. 270 kg N2O / t adipic acid, as the maximum baseline emission rate.+
N2O in the waste gas stream can be abated in diffe-rent ways: by catalytic destruction, by thermal de-composition, by using the N2O for nitric acid produc-tion, or by recycling the N2O as feedstock for adipic acid production. These methods typically reach an abatement level of about 90% (IPCC 2006) and in Western industrialized countries, N2O has been aba-ted voluntarily since the 1990s at this rate. However, plants implemented under CDM and JI achieved si-gnificantly higher abatement levels of about 99% in the case of CDM and 92% to 99% in the case of JI, apparently through the strong economic incentives from the CDM and JI (Schneider et al. 2010).
Under the CDM, four projects were registered. Two projects are located in China, one is in Brazil and one in South Korea. All four CDM plants had no abate-ment installed before project implementation and applied either thermal or catalytic abatement. The four implemented CDM plants cover only a part of the adipic acid production in developing coun-tries because the applicable CDM methodology (AM0021) is limited to plants that started commercial operation before 2005. Since then, five new plants are known to have started commercial operation in China; none of them abates N2O emissions. Two of the four CDM plants apparently continue GHG aba-tement and issuance of CERs (the plants operated by Solvay in France and Brazil). According to indus-try experts, the two other plants in China may have stopped GHG abatement and started venting the
N2O to the atmosphere. Under JI, three projects were implemented; two in Germany and one in France. These plants already abated N2O emissions but the extent of abatement was increased under JI (Schnei-der et al. 2010). All three JI projects are included in the EU ETS from 2013 and continue to abate N2O.
3.3 N2O from nitric acid production
Nitric acid is an important chemical which is mainly used for the production of synthetic fertilizers and explosives. Globally, an estimated 500-600 nitric acid plants are thought to be in operation (Kollmuss and Lazarus 2010). In the industrial production of nitric acid, ammonia (NH3) is oxidized over precious me-tal gauzes (primary catalyst) to produce nitrogen monoxide (NO) which then reacts with oxygen and water to form nitric acid.
N2O is an unwanted by-product generated at the primary catalyst. The better a primary catalyst func-tions, the lower the N2O emissions. Nitric acid is produced during production campaigns of typically 3-12 months. As the primary catalyst ages, it beco-mes less efficient and, therefore, N2O emissions tend to increase toward the end of a campaign (Kollmuss and Lazarus 2010). N2O emissions from nitric acid production can be abated in three ways:
Primary abatement prevents the formation of N2O at the primary catalyst. According to gauze suppliers, improved gauzes could potentially lead to a 30-40% reduction of N2O formation (Ecofys 2009).
Secondary abatement removes N2O through the installation of a secondary N2O destruction cata-lyst in the oxidation reactor. The abatement effici-ency of the secondary catalyst is often estimated to range from 80% to 90%. However, in practice it varies in CDM plants from about 50% to over 90% and depends on the design and operating condi-tions of the nitric acid plant and how the secon-dary catalyst is installed. Registered CDM projects achieved an average abatement efficiency of 70% (Kollmuss and Lazarus 2010, Debor et al. 2010).
Tertiary abatement removes N2O from the tail gas through either thermal or catalytic decompositi-on. Tertiary abatement can reduce N2O emissions by more than 90% but involves larger investment and operating costs and more demanding techni-cal requirements than secondary abatement. Re-gistered CDM projects achieved an average aba-tement efficiency of 86% (Kollmuss and Lazarus 2010, Debor et al. 2010).

14 The formation of N2O from nitric acid production is highly variable. Emission rates depend on the ope-rating conditions, such as operating pressure, cata-lyst type and age, concentration of nitric acid, and abatement processes (Perez-Ramirez et al. 2003, Ecofys 2009, Kollmuss and Lazarus 2010). Prior to the implementation of CDM and JI projects, information on N2O emissions from nitric acid production was primarily based on sample measurements, estimates and assumptions. Third party audited data from continuous monitoring has only become available through project design documents (PDDs) and mo-nitoring reports published under CDM and JI (Debor et al. 2010). Table 2 compares IPCC default values for the N2O formation rate with actual data from CDM plants. In the case of secondary abatement, the data is derived from a baseline campaign conducted prior to the start of the CDM project. In the case of tertiary abatement, the N2O formation is continuously mo-
nitored and included in monitoring reports. The ta-ble shows that the actual N2O formation differs from the assumptions made in the 2006 IPCC Guidelines, in particular with regard to low pressure plants. In addition, the variation between plants is larger than the uncertainty range indicated by the IPCC. Accor-ding to information provided by the Methodologies Panel under the CDM Executive Board in 2012, the N2O formation rate varied considerably among CDM plants, ranging from 3.5 to 37.0 kg N2O per tonne of nitric acid, with an average value of 8.6 for all plants (UNFCCC 2012). For JI plants, less informati-on is available. Monitoring reports are not available for all plants. Moreover, the majority of track-one JI projects in Western European countries must apply a benchmark emission factor of between 1.85 and 2.5 kg N2O per t nitric acid, which is below the common rate of N2O formation (Debor et al. 2010).
In developing countries, N2O from nitric acid pro-duction was not abated through secondary or ter-tiary abatement prior to the CDM. In industrialized countries, the rate of abatement varies. Most plants in Europe started abating N2O emissions, as volunta-ry action or as part of JI projects, and, later on, due to the inclusion of N2O emissions from nitric acid into the EU ETS. In other industrialized countries, the rate of abatement is generally lower. For example, in the United States still many plants do not abate N2O emissions.
Under the CDM, 97 projects were registered and another four projects were submitted for validation
as of January 2014. China hosts 44 projects; eight projects are located in India, six in Uzbekistan, five in South Africa; Brazil, Egypt, Israel and South Korea host each four projects. Fewer projects are imple-mented in a number of other countries. Under JI, 52 projects entered the determination stage. France hosts 11 of these projects, followed by Russia with seven, Germany with six, and Poland and Romania with four projects. Among the 52 projects, only 10 projects are located in non-EU countries: seven in Russia and three in Ukraine. Only two projects in the Ukraine were registered and none of the 10 projects ever issued ERUs.
8 Deboretal.(2010).9 UNFCCC(2012).
Table 2: N2O formation from nitric acid production
2006 IPCC Guidelines (IPCC 2006) 5 (+/- 10%) 7 (+/- 20%) 9 (+/- 40%)
CDM projects with secondary abatement (2010)8 8.52 7.86 9.79
CDM projects with tertiary abatement (2010)8 8.24 8.05 10.56
All CDM projects (2012)9 8.85 (ranging from 3.5 to 37.0)
JI projects (2010)8 7.33
Rate of N2O formation (kg N2O / t nitric acid)Source Low pressure Medium pressure High pressure

15Among the 97 registered CDM projects, only 51 have issued CERs; and among the 52 JI projects, only 32 have issued ERUs as of January 2014. In the current market situation it is likely that most of the remai-ning 47 CDM and 20 JI projects have not been im-plemented. Interviewed project developers confirm that most of the more recently registered projects are not being implemented. Among the projects that have issued CERs, for 19 projects the last issu-ance date backs to more than one calendar year. On the other hand, a number of CDM projects have recently renewed their crediting periods and conti-nue issuing CERs and uploading monitoring reports. According to information from project developers, most of these projects continue operation due to ERPA contracts with higher CER prices than current market prices.

16
The GHG abatement potential and the credit supply potential for the three project types are estimated for the period from 2013 to 2030, based on bottom-up models developed for all three project types (see Table 3). The models estimate the GHG abatement potential and the credit supply potential for each CDM and JI project in the pipeline, taking into ac-count the specific features of each plant, including expected future production levels, any limits on the amount of production that is eligible for crediting, baseline and project emission factors, the actual per-formance of the projects, the length of the crediting periods, and any implications of newer methodolo-gy versions being applied at the renewal of the cre-diting periods. In estimating the potential from new projects and installations that are not eligible for crediting, the models build on available projections or develop own projections on future production le-vels, reflecting industry trends in the sectors and the actual performance of implemented projects.
The GHG abatement potential is separately deter-mined for the following groups of installations:
Implemented CDM or JI projects: This refers to all projects in the CDM and JI pipeline that have been registered and that have issued CERs or ERUs. As the state of implementation is not available from CDM and JI projects that have not yet issued CERs or ERUs, we assume that projects which have ne-ver issued CERs or ERUs have not yet been imple-mented. The GHG abatement potential from these projects is calculated up to 2030, independent of the duration of the crediting periods.
New CDM and JI projects: This refers to projects that are eligible for crediting under the CDM and JI but that have not yet been implemented, inclu-ding projects that have been registered but never issued CERs or ERUs, projects for which a project design document (PDD) was published by a DOE or accredited independent entities (AIEs), as well as projects that could be developed in the future, e.g. in new production lines or plants installed in response to growing demand in the sector.
Non-eligible installations: This refers to plants which are not eligible for crediting under the CDM: adipic acid plants commissioned after 2005 and HCFC-22 plants commissioned after 2002.
The credit supply potential is differentiated between implemented and new CDM and JI projects. Both the GHG abatement potential and the credit supply potential express the emission reductions that could technically be achieved, taking into account the typical performance of the plants and abatement technologies. We do not consider economic fac-tors which may influence credit supply, such as the GHG abatement costs, demand, and market prices for CERs and ERUs, country risks for investments, or changes in policies or regulations in the host coun-tries. For the CDM and JI potential beyond 2020, we assume that the CDM and JI would continue, as the implications of a post-2020 climate agreement are not clear at this point in time. For JI projects, we do not consider nitric and adipic installations which have become ineligible under JI due to their inclu-sion in the EU ETS. However, we estimate the GHG abatement potential and credit supply potential for countries which have not signed up to a second commitment period under the Kyoto Protocol, illus-trating opportunities that would arise from continu-ed participation in the Kyoto mechanisms. We use the GWP values from the 4th Assessment Report which are valid for the second commitment period under the Kyoto Protocol. Finally, we take develop-ments in other international treaties into account, such as the accelerated phase-out of HCFCs under the 2007 amendment of the Montreal Protocol. The approach and assumptions for the three projects ty-pes are further described in sections 4.1 to 4.3 below.Table 3 shows that the GHG abatement potential from industrial gas projects is significant, amoun-ting to about 7.5 Gt CO2e over the entire period from 2013 to 2030. In 2020, the GHG abatement potential amounts to about 0.4 Gt CO2e, exceeding the GHG emissions of Spain. Industrial gas projects could con-tribute about 3-5% of the additional global mitigati-on effort of 8-12 Gt CO2e, deemed necessary to be on track towards meeting the 2 degree target (UNEP 2013a). Among the three project types, HFC-23 aba-tement makes up about half of the total GHG abate-ment potential, followed by adipic acid projects with about a third, and nitric acid with the remainder of about a sixth.
For all three project types the potential credit supply is lower than GHG abatement potential from CDM and JI projects. There are three reasons for this. First, under the CDM crediting is limited to the duration of the crediting periods – either 10 or 21 years. In la-ter years of the considered time period more plants
4 GHG abatement potential and credit supply potential

17have reached the end of their crediting periods. Se-condly, for all three project types, more recently ap-proved CDM methodologies make conservative as-sumptions in determining baseline emissions, with a view to avoiding perverse incentives. This leads to a net mitigation benefit, as more emissions are redu-
ced than credits are issued. And thirdly, in the case of HFC-23 and adipic acid, more recently constructed plants are not eligible for crediting under the CDM. The total credit supply potential amounts to about 1.6 Gt CO2e over the entire period of 2013 to 2030 and about 0.086 Gt CO2e in 2020.
Table 3: GHG abatement potential and credit supply potential (Mt CO2e)
2013 2014 2015 2016 2017 2018 2019 2020 2025 2030 2013-30
ALL INDUSTRIAL GAS PROJECTS
Abatement potential 384 387 391 390 397 403 409 415 433 461 7,539Implemented CDM projects 161 160 158 156 154 153 152 151 145 140 2,694New CDM projects 22 24 25 27 28 30 31 33 40 47 630New JI projects 17 17 18 18 18 19 19 20 21 23 361Non-eligible installations 184 186 190 189 196 202 207 211 226 251 3,853
Credit supply potential 174 129 117 109 93 89 87 86 89 33 1,623Implemented CDM projects 158 111 100 92 76 72 71 70 68 3 1,265New CDM projects 10 11 11 11 11 11 11 11 14 20 236New JI projects 6 6 6 6 6 6 5 5 7 10 122 HFC-23 FROM HCFC-22 PRODUCTION
Abatement potential 238 233 229 225 221 217 214 211 191 182 3,707Implemented CDM projects 106 106 105 104 103 103 102 101 97 93 1,798Non-eligible installations 132 128 124 121 117 115 112 110 94 89 1,910
Credit supply potential 105 61 51 46 30 28 27 27 27 1 573Implemented CDM projects 105 61 51 46 30 28 27 27 27 1 573 N2O FROM ADIPIC ACID PRODUCTION
Abatement potential 88 94 102 104 114 123 130 137 167 197 2,583Implemented CDM projects 36 36 36 36 36 36 36 36 36 36 639Non-eligible installations 52 58 66 69 79 87 95 102 131 162 1,943
Credit supply potential 35 33 32 31 31 31 31 31 31 0 491Implemented CDM projects 35 33 32 31 31 31 31 31 31 0 491 N2O FROM NITRIC ACID PRODUCTION
Abatement potential 58 60 60 61 62 64 65 67 75 81 1,249Implemented CDM projects 19 19 18 16 16 15 15 15 13 11 257New CDM projects 22 24 25 27 28 30 31 33 40 47 630New JI projects 17 17 18 18 18 19 19 20 21 23 361
Credit supply potential 35 35 34 32 31 30 29 27 30 32 558Implemented CDM projects 18 18 17 15 14 13 12 12 9 2 200New CDM projects 10 11 11 11 11 11 11 11 14 20 236New JI projects 6 6 6 6 6 6 5 5 7 10 122
18 4.1 HFC-23 from HCFC-22 production
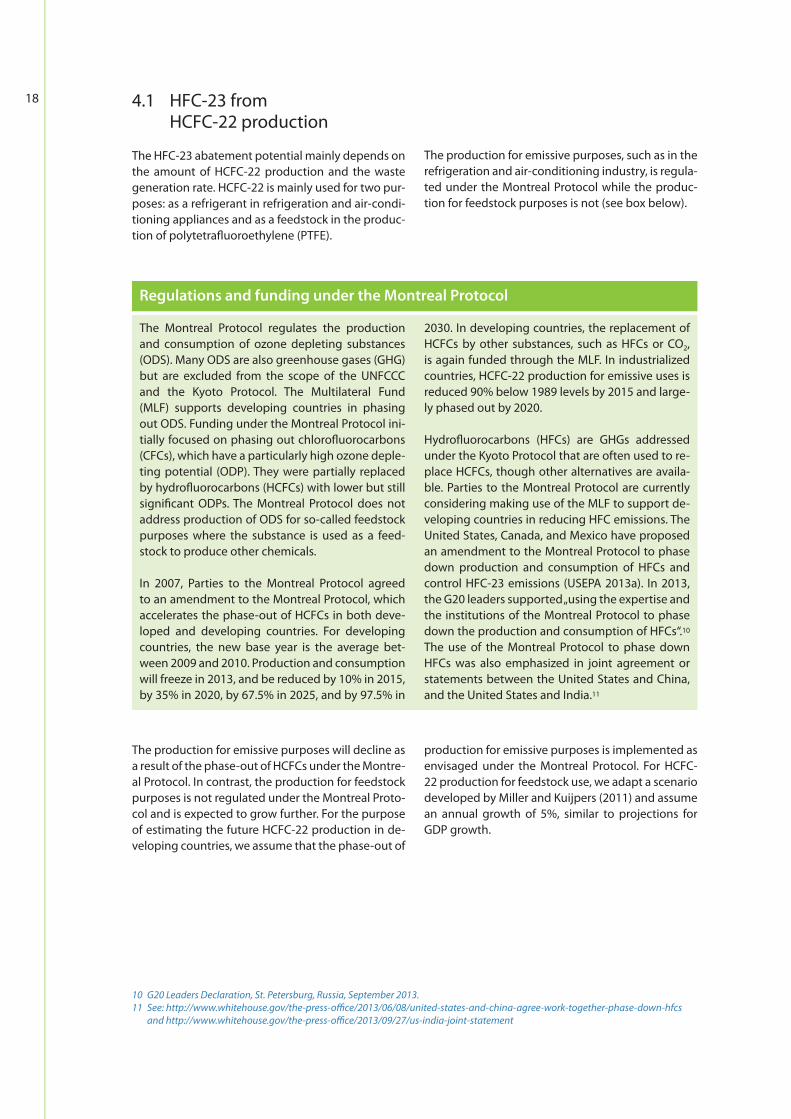
The HFC-23 abatement potential mainly depends on the amount of HCFC-22 production and the waste generation rate. HCFC-22 is mainly used for two pur-poses: as a refrigerant in refrigeration and air-condi-tioning appliances and as a feedstock in the produc-tion of polytetrafluoroethylene (PTFE).
The production for emissive purposes, such as in the refrigeration and air-conditioning industry, is regula-ted under the Montreal Protocol while the produc-tion for feedstock purposes is not (see box below).
The Montreal Protocol regulates the production and consumption of ozone depleting substances (ODS). Many ODS are also greenhouse gases (GHG) but are excluded from the scope of the UNFCCC and the Kyoto Protocol. The Multilateral Fund (MLF) supports developing countries in phasing out ODS. Funding under the Montreal Protocol ini-tially focused on phasing out chlorofluorocarbons (CFCs), which have a particularly high ozone deple-ting potential (ODP). They were partially replaced by hydrofluorocarbons (HCFCs) with lower but still significant ODPs. The Montreal Protocol does not address production of ODS for so-called feedstock purposes where the substance is used as a feed-stock to produce other chemicals.
In 2007, Parties to the Montreal Protocol agreed to an amendment to the Montreal Protocol, which accelerates the phase-out of HCFCs in both deve-loped and developing countries. For developing countries, the new base year is the average bet-ween 2009 and 2010. Production and consumption will freeze in 2013, and be reduced by 10% in 2015, by 35% in 2020, by 67.5% in 2025, and by 97.5% in
2030. In developing countries, the replacement of HCFCs by other substances, such as HFCs or CO2, is again funded through the MLF. In industrialized countries, HCFC-22 production for emissive uses is reduced 90% below 1989 levels by 2015 and large-ly phased out by 2020.
Hydrofluorocarbons (HFCs) are GHGs addressed under the Kyoto Protocol that are often used to re-place HCFCs, though other alternatives are availa-ble. Parties to the Montreal Protocol are currently considering making use of the MLF to support de-veloping countries in reducing HFC emissions. The United States, Canada, and Mexico have proposed an amendment to the Montreal Protocol to phase down production and consumption of HFCs and control HFC-23 emissions (USEPA 2013a). In 2013, the G20 leaders supported „using the expertise and the institutions of the Montreal Protocol to phase down the production and consumption of HFCs“.10 The use of the Montreal Protocol to phase down HFCs was also emphasized in joint agreement or statements between the United States and China, and the United States and India.11
The production for emissive purposes will decline as a result of the phase-out of HCFCs under the Montre-al Protocol. In contrast, the production for feedstock purposes is not regulated under the Montreal Proto-col and is expected to grow further. For the purpose of estimating the future HCFC-22 production in de-veloping countries, we assume that the phase-out of
production for emissive purposes is implemented as envisaged under the Montreal Protocol. For HCFC-22 production for feedstock use, we adapt a scenario developed by Miller and Kuijpers (2011) and assume an annual growth of 5%, similar to projections for GDP growth.
10 G20LeadersDeclaration,St.Petersburg,Russia,September2013.11 See:http://www.whitehouse.gov/the-press-office/2013/06/08/united-states-and-china-agree-work-together-phase-down-hfcs andhttp://www.whitehouse.gov/the-press-office/2013/09/27/us-india-joint-statement
Regulations and funding under the Montreal Protocol

19
Figure 2 shows the historical and projected produc-tion of HCFC-22 in developing countries. Over the period 2000 to 2012, HCFC-22 production grew by 612%, with a strong growth for emissive use in the first half of the decade and for feedstock use in the second half of the decade. The strong growth for emissive uses partially occurred due to the replace-ment of CFC-11 and CFC-12 by HCFC-22 which was financially supported under the Multilateral Fund (MLF) established under the Montreal Protocol. Due to the accelerated phase-out agreed under the Mon-treal Protocol in 2007, production for emissive uses will decline steadily up to 2030. The decline in use for emissive purposes is offset by the growth of pro-duction for feedstock purposes, with the total pro-duction remaining relatively stable from today until 2030.
For plants in developing countries, the potential for credit supply is significantly lower than the HFC-23 abatement potential, for several reasons:
First of all, the CDM methodology is limited to exi-sting production lines, which were defined by the Parties to the Kyoto Protocol as facilities that star-
ted operation before 1 January 2002. The crediting of newer production lines is not eligible under the CDM. Recently, Parties agreed at CMP9 in Warsaw not to further consider the possibility of crediting HFC-23 abatement from plants commissioned af-ter 2002. Newer production lines were only built in China. According to industry experts none of these plants abate HFC-23. One plant in Venezuela never applied for the CDM and one plant in Mexi-co has withdrawn its request for registration.
Secondly, five plants have selected a single 10-year crediting period which can not be renewed. The crediting period for the other fourteen plants is limited to 21 years.
Thirdly, the relevant CDM methodology (AM0001) has been revised in 2011 to address concerns over perverse incentives to produce more HCFC-22 or to operate plants at a higher waste generation rate than in the absence of the CDM.12 The revised version of the methodology applies a conservative waste generation rate of 1.0% and determines the maximum amount of HCFC-22 that is eligible for crediting in a more conservative way, using the
12 SeeSchneider(2011)foradiscussionoftheperverseincentivesfromcreditingHFC-23.
Production for feedstock use
Production for emissive use
Figure 2: Historical and projected HCFC-22 production in developing countries
2000
2001
2002
2003
2004
2005
2006
2007
2008
2009
2010
2011
2012
2013
2014
2015
2016
2017
2018
2019
2020
2021
2022
2023
2024
2025
2026
2027
2028
2029
2030
1000
900
800
700
600
500
400
300
200
100
0
kt H
CFC-
22

20 average instead of maximum historical production from a historical reference period up to 2005. The-se changes to the methodology do not only elimi-nate some perverse incentives but also lower the potential credit supply considerably, leading to a net mitigation benefit (Lazarus et al. 2013). Howe-ver, the revised version of the methodology must only be applied at the renewal of a 7-year credi-ting period. Most of the CDM plants with a renew-able crediting period would need to renew their crediting period in 2013 or 2014. One plant which renewed its crediting period agreed voluntarily to apply a cap of 1.0% on the waste generation rate for its second crediting period, even though the second crediting period started before the revised version of the methodology was adopted.
Another important consideration is how the phase-out of production for emissive uses will affect the operation of CDM plants. Generally, the decline in production for emissive uses is offset by the increase in production for feedstock purposes. However, not all CDM plants may be technically able to produce HCFC-22 at the purity levels required for feedstock production. In addition, the funding agreement under the Multilateral Fund with China establishes that “production lines producing only HCFCs for controlled uses will be closed and dismantled” and that “any compensated plant does not redirect any phased out HCFC production capacity toward feed-stock” (UNEP 2013b). However, it is unclear which plants – CDM plants or non-CDM plants – may be first affected under the phase-out. Currently no in-formation is available which CDM plants solely pro-duce for emissive purposes and which plants will be first affected by a phase-out. We therefore do not consider the potential closure of CDM plants due to the phase-out, noting that the actual crediting po-tential may be somewhat lower.
The waste generation rate is estimated based on data from CDM plants. For the 19 registered CDM projects we use historical waste generation rates as the basis and assume that these would slowly de-cline over time in the absence of the CDM, at rates that were observed between the historical reference period of 2000 to 2005 and the start of the CDM pro-jects. For more recently constructed plants that can-not be registered under the CDM we assume a lower waste generation rate, as newer plants are common-ly assumed to have lower waste generation rates. We assume an average waste generation rate of 2.6% for CDM plants and 2.2% for non-CDM plants in 2013, which slightly decreases over time, reaching 2.4% and 1.9% for CDM and non-CDM plants in 2020 and plants and 2.3% and 1.5% for CDM and non-CDM plants in 2030.
The two JI plants in Russia both produce HCFC-22 also for feedstock use and their production may the-refore continue. According to the historical data and projections in the PDDs, the production amounted to about 30 kilotons in 2005 and was expected to in-crease to about 44 kilotons in 2012. In the absence of more accurate information we assume a further growth to a level of 50 kilotons in 2020 and 55 kilo-tons in 2030. The average historical waste generati-on rate documented in the PDDs for the period 2002 to 2006 is relatively low, at 1.34%. The original PDDs report that the HFC-23 was partially sold or already incinerated prior to the implementation of the JI project. The actual abatement potential can therefo-re be regarded as relatively low. However, the PDDs were changed subsequently and the historical aba-tement does not seem to be considered in the base-line any longer. This questions whether the applied baseline emission rate reflects a likely baseline sce-nario. Given the high uncertainty with regard to the actual baseline we do not calculate an abatement potential for the plants in Russia. If no HFC-23 were incinerated, the abatement potential would amount to about 10 Mt CO2e annually.
Table 3 on page 17 shows that the annual HFC-23 abatement potential in developing countries is very significant, amounting to about 180 to 240 Mt CO2e annually. Over the period of 2013 to 2030, the abate-ment potential is about 3.7 Gt CO2e. The potential for CER issuance under the CDM declines over time due to the ending of the crediting periods. The first CDM project with a single 10-year crediting period would end in 2014; the crediting period of the last CDM project would end in 2030. In 2013, the potential for CER issuance is similar to the abatement potential, but declines considerably in 2013 and 2014, when many projects are due for renewal of their crediting period and have to calculate emission reductions in a more conservative manner. Overall, we estimate that the revised HFC-23 methodology credits about 30-40% of the actual HFC-23 abatement on average, thereby providing a significant net benefit for the atmosphere. The total net benefit over the period of 2013 to 2030 could amount to about 700-800 Mt CO2e. Hence, the application of the revised metho-dology could lead to significant net mitigation bene-fits for the atmosphere, while the previous version of the methodology could result in over-crediting due to perverse incentives.
4.2 N2O from adipic acid production
To date, all three JI plants have been included in the EU ETS. We therefore consider only plants from developing countries in estimating the N2O abate-

21ment potential. The applicable CDM methodology (AM0021) is limited to plants that started commer-cial operation before 2005 and limits the amount of adipic acid production that is eligible for crediting. Version 3 of the methodology uses a more conserva-tive method than earlier versions to determine the amount of adipic acid eligible for crediting. All four CDM plants were registered with version 1 or 2 of the methodology; they need to use version 3 at the renewal of their crediting period. The two plants in South Korea and Brazil renewed their crediting pe-riod in 2013; the two plants in China are due for re-newal in 2015 and 2016. The credit supply potential from CDM plants therefore changes over time.
Schneider et al. (2010) highlighted that the incen-tives from the CDM appear to have caused carbon leakage during the economic downturn in 2008 and 2009. During that period, the average plant utili-zation of CDM plants was significantly higher than the plant utilization of other plants, both globally and regionally. The CER revenues made CDM plants significantly more competitive than other plants. According to the study, adipic acid production par-tially shifted from plants which installed abatement technology in the 1990s to CDM plants. It is therefo-re likely that production was shifted from non-CDM plants to CDM plants. This implies that not all of the emission reductions credited under the CDM may present real, additional and measurable emission re-ductions. However, we do not consider such carbon leakage in determining the N2O abatement potenti-al for two reasons: firstly, the magnitude is difficult to estimate for the future and, secondly, we assume that policies to continue GHG abatement will be de-signed in a way that avoids such perverse incentives. The potential for N2O abatement and CER issuance from adipic acid production strongly correlates to the amount of adipic acid produced. We estimate the N2O abatement potential using the following assumptions:
Adipic acid production from non-Annex I coun-tries is estimated to grow from current levels of about 1.1 million tons to about 1.7 million tons in 2020 and 2.5 tons in 2030, assuming a growth rate of 5% per year (PCI Nylon 2013).
The amount of adipic acid production in the four registered CDM plants is based on information from PDDs and monitoring reports. The amount that is eligible for crediting is also based on infor-mation in PDDs and monitoring reports but sepa-rately estimated for each crediting period. For the second and third crediting periods, information in PDDs submitted for the renewal of the crediting period is used where available – for the plants in Brazil and South Korea – or otherwise – for the two
plants in China – the amount of adipic acid that is eligible for crediting is estimated to be 10% lower than for the first crediting period, reflecting the more conservative determination of the amount of adipic acid eligible for crediting in version 3 of the methodology.
The N2O formation from adipic acid production is conservatively estimated with of 0.27 t N2O for-mation per ton of adipic acid, consistent with the methodology AM0021.
The abatement level is assumed to be 99%, based on data from monitoring reports of the CDM pro-jects.
The N2O abatement potential from all adipic acid plants in developing countries is about 88 Mt CO2e in 2013 and increases to nearly 200 Mt CO2e in 2030 (see Table 3 on page 23). Over the period of 2013 to 2030, the abatement potential is about 2.6 Gt CO2e. In 2013, about 41% of the abatement potential is in CDM plants; by 2020, this share drops to about 26% due to the expected growth in adipic acid produc-tion. The credit supply potential is slightly lower than the abatement potential from CDM plants, due to the conservative determination of the amount of adipic acid that is eligible for crediting.
4.3 N2O from nitric acid production
As for the other project types, we estimate the GHG abatement potential and credit supply potential for N2O from nitric acid production based on a bottom-up model, drawing upon data from published CDM and JI projects and reflecting industry trends. Diffe-rent from HFC-23 and adipic acid projects, all nitric acid plants – including newly constructed plants – are eligible for crediting under the CDM. Under JI, 42 of the 52 projects have been included in the EU ETS since 2013. We therefore only estimate the N2O aba-tement potential and credit supply potential from production in Russia and Ukraine.
The N2O abatement potential from nitric acid pro-duction depends on three factors: the amount of nitric acid production, the N2O formation at the pri-mary catalyst and the efficiency of the abatement technology. To estimate the credit supply potential, the baseline emission factors for different plants and plant types also need to be reflected.
Nitric acid production from implemented and plan-ned CDM and JI plants is estimated based on infor-mation from PDDs. The 101 published CDM projects include 123 production lines with a total installed ca-
22 pacity of 56,766 t nitric acid per day and an expected annual production of about 17.5 million t nitric acid. The 10 published JI projects in Russia and Ukraine include 60 production lines with an expected annual production of about 5.7 million t nitric acid. We assu-me that most nitric acid plants have started validati-on or determination under the CDM and JI. For the year 2013, we estimate total nitric acid production from developing countries with 20 million t nitric acid per year and total nitric acid production from Russia and Ukraine at 8 million t nitric acid per year. We further assume that nitric acid production in the-se countries grows by 5% per year.
The rate of N2O formation in nitric acid plants de-pends on various factors. Wherever plant specific information is available from PDDs or monitoring reports, we use this data. Where such information is not available (e.g. for new CDM and JI projects), we assume the average rate of N2O formation observed in CDM plants of 8.85 kg N2O per tonne of nitric acid as a starting point for the year 2010. This value is mostly based on data from baseline campaigns that were conducted prior to the start of the projects, partially before 2010. We assume that the average N2O formation decreases over time due to the intro-duction of improved primary catalysts which form less N2O and other operational improvements. In Eu-rope, improved primary catalysts are already wide-spread; in the United States one third of the plants are estimated to use improved primary catalysts and they are reported to be also installed in some plants in developing countries (UNFCCC 2012). We assume that the average N2O formation from CDM plants decreases annually by 0.2 kg N2O per tonne of nitric acid, consistent with assumptions made in the CDM methodology ACM0019.
In practice the rate of abatement is often lower than assumed in PDDs (see section 3.3 above). PDDs often estimate the abatement level at 80% - 90% when im-plementing secondary abatement technology and at 85% - 95% or more when implementing tertiary abatement technology. In practice, on average, rates of 70% were achieved with secondary abatement and 86% with tertiary abatement according to ve-rified monitoring reports (Debor et al. 2010). Where monitoring data on the actual plant performance is available, we use this data to project future perfor-mance. For plants which have published a PDD but not yet issued CERs and ERUs, we reflect the obser-ved underperformance in our model and assume that the actual abatement is lower than estimated in the PDDs, assuming an average abatement rate of
80% for secondary and 90% for tertiary abatement technology.13 For new CDM and JI projects that may be developed in the future due to growing nitric acid demand we assume an overall average abatement level of 83% in 2013, reflecting approximately the current share of plants with secondary and tertiary abatement technology. For new plants we further assume that abatement levels slightly increase by 0.5 percentage points per year due to learning in the application of the technology.
Baseline emission factors are determined in different ways in CDM methodologies, depending on the me-thodology used:
The AM0028 methodology is applicable to terti-ary abatement in plants that started commercial operation before 2006. The methodology requires measuring the N2O formation ex-post during mo-nitoring. Baseline emissions are assumed to corre-spond to the measured N2O formation in the plant under most circumstances. If project participants do not use a catalyst that is common practice in the region or has been used in the nitric acid plant during the last three years and if they can-not justify the use of a different catalyst, then the baseline emission factor is limited to the level from previous monitoring periods. In addition, key ope-rating conditions of the plants can not be changed during project implementation. These provisions aimed to avoid perverse incentives to increase the N2O formation in order to increase CDM re-venues. However, they could provide a disincen-tive for project developers to use more advanced primary catalysts that reduce N2O formation. For this reason, the methodology was withdrawn by the CDM Executive Board in 2013, and replaced by a new version of the methodology ACM0019. For projects that still apply the methodology AM0028 during their first crediting period we use the ac-tual N2O formation measured in monitoring peri-ods for projects with a longer issuance record. For other projects, we use the assumptions made in the PDD ex-ante.
The AM0034 methodology is applicable to secon-dary abatement in plants that started commercial operation before 2006. The methodology esta-blishes baseline emissions once for all crediting periods through a measurement campaign prior to the implementation of the CDM project. If the composition of the primary gauze is changed af-ter project implementation, the baseline emission factor derived may not be anymore representa-
13 WeuseslightlyhigherperformancelevelsthanobservedbyDeboretal.(2010),assumingthatsomeofthelowperformancesareinitialproblemsandthatsomewhathigherlevelscanbeachievedforthe2013-2030periodduetofurtherinnovation.

23tive. In such cases, the methodology requires to conduct a new baseline campaign. As for AM0028, this provision aimed to avoid that N2O formation is increased during project implementation in or-der to increase CER revenues. However, it provides economic disincentives for project developers to use advanced primary catalysts that reduce N2O formation, as this would lower the revenues from CERs. Moreover, it was observed that few projects determined baseline emission factors that are out-side the range indicated by the IPCC and which would result in considerable economic losses for the plant operators. As for AM0028, the CDM Executive Board withdrew this methodology and replaced it with a new version of ACM0019. As for AM0028 projects, we use the results from the baseline measurement campaign where available to estimate baseline emissions for the first credi-ting period. Where this data is not available, we use information from the PDDs.
The ACM0019 methodology establishes default baseline emission factors which decrease from 3.7 kg N2O / t nitric acid in 2013 to 2.5 kg N2O / t nitric acid in 2020 and subsequent years. These values aim to avoid perverse incentives, in parti-cular for new plants, to use technologies that may result in higher N2O formation. The default values are below commonly observed emission factors in plants without secondary or tertiary abatement. Projects using these emission factors therefore likely receive fewer credits than they reduce emis-sions, resulting in a net mitigation benefit. For the-se plants, the credit supply potential is therefore lower than the abatement potential. For projects that used the AM0028 or AM0034 methodologies in their first crediting period, the methodology ad-opts a more lenient approach and uses the mini-mum value between the baseline values used in the first crediting period and a cap on the baseline emissions, which corresponds to the upper end of the uncertainty range of the default values in-cluded in the 2006 IPCC Guidelines, with a linear decrease over time of 0.2 kg N2O / t nitric acid. We assume for these projects that calculated emission reductions correspond approximately to the actu-al abatement.
In estimating the credit supply potential, we con-sider the implications of the withdrawal of the AM0028 and AM0034 methodologies in our model, estimating the future issuance potential for each of the 101 CDM projects. As none of the 10 published JI projects has issued ERUs and 8 projects have not been registered, we assume that all JI projects would use the ACM0019 methodology if they were imple-mented.
The N2O abatement potential from all nitric acid plants is about 58-81 Mt CO2e / yr (see Table 3 on page 23). Over the period of 2013 to 2030, the aba-tement potential is about 1.25 Gt CO2e. About 71% of the abatement potential is in CDM countries and about 29% in Russia and Ukraine. The credit supply potential is significantly lower than the abatement potential, due to the conservative and decreasing emission benchmarks in the ACM0019 methodolo-gy.
24
In the following, we estimate the GHG abatement costs for the three project types, with a view to un-derstanding the cost implications of continuing GHG abatement. We differentiate between:
Technical abatement costs which include the in-vestment expenditures (CAPEX) and operational expenditures (OPEX) for installing and operating the GHG abatement equipment, including plan-ning, engineering, and equipment purchase, rele-vant operational costs, such as energy, labour, and maintenance costs, as well as costs for automated monitoring systems (AMS) to control and measure emission reductions (section 5.1); and
Transaction costs which include all CDM and JI re-lated transaction costs, including costs for project development, project management, auditing, ad-ministrative fees, and the share of proceeds for the adaptation fund (section 5.2).
Overall abatement costs which include both technical abatement costs and transaction costs (section 5.3).
5.1 Technical abatement costs
The technical abatement costs are determined for the three project types based on information from PDDs, data provided by project developers and in-dustry experts contacted for the purpose of this stu-dy, and data from the literature. They are expressed in in EUR per metric tonne of CO2 equivalent.
For the purpose of this study, it is important to consider capital expenditures (CAPEX), operational expenditures (OPEX), and revenues or cost savings from the implementation of the GHG abatement (e.g. sales of steam or other products) separately. Ba-sed on this data we determine:
Total technical abatement costs which include CAPEX, OPEX, and revenues or cost savings from the implementation of the GHG abatement (e.g. sales of steam generated from the decomposition of N2O); and
Marginal technical abatement costs which in-clude OPEX and revenues or cost savings from the implementation of the GHG abatement but exclude CAPEX. They express the marginal costs that operators consider, once capital expenditures have been made, when deciding whether or not to continue GHG abatement.
The total technical abatement costs reflect the costs required to initiate the GHG abatement in the case of plants that do not yet have installed GHG abatement technology. The marginal technical abatement costs reflect the costs to continue the GHG abatement in plants that have already installed GHG abatement technology. When the GHG abatement is not en-sured through regulations or binding agreements with the plant operators but through financial in-centives or carbon markets, plant operators or pro-ject developers often require an additional incentive or profit to assume the risks and challenges of the GHG abatement projects. Important challenges and risks are long lead-times from project start until the first issuance of credits, possible delays in the imple-mentation of projects, possible underperformance of the projects due to lower production levels or lo-wer abatement levels, as well as political risks which may stop the entire project. These risks can result in less, delayed or even no issuance of credits. We re-flect these challenges and risks by using a weighted average cost of capital (WACC) of 20% and by ma-king conservative assumptions in the calculation of the technical abatement costs. In particular, we con-servatively assume that the abatement projects only have an operational lifetime of 10 years, although for most projects the technical equipment can be used for longer time periods.
The technical abatement costs can vary considerably between plants and to some extent between coun-tries, due to differences in technical, economic or political factors. To reflect such differences, we pro-vide a range for the technical abatement costs with three scenarios: a „reference“ or „middle range“ sce-nario representing the typical, or average, situation of a GHG abatement project in the sector, and two scenarios reflecting the lower and upper end of the plausible range of technical abatement costs. In the lower and upper range scenario we vary key para-meters that impact the overall technical abatement costs: the CAPEX, the OPEX, and the project size and performance, which impact the amount of emission reductions. For cost data, we use the range of costs provided in sources evaluated for this study. For the project size, we consider the capacity range from pu-blished CDM and JI projects. For the project perfor-mance, we use data on the average performance of implemented CDM and JI projects.
Table 4 provides an overview of our estimates for total and marginal technical abatement costs for the three project types. Appendix 1 to this study provides detailed background information on the
5 GHG abatement costs
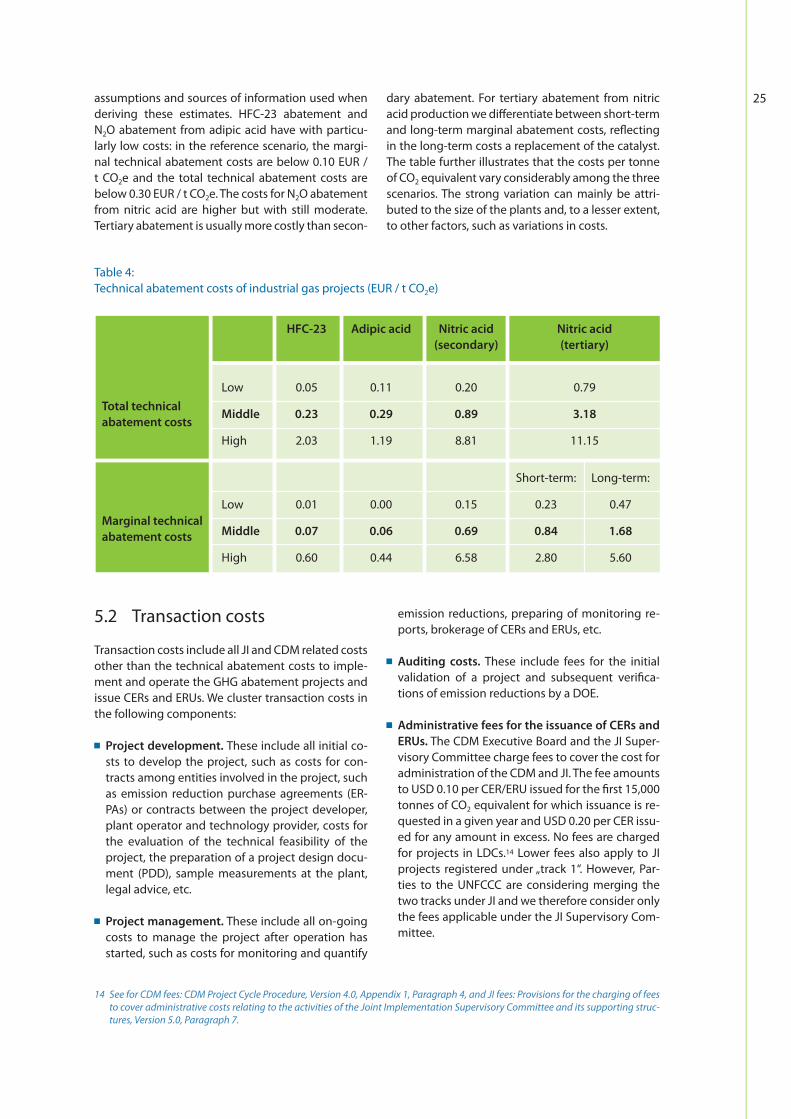
25assumptions and sources of information used when deriving these estimates. HFC-23 abatement and N2O abatement from adipic acid have with particu-larly low costs: in the reference scenario, the margi-nal technical abatement costs are below 0.10 EUR / t CO2e and the total technical abatement costs are below 0.30 EUR / t CO2e. The costs for N2O abatement from nitric acid are higher but with still moderate. Tertiary abatement is usually more costly than secon-
dary abatement. For tertiary abatement from nitric acid production we differentiate between short-term and long-term marginal abatement costs, reflecting in the long-term costs a replacement of the catalyst. The table further illustrates that the costs per tonne of CO2 equivalent vary considerably among the three scenarios. The strong variation can mainly be attri-buted to the size of the plants and, to a lesser extent, to other factors, such as variations in costs.
Table 4: Technical abatement costs of industrial gas projects (EUR / t CO2e)
5.2 Transaction costs
Transaction costs include all JI and CDM related costs other than the technical abatement costs to imple-ment and operate the GHG abatement projects and issue CERs and ERUs. We cluster transaction costs in the following components:
Project development. These include all initial co-sts to develop the project, such as costs for con-tracts among entities involved in the project, such as emission reduction purchase agreements (ER-PAs) or contracts between the project developer, plant operator and technology provider, costs for the evaluation of the technical feasibility of the project, the preparation of a project design docu-ment (PDD), sample measurements at the plant, legal advice, etc.
Project management. These include all on-going costs to manage the project after operation has started, such as costs for monitoring and quantify
emission reductions, preparing of monitoring re-ports, brokerage of CERs and ERUs, etc.
Auditing costs. These include fees for the initial validation of a project and subsequent verifica-tions of emission reductions by a DOE.
Administrative fees for the issuance of CERs and ERUs. The CDM Executive Board and the JI Super-visory Committee charge fees to cover the cost for administration of the CDM and JI. The fee amounts to USD 0.10 per CER/ERU issued for the first 15,000 tonnes of CO2 equivalent for which issuance is re-quested in a given year and USD 0.20 per CER issu-ed for any amount in excess. No fees are charged for projects in LDCs.14 Lower fees also apply to JI projects registered under „track 1“. However, Par-ties to the UNFCCC are considering merging the two tracks under JI and we therefore consider only the fees applicable under the JI Supervisory Com-mittee.
14 SeeforCDMfees:CDMProjectCycleProcedure,Version4.0,Appendix1,Paragraph4,andJIfees:ProvisionsforthechargingoffeestocoveradministrativecostsrelatingtotheactivitiesoftheJointImplementationSupervisoryCommitteeanditssupportingstruc-tures,Version5.0,Paragraph7.
HFC-23 Adipic acid Nitric acid Nitric acid (secondary) (tertiary)
Low 0.05 0.11 0.20 0.79
Middle 0.23 0.29 0.89 3.18
High 2.03 1.19 8.81 11.15
Short-term: Long-term:
Low 0.01 0.00 0.15 0.23 0.47
Middle 0.07 0.06 0.69 0.84 1.68
High 0.60 0.44 6.58 2.80 5.60
Total technicalabatement costs
Marginal technicalabatement costs

26 Share of proceeds for the adaptation fund. Un-der the CDM, 2% of the issued CERs are forwarded to the adaptation fund.
Not all cost items are relevant for all projects. For CDM and JI projects that have already been imple-mented we consider only on-going costs: project management costs, verification costs, administrative fees and the share of proceeds. We do not include project development and validation costs, which can be regarded as sunk costs. We consider all cost components in the case of projects which still need to be implemented, including future CDM and JI pro-jects for which no PDD has yet been published by an auditor as well as projects for which a PDD has been published but that have not yet been implemented. For GHG abatement activities that are not eligible for crediting under the CDM we consider project deve-lopment, project management, and auditing costs, but no administrative fees and the share of proceeds. Although these activities are not eligible under the CDM, we assume that for most policies to continue GHG abatement, a quantification and verification of emissions reductions will be required. In the case of continuing GHG abatement in CDM plants beyond their crediting periods, only project management and verification costs are considered.
Transaction costs vary strongly among project ty-pes, depending mainly on their size and complexity. For example, projects involving surveys or frequent expensive measurements involve significantly hig-her monitoring costs than projects where mea-surements are simple or conducted anyways for purposes other than the CDM. Other important fac-tors are the project types, the project size and the frequency of validation. Estimates on transaction costs vary considerably, including for similar project types, with cost estimates ranging from about 0.20 to about 3.00 EUR per CER or ERU (Gillenwater and Seres 2011; Spalding-Fecher et al. 2012; UNFCCC 2013; Warnecke et al. 2013; Worldbank 2010). Hence, transaction costs can easily exceed the current mar-ket prices for CERs and ERUs.
The three project types under consideration are similar and thus also have similar project develop-ment and project management costs. For nitric acid projects higher costs may incur than for HFC-23 and adipic acid, due to requirements in the relevant me-thodologies with regard to auditing of the monito-ring systems. In the past, some nitric acid projects also incurred higher costs for conducting a baseline campaign; however, this requirement is not included in currently valid CDM methodologies anymore. Ba-sed on above mentioned the literature and informa-tion by a project developer (NSERVE 2014), we assu-me for all three projects project development costs
of EUR 100,000 and annual project management costs of EUR 60,000. We estimate initial validation costs with EUR 50,000 for all three project types. We assume that emission reductions are verified twice per year and estimate annual verification costs with EUR 30,000 for HFC-23 and adipic acid projects and EUR 50,000 for nitric acid projects.
5.3 Overall abatement costs
Overall abatement costs include technical abate-ment costs and transaction costs. Table 5 provides an overview of the overall abatement costs for the three industrial gas project types from 2013 to 2030. The table differentiates between 1) the technical aba-tement costs; 2) the project development, project management and auditing costs; and 3) the admi-nistrative fees for the issuance of CERs or ERUs. The latter are only relevant for some of the policy options discussed in section 6, and are not applicable to new HFC-23 and adipic acid plants which are not eligi-ble for crediting under the CDM. For implemented CDM projects only operational expenditures (OPEX) and on-going transaction costs due to project ma-nagement and verification are considered, where-as capital expenditures (CAPEX) and initial project development and validation costs are regarded as sunk costs. For new CDM and JI projects, all costs are considered. The table also shows the average overall abatement costs per t CO2e reduced (without issu-ance fees).
The overall costs (without issuance fees) for abating all GHG emissions from industrial gas projects for the period of 2013 to 2030 are estimated to amount to about EUR 3.5 billion and could lead, over the same time period, to an emission reduction of about 7.5 Gt CO2e, at an average cost of 0.47 EUR / t CO2e. This illustrates both the large GHG abatement potenti-al and the low costs per tonne of CO2e. The overall abatement costs (without issuance fees) vary consi-derably among the project types. With less than 0.10 EUR / t CO2e they are particularly low for continuing GHG abatement in already implemented HFC-23 and adipic acid projects.
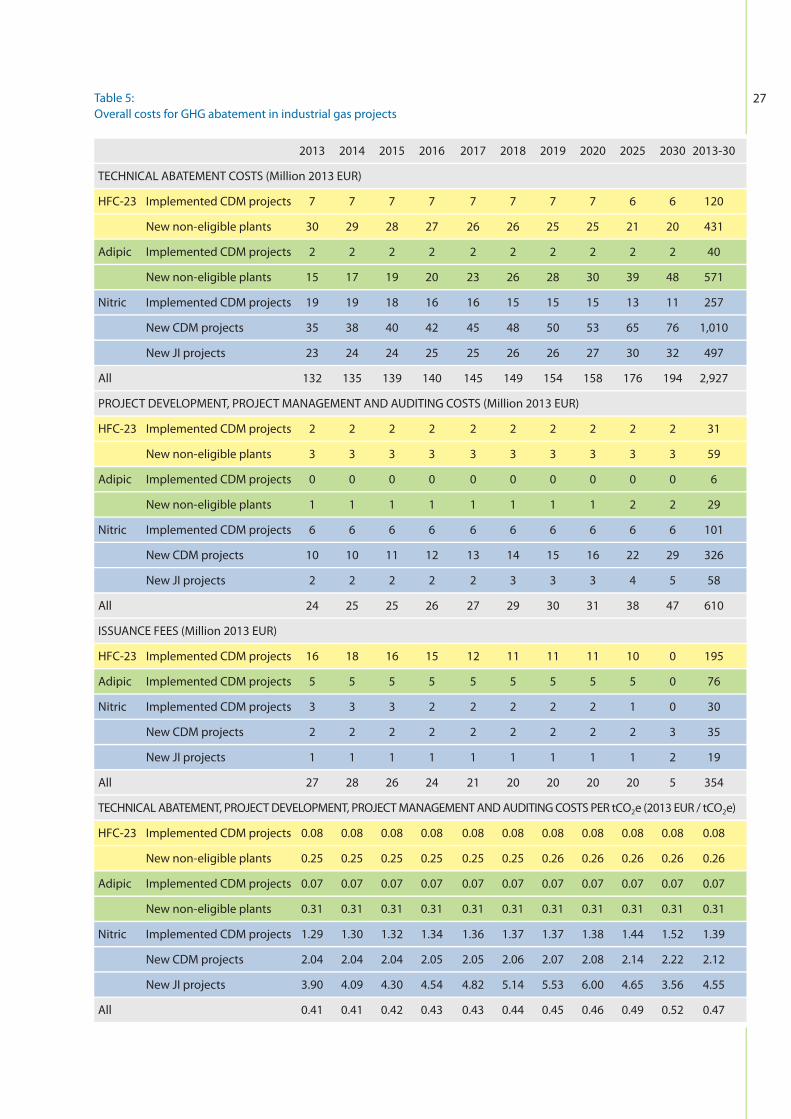
27Table 5:Overall costs for GHG abatement in industrial gas projects
2013 2014 2015 2016 2017 2018 2019 2020 2025 2030 2013-30
TECHNICAL ABATEMENT COSTS (Million 2013 EUR)
HFC-23 Implemented CDM projects 7 7 7 7 7 7 7 7 6 6 120
New non-eligible plants 30 29 28 27 26 26 25 25 21 20 431
Adipic Implemented CDM projects 2 2 2 2 2 2 2 2 2 2 40
New non-eligible plants 15 17 19 20 23 26 28 30 39 48 571
Nitric Implemented CDM projects 19 19 18 16 16 15 15 15 13 11 257
New CDM projects 35 38 40 42 45 48 50 53 65 76 1,010
New JI projects 23 24 24 25 25 26 26 27 30 32 497
All 132 135 139 140 145 149 154 158 176 194 2,927
PROJECT DEVELOPMENT, PROJECT MANAGEMENT AND AUDITING COSTS (Million 2013 EUR)
HFC-23 Implemented CDM projects 2 2 2 2 2 2 2 2 2 2 31
New non-eligible plants 3 3 3 3 3 3 3 3 3 3 59
Adipic Implemented CDM projects 0 0 0 0 0 0 0 0 0 0 6
New non-eligible plants 1 1 1 1 1 1 1 1 2 2 29
Nitric Implemented CDM projects 6 6 6 6 6 6 6 6 6 6 101
New CDM projects 10 10 11 12 13 14 15 16 22 29 326
New JI projects 2 2 2 2 2 3 3 3 4 5 58
All 24 25 25 26 27 29 30 31 38 47 610
ISSUANCE FEES (Million 2013 EUR)
HFC-23 Implemented CDM projects 16 18 16 15 12 11 11 11 10 0 195
Adipic Implemented CDM projects 5 5 5 5 5 5 5 5 5 0 76
Nitric Implemented CDM projects 3 3 3 2 2 2 2 2 1 0 30
New CDM projects 2 2 2 2 2 2 2 2 2 3 35
New JI projects 1 1 1 1 1 1 1 1 1 2 19
All 27 28 26 24 21 20 20 20 20 5 354
TECHNICAL ABATEMENT, PROJECT DEVELOPMENT, PROJECT MANAGEMENT AND AUDITING COSTS PER tCO2e (2013 EUR / tCO2e)
HFC-23 Implemented CDM projects 0.08 0.08 0.08 0.08 0.08 0.08 0.08 0.08 0.08 0.08 0.08
New non-eligible plants 0.25 0.25 0.25 0.25 0.25 0.25 0.26 0.26 0.26 0.26 0.26
Adipic Implemented CDM projects 0.07 0.07 0.07 0.07 0.07 0.07 0.07 0.07 0.07 0.07 0.07
New non-eligible plants 0.31 0.31 0.31 0.31 0.31 0.31 0.31 0.31 0.31 0.31 0.31
Nitric Implemented CDM projects 1.29 1.30 1.32 1.34 1.36 1.37 1.37 1.38 1.44 1.52 1.39
New CDM projects 2.04 2.04 2.04 2.05 2.05 2.06 2.07 2.08 2.14 2.22 2.12
New JI projects 3.90 4.09 4.30 4.54 4.82 5.14 5.53 6.00 4.65 3.56 4.55
All 0.41 0.41 0.42 0.43 0.43 0.44 0.45 0.46 0.49 0.52 0.47

28
Figure 3:Overall abatement cost structure per CER or ERU in 2020 for industrial gas project types that are eligible for crediting under the CDM
6.00
5.00
4.00
3.00
2.00
1.00
0.00
2013
EU
R pe
r CER
or E
RU
HFC-23 - Implemented
Adipic acid - Implemented
Nitric acid - Implemented
Nitric acid - New
Share of proceeds
Issuance fees
Auditing
Project Development and management
Technical abatement
Figure 3 shows the typical cost structure per CER and ERU in 2020. We use 2020 as the reference point be-cause, by that time, all implemented CDM projects with renewable crediting periods use more recently approved methodologies which determine emission reductions in a more conservative manner. Accor-ding to our bottom-up models, by 2020 the fraction of emission reductions that are credited as CERs or ERUs is about 33% for HFC-23, 88% for adipic acid, 92% for implemented nitric acid projects, and 30% for new nitric acid plants. For this reason, the ove-rall abatement costs per CER and ERU (Figure 3) are higher than the overall abatement costs per t CO2e reduced (Table 5).
The figure shows the very low costs for per CER in im-plemented HFC-23 and adipic projects. However, for these projects the issuance fee for CERs constitutes a major cost factor, amounting to 38% of the total costs for HFC-23 and even 63% for adipic acid. In ab-solute terms, transaction costs are higher for nitric acid projects, mainly due to the smaller project size and thus larger number of projects, but they can still be regarded moderate, at less than 1 EUR per CER or ERU.

29
In the following, we present and discuss policy op-tions for ensuring continued GHG abatement from HFC-23, adipic acid, and nitric acid projects in CDM and JI countries. We consider options where the host country adopts policies to continue abatement and where the abatement is supported through a bila-teral or international approach. The options are dis-cussed in the context of these three project types; however, they could potentially also be applied to other projects types, though not all of the conclusi-ons would also hold for other project types. In the case of HFC-23 abatement from HCFC-22 production and N2O abatement from adipic acid production, the scope of current CDM methodologies is limited to plants that were constructed about a decade ago. As a significant amount of HCFC-22 and adipic acid is produced in plants that are not eligible under the CDM, we also look into options to initiate GHG aba-tement in these „new“ installations.
We consider the following policy approaches to en-sure continued abatement:
regulations (or other non-market based policies) by the host country,
inclusion in domestic ETSs, domestic use of credits, international or bilateral purchase of credits, international or bilateral funding of abatement.
Some of these options can be combined. In the fol-lowing, we first describe (6.1 to 6.5), then assess and compare these options (6.6), and finally consider possible combinations (6.7).
6.1 Regulations by the host country
The countries hosting CDM and JI projects could ad-opt regulations or other non-market based policies to ensure continued GHG abatement. Regulations could require the installation and operation of a GHG abatement technology, set limits on the con-centration of the GHGs in the tail gas vented to the atmosphere or set benchmarks which express the allowed GHG emissions in relation to the amount of production, i.e. emission limitations expressed as t HFC-23 / t HCFC-22, t N2O / t adipic, and t N2O / t ni-tric acid. Regulations could apply only to implemen-ted CDM and JI projects or also to new installations. Non-market based policies could include subsidies or taxes. Our analysis focuses on regulations.
6.2 Inclusion in domestic ETSs
Another option for domestic action could be the inclusion of the installations in emissions trading schemes (ETSs). Several countries hosting HCFC-22, adipic acid and nitric acid plants are in the process of establishing ETSs, with China and South Korea being in the most advanced stage. Pilot ETSs are being es-tablished in seven provinces in China, and a national scheme may start before 2020. The ETS in South Ko-rea has been adopted and is planned to start in 2015.
The ETSs in China and South Korea alone could po-tentially address about 80% of the total 2020 GHG abatement potential from the three project types in developing countries, Russia and Ukraine. More than 80% of the HCFC-22 production capacity is located in these countries; three out of the four adipic acid projects registered under the CDM registered are lo-cated in China and South Korea; all new adipic acid facilities commissioned to date are located in China; and nearly 50% of the nitric acid production capacity in developing countries is located in China.
6.3 Domestic use of credits
Under this option, the GHG abatement is incentivi-zed through the domestic use of project-based cre-dits. The demand for credits could come from diffe-rent sources, including:
Domestic or regional ETSs: Countries with ETSs could allow entities under the ETS to use domestic credits for compliance, including credits from the three assessed project types.
Use of credits to meet tax obligations or regulati-ons: Some countries are considering establishing CO2 taxes and allowing emitters to meet or red-uce the tax obligation by surrendering domestic offset credits. For example, Mexico is considering a scheme where the tax can be paid by surrende-ring CERs, with a defined CER price. South Africa is considering a scheme where surrendering CERs would reduce the tax basis: one CER surrendered would reduce the tax obligation by one tonne of CO2. These approaches could potentially create a market for CERs from domestic projects, with pri-ces above international CER market prices. Other approaches could include regulations which re-quire public or private entities to offset their GHG emissions through the purchase of credits.
6 Options for continuing GHG abatement

30 Domestic funds: Countries could establish dome-stic funds for the purchase of CERs. Funding could be sourced from the auctioning of allowances or the taxes on international CER revenues. For exam-ple, China introduced a levy on international CER revenues from the three project types, which was fed into a fund, the „China CDM Fund“, with a view to supporting national activities of addressing cli-mate change and for sustainable development. The fund could now be used to purchase CERs from these projects.
Voluntary markets: Domestic credits could be used to voluntarily offset emissions from compa-nies, events, institutions or individuals.
6.4 International or bilateral purchase credits
Under this option, credits are purchased through international or bilateral sources of funding. The purchased credits could be either used to meet com-mitment or pledges under the Kyoto Protocol or the UNFCCC, or they could be transferred to a voluntary cancellation account. Accordingly, the demand for the credits could originate from multilateral or na-tional purchase programmes or from compliance markets in other countries, such as ETSs linked to the CDM and JI. However, the EU ETS and the NZ ETS banned the use of credits from HFC-23 and adi-pic acid projects. As highlighted above, the CDM furthermore limits the crediting for these project types to installations that started operation about a decade ago. Major voluntary carbon standards also exclude project types: the Verified Carbon Standard excludes HFC-23, the Gold Standard all three pro-ject types. In the case of funds to purchase credits, different mechanisms could be used to determine the credit price, such as tenders with sealed or open bids, prices negotiated based on the technical aba-tement costs or reverse auctioning. In the case of the three projects types, it would need to be assessed whether the small number of market participants could constitute a risk of price rigging.
6.5 International or bilateral funding of abatement
Under this option, the GHG abatement is funded in-ternationally or bilaterally, without the issuance and use of carbon market units. The funding could be implemented bilaterally or internationally, through relevant implementing agencies. The costs for GHG abatement could be fully financed internationally or be shared between the funding and the host coun-
try. Results-based funding could be used to ensure that the GHG abatement is effectively implemented.
6.6 Comparison of the policy options
The five policy options presented in the previous sections have different features. We compare and assess them in the following with regard to the fol-lowing criteria:
Long-term or temporary nature: whether the approach provides for long-term or temporary in-centives to abate GHG emissions;
Capability and capacity: the capability and ca-pacity of the host countries to implement and enforce the approach;
Implications on global GHG emissions: the ex-tent to which the approach reduces global GHG emissions or leads to a shift in those emissions;
Avoidance of perverse incentives: whether the approach is able to address perverse incentives, such as incentives to shift production (carbon lea-kage) or increase the amount of GHGs generated;
Ability to address sector-wide emissions: whether the approach is able to address emissions from all installations (e.g. existing and new) or only some installations;
Incentives for abatement: whether the approach provides incentives to abate GHG emissions to the extent that such abatement is cost-effective;
Transaction costs: whether the approach has low transaction costs.
Table 6 provides a summary assessment of the poli-cy options with regard to these criteria.

31Table 6:Comparison of policy options for GHG abatement from industrial gas projects
ETS inclusion
Long-termif effectively designed
More advanced developing countries with planned ETSs
Lower or similar reductions compared to regulations, de-pending on the ETS design
Depending onallocation rules
Yes(but limited to countries with ETSs)
High
Moderate
Domestic use of credits
Depending on the policy design
More advanceddeveloping countries
No reductions, similar reduc-tions or higher reductions compared to regulations, de-pending on the use and quality of the credits
Nitric acid: YesHCFC-22 and adipic acid: dif-ficult to address with fluctuating market prices for credits
Nitric acid: Yes HCFC-22 and adipic acid: plants that started operati-on before 2003 / 2005 High if credit purchase is based on market prices
Moderate
International or bilateralcredit purchase
Temporary
All countries
No reductions, similar reduc-tions or higher reductions compared to regulations, de-pending on the use and quality of the credits and avoidance of double claiming
Nitric acid: YesHCFC-22 and adipic acid: dif-ficult to address with fluctuating market prices for credits
Nitric acid: Yes HCFC-22 and adipic acid: plants that started operati-on before 2003 / 2005
High if credit purchase is based on market prices
Moderate
International or bilateral funding
Temporary
All countries
Same reductionsas regulations
Yes
Yes
Low or mode-rate, depen ding on the means of funding
Moderate
Regulations
Long-term
More advanceddeveloping countries
Reference case
Yes
Yes
Low
Low
Long-term or temporary nature
Capacity and capability
Implications on global GHG emissions
Avoidance ofperverse incen-tives
Ability to addresssector-wide emissions
Incentives for cost-effective abatement
Transaction costs
32 6.6.1 Long-term or temporary nature
Some policy options provide long-term incentives to abate GHG emissions, while others could be more temporary or transitional in nature. An important advantage of regulations is that they provide long-term incentives for GHG abatement. Once they are adopted and implemented, they usually stay in place. ETSs are also seen as a long-term tool to address GHG emissions, given the time frames that are necessary for the transition towards low carbon economies. However, GHG emissions are only aba-ted as long as the ETS exposes the installations to a carbon price that is above the technical abatement costs. In the case of significant over-allocation of allowances and no other means to ensure a certain price level, carbon market prices could drop below the technical abatement costs of some installations. Nitric acid plants are more exposed to this effect than adipic acid or HCFC-22 plants, as they face hig-her abatement costs.
Similar considerations apply to the domestic purchase of credits: sufficient demand for credits and a sufficient price signal is a prerequisite to make this option work effectively in the long term. If the cre-dit supply exceeds the demand or if the price is too low, the GHG abatement could be stopped and only be continued once new demand emerges or prices recover. In the near future, sufficient demand may only emerge from mandatory markets, such as do-mestic ETSs, tax obligations or other regulations. The voluntary market is small compared to the potential credit supply. Moreover, companies operating in the voluntary market prefer projects that have high co-benefits and can be easily communicated to consu-mers. In compliance markets, the demand for credits could be of more temporary or long-term nature, depending on the policy instrument used to create domestic demand for credits. For example, using credits to offset a CO2 tax could create a stable de-mand, as long as the CO2 tax continues, is sufficient-ly high, and the supply of credits is limited. An ETS could create a stable demand, as long as allowances are not over-allocated and credit supply is limited. Other policy instruments, such as domestic funds to purchase credits, may be designed at the outset to only temporarily provide incentives for reducing GHG emissions. In conclusion, the design of the po-licy instrument that creates the credit demand is de-cisive with regard to whether or not it is a long-term or temporary solution.
International purchase of credits and international or bilateral funding are mostly seen as a temporary solution. Public purchase programmes and interna-tional funds usually provide buy credits or provide funding for specific activities and limited time fra-
mes. ETSs can change their policies with regard to their credit use in terms of the number, project types and origin of credits. As highlighted above, some ETSs and voluntary standards have excluded credits from HFC-23 and adipic acid project types. For these projects, the endorsement of public credit purchase programmes could be politically difficult, also be-cause these projects benefitted from large profits in the past. Public credit purchase programmes tend to prioritize projects that have significant co-benefits, strongly contribute to sustainable development, and provide benefits to the poor. Another tempora-ry constraint of international credit purchase is the limited crediting periods applying under the CDM and other offsetting standards. Finally, in a long-term perspective of a transition towards low carbon economies, the room to use credits for offsetting other emissions will diminish: with more ambitious economy-wide emission reductions the scope of uncovered sectors available for offset supply will de-crease.
6.6.2 Capability and capacity
Another important aspect is how demanding the policy options are for host countries. All options that require action by host country authorities – regula-tion by the host country, inclusion in domestic ETSs, and domestic use of credits – require capacities in public authorities to adopt and enforce regulations or policies. Adopting and enforcing such policies can be challenging, in particular for less developed coun-tries. In contrast, international or bilateral purchase of credits or funding requires less host country over-sight and may thus be easier to implement.
A specific barrier for the three assessed project types could be that host countries do not have incentives to reduce HFC-23 and N2O emissions other than for the purpose of mitigating climate change. In con-trast to many other CDM and JI project types, the three assessed project types do not provide large co-benefits, such as reducing the dependency on fossil fuels, achieving economic gains through ener-gy efficiency improvements, alleviating poverty, or reducing air pollution.
On the other hand, most of the countries hosting HFC-23 and adipic acid projects – Argentina, China, India, Brazil, South Korea, Mexico – are emerging economies. Most of them submitted economy-wide mitigation pledges to the UNFCCC to reduce their GHG emissions by 2020, in the form of nationally ap-propriate mitigation actions (UNEP 2013a). They may have better capacity than less developed countries to adopt and enforce policies for GHG abatement. However, not all countries included in their pledge HFC and N2O emissions; for example, China‘s pledge

33covers only CO2 (UNEP 2013a). If HFC and N2O emis-sions are excluded from the scope of the pledge, the country may have fewer incentives to adopt regu-lations, as the reductions would not contribute to achieving its pledge.
With regard to the HFC-23 and adipic acid projects, another argument for host country responsibility in addressing these emissions is that the countries and companies received significant revenues from crediting under the CDM, which far exceeded the costs for GHG abatement. Any cost associated with continued GHG abatement in the future would be far lower than the profits that were generated in the past through the CDM. In some cases, the profits from CDM revenues might be directly used to ensu-re continued GHG abatement. For example, the „Chi-na CDM Fund“, could be used to financially support plant operators to meet any regulations.
In the case of nitric acid production, the plants are located in many countries, including countries which are less developed; many of them have not yet made economy-wide mitigation pledges to the UNFCCC. Some of these countries may have less capacity to adopt and enforce national policies for GHG abate-ment. Besides, the technical abatement costs for N2O abatement from nitric acid production are higher than for adipic acid production and HFC-23 abate-ment from HCFC-22 production. Abating N2O from nitric acid production thus constitutes a higher cost for these countries or their industries.
Among the three options for domestic policies, im-plementing and enforcing an ETS is a major challen-ge for many countries, and may be more challenging than adopting regulations or implementing policies for the domestic purchase of credits. Clearly, inclu-sion of the three project types is only a viable way forward in countries which are in an advanced stage of introducing ETSs.
6.6.3 Implications on global GHG emissions
The policy options have different implications on global GHG emissions. Understanding these implica-tions is not straight-forward but important to assess the policy options. A first consideration is whether the reductions fall within the scope of a mitigation pledge made under the Cancun Agreements, in the form of nationally appropriate mitigation actions by developing countries (UNEP 2013a). If the emissions
fall within the scope of a mitigation pledge under the Cancun Agreements or a post-2020 climate re-gime, one could argue that reducing these emissions helps to achieve the mitigation pledge but does not lead to emission reductions beyond that pledge. The same could be argued of commitments by Ukraine under the Kyoto Protocol. However, most host coun-tries of industrial gas projects do not have pledges before 2020. Moreover, China‘s 2020 pledge only covers CO2 emissions and the large majority of the 2020 emissions from the three project types would occur in China. Reducing these emissions thus constitutes mitigation action beyond the mitigation pledge made by China under the UNFCCC. For other host countries, the scope of their mitigation pledges is not fully clear but may include all GHGs.
Besides this general question of whether the emissi-ons reductions already fall within the scope of a miti-gation pledge or commitment, there are important differences between the policy options with regard to their implications on global GHG emissions. We consider these implications by comparing regula-tions with the other policy options.15 Regulations do not interfere with other policy instruments. The emission reductions represent „net reductions“ of emissions to the atmosphere (which may be either used to achieve a pledge or go beyond a pledge).
The situation is more complex for ETSs: the inclusi-on of installations in an ETS could lead to similar or significantly fewer net reductions than regulations, depending on how the cap is set. For example, ima-gine an ETS which sets the cap at 10% below the emissions in a historical base year. The implications depend on whether HFC-23 and N2O emissions were abated in the base year. If HFC-23 and N2O emissions were abated in the base year, e.g. due to the CDM or JI, but the abatement stopped or would stop there-after, the effect of including the installations would be the same or similar to introducing regulations. The overall cap of the ETS would remain relatively unaffected, while its scope is amended to HFC-23 and N2O emissions. However, if HFC-23 and N2O emissions were unabated in the base year because the base year is prior to the start of the CDM and JI projects or after the projects stopped GHG abate-ment, the net reduction compared to regulations would only amount to 10%. In this case, the inclu-sion of HFC-23 and N2O emissions in the ETS would increase the available allowances respectively and mainly lower the abatement costs within the ETS. This could lower the overall ambition of the ETS. It
15 Forthepurposeofthiscomparison,weassume,asasimplification,that100%oftheGHGemissionsareabatedundertheregulati-ons.However,thefindingsoftheanalysisalsoholdforregulationswhichrequirelowerabatementlevelsthataretypicallyachievedthermalorcatalyticdecompositionofHFC-23orN2O(dependingontheprojectbetween70%and100%).

34 is therefore important to carefully consider whether and how the overall cap is adjusted when including HFC-23 and N2O emissions in an ETS. 16
Similarly, the domestic, international or bilateral purchase of credits can have different implications on net emissions. Two issues are important: how the credits are used and the „quality“ of the credits. If credits entitle the user to emit an additional tonne of emission reductions, the purchase and use of credits, in the first place, offsets other emissions, thereby lo-wering overall abatement costs but not leading to net reductions. This applies, for example, to the use of credits in a domestic ETS. In contrast, if the credits are transferred to a cancellation account, without entitlement of anybody to emit a tonne, the effect is the same or similar as with regulations. This applies, for example, to a national fund to purchase and can-cel credits. In principle, this also applies to the sur-rendering of credits to offset tax liabilities, as envi-saged by Mexico and South Africa. In this latter case, the price elasticity of CO2 emission reductions might slightly reduce the net mitigation effect compared to the regulations; the purchase and surrender of credits instead of tax payments could lower the co-sts of emitting CO2, lowering the incentives for CO2 emission reductions.
The quality of the credits also plays an important role. As highlighted above, some industrial gas CDM methodologies credit fewer CERs than emission red-uctions achieved, providing for a net mitigation be-nefit, even if the CERs are used to meet a mitigation pledge. In such cases, the use of a credit could lead to a mitigation benefit that may even exceed that of regulations. In contrast, if the credits do not consti-tute real and additional emission reductions and if the credits are used to meet a mitigation pledge, global GHG emissions would increase. The quality of credits strongly depends on the project type and methodology version used. As highlighted abo-ve, version 6.0.0 of the CDM HFC-23 methodology AM0001 is likely to provide considerable net mitiga-tion benefits, while earlier versions could overesti-mate emission reductions.
For international transfer and use of credits to meet mitigation pledges, double claiming of emission re-ductions could be a further challenge. In the case of international transfer of credits, there is a risk that both the host country and the country using the credits account for the same emission reductions to-wards meeting pledges or commitments under the UNFCCC. This occurs if the emission reductions are reflected in the GHG inventory of the host country
and the host country does not account for credits transferred internationally, while the buyer coun-try accounts the acquired units towards meeting pledges or commitments (Prag et al. 2013, Schneider et al. 2014). This issue is addressed through accoun-ting rules under the Kyoto Protocol but not for miti-gation pledges under the Cancun Agreements. This issue also does not arise if the credits are voluntary cancelled and are not used to meet any pledges or commitments.
International funding for the GHG abatement has the same effect as regulations, as long as such fun-ding is additional to other funding available for miti-gation and as long as the GHG emission reductions are not claimed by the funder or other entities.
For all options, monitoring, reporting and verifica-tion is important to provide confidence that the reductions are achieved. Keller et. al (2011) showed large discrepancies between HFC-23 emissions re-ported in GHG inventories in European countries and emission estimates derived from atmospheric measurements and suggests that HFC-23 emissi-ons in Italy were underreported by an order of ma-gnitude. Monitoring and verification of emission reductions is not only important for market-based approaches, but also for regulations and internati-onal funding. For this purpose, relevant CDM me-thodologies could be used and emission reductions could be verified by Designated Operational Entities (DOEs), without issuing CERs.
Finally, a broader long-term accounting question ari-ses when an option leads to offsetting increased CO2 emissions with HFC-23 or N2O emission reductions. Over the 100 year time frame used under the UNFC-CC for GWPs this offsetting has the same cumulative radiative forcing effect. However, in a long-term per-spective, HFC-23 and N2O have a limited atmosphe-ric lifetime of 121 and 222 years, while CO2 may be stored in the atmosphere for long time periods (IPCC 2013, page 731-733). In this regard, options that do not offset CO2 emissions with HFC-23 or N2O emissi-on reductions have a further long-term advantage. On the other hand, the atmospheric lifetime of HFC-23 and N2O is well above many other non-CO2 gases; hence, their destruction may provide more long-term benefits than for other non-CO2 gases.
6.6.4 Avoidance of perverse incentives
A key lesson learned from the implementation of in-dustrial gas projects under the CDM is that perverse incentives can occur when plant operators make si-
16 ForadiscussionofthisissueinthecontextoftheEUETS,seeHermannetal.(2010).

35gnificant profits with the GHG abatement, i.e. when the carbon market revenues significantly exceed the GHG abatement costs and impact the cost of pro-duction. Perverse incentives can take different forms:
Plant operators could have incentives to increase the GHG formation rate beyond levels that would otherwise occur, or to maintain the current GHG formation rate while they would have incentives to reduce the rate in the absence of the carbon market revenues;
Plant operators could have incentives to expand the production of the main product – HCFC-22, adipic acid or nitric acid – beyond levels that would otherwise occur, or maintain the current production levels while they would be reduced in the absence of the carbon market revenues. This could have different effects: Production could be shifted from plants that
already abate HFC-23 or N2O emissions without carbon market revenues to plants that benefit from carbon market revenues;
Production could be shifted from plants in countries with a mitigation pledge (e.g. Annex B Parties to the Kyoto Protocol) to countries wi-thout a mitigation pledge;
Production could be shifted from plants that have a lower GHG formation rate to plants that benefit from carbon market revenues;
The plant operation could be prolonged beyond the time that it would otherwise operate, there-by avoiding the construction of new plants with potentially lower GHG formation rates, or lea-ding to an earlier closure of newer plants with potentially lower GHG formation rates;
The production of the main product – HCFC-22, adipic acid or nitric acid – could become less costly due to the carbon market revenues and might replace products or practices that are less GHG intensive;
The main product could be produced without market demand, and potentially be vented to the atmosphere, if the carbon market revenues exceed the production costs.
Perverse incentives can undermine mitigation efforts and lead to lower emission reductions. They can also impact the competitiveness of HCFC-22, adipic acid and nitric acid producers, which can lead to market distortions with economic impacts that policy ma-kers intend to avoid. Perverse incentives are most-ly relevant for HCFC-22 and adipic acid production, where carbon market revenues could potentially exceed production costs. They are of less concern for nitric acid production where carbon market reve-nues have a much lower impact on production costs. New HCFC-22 and adipic installations are not eligi-
ble for crediting under the CDM, inter alia due to the methodological challenges to addressing perverse incentives.
Recent revisions to CDM methodologies effectively prevent several forms of such perverse incentives. However, avoiding some forms of perverse incen-tives remains challenging, in particular if carbon market revenues can impact the competitiveness of the installations. A particular challenge is that car-bon market revenues depend on the price which can significantly change over time. In times of low mar-ket prices, a given baseline emission factor may be set with the intention of providing sufficient incen-tives for abatement while avoiding perverse incen-tives due to large profits. However, when the price climbs, perverse incentives could arise, and when it falls, carbon market revenues may not be sufficient to uphold GHG abatement. For this reason, it seems difficult to fully avoid perverse incentives through methodological approaches when production costs and profits significantly depend on carbon market prices. Even if current CER prices levels are low and do not raise concerns with regard to perverse incen-tives, we believe it is important to bear potential per-verse incentives in mind when designing policies to ensure continued GHG abatement.
Based on these considerations, perverse incentives are relevant for the domestic use of credits and inter-national or bilateral purchase of credits from HFC-23 and adipic acid projects, when credits are purchased based on market prices. In contrast, when credit pri-ces reflect technical abatement costs, transaction costs, and an incentive for the plant operators, but that do not lead to significant profits, perverse in-centives are unlikely to occur. For nitric acid produc-tion, the purchase of credits based on market prices could be a viable option as the potential revenues from credits are significantly lower compared to the costs of nitric acid production.
When credits are used, the choice of appropriate methodological standards is also important to avoid perverse incentives:
For HFC-23 projects, versions 1 to 5 of the appli-cable CDM methodology AM0001 raise concerns about perverse incentives to increase the HFC-23 generation or HCFC-22 production beyond levels that would occur in the absence of the project acti-vity. Version 6 eliminates perverse incentives with regard to the GHG formation and also uses a more conservative approach to determine the amount of HCFC-22 production eligible for crediting. We recommend that this version be used as the ba-sis for any crediting. However, with high market prices and profits, some perverse incentives may
36 be difficult to address, such as competitive advan-tages for HCFC-22 as compared to alternatives, or potential incentives to delay the phase-out of HCFC-22 under the Montreal Protocol.
For adipic acid projects, the applicable CDM me-thodology AM0021 does not address concerns over production shifts to CDM plants, referred to as carbon leakage (Schneider et al. 2010). Whi-le carbon leakage is very unlikely to occur with current CER prices, higher prices could potential-ly create incentives for such shifts production to plants eligible for domestic use of credits.
For nitric acid projects, version 2.0 of the CDM methodology ACM0019 for nitric acid projects eli-minates potential perverse incentives not to use innovative technologies that lower the N2O forma-tion in the production of nitric acid (UNFCCC 2012, UNFCCC 2013).
For the option of including installations in domestic ETSs, the rules for allocation of allowances are key to avoiding perverse incentives. Allowances can be al-located for free or be auctioned. If allowances are al-located for free, different allocation principles could be used, such as grand-fathering (i.e. based on histo-rical emissions) or benchmarking (i.e. based on the performance of the peers). For the three assessed project types, emission benchmarks could be suita-ble since the products are rather homogenous and the emissions correlate with the production level. Emission benchmarks for allocation of allowances establish a level playing field among the installations and avoid market distortions between the installa-tions included within the ETS.
However, the level of the emissions benchmarks would be important to avoid production shifts to or from installations outside the ETS. If emission bench-marks are set at high levels, plant operators could ge-nerate large profits from selling excess allowances. These profits could distort international competition and lead to production shifts from plants which are outside the ETS and which already abate GHG emis-sions or are located in a country with a GHG reduc-tion target, to plants included in the ETS. This holds in particular for HCFC-22 and adipic acid production where the technical abatement costs are significant-ly lower than the allowance market prices expected in the ETS. It is therefore important to set emission benchmarks at a sufficiently ambitious level to en-sure that such effects are avoided. Another suitable option could be no free allocation of allowances, gi-ven the low technical abatement costs for the three project types. This option would fully avoid perverse incentives to shift production from non-ETS to ETS installations; however, with very high market prices
it would need to be assessed whether it poses risks for production shifts from ETS installations to non-ETS installation in other countries due to competi-tive advantages.
Finally, perverse incentives are not relevant in the case of regulations. The same holds for international and bilateral funding which is usually based on the GHG abatement costs and does not involve large profits.
6.6.5 Ability to address sector-wide emissions
Some policy options could address GHG emissions from all plants in the sector, including existing and greenfield plants, while others are limited to some plant types. In CDM countries, options involving cre-dit use are currently limited to HCFC-22 plants that started operation before 2003 and adipic acid plants that started operation before 2005. Newer plants are not eligible under the CDM. As highlighted in the previous section, it would be methodologically very difficult to develop approaches that both provi-de incentives to plant operators to pursue the GHG abatement and fully avoid perverse incentives. All other options could address GHG emissions from all plants, including plants constructed in the future.
6.6.6 Incentives for abatement
All three project types – but in particular HCFC-22 and adipic acid projects – have very low GHG aba-tement costs, compared to other GHG abatement opportunities. Abating these emissions is therefore generally cost-effective. However, the five policy op-tions could differ with regard to the incentives that they provide to fully use these abatement opportu-nities.
Experiences with voluntary agreements and regula-tions in industrialized countries show that regulati-ons can lead to lower abatement levels than market-based approaches. A case study on N2O abatement from adipic acid production through CDM and JI projects showed that the rate of abatement is si-gnificantly higher with incentives from the carbon market than achieved through voluntary action or regulations (Schneider et al. 2010). Similarly, the aba-tement levels achieved from HFC-23 projects and nitric acid projects under the CDM are significantly higher than the emission levels achieved in some in-dustrialized countries where the industry voluntary reduces such emissions or where regulations are in place (see section 3).
If installations are exposed to a carbon market price, they may have incentives to abate GHG emissions to

37a larger extent, as long as the GHG abatement co-sts are below the carbon market price. This can, for example, be achieved through appropriate manage-ment measures, such as the temporary storage of HFC-23 in tanks during phases of high HFC-23 ge-neration or down-times of the HFC-23 incinerator, or through additional investments, such as the in-stallation of a second GHG abatement unit that was undertaken in JI projects in Germany. In contrast, regulations usually prescribe a certain emission rate or emission level and thus do not provide incentives to the plant operators to exceed the required level. Carbon market mechanisms could thus be more ef-fective when it comes to providing incentives to aba-te emissions to the extent that this is cost-effective. This holds in particular for project types where costs can vary considerably among projects, depending on the circumstances of the installations, as is the case for N2O abatement from nitric acid production. This advantage of a market mechanism may not be exploited when the credit prices reflect technical abatement costs, transaction costs, and an incentive for the plant operators. For the same reason, this ad-vantage may also not be fully exploited in the case of international funding; however, approaches for results-based funding could provide some incen-tives for a large abatement level.
Overall, this aspect should not be overrated. Even under regulations, usually most emissions are aba-ted. This aspect may be more important in a long-term perspective of a strongly carbon constraint world when using all cost-effective GHG abatement opportunities becomes more important.
6.6.7 Transaction costs
The transaction costs of the policy options are diffi-cult to assess, as they depend considerably on the design of the policies. Regulations generally have relatively low transaction costs for adoption and enforcement, whereas market-based approaches may require more regulatory oversight and private sector transaction costs, including the approval and third-party auditing of projects or allocation of allowances, quantification and verification of emis-sion reductions or emissions, operation of registry systems, and managing the trading of credits or al-lowances. Some domestic policies, such as the use of CERs to meet tax obligations, may not require si-gnificant costs as existing infrastructure, such as the CDM and domestic tax collection structures, could be used. International funding involves transaction costs for implementing agencies that process the al-location of funding.
6.7 Combinations of options
Some of the policy options discussed in the previous sections can be combined. In particular, combina-tions could be considered between options invol-ving international support (international or bilateral purchase of credits or funding of abatement) and options involving action by the host country (regula-tions by the host country, inclusion in domestic ETSs, domestic use of credits).
International funding could be offered as a transitio-nal measure contingent to establishing a long-term solution to addressing GHG emissions, such as regu-lations by the host country or inclusion in a domestic ETS. Combining international support with domestic action has the advantage that developing countries are supported in reducing GHG emissions after the crash of the CDM market and that GHG emissions are addressed in the long term. Often, the adoption and implementation of national actions requires time and resources. For industrial gas projects, internatio-nal support would, in the meantime, ensure that the abatement of GHG emissions is not stopped.
Under the Multilateral Fund for the Implementation of the Montreal Protocol (MLF) the funding of the phase-out of HCFCs has been linked to efforts to ma-nage HFC-23 emissions. In April 2013, the Executive Committee of the MLF endorsed a HFCF production sector phase-out management plan in China (Ex-Com 2013). The decision establishes as a condition to the funding that “China agrees to coordinate with its stakeholders and authorities to make best efforts to manage HCFC production and associated by-product production in HCFC plants in accordance with best practices to minimize associated climate impacts”. This language indicates that HFC-23 might be abated in the future; indeed, China is considering different policy options to abate HFC-23 emissions but no option has yet been implemented.
A transitional approach was also followed in the EU. In the period from 2008 to 2012, many adipic and ni-tric acid plants implemented JI projects to abate N2O emissions. From 2013, adipic and nitric acid instal-lations were included in all countries in the EU ETS, with a few countries using an earlier opt-in.

38
The three industrial gas project types assessed – HFC-23, adipic acid, and nitric acid – offer a large mitigation potential at a very low cost. Over the period of 2013 to 2030, we estimate that about 7.5 Gt CO2e could be abated in developing countries, Russia, and Ukraine, at an average cost of 0.47 EUR / tCO2e. In 2020, the total GHG abatement potential amounts to about 0.4 Gt CO2e and could thus con-tribute about 3-5% of the mitigation gap of 8-12 Gt CO2e, which is deemed necessary in addition to cur-rent pledges to be on track towards meeting the 2 degree target (UNEP 2013a). Already implemented HFC-23 and adipic acid projects have very low mar-ginal technical abatement costs below 0.10 EUR / t CO2e and make up 0.16 Gt CO2e – a third of the ove-rall GHG abatement potential.
Despite the low technical abatement costs, industrial gas projects are at risk of stopping or have stopped GHG abatement, as they have few or no revenues other than CERs or ERUs. Leaving emissions from industrial gas projects unabated would be very da-maging for efforts to mitigate climate, since other – more costly – GHG abatement measures would need to be implemented to achieve emission levels con-sistent with the 2 degree target, thereby increasing the global costs of mitigation. Addressing HFC-23 and N2O emissions of the chemical industry is thus an urgent matter and offers an opportunity for clo-sing the pre-2020 mitigation gap and contributing ambitious mitigation in a future climate regime.With regard to the five policy options assessed in this study – regulations by the host country, inclusion in domestic ETSs, domestic use of credits, international or bilateral purchase of credits, and international or bilateral funding of abatement – we recommend to the following:
Implementing a long-term solution that addresses sector-wide emissions
For industrial gas projects it is particularly important to implement a solution that will ensure GHG aba-tement in the long term and that addresses sector-wide emissions from all installations, for several re-asons:
Firstly, in contrast to many other GHG abatement measures, such as renewable energy or energy ef-ficiency, industrial gas projects have no significant revenues or cost savings other than carbon market revenues. In the absence of policies that require or incentivize GHG abatement, the most economic-ally attractive course of action for plant operators
is to stop GHG abatement. Technically, GHG aba-tement can be easily stopped and resumed again. Continued GHG abatement is therefore only en-sured, as long as policies are in place that require or incentivize GHG abatement. Temporary incen-tives through funding or credit purchase would not ensure GHG abatement in the long term.
Secondly, demand for adipic acid, nitric acid and HCFC-22 for feedstock applications is growing steadily, and so are the related GHG emissions. Policy approaches should therefore also address emissions from new installations.
And thirdly, while technological innovations can reduce the by-product rate, it seems unlikely that a technology emerges that would fully avoid the formation of HFC-23 or N2O.
These particular features of industrial gas projects call for the adoption of policy options that ensu-re GHG abatement in the long term, including for plants that will be built and commissioned in the future. We therefore recommend that temporary options – international or bilateral purchase of cre-dits, and international or bilateral funding – are not considered as stand-alone options but be combined with long-term policy options, such as regulations by the host country, inclusion in domestic ETSs, and, depending on the design and project type, the do-mestic use of credits.
Avoiding perverse incentives
A key lesson learned from the implementation of industrial gas projects under the CDM is that per-verse incentives could undermine mitigation efforts and lead to market distortions. Recent revisions to CDM methodologies effectively prevent some forms of such perverse incentives. However, avoiding per-verse incentives remains a major challenge in some situations, in particular if revenues from selling cre-dits or allowances significantly exceed GHG aba-tement and transaction costs and may impact the competitiveness of the installations. This holds for HCFC-22 and adipic acid installations where credit revenues could significantly reduce or even exceed production costs.
For these installations, we recommend considering only policy options that fully avoid such perverse incentives. This holds for regulations by the host country and international or bilateral funding. For the option of inclusion in domestic ETSs, avoiding
7 Conclusions and recommendations

39perverse incentives would require a careful design of the ETS rules. Free allocation of allowances ba-sed on historic levels of unabated emissions could result in perverse incentives and undermine abate-ment efforts. HCFC-22 and adipic acid plants that were implemented under the CDM or included in the EU ETS have had very low remaining emissions. Purchasing emission allowances for any remaining emissions would constitute a very minor cost factor for these facilities. Given the very low technical aba-tement costs and the risks for perverse incentives, we recommend not allocating allowances for free to HCFC-22 and adipic acid installations. Alternatively, emission benchmarks could be set at emission levels that are commonly achieved with catalytic reduction or thermal decomposition. We further recommend not considering the international, bilateral or dome-stic purchase of credits based on market prices for these projects. Crediting should only be considered based on prices that reflect technical abatement co-sts, transaction costs, and an incentive for the plant operators. For this reason, we further recommend that for these project types the use of credits be li-mited to dedicated purchase programmes with re-spective pricing mechanisms, and that credits from these project types not be allowed for compliance in ETSs or other market-oriented mechanisms. Finally, we recommend that only credits based on the latest methodology versions approved under the CDM be used.
Prioritizing continued GHG abatement in already implemented CDM projects
From an economic perspective, ensuring continued GHG abatement in already implemented CDM pro-jects should be prioritized over abatement in new projects. These projects have very low technical abatement costs. It would be economically ineffici-ent to invest in new abatement projects, while GHG abatement is stopped in already implemented pro-jects which have low operational expenditures but no incentives to continue GHG abatement.
Using synergies with the Montreal Protocol
We recommend using synergies with the Montreal Protocol. Channelling any international funding for HFC-23 abatement through the Multilateral Fund (MLF) of the Montreal Protocol could offer important advantages. An amendment of the Montreal Proto-col to address HFC emissions could ensure that HFC-23 emissions are abated in the long-term. Funding would be based on incremental costs and thereby avoid any perverse incentives. Another advantage is that the phase-out of HCFC-22 and the abatement of HFC-23 would be implemented and agreed un-
der the same international process. This would allow synergies to be used and efforts to be effectively coordinated. The HCFC-22 producers would receive funding for HCFC-22 phase-down and HFC-23 aba-tement through the same implementing agency. HFC-23 incineration capacities in existing CDM that are decommissioned as part of the HCFC-22 phase-out might be used to abate HFC-23 from newer faci-lities without HFC-23 incineration equipment.
Regulations or ETS can best address emissions in the long-term
Among the policy options, regulations and inclusi-on of the installations in ETSs seem best suited to address GHG emissions in the long term. Regulati-ons by the host country is a simple option that is re-latively easy to implement, does not create perverse incentives, provides for net emission reductions, addresses sector-wide emissions, and has relatively low transaction costs. The implementation of regula-tions could be financially supported, either through domestic sources, such as the „China CDM fund“, or through international or bilateral support.
The inclusion of the installations in ETSs could be a viable alternative for more advanced developing countries that are establishing ETSs. The two non-Annex I countries in an advanced stage of introdu-cing ETSs – China and South Korea – make up about 80% of the 2020 GHG abatement potential from HCFC-22, adipic acid and nitric acid production in developing countries, Russia and China. However, a careful design of ETS rules is key to actually achieving the envisaged reductions: the ETS cap would need to be ambitious enough to provide a sufficient price signal; in order to achieve net emission reductions, the absolute ETS cap should not be adjusted due to the inclusion of HCFC-22, adipic acid or nitric acid installations; and allowances would need to be fully auctioned or be allocated based on benchmarks set at levels that avoid perverse incentives. The option of inclusion in domestic ETSs may therefore pose more implementation challenges than regulations by the host country. An advantage of ETSs is that they may provide stronger incentives for abatement than regulations.
Domestic policies to purchase credits could possibly be a third alternative under certain conditions. First of all, such policies would need to credit demand in the long term. Temporary programs to purchase cre-dits would not constitute a long-term solution. Ho-wever, long-term credit demand usually arises from market based approaches, such as the use of credits to meet tax obligations. In these cases, the prices for credits would be based on supply and demand, and could thus significantly exceed GHG abatement

40 costs, potentially creating perverse incentives in the case of HFC-23 and adipic acid projects. Crediting is also methodologically challenging for new HCFC-22 and adipic acid installations. This option would thus not address sector-wide emissions. We therefore re-commend considering this option only for N2O aba-tement from nitric acid production.
International or bilateral support
We recommend that industrialized countries sup-port the GHG abatement from industrial gas pro-jects. For more advanced developing countries we recommend that international or bilateral support is embedded in a strategy to reduce GHG emissions in the long-term. We recommend that international support is contingent on the implementation of one of the long-term solutions: regulations by the host country, inclusion in domestic ETSs or, for nitric acid installations, or domestic purchase of credits. The time frame for implementing a long-term solution and providing temporary support could vary among more advanced economies and less developed countries. Technical and financial support could also be provided to host countries in the development and implementation of national policies to abate GHG emissions in the long-term.
Different solutions for the three project types
We recommend considering different policy options for the three project types, reflecting their specific characteristics (see Table 7):
For HFC-23 from HCFC-22 production we recom-mend regulating emissions under the Montreal Protocol and providing financial support through
the Multilateral Fund (MLF) for GHG abatement in new facilities that have not yet installed GHG aba-tement technologies.
For N2O abatement from adipic acid production we recommend regulations by the host country or inclusion in ETSs to address GHG emissions in the long-term. All adipic acid plants are in located in industrialized countries or more advanced de-veloping countries (Brazil, China, South Korea). In-ternational or bilateral support could be provided temporarily through results-based funding ap-proaches using the latest versions of CDM metho-dologies for quantifying and verifying emission reductions. Any such funding should be based on the technical abatement costs, transaction costs, and an incentive for the plant operators. For exi-sting CDM projects, it could occur through issuan-ce and cancellation of CERs; alternatively, emission reductions could be verified by DOEs without pro-ceeding to issuance, in order to reduce transaction costs.
For N2O abatement from nitric acid production we recommend for more advanced developing coun-tries regulations by the host country or inclusion in ETSs to address GHG emissions in the long-term. The CDM and JI could be an effective means for providing international or bilateral support of GHG abatement, through the purchase and pos-sibly voluntary cancellation of CERs or ERUs. Such purchases could occur through a dedicated win-dow for CDM and JI project types that are at risk of stopping GHG abatement, similar to a recent ten-der launched by Norway. Alternatively, internatio-nal or bilateral support could be provided through results-based funding approaches.
Table 7: Information on technical abatement costs for HFC-23 from HCFC-22 production
HFC-23 from HCFC-22 production
N2O from adipic acid production
N2O from nitric acid production
Domestic implementation of a phase-out of HFCs under the Montreal Protocol
Advanced developing countries: Regulations by the host country or inclusion in ETSs
Advanced developing countries: Regulations by the host country or inclusion in ETSsOther developing countries: None
Funding through the Multilateral Fund (MLF) for facilities that have not yet in-stalled GHG abatement technologies
Results-based funding
Purchase and possibly voluntary cancellation of CERs or ERUsResults-based funding
Domestic policies to address International or bilateral support emissions in the long-term

41
Bernstein, L., J. Roy, K. C. Delhotal, J. Harnisch, R. Mats-uhashi, L. Price, K. Tanaka, E. Worrell, F. Yamba, Z. Fengqi, 2007, Industry. In: Climate Change 2007: Mitigation. Contri-bution of Working Group III to the Fourth Assessment Re-port of the Intergovernmental Panel on Climate Change [B. Metz, O.R. Davidson, P.R. Bosch, R. Dave, L.A. Meyer (eds)], Cambridge University Press, Cambridge, United Kingdom and New York, NY, USA.
Debor S., Schmidt V., von Velsen-Zerweck M., 2010, N2O emissions from nitric acid plants in CDM and JI projects, Nitrogen+Syngas 307, September - October 2010.
Ecofys, Fraunhofer Institute for Systems and Innovation Re-search, Öko-Institut, 2009, Methodology for the free alloca-tion of emission allowances in the EU ETS post 2012, Sector report for the chemical industry, By order of the European Commission, Study Contract: 07.0307/2008/515770/ETU/C2, Ecofys project Number: PECSNL082164, November 2009
Environmental Investigation Agency (EIA), 2013, Two Billi-on Tonne Climate Bomb: How to Defuse the HFC-23 Pro-blem, June 2013
European Commission (EC), 2003, Integrated Pollution Pre-vention and Control (IPPC). Reference Document on Best Available Techniques in the Large Volume Organic Chemi-cal Industry. Integrated Pollution Prevention and Control (IPPC). February 2003, last retrieved 1 December 2013 from http://eippcb.jrc.ec.europa.eu/reference/lvoc.html
Executive Committee of the Multilateral Fund for the Im-plementation of the Montreal Protocol (ExCom), 2013, Re-port of the sixty-ninth meeting of the Executive Commit-tee, paragraph 137, Montreal, 15-19 April 2013
Gillenwater, M. & Seres, S., 2011, The Clean Development Mechanism: a review of the first international offset pro-
gramme. Greenhouse Gas Measurement and Manage-ment, 1(3–4), pp.179–203.
Harnisch, J., Hendriks, C., 2000, Economic Evaluation of Emission Reductions of HFCs, PFCs and SF6 in Europe, Spe-cial Report, Contribution to the study “Economic Evaluati-on of Sectoral Emission Reduction Objectives for Climate Change” on behalf of the Commission of the European Uni-on Directorate General Environment, Ecofys Energy and Environment, Cologne, Germany, April 25, 2000
Hermann, H., Herold, A., Graichen, J., Busche, J., 2010, Cap adjustments in the EU-ETS according to Article 9a of the EU-ETS Directive. ETC/ACC Technical Paper, last retrived 15 April 2014 from http://acm.eionet.europa.eu/docs/ET-CACC_TP_2010_2_cap_adjustments_EU-ETS.pdf
Intergovernmental Panel on Climate Change (IPCC) / Tech-nology and Economic Assessment Panel (TEAP), 2005, Safeguarding the Ozone Layer and the Global Climate Sy-stem: Special Report of the Intergovernmental Panel on Climate Change, Cambridge, Cambridge University Press
Intergovernmental Panel on Climate Change (IPCC), 2006, 2006 IPCC Guidelines for National Greenhouse Gas Inven-tories, Prepared by the National Greenhouse Gas Invento-ries Programme, Eggleston H.S., Buendia L., Miwa K., Ngara T. and Tanabe K. (eds). Published: IGES, Japan.
Intergovernmental Panel on Climate Change (IPCC), 2013, Climate Change 2013: The Physical Science Basis. Contribu-tion of Working Group I to the Fifth Assessment Report of the Intergovern- mental Panel on Climate Change [Stocker, T.F., D. Qin, G.-K. Plattner, M. Tignor, S.K. Allen, J. Boschung, A. Nauels, Y. Xia, V. Bex and P.M. Midgley (eds.)]. Cambridge University Press, Cambridge, United Kingdom and New York, NY, USA, 1535 pp.
Irving, W.N., Branscombe, M., 2002, HFC-23 emissions from
References
We would like to thank for helpful input and feed-back we received from Silke Karcher and Thomas Forth (German Federal Ministry for the Environment, Nature Conservation, Building and Nuclear Safe-ty), Robin McDonald (PCI Nylon), Michael Lazarus (Stockholm Environment Institute), Mark Roberts
(EIA), Carsten Warnecke (Ecofys), Niko Gutknecht-Stoehr and Marten von Velsen-Zerweck (N.Serve), Vladyslav Zhezherin, and several others. We would also like to thank the UNFCCC secretariat for making data on CDM projects available and Tochukwu Aku-nyili for supporting further data collection.
Acknowledgements
In conclusion, abating GHG emissions from HCFC-22, adipic acid and nitric acid production offers a large potential at very low cost. Several CDM plants alrea-dy stopped GHG abatement and others may follow. We believe that both host countries and the interna-tional community have a responsibility for ensuring
continued GHG abatement in stranded CDM and JI projects and to take actions to abate GHG emissi-ons in newer facilities. Several policy options are at hands. We recommend combining a long-term solu-tion implemented by the host country with interna-tional or bilateral support.

42 HCFC-22 production, in: Background Papers – IPCC Expert Meetings on Good Practice Guidance and Uncertainty Ma-nagement in National Greenhouse Gas Inventories, IPCC/OECD/IEA Programme on National Greenhouse Gas Inven-tories, Institute for Global Environmental Strategies (IGES), Hayama, Kanagawa, Japan, 271–283.
Keller, C.A., Brunner, D., Henne, S., Vollmer, M.K., O’Doherty, S., Reimann, S., 2011, Evidence for under‐reported we-stern European emissions of the potent greenhouse gas HFC‐23, Geophysical Research Letters, Vol. 38, L15808, doi:10.1029/2011GL047976, 2011
Kollmuss, A., Lazarus, M., 2010, Industrial N2O Projects Un-der the CDM. The Case of Nitric Acid Production. Stock-holm Environment Institute Working Paper WP-US-1007, Stockholm Enironment Institute - U.S. Centre, Seattle, USA, November 2010
Lazarus, M., Erickson, P., Schneider, L., 2013, Potential for In-ternational Offsets to Provide a Net Decrease of GHG Emis-sions, SEI Working Paper 2013-06, Stockholm Environment Institute – U.S. Centre, Seattle, USA, September 2013
McCulloch, A., Lindley, A.A., 2007, Global emissions of HFC‐23 estimated to year 2015, Atmos. Environ., 41, 1560–1566, doi:10.1016/j.atmosenv.2006.02.021
Miller, B.R., Kuijpers, L.J.M., 2011, Projecting future HFC-23 emissions, Atmos. Chem. Phys., 11, 13259–13267, Supple-ment, p.5, Figure S1.
NSERVE, 2014, Data on costs of nitric acid CDM projects. Personal communication on 17 January 2014
PCI Nylon, 2013, Projections of adipic acid production in China, Brazil and South Korea, communicated by Robin MacDonald, 11 December 2013.
Pérez-Ramirez J., Kapteijn F., Schöffel K., Moulijn A. J., 2003, Formation and control of N2O in nitric acid production. Where do we stand today? Applied Catalysis B: Environ-mental 44 (2003) 117–151
Prag, A., Hood, C. and Barata, P. M., 2013, Made to Measu-re: Options for Emissions Accounting under the UNFCCC. OECD/IEA Climate Change Expert Group Paper No. 2013(1). Organisation for Economic Co-operation and Develop-ment and International Energy Agency, Paris. http://dx.doi.org/10.1787/5jzbb2tp8ptg-en.
Roberts, M.W., 2013, EIA comments and affidavit signed, submitted by M.W. Roberts to the Verified Carbon Stan-dard (VCS) as a public comment in relation to the propo-sed VCS methodology „Destruction of Fluoroform (HFC-23) Waste Gas Streams“, last retrieved on 16 March 2014 from http://www.v-c-s.org/methodologies/destruction-fluoro-form-hfc-23-waste-gas-streams
Schneider, L., 2011, Perverse incentives under the Clean Development Mechanism (CDM): an evaluation of HFC-23 destruction projects. Climate Policy, 11, 851–864
Schneider, L., Kollmuss, A., Lazarus, M., 2014, Addressing the risk of double counting emission reductions under the UNFCCC, SEI Working paper 2014-02, Seattle, April 2014
Spalding-Fecher, R., Achanta Narayan, A., Erickson, P., Ha-ites, E., Lazarus, M., Pahuja, N., 2012, Assessing the Impact of the Clean Development Mechanism. Report commissi-oned by the high-level panel on the CDM Policy Dialogue. CDM Policy Dialogue. Available online at http://www.cdm-policydialogue.org/research/1030_impact.pdf.
Technology and Economic Assessment Panel (TEAP) under the Montreal Protocol on Substances that Deplete the Ozo-ne Layer and Intergovernmental Panel on Climate Change (IPCC), 2005, Safeguarding the Ozone Layer and the Global Climate System: Issues Related to Hydrofluorocarbons and Perfluorocarbons, Cambridge University Press, UK.
United Nations Environment Programme (UNEP), 2013a, The Emissions Gap Report 2013, A UNEP Synthesis Report, ISBN: 978-92-807-3353-2
United Nations Environment Programme (UNEP), 2013b, Report of the sixty-ninth meeting of the Executive Com-mittee, Executive Committee of the Multilateral Fund for the Implementation of the Montreal Protocol, Sixty-ninth Meeting, UNEP/OzL.Pro/ExCom/69/40, Montreal, 15-19 April 2013
United Nations Environment Programme RISOE (UNEP-RISOE), 2014, UNEP Risoe CDM/JI Pipeline Analysis and Da-tabase, March 1st 2014
United Nations Framework Convention on Climate Change (UNFCCC), 2005, Issues Arising from the Implementation of Potential Project Activities under the Clean Development Mechanism: The Case of Incineration of HFC-23 Waste Streams, Technical Paper FCCC/TP/2005/1, 26 April 2005.
United Nations Framework Convention on Climate Change (UNFCCC), 2012, Information note on AM0028: Catalytic N2O destruction in the tail gas of Nitric Acid or Caprolactam production plants and AM0034: Catalytic reduction of N2O inside the ammonia burner of nitric acid plants, Meeting report of the 58th meeting of the Methodologies Panel of the CDM Executive Board, Annex 17, Bonn, 5 November 2012
United Nations Framework Convention on Climate Change (UNFCCC), 2013, Information note on nitric acid methodo-logies, Meeting report of the 59th meeting of the Metho-dologies Panel of the CDM Executive Board, Annex 4, Bonn, 9 May 2013
United States Environment Protection Agency (USEPA), 2006, Global Mitigation of Non-CO2 Greenhouse Gases, Of-fice of Atmospheric Programs (6207J), EPA 430-R-06-005, Washington DC, June 2006
United States Environment Protection Agency (USEPA), 2013a, Benefits of Addressing HFCs under the Montreal Protocol, Stratospheric Protection Division Office of At-mospheric Programs Office of Air and Radiation, Washing-ton DC, June 2013
United States Environment Protection Agency (USEPA), 2013b, Global Mitigation of Non-CO2 Greenhouse Gases: 2010-2030, Office of Atmospheric Programs (6207J), EPA-430-R-13-011, Washington DC, September 2013
Warnecke, C., Klein, N., Perroy, L., Tippmann, R., 2013, CDM Market Support Study. Ecofys, Climatekos, 10 May 2013
Wartmann, S., Hofman, Y., de Jager, D., 2006, Instrumenta-tion of HFC-23 Emission Reduction from the Production of HCFC-22, Assessment of options for New Installations, Final Report by Ecofys for the Dutch National Research Pro-gramme on Global Change, Scientific assessments and po-licy analyses, NRP-CC-WAB, 15 May 2006, The Netherlands.
World Bank, 2010, 10 Years of Experience in Carbon Fi-nance. Insights from working with the Kyoto mechanisms, Washington, D. C.: World Bank. Available at: http://sitere-sources.worldbank.org/INTCARBONFINANCE/Resources/Carbon_Fund_12-1-09_web.pdf.

43
HFC-23 from HCFC-22 production
Table 7 provides an overview of information availa-ble from the literature costs for destruction of HFC-23 from HCFC-22. Project design documents from CDM and JI projects do not include information on technical abatement costs.
Appendix 1: Information on technical abatement costs
Table 8: Information on technical abatement costs for HFC-23 from HCFC-22 production
The main costs are capital expenditures associated with the installation of an incineration unit and rela-ted equipment, such as storage tanks, pipes and mo-nitoring equipment. In addition to the information in Table 7, one project developer reports that invest-ment costs in China typically vary between about 2 and 5 million EUR, depending on the technology provider. Based on the available data, we assume ca-pital expenditures of 4 million EUR in the middle ran-ge scenario and 2 and 6 million EUR in the lower and upper range scenarios respectively. Operational ex-penditures mainly include maintenance and energy costs, some costs for staff operating the plant, and possibly costs for waste treatment. HF diluted in wa-ter can be recovered from the incineration process and can in some countries be sold, which generates revenues that could partially compensate the ope-rational expenditures. Based on the available data
and the typical amounts of electricity and steam re-quired, as reported under CDM projects, we estimate the annual operational expenditures at EUR 400,000 per year, and EUR 200,000 in the lower range scena-rio, and EUR 600,000 in the upper range scenario.
The size of HCFC-22 plants varies considerably, with emission reductions ranging from about 1 to 14 Mt CO2e / yr. We assume a plant with emissions of 6 Mt CO2e / yr in the middle range scenario and plants with emissions of 1 and 14 Mt CO2e / yr in the upper and lower end scenarios respectively. As illustrated in Table 4 on page 34, these assumptions result in total technical abatement costs of 0.23 EUR / t CO2e (with a range of 0.05 to 2.03 EUR / t CO2e) and mar-ginal technical abatement costs of 0.07 EUR / t CO2e (with a range of 0.01 to 0.60 EUR / t CO2e).
4th IPCC assessment report 0.20 - 0.35 USD / t CO2e(Bernstein et al. 2007, page 466) IPCC/TEAP (2005) CAPEX: USD 2 - 8 million OPEX: USD 189,000 - 350,000 / yr Below 0.20 USD / t CO2e Harnisch and Hendriks (2000) CAPEX: EUR 3 million Destruction of about OPEX: EUR 200,000 / yr 200 t HFC-23 per year
UNFCCC (2005) 0.34 - 0.51 USD / t CO2e
USEPA (2013b) CAPEX: Thermal oxidation New plants: USD 3,700,000 Existing plants: USD 4,800,000 OPEX: USD 119,000 / yr
Wartmann et al. (2006) 0.20 - 0.60 USD / t CO2e
Source Technical abatement costs Additional information
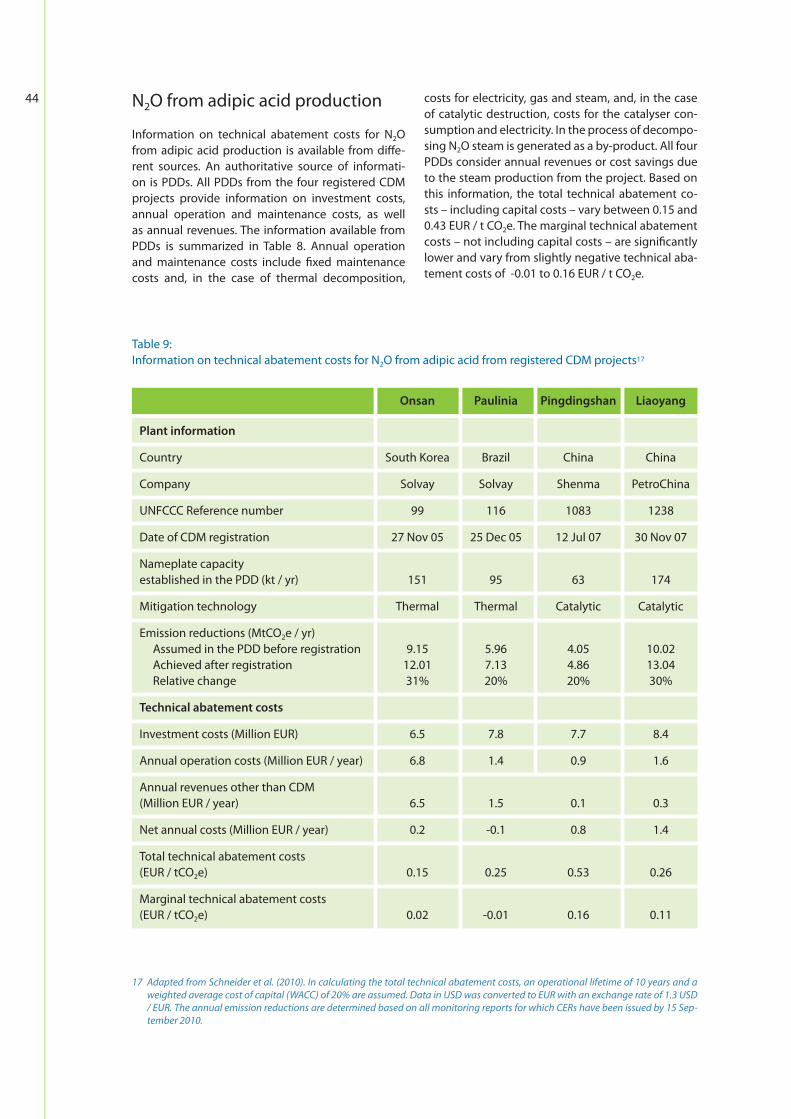
44 N2O from adipic acid production
Information on technical abatement costs for N2O from adipic acid production is available from diffe-rent sources. An authoritative source of informati-on is PDDs. All PDDs from the four registered CDM projects provide information on investment costs, annual operation and maintenance costs, as well as annual revenues. The information available from PDDs is summarized in Table 8. Annual operation and maintenance costs include fixed maintenance costs and, in the case of thermal decomposition,
costs for electricity, gas and steam, and, in the case of catalytic destruction, costs for the catalyser con-sumption and electricity. In the process of decompo-sing N2O steam is generated as a by-product. All four PDDs consider annual revenues or cost savings due to the steam production from the project. Based on this information, the total technical abatement co-sts – including capital costs – vary between 0.15 and 0.43 EUR / t CO2e. The marginal technical abatement costs – not including capital costs – are significantly lower and vary from slightly negative technical aba-tement costs of -0.01 to 0.16 EUR / t CO2e.
Plant information
Country South Korea Brazil China China
Company Solvay Solvay Shenma PetroChina
UNFCCC Reference number 99 116 1083 1238
Date of CDM registration 27 Nov 05 25 Dec 05 12 Jul 07 30 Nov 07
Nameplate capacity established in the PDD (kt / yr) 151 95 63 174
Mitigation technology Thermal Thermal Catalytic Catalytic
Emission reductions (MtCO2e / yr) Assumed in the PDD before registration 9.15 5.96 4.05 10.02 Achieved after registration 12.01 7.13 4.86 13.04 Relative change 31% 20% 20% 30%
Technical abatement costs
Investment costs (Million EUR) 6.5 7.8 7.7 8.4
Annual operation costs (Million EUR / year) 6.8 1.4 0.9 1.6
Annual revenues other than CDM (Million EUR / year) 6.5 1.5 0.1 0.3
Net annual costs (Million EUR / year) 0.2 -0.1 0.8 1.4
Total technical abatement costs (EUR / tCO2e) 0.15 0.25 0.53 0.26
Marginal technical abatement costs (EUR / tCO2e) 0.02 -0.01 0.16 0.11
Onsan Paulinia Pingdingshan Liaoyang
Table 9: Information on technical abatement costs for N2O from adipic acid from registered CDM projects17
17 AdaptedfromSchneideretal.(2010).Incalculatingthetotaltechnicalabatementcosts,anoperationallifetimeof10yearsandaweightedaveragecostofcapital(WACC)of20%areassumed.DatainUSDwasconvertedtoEURwithanexchangerateof1.3USD/EUR.TheannualemissionreductionsaredeterminedbasedonallmonitoringreportsforwhichCERshavebeenissuedby15Sep-tember2010.
45The JI projects provide less detailed cost information in their PDDs. Generally, the technical abatement co-sts are significantly higher for the JI projects because they only increase the rate of abatement, from about 90% of N2O abatement prior to the implementation of the JI project, to a level of 97-100% after project implementation; the additional emission reductions are thus considerably lower than for CDM projects, while the costs are similar or even larger than for CDM projects. The PDD of the BASF plant in Ger-many refers to investment costs of 13.4 million EUR. The value of the steam generated is estimated to be around 100,000 EUR per year and covers a maximum of 5% of the annual costs of the catalytic decomposi-tion facility. Based on this information, the total and marginal technical abatement costs would amount to about EUR 2.29 and EUR 0.85 per t CO2e, respec-tively. The PDD of the Lanxess plant in Germany re-fers to investment costs of some 10 million EUR and quotes the value of the steam to be about 30% of the operational costs for thermal decomposition but does not specify these operational costs. The PDD of the plant operated by Solvay in France refers to investment costs of 13.9 million EUR but does not specify annual operation and maintenance costs and revenues.
The information in PDDs broadly concurs with infor-mation from other sources. Based on data from 1995 for a German plant, the „Best Available Techniques reference document (BREF)“ developed under an EU directive estimates total technical abatement costs at 0.10 to 0.20 EUR / t CO2e (EC 2003). The USEPA re-fers to investment costs for thermal destruction at USD 11.4 million and operation and maintenance costs at USD 2.2 million (USEPA 2013b).
Based on this information, we assume capital expen-ditures of EUR 9 million in the middle range scenario and EUR 6 and 14 million for the lower and upper range respectively. We estimate net annual costs (the OPEX minus revenues and cost savings) with EUR 500,000 per year in the middle range scena-rio, EUR 2 million in the upper range scenario and no cost in the lower range scenario. For the annual emission reductions we reflect the range of actual-ly observed emission reductions from the four CDM plants, adjusted for the GWP of 298 used in this stu-dy. The average annual emission reductions of the
four plants is 9 Mt CO2e / yr which is used for the middle range scenario. For the lower and upper ran-ge scenarios we use 13 and 4.5 Mt CO2e / yr respec-tively. As illustrated in Table 4 on page 34, these as-sumptions result in total technical abatement costs of 0.29 EUR / tCO2e (with a range of 0.11 to 1.19 EUR / tCO2e) and marginal technical abatement costs of 0.06 EUR / tCO2e (with a range of 0.00 to 0.44 EUR / tCO2e). For the purpose of estimating the total costs of financing continued GHG abatement from imple-mented projects, we consider the specific marginal abatement costs and N2O abatement potential for each of the four CDM plants (see Table 8), given that this data is available for each project.
N2O from nitric acid production
Data on technical abatement costs for N2O from ni-tric acid production is available in the literature, from PDDs and project developers. The technical abate-ment costs depend considerably on the abatement technology applied. We consider the two main tech-nologies implemented in CDM and JI projects: se-condary abatement and tertiary abatement through selective catalytic reduction or decomposition. Ter-tiary abatement involves considerable initial capital expenditures and an exchange of the catalyst after several years. Secondary abatement has significant-ly lower costs both in terms of capital expenditures and continued costs for replacement of the secon-dary catalyst.
Table 9 summarizes the available information on technical abatement costs. Alongside the literature, information in the PDDs of CDM and JI projects was evaluated; in total, 21 PDDs included cost informa-tion; none of the 52 JI projects provided sufficient information to derive technical abatement costs.18 For some CDM projects only limited information is available. In such cases, assumptions were made to calculate total and marginal technical abatement co-sts. The project developer N.Serve provided detailed cost information for six projects (NSERVE 2014). The range of values derived from PDDs and data from NSERVE is also included in Table 9.
18 WeonlyconsiderPDDsthatprovidecompletecostdataforthespecificproject;wedonotconsiderPDDsthatrefertoothersourcesoronlyprovidesomecosts(e.g.onlyCAPEX).Incaseswhereonlytotalcostsareprovidedweassumeforsecondaryabatementthat90%ofthetotalcostsareOPEXandfortertiaryabatementthat80%ofthetotalcostsareCAPEX(includingareplacementofthecatalystaftersomeyears).WeestimatetotalandmarginaltechnicalabatementcostsforallprojectsandindicatetherangeofCAPEXandOPEXforthoseprojectswhichexplicitlyprovidedsuchinformation.Wheredataisavailable,weconsidertheactualperformanceoftheprojects.OtherwiseweadjusttheexpectedemissionreductionsinthePDDbyafactorof0.88whichreflectstheweightedaverage„issuancesuccess“byallnitricacidprojectsthat issuedCERsasofJanuary2014,calculatedbasedon informationfromUNEP-RISOE(2014).

46 Table 10: Information on technical abatement costs for N2O from nitric acid production
19CalculatedbasedontheaverageN2Oformationof8.85kg/tnitricacidandaverageabate-mentlevelof75%observedonaverageinimplementedCDMplants(Deboretal.2010)andaGWPof298.
Source Technical abatement costs Additional information
4th IPCC assessment report (Bernstein et al. 2007, page 466)
Ecofys (2009), based on information from the Euro-pean Fertilizer Manufactu-rers Association
CDM Project Design Docu-ments (PDDs)
NSERVE (2014)
UNFCCC (2013)
USEPA (2013b)
2.0 - 5.8USD / t CO2e
1.5 - 2 EUR / t nitric acid≈ 0.76 - 1.52 EUR / t CO2e19
5 EUR / t of nitric acid≈ 2.53 EUR / t CO2e19
CAPEX: EUR 0.13 - 0.54 million OPEX: EUR 0.79 - 0.23 million
Total abatement costs:Average: 1.04 EUR / t CO2eRange: 0.31 - 9.84 EUR / t CO2e
Marginal abatement costs:Average: 0.81 EUR / t CO2eRange: 0.26 - 7.77 EUR / t CO2e
Total costs: 17.8 million EUR
CAPEX: EUR 0.22 - 0.25 millionOPEX: EUR 0.10 - 0.27 million
CAPEX: EUR 3.6 millionOPEX for 5 years without catalyst replace-ment: EUR 0.15 million / yrOPEX for 10 years with catalyst replace-ment: EUR 0.38 million / yr
0.8 - 1.5USD / t CO2e
CAPEX: USD 1,300,000OPEX: USD 400,000 / yr
CAPEX: USD 2,300,000OPEX: USD 200,000 / yr
CAPEX: USD 4,000,000OPEX: USD 2,100,000 / yr
Secondary abatement
Tertiary abatement
Secondary abatement
Based on four plants for CAPEX / OPEX and 20 plants for total and margi-nal abatement costs
Tertiary abatementBased on one plant
Secondary abatementBased on four plants
Tertiary abatementAverage costs per produc-tion line based on four production lines from two plants
Based on information in-cluded in PDDs and direct consultation with project developers
Secondary abatement
Tertiary abatement (direct catalytic decomposition)
Tertiary abatement (Non-selective catalytic reduction)

47For secondary abatement, we estimate technical abatement costs per nitric acid production line. Ba-sed on the available data, we assume capital expen-ditures of EUR 220,000 in the middle range scenario, and EUR 110,000 and EUR 540,000 in the lower and upper range scenario respectively. We estimate ope-rational expenditures, including the lease or regular replacement of the catalyst, at EUR 180,000 per year in the middle range scenario, and EUR 80,000 and EUR 380,000 per year in the lower and upper range scenario respectively. The capacity of the production lines is a key factor impacting technical abatement costs; the production capacity of CDM and JI pro-duction lines varies greatly from 55 to 1100 tonnes of nitric acid per day. We assume a (weighted) ave-rage plant size of 450 tonnes of nitric acid per day in the middle range scenario, and a production ca-pacity of 100 and 900 tonnes of nitric acid per day in the upper and lower range scenarios respectively. In all three scenarios, we assume an average plant uti-lization of 85%, as reported in PDDs, and an average GHG formation of 8.92 kg N2O per tonne of nitric acid and an abatement level of 70%, based on Debor et al. (2010). Based on these assumptions, the total technical abatement costs are estimated at 0.89 EUR / t CO2e in the middle scenario, with a range of 0.20 to 8.81 EUR / t CO2e in the lower and upper scenarios respectively; marginal technical abatement costs are estimated at 0.69 EUR / t CO2e in the middle scena-rio, with a range of 0.15 to 6.08 EUR / t CO2e in the lower and upper scenarios respectively (see Table 4 on page 25).
For tertiary abatement, fewer cost estimates are available and costs vary more strongly between plants. Moreover, estimating marginal technical aba-tement costs is challenging because they depend on the time frame considered. Every couple of years, a major investment is required to exchange the cata-lyst. To reflect this aspect, we determine both short-term and long-term marginal technical abatement costs (see Table 4 on page 34). Short-term marginal abatement costs reflect the situation that the current catalyst can continue to be used. Long-term margi-nal abatement costs reflect that the catalyst needs to be exchanged every couple of years. For the purpose of estimating the total costs of financing continued GHG abatement from implemented projects in sec-tion 5.3 below, we use the long-term marginal tech-nical abatement costs for tertiary abatement plants.Based on the available data, we estimate the capital expenditure for tertiary abatement per abatement unit with EUR 3.5 million in the middle range scena-rio, and EUR 2 million and EUR 5 million in the lower and upper range scenarios. We estimate the short-term operational expenditure with EUR 300,000 per year in the middle range scenario, and EUR 200,000 and EUR 400,000 in the lower and upper range sce-
narios. For the long-term operational expenditures we assume one catalyst exchange over the time fra-me of ten years considered in this study. We estimate this one-time cost at EUR 3 million in the middle ran-ge scenario, and EUR 2 million and EUR 4 million in the lower and upper range scenarios respectively.
With regard to the project size, tertiary abatement is, on average, applied to slightly larger nitric produc-tion lines than secondary abatement. In few cases, one abatement unit is used for the tail gas from seve-ral production lines together; however, this is not al-ways possible and we do not consider this option as a conservative assumption. Based on data from CDM and JI plants, we consider a production capacity of 500 t nitric acid per day in the middle range scenario and 200 and 1200 t nitric acid per day in the upper and lower range scenarios respectively. In all three scenarios, we assume an average plant utilization of 85%, as reported in PDDs, and an average GHG for-mation of 8.98 kg N2O per tonne of nitric acid and an abatement level of 86%, based on Debor et al. (2010).
For new nitric acid projects, projects can implement either secondary or tertiary abatement. In the cur-rent CDM and JI portfolio, 69% of the CDM capacity uses secondary and 31% tertiary abatement, and 79% of the JI capacity in Ukraine and Russia uses se-condary and 21% tertiary abatement. We use these shares in estimating the GHG abatement and trans-action costs from new CDM and JI projects. We also consider that many nitric acid projects have never been implemented. We assume that all projects that have not yet issued CERs or ERUs as of January 2014 have not been implemented. This holds true for all JI projects in Russian and the Ukraine and for 48 CDM projects.
Based on these assumptions, the total technical aba-tement costs are estimated at 3.18 EUR / t CO2e in the middle scenario, with a range of 0.79 to 11.15 EUR / t CO2e in the lower and upper scenarios respectively; the short-term marginal technical abatement costs are estimated at 0.84 EUR / t CO2e in the middle sce-nario, with a range of 0.23 to 2.80 EUR / t CO2e, and the long-term marginal technical abatement costs are estimated at 1.68 EUR / t CO2e in the middle sce-nario, with a range of 0.47 to 5.60 EUR / t CO2e (see Table 4 on page 25).

Geschäftsstelle FreiburgPostfach 1771D-79017 FreiburgMerzhauser Straße 173D-79100 FreiburgTel.: +49 761 45295-0Fax: +49 761 45295-288
Büro DarmstadtRheinstraße 95D-64295 DarmstadtTel.: +49 6151 8191-0Fax: +49 6151 8191-133
Büro BerlinSchicklerstraße 5-7D-10179 BerlinTel.: +49 30 405085-0Fax: +49 30 405085-388
ww
w.o
eko.
de