Embed Size (px)
Citation preview
Option Pricing Model – Group Project
Presented by: Case Study presented to:
Farazi Ahmed – 213827340 Dr. Yisong S. Tian
Mathieu Fortier – 213849039 [email protected]
Daniel Monroy-210919199 Options, Futures and Other Derivative Securities
FINE 6800
Schulich
School of Business
March 4th, 2015
Table of Contents
Product – CIBC Structured Notes (Autocallable Return on Capital Notes) ....................................................................... 1
Payoff of CIBC Structured Notes ....................................................................................................................................... 1
Autocallable feature ........................................................................................................................................................ 1
Barrier Condition ............................................................................................................................................................ 1
Principal Repayment feature ........................................................................................................................................... 1
Early Trading Charge ...................................................................................................................................................... 1
Attractive features to Investors ....................................................................................................................................... 2
Unattractive features to Investors.................................................................................................................................... 2
CIBC Autocallable ROC Notes Assumptions..................................................................................................................... 3
Option Valuation on December 1st 2014 ......................................................................................................................... 3
Option Valuation on January 30th 2015 .......................................................................................................................... 5
Monte Carlo Simulation ...................................................................................................................................................... 6
Payoff Structure .............................................................................................................................................................. 6
Monte Carlo Simulation .................................................................................................................................................. 7
Valuation vs. Notes Actual Price ........................................................................................................................................ 8
Structured Note potential for Canadian Investors ............................................................................................................... 9
Other Structured Products ............................................................................................................................................. 10
Recommendations ............................................................................................................................................................. 11
Reference .......................................................................................................................................................................... 11
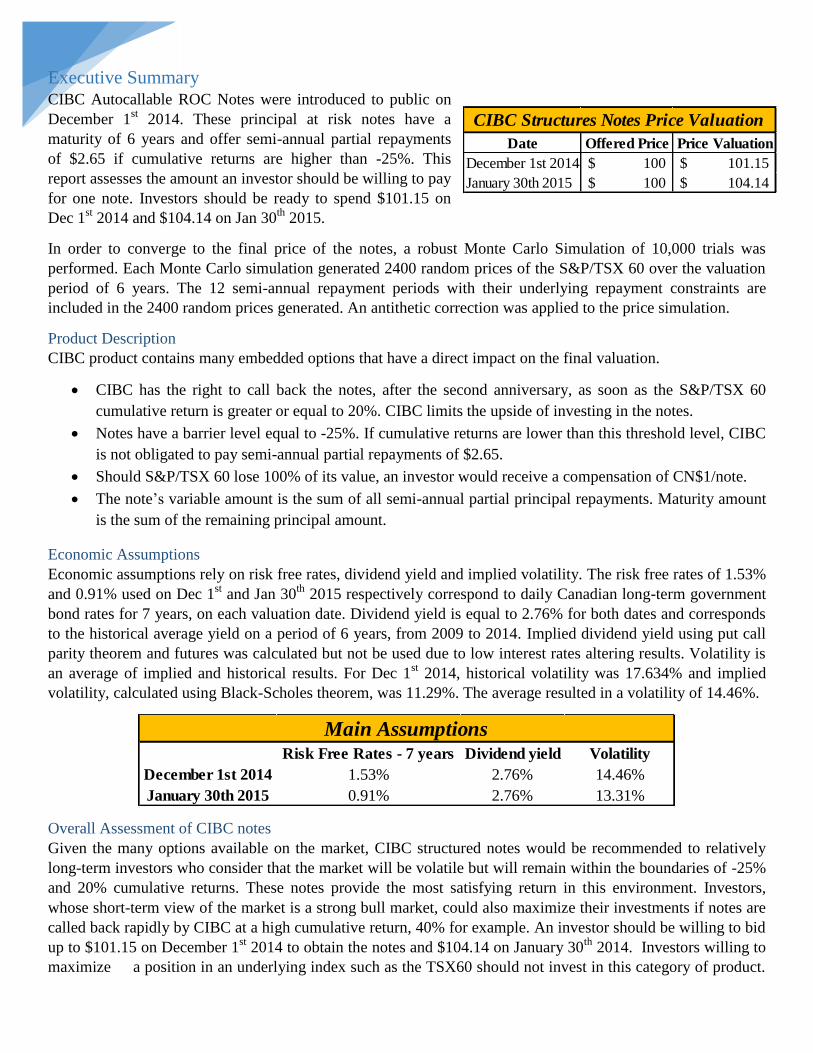
Date Offered Price Price Valuation
December 1st 2014 100$ 101.15$
January 30th 2015 100$ 104.14$
CIBC Structures Notes Price Valuation
Executive Summary CIBC Autocallable ROC Notes were introduced to public on
December 1st 2014. These principal at risk notes have a
maturity of 6 years and offer semi-annual partial repayments
of $2.65 if cumulative returns are higher than -25%. This
report assesses the amount an investor should be willing to pay
for one note. Investors should be ready to spend $101.15 on
Dec 1st 2014 and $104.14 on Jan 30
th 2015.
In order to converge to the final price of the notes, a robust Monte Carlo Simulation of 10,000 trials was
performed. Each Monte Carlo simulation generated 2400 random prices of the S&P/TSX 60 over the valuation
period of 6 years. The 12 semi-annual repayment periods with their underlying repayment constraints are
included in the 2400 random prices generated. An antithetic correction was applied to the price simulation.
Product Description
CIBC product contains many embedded options that have a direct impact on the final valuation.
CIBC has the right to call back the notes, after the second anniversary, as soon as the S&P/TSX 60
cumulative return is greater or equal to 20%. CIBC limits the upside of investing in the notes.
Notes have a barrier level equal to -25%. If cumulative returns are lower than this threshold level, CIBC
is not obligated to pay semi-annual partial repayments of $2.65.
Should S&P/TSX 60 lose 100% of its value, an investor would receive a compensation of CN$1/note.
The note’s variable amount is the sum of all semi-annual partial principal repayments. Maturity amount
is the sum of the remaining principal amount.
Economic Assumptions
Economic assumptions rely on risk free rates, dividend yield and implied volatility. The risk free rates of 1.53%
and 0.91% used on Dec 1st and Jan 30
th 2015 respectively correspond to daily Canadian long-term government
bond rates for 7 years, on each valuation date. Dividend yield is equal to 2.76% for both dates and corresponds
to the historical average yield on a period of 6 years, from 2009 to 2014. Implied dividend yield using put call
parity theorem and futures was calculated but not be used due to low interest rates altering results. Volatility is
an average of implied and historical results. For Dec 1st 2014, historical volatility was 17.634% and implied
volatility, calculated using Black-Scholes theorem, was 11.29%. The average resulted in a volatility of 14.46%.
Overall Assessment of CIBC notes
Given the many options available on the market, CIBC structured notes would be recommended to relatively
long-term investors who consider that the market will be volatile but will remain within the boundaries of -25%
and 20% cumulative returns. These notes provide the most satisfying return in this environment. Investors,
whose short-term view of the market is a strong bull market, could also maximize their investments if notes are
called back rapidly by CIBC at a high cumulative return, 40% for example. An investor should be willing to bid
up to $101.15 on December 1st 2014 to obtain the notes and $104.14 on January 30
th 2014. Investors willing to
maximize a position in an underlying index such as the TSX60 should not invest in this category of product.
Risk Free Rates - 7 years Dividend yield Volatility
December 1st 2014 1.53% 2.76% 14.46%
January 30th 2015 0.91% 2.76% 13.31%
Main Assumptions
Page | 1
0.00%
0.50%
1.00%
1.50%
2.00%
2.50%
3.00%
3.50%
4.00%
1
14
27
40
53
66
79
92
10
5
11
8
13
1
14
4
15
7
17
0
18
3
19
6
20
9
22
2
23
5
24
8
26
1
27
4
28
7
30
0
31
3
32
6
Pen
alt
y F
ees
Number of Days from Issue Date
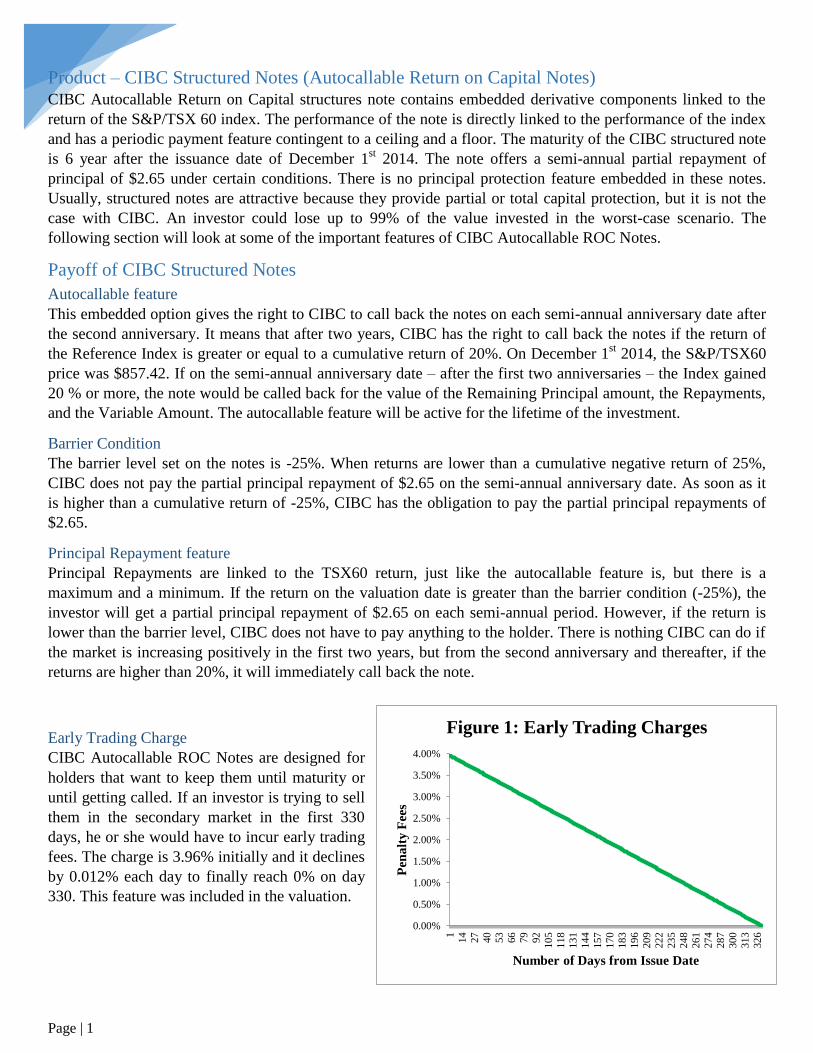
Figure 1: Early Trading Charges
Product – CIBC Structured Notes (Autocallable Return on Capital Notes) CIBC Autocallable Return on Capital structures note contains embedded derivative components linked to the
return of the S&P/TSX 60 index. The performance of the note is directly linked to the performance of the index
and has a periodic payment feature contingent to a ceiling and a floor. The maturity of the CIBC structured note
is 6 year after the issuance date of December 1st 2014. The note offers a semi-annual partial repayment of
principal of $2.65 under certain conditions. There is no principal protection feature embedded in these notes.
Usually, structured notes are attractive because they provide partial or total capital protection, but it is not the
case with CIBC. An investor could lose up to 99% of the value invested in the worst-case scenario. The
following section will look at some of the important features of CIBC Autocallable ROC Notes.
Payoff of CIBC Structured Notes
Autocallable feature
This embedded option gives the right to CIBC to call back the notes on each semi-annual anniversary date after
the second anniversary. It means that after two years, CIBC has the right to call back the notes if the return of
the Reference Index is greater or equal to a cumulative return of 20%. On December 1st 2014, the S&P/TSX60
price was $857.42. If on the semi-annual anniversary date – after the first two anniversaries – the Index gained
20 % or more, the note would be called back for the value of the Remaining Principal amount, the Repayments,
and the Variable Amount. The autocallable feature will be active for the lifetime of the investment.
Barrier Condition
The barrier level set on the notes is -25%. When returns are lower than a cumulative negative return of 25%,
CIBC does not pay the partial principal repayment of $2.65 on the semi-annual anniversary date. As soon as it
is higher than a cumulative return of -25%, CIBC has the obligation to pay the partial principal repayments of
$2.65.
Principal Repayment feature
Principal Repayments are linked to the TSX60 return, just like the autocallable feature is, but there is a
maximum and a minimum. If the return on the valuation date is greater than the barrier condition (-25%), the
investor will get a partial principal repayment of $2.65 on each semi-annual period. However, if the return is
lower than the barrier level, CIBC does not have to pay anything to the holder. There is nothing CIBC can do if
the market is increasing positively in the first two years, but from the second anniversary and thereafter, if the
returns are higher than 20%, it will immediately call back the note.
Early Trading Charge
CIBC Autocallable ROC Notes are designed for
holders that want to keep them until maturity or
until getting called. If an investor is trying to sell
them in the secondary market in the first 330
days, he or she would have to incur early trading
fees. The charge is 3.96% initially and it declines
by 0.012% each day to finally reach 0% on day
330. This feature was included in the valuation.

Page | 2
Attractive features to Investors
After examining all the important features of this structured note, one can observe that the type of investment
features presented are more suitable for investors who believe the market will be relatively stable from 2014 to
2020. By examining S&P/TSX 60 performance since 2004, an investment in a note like this one would have –
except during the financial crisis – always been called before maturity. For example, over a 6-year period, a
cumulative return of 20% represents only an annualized return of 3.08%. It does not take a huge amount of
yearly positive returns for the notes to be callable, especially during a strong bull market.
For the investor, the notes provide downside-protection. Capital repayment is only at risk when the TSX60
falls below 25% of the initial value. Losses are only visible once this threshold has been hit. By directly
investing in the TSX60, an investor would lose 25% of value on his initial investment. By investing in this
structured note, he would still have a right to a semi-annual partial payment of $2.65 even if the market is doing
poorly. Returns are thus protected against a fall of 25% in the market; an investment in the TSX60 itself would
not provide this protection. The note reflects the risk/return relationship that the investor is willing to take.
Another benefit of this note is that it can be held as capital property and in this case, the return on growth of
the note is subject to capital gains tax and not personal income taxes. Only 50% of capital gains are taxable, but
if the gains are recorded as personal income, then the tax burden becomes a lot heavier, since personal income
taxes take the whole amount into account at the appropriate tax bracket level.
Unattractive features to Investors
One of the most attractive features of a structured product is the protection of some or all the original principal
investment, since it lowers the risk an investor takes drastically. However, CIBC notes do not offer capital
protection, with the exception of a minimum payment of $1 if the market returns are consistently under -25%
and ends up losing 100% of the initial value. Inherent risk can be as high as if an investor was directly investing
in S&P/TSX 60.
Variable AmountPeriods (Semi-
Annual)Effect
Reference Index Return ≥ Barrier Level (-25%) Partial Principal Repayments 2.65$ 1 - 12
Reference Index Return < Barrier Level (-25%) Partial Principal Repayments -$ 1 - 12
2Σ Partial Principal Repayments = Maximum of
CN$2.65 per period * 6 years * 2 times semi-annual
compounded frequency per year
Partial Principal Repayments 31.80$ Σ 1 - 12 Maximum Amount
3 Principal Amount - Σ Partial Principal Repayments Remaining Principal Amount 68.20$ Σ 1 - 12 Minimum Amount
4 Reference Index Return ≥ Call Limit (+20%) Remaining Principal Amount Call Price 4 - 11Call Price on Call
Date t (t < T)
5Reference Index Return < Barrier Level (-25%) on
FINAL Valuation DateMaturity Amount ≥ $ 1
Maturity or Call or
Last Repayment
Period
Σ Payments <
Original Principal
Amount
Reference Index Return ≥ Barrier Level (-25%) on
FINAL Valuation Date
Variable Amount = Σ Partial
Principal Repayments + Amount
($100) X10% of
Maximum (Ref. Index
Return - 20%,0)
Maturity or Call or
Last Repayment
Period
Reference Index Return < Barrier Level (-25%) on
FINAL Valuation Date
Variable Amount = Σ Partial
Principal Repayments + Amount
100 X Reference Index
Return
Maturity or Call or
Last Repayment
Period
0% > Reference Index Return > Barrier Level (-25%)
on FINAL Valuation Date
Variable Amount = Σ Partial
Principal Repayments + Amount($100 X $0)
Maturity or Call or
Last Repayment
Period
7 Early Selling of Notes: Penalty Fees Net Selling Amount
Remaining Principal
Amount X (1-Penalty
Fees%)
Issue Date to 330
days forward
3.96% -> Day 0
0.00% -> Day 330
8 Principal Amount - Selling Concession Fees Proceeds to CIBC 97.35$ Issue Date $2.50 to Dealers;
$0.15 to Desjardins
1
6
Table No. 1: Constraints with the Payoff of the CIBC Notes
Constraints
Page | 3
Lack of liquidity is a major issue investors need to consider when investing in a structured product. In this
case, a lot of factors lead one to ascertain the belief that the secondary market for CIBC Autocallable Notes is
illiquid. Notes are not listed in any securities exchange and the volume is low, only 150,000 notes are in
circulation. CIBC is the only provider of a daily secondary market, but claims in the note prospectus that it is
not obligated to do so.
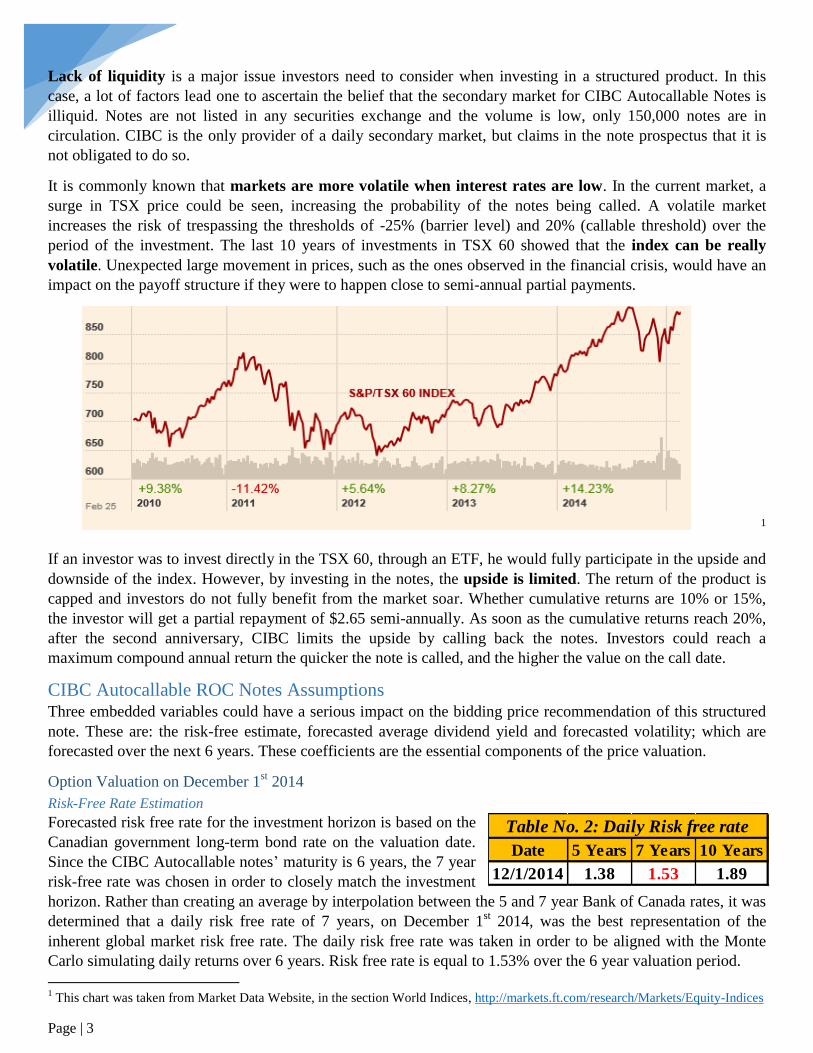
It is commonly known that markets are more volatile when interest rates are low. In the current market, a
surge in TSX price could be seen, increasing the probability of the notes being called. A volatile market
increases the risk of trespassing the thresholds of -25% (barrier level) and 20% (callable threshold) over the
period of the investment. The last 10 years of investments in TSX 60 showed that the index can be really
volatile. Unexpected large movement in prices, such as the ones observed in the financial crisis, would have an
impact on the payoff structure if they were to happen close to semi-annual partial payments.
1
If an investor was to invest directly in the TSX 60, through an ETF, he would fully participate in the upside and
downside of the index. However, by investing in the notes, the upside is limited. The return of the product is
capped and investors do not fully benefit from the market soar. Whether cumulative returns are 10% or 15%,
the investor will get a partial repayment of $2.65 semi-annually. As soon as the cumulative returns reach 20%,
after the second anniversary, CIBC limits the upside by calling back the notes. Investors could reach a
maximum compound annual return the quicker the note is called, and the higher the value on the call date.
CIBC Autocallable ROC Notes Assumptions Three embedded variables could have a serious impact on the bidding price recommendation of this structured
note. These are: the risk-free estimate, forecasted average dividend yield and forecasted volatility; which are
forecasted over the next 6 years. These coefficients are the essential components of the price valuation.
Option Valuation on December 1st 2014
Risk-Free Rate Estimation
Forecasted risk free rate for the investment horizon is based on the
Canadian government long-term bond rate on the valuation date.
Since the CIBC Autocallable notes’ maturity is 6 years, the 7 year
risk-free rate was chosen in order to closely match the investment
horizon. Rather than creating an average by interpolation between the 5 and 7 year Bank of Canada rates, it was
determined that a daily risk free rate of 7 years, on December 1st 2014, was the best representation of the
inherent global market risk free rate. The daily risk free rate was taken in order to be aligned with the Monte
Carlo simulating daily returns over 6 years. Risk free rate is equal to 1.53% over the 6 year valuation period.
1 This chart was taken from Market Data Website, in the section World Indices, http://markets.ft.com/research/Markets/Equity-Indices
Date 5 Years 7 Years 10 Years
12/1/2014 1.38 1.53 1.89
Table No. 2: Daily Risk free rate

Page | 4
2014 2013 2012 2011 2010 20096 year (Dec
2008-Dec 2014)
Daily 0.651% 0.654% 0.777% 1.188% 0.832% 1.728% 1.111%
Annualized 10.330% 10.382% 12.333% 18.860% 13.213% 27.434% 17.634%
Table No. 3: Volatility Table - Return Periods
Dividend Yields Estimation
The dividend yield was at first studied and
estimated using two different methods, historical
and implied. Because the S&P/TSX 60 index is
made up of 60 stocks; and companies within the
index change over time, the dividend yield is never
stable. This statement is confirmed by Figure 2;
dividend yield fluctuates over the past 12 years.
Dividend yield based on historical estimates was
averaged at 2.76%, using the last 6 years of
dividends (from 2009 to 2014). This yield is a good
representation of company’s behavior toward
dividends over an economic cycle, since it includes growth periods and depression such as the financial crisis.
This length of time is close to the structured notes’ life and similar to the period used to estimate risk free rates.
Yield was also estimated with implied dividends on November 28th
2014. To calculate the implied dividend
yield, two methods were used. The easier method to find it is as follows: q = r - (1/T) * ln (F0/S0). The
calculation is simple; the risk-free rate minus 1 over the investment period (for example 1/6) multiplied by the
logarithm of S&P/TSX 60 futures price contract on November 28th
2014 over the actual index price on same
date. On November 28th
, the stock was trading at $863.04 and a future contract was priced at $861.10;
Q = 1.53% - (1/6) * ln ($861.10/ $863.04). The result in an implied dividend yield of 1.568% on November 30th
The second method calculates the implied dividend based on the put call parity theorem. Using this formula, the
investor multiplies 1 over the investment horizon by the logarithm of the price of the call less the price of a put
plus the strike price. Those three factors are then divided by the current stock price. The put and the call need to
have the same maturity and the same strike price. By applying this
formula, a dividend yield of 1.437% was found. The two implied
formulas should end up around a similar number.
A decision to only apply the historical average of the last 6 year dividend yields for valuation was made. The
inadequately low risk-free rate that was used for both calculations above – due to recent economic conditions—
led one to underestimate the implied dividend yield. This is unrepresentative of the index in the last decade.
Therefore the dividend yield used to price the structured notes is 2.76%.
Volatility Estimation
Volatility, just like dividend yields, was estimated using two methods; historical and implied valuation. Several
historical volatilities were calculated. Based on the structured note’s horizon of 6 years, the historical volatility
should represent a similar period of time. Table No. 3 shows the volatility of the TSX 60 in the last 6 years.
Over the last 5 years, the volatility has been stable, except for a high of 18.86% in 2011, and stable between
10.3% and 13.2%. However, this is not representative of a market in a state of crisis. The Canadian economy
has been recovering over the last 5 years. This is also in line with the time assumptions that were taken to
estimate dividend yield and risk-free rate. The historical volatility is equal to 17.634%.
0.00
0.50
1.00
1.50
2.00
2.50
3.00
3.50
4.00
Figure 2: TSX 60 Annual Dividend yields
(%)

Page | 5
Implied Volatility 1 7.06%
Implied Volatility 2 10.64%
Implied Volatility 3 10.86%
Implied Volatility 4 8.09%
Implied Volatility 5 8.28%
Implied Volatility 6 14.64%
Implied Volatility 7 11.76%
Implied Volatility 8 16.01%
Implied Volatility 9 12.49%
Implied Volatility 10 13.04%
Average 11.29%
Table No. 4: Implied Volatility Average TableImplied volatility was calculated using Black-Scholes
model with continuous dividend. The implied volatility was
calculated one day before the investment date, on
November 28th
2014. The goal of it was to test how volatile
the market was at this moment. A stock price of $863.04,
strike price and market price were taken based on the
market quotes. 10 implied volatilities were calculated with
different strike prices, market prices and maturities. Options
that were taken to estimate the volatility were in-the-
money, at-the-money, and out-of-the-money. Some trading
volume was a pre-requisite for all the implied volatilities
calculated. These results were then averaged and an
implied volatility of 11.29% was found on Nov 28th
2014.
To correctly assess a volatility that represents the market over a 6 year period, until Dec. 1st 2020, an average of
historical and implied volatility was taken. CIBC structured Notes were valued on a volatility of 14.462%.
Option Valuation on January 30th
2015
Risk-Free Rate Estimation
Forecasted risk free rate for the investment horizon is based on
Canadian government long-term bond rate on the valuation date of
January 30th
2015. The risk-free rate horizon of 7 years was chosen in
order to closely match the investment horizon of the note. The risk free
rate, as of January 30th
2015, is equal to 0.91%. The difference between Dec 1st, 2014 and Jan 30
th, 2015 is
large for a small period of time; with a difference of over 60 bps in 2 months. This is due to an unexpected
change in interest rates by the Bank of Canada in January 2015, when interest rates were cut from 1% to 0.75%.
Dividend yields Estimation
Same techniques used for the December 1st 2014 valuation were applied here. TSX 60 dividend yields are never
stable throughout the years. The dividend yield based on historical estimates was averaged at 2.76%, using the
last 6 years dividend yields (from 2009 to 2014).
Yield was also estimated using implied dividends. The first method used the following equation: q = r - (1/T) *
ln (F0/S0), where the implied dividends are dependent on current and futures price. On January 29th
2015,
before the valuation date, the stock was trading at $857.34 and futures were priced at $856.60;
Q = 0.91% - (1/6) * ln ($856.60/ $857.86). This gave an implied dividend yield of 0.936%.
The second method calculates the implied dividend based on the put call parity theorem explained previously.
The important data from this calculation is the current stock price, call price, put price and strike price. The put
and the call had the same maturity and the same strike price. By applying this formula, a dividend yield of
0.932% was found. The two formulas, as expected, came up with a similar number.
Historical dividend yield’s average over 6 years was the only applied yield to value CIBC structured notes.
Dividend yield is therefore 2.76%.
Date 5 Years 7 Years 10 Years
1/30/2015 0.61 0.91 1.26
Table No. 5: Daily Risk free rate

Page | 6
Volatility Estimation
Historical and implied methods were used to estimate volatility. For this valuation date, we also believed that
historical volatility should represent a similar time period of 6 years as the investment period of the structured
note. This length of time is representative of a whole economic cycle. It is hard to forecast, but there are
possibilities to see a slowdown in the economy by 2020. The historical volatility is equal to 16.085%.
Implied volatility was calculated using Black-Scholes model
with continuous dividend. The implied volatility was calculated
one day before the investment date, January 29th
2015. An
average of 10 implied volatilities were taken based on
observations with different strike prices, market prices and
maturities. Risk free and dividend yields taken were those
previously explained. This will lead to an estimated implied
volatility of 10.53% on January 29th
2015.
To calculate volatility, over a period of 5 years and 10 months,
until December 1st 2020, an average of historical and implied
volatility was taken. An average is ideal since it takes in account
pas volatility but also the current market situation. CIBC structured was valued based on a volatility of 13.31%.
Monte Carlo Simulation
Payoff Structure
Future index prices of the S&P/TSX 60 are uncertain and move in a log-normal distribution. To forecast prices
on a horizon of 6 years, a Monte Carlo Simulation was implemented to estimate the range of the S&P/TSX 60
prices and to derive the structured notes’ prices. Generated prices follow a generalized Wiener process with
prices log-normally distributed. Monte Carlo Simulation is a strategy to solve for an approximate likelihood of
definite outcomes from a random distribution of variables (future index prices). The note has a 6-year period to
maturity and 2400 paths – a uniform range – that were simulated to get different prices (Δt = 0.0025). The high
number of even periods will reduce the standard error {Std. dev/ √ (n↑)} of the distribution and further
strengthen the estimates towards deriving the price of the note. By having a range of 2400 variables over 6
years, simulating more than daily price change and looking at the difference of each 6 months (semi-annual
payment), the range is more robust than if only 12 semi-annual payoff simulations had been ran over 6 years.
The index returns have been derived on every semi-annual period as the percentage change from the Index
Level on the Issue Date (Index LevelID) to the Index Level on the Valuation Date (Index LevelVD). This
Reference Index Return holds a minimum (barrier) level of -25% and a Call limit of +20%. This estimation was
carried until period 4 (2nd
year anniversary); when the Call feature was on hold. From period 5 to 11, an extra
constraint was implemented rising from a situation where the note can be called prior to maturity if return is
higher than 20%. Any additional return would be turned to null if the note was called at any of the prior periods.
2014 2013 2012 2011 2010 20096 year (Jan 2009 -
Jan 2015)
Daily 0.651% 0.654% 0.777% 1.188% 0.832% 1.728% 1.013%
Annualized 10.330% 10.382% 12.333% 18.860% 13.213% 27.434% 16.085%
Table No. 6: Volatility Table - Return Periods
Implied Volatility 1 14.28%
Implied Volatility 2 14.99%
Implied Volatility 3 8.59%
Implied Volatility 4 12.23%
Implied Volatility 5 9.85%
Implied Volatility 6 8.04%
Implied Volatility 7 9.29%
Implied Volatility 8 8.71%
Implied Volatility 9 6.41%
Implied Volatility 10 12.89%
Average 10.53%
Table no. 7: Implied Volatility Average Table
Page | 7
The partial principal repayment of CN$2.65 per semi-annual period is paid if the index return is over the barrier
level and if the note has not been called by CIBC. In other words, the repayment would take place only when
the index return is inside the range of -25% to +20%. The repayments maximum amount is CN$31.80 over the
duration of the note; the summation of CN$2.65 payments over 12 semi-annual periods. The remaining
principal amount corresponds to the principal amount of CN$100 after the aggregate sum of partial principal
repayments has been deducted. The remaining principal has a floor of CN$68.20 on the final valuation date
given all the partial principal repayments over the period have been successful. These criteria were implemented
in an Excel simulation to set up a range of values when calculating the expected payoffs. The Variable amount
is the sum of the partial principal repayments and may exceed the prepayments if the note is called prior to the
maturity date. The maturity amount, leveling a floor of CN$1, is the sum of the remaining principal amount
with the variable amount.
The price of the note on Dec 1, 2014 has been calculated as the sum of all the present values of the partial
principal repayments and the Maturity Amount. All the payoff amounts have been discounted on a continuously
compounded basis at the risk-free rate of return along with the corresponding payoff period, and from this an
average payoff was generated. Notes prices were estimated based on December 1st 2014 and January 30
th 2015,
with assumptions previously described. The note average price on the 30th
of January is higher due to change in
risk free rate and volatility.
Assumptions:
1) The structured note will be held either until the maturity date or until the call date if the notes are called
by the issuer on any of the specified call dates. Investors would not sell off the notes prior to these dates.
2) The concession fees of selling the note are CN$2.50 to dealers and CN$0.15 to Desjardins for every
structured note of CN$100. It was observed that this expense is to be borne by CIBC and not by the
investors and thus this cost would not be participating in our valuation.
Monte Carlo Simulation
In order to converge to the final price for the structured note, a robust Monte Carlo simulation with 10,000 trials
was performed. Following the formulas previously explained, one set of normal trials and its antithetic variable
price correction was calculated. An average of the two prices was taken to come up with one single changing
cell that could be used for the Monte Carlo simulation. An Excel add-in (MCSim) was used which calculated
10,000 prices by simulating and changing the cell. A bell curve is observed from the simulations from which we
would take the average of the observations, rendering a final price for the note. The same process was used to
calculate the price on January 30th
, 2015.
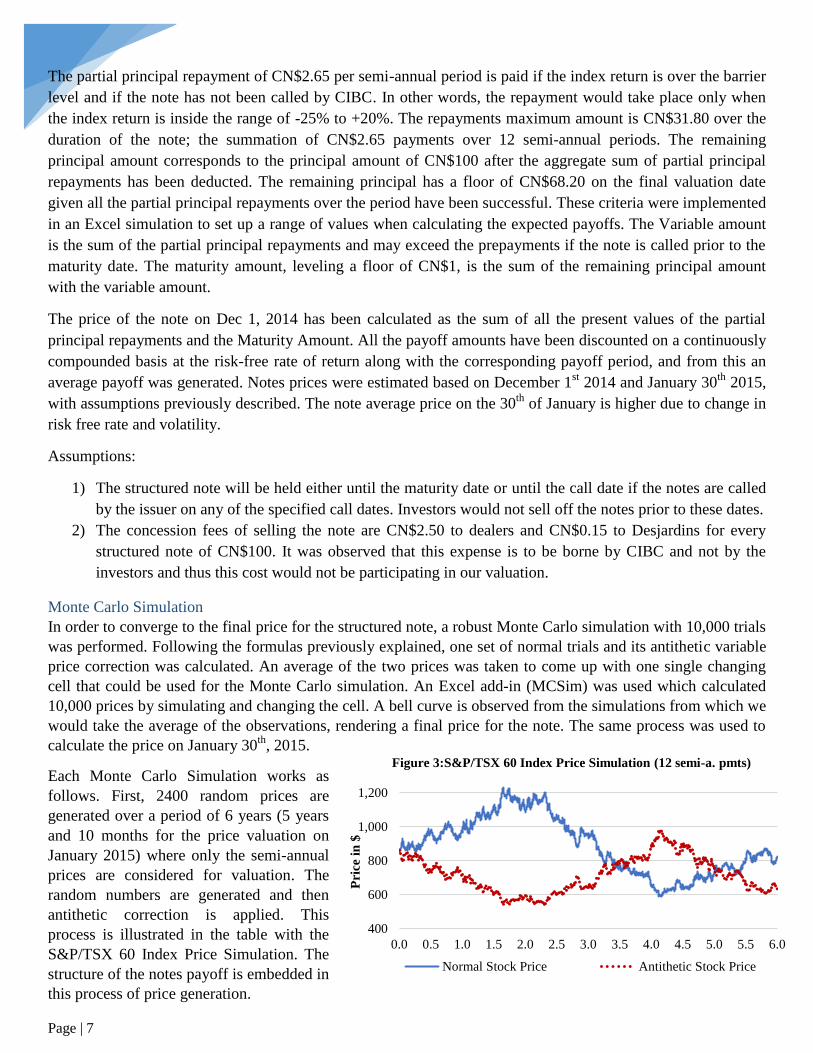
Each Monte Carlo Simulation works as
follows. First, 2400 random prices are
generated over a period of 6 years (5 years
and 10 months for the price valuation on
January 2015) where only the semi-annual
prices are considered for valuation. The
random numbers are generated and then
antithetic correction is applied. This
process is illustrated in the table with the
S&P/TSX 60 Index Price Simulation. The
structure of the notes payoff is embedded in
this process of price generation.
400
600
800
1,000
1,200
0.0 0.5 1.0 1.5 2.0 2.5 3.0 3.5 4.0 4.5 5.0 5.5 6.0
Pri
ce i
n $
Figure 3:S&P/TSX 60 Index Price Simulation (12 semi-a. pmts)
Normal Stock Price Antithetic Stock Price

Page | 8
Second, based on the randomized price and payoff structure, a Monte Carlo Simulation is run 10,000 times. The
large amount of repetitions was used to obtain a precise and robust price estimation.
Results for December 1st 2014 are represented by the
first graph (blue) on the right. It can be seen that results
follow a bell curve distributions except in the end where
the price is capped at $121.50 (the present value of the
highest payment). This is because there is a maximum
amount an investor can receive on average; $131.80.
This amount corresponds to the payment of all
discounted partial repayments of $2.65 plus principal.
Without the upside limitation of the note, a lot of
simulations would have resulted being higher. The
antithetic correction has a strong impact on the results.
We assert that the correction lead a greater portion of the
results to stay within the boundaries set up of -25% (barrier level) and 20% (call level). The minimum amount
obtained of $65.40, could have been a lot worse without the correction. When calculated without the antithetic
correction, the simulation generated much lower prices, but average price was sensibly the same. Following the
10,000 trials, and under our economic assumptions, CIBC structured Autocallable ROC notes should be priced
at $101.15, with a standard deviation of 14%. This is the price an investor should be ready to bid for the notes
on December 1st 2014.
Results for January 30th
2015 were generated the same
way. In this case, we also assert that antithetic correction
lead to retain more results between the set up boundaries.
The price for January is certainly different than it was in
December for obvious reasons. First, the time period is
different; 2 months separate the valuation date and the
notes are valued with 5 years and 10 months left instead
of 6 years. The second reason is the change in interest
rates by the government of Canada. This will lead to a
lower risk free rate used in the model, and a lower
discounting factor. The third and last reason is the average change in volatility. Volatility is calculated based on
implied and historical results. Historical results, based on 6 years, are impacted by the financial crisis in 2008
and 2009. January 30th
2015 estimations have two months less of the impact of the financial crisis than the
December 1st 2014 estimations, and volatility is therefore lower. Following the 10,000 trials, CIBC structured
Autocallable ROC notes should be priced at $104.14, with a standard deviation of 14.38%. This is the price an
investor should be ready to bid for the notes on January 30th
2015 due to economic changes, interest rates, in
January.
Valuation vs. Notes Actual Price CIBC offers these structured notes for a price of $100. The first
historical bids that we can track are from December 19th
2014,
where investors were ready to buy the notes for a price of
$99.15. On January 30th
2015, investors were willing to pay
$100.17 for the notes. For December 1st 2014, this corresponds
to a difference of $2, while it represents a difference of $3.97 on January 30th
2015 with our estimates. Our
valuation are $101.15 and $104.14$ respectively. Differences are not major, but it still represents a great
Date CIBC Price Offering Bid Prices
19-Dec-14 100.00$ 99.15$
30-Jan-15 100.00$ 100.17$
Table No. 8: Historical Bid Prices

Page | 9
discrepancy. The larger difference for January is due to a change in the risk free rate, which is also used as the
payment discount rate.
Many reasons can explain the difference between our valuation and other bidders. One thing that needs to be
pointed out first is the volume of bids. We do not think the bids are influenced by a large volume of investors,
rather by a minority of investors valuing CIBC notes. The volume offered by CIBC of 150,000 notes, is really
small and only represents a market of $15 million. Valuation comparison differences could rely on a difference
between our assumptions and those of only a couple of other investors. Many reasons can explain pricing
differences, with most of them due to differences in assumptions.
1. Risk free rate was taken based on a 7 year forecast, in order to match the investment horizon of the note.
However, other investors could have used other terms for their risk free such as 5 or 10 years. 5 years
rate would have ended up creating higher value due to lower rate, and 10 years would have lowered the
pricing.
2. Dividend yield was averaged based on historical dividend yield over a period of 6 years. Other investors
could have used a different time horizon to estimate historical dividend yields, or could also have used
an average of historical and implied dividend yields, which was not the case for this valuation.
3. We estimated volatility based on an average of historical and implied results. Implied results, if they
have been calculated by other bidders on November 28th
2014 or January 29th
2015, should be similar to
our results since 10 implied simulations were averaged. Implied valuation should be around 11-13% in
all cases. A difference could be explained by the length of time used to estimate historical volatility
Because our simulation is more than robust, with 2400 price randomized at first (including the 12 semi-
annual payments and payoff decisions) and then a Monte Carlo simulation of 10,000 trials ran based on
those randomized prices, differences in price estimation are explained by differences in assumptions such as
risk free rate, dividend yield and volatility.
Structured Note potential for Canadian Investors This structured note is preferable for an investor who does not expect the market to be extremely volatile, either
positively or negatively. Given recent market performance of the S&P/TSX from 2009 – 2015, one can observe
that the market has earned high returns in a consistent manner. If the structured notes were to be issued back in
2009, with the same constraints; then it would have been called back after 2 years, with a return of only 28.4%
as opposed to the market return of 55.86 % at that time – and higher as time moved forward. This note would
prove to be useless in a scenario where there is a strong bull market like the one experienced from 2009 to 2015
if an investor want to hold it until maturity. Similar logic would apply to an extreme bear market, where the
returns are consistently below -25.00%. The investor would end up losing the same amount that the market is
losing. In general, there is some downside protection if the returns fall in the range of +20% and -25 %, but the
biggest burden for the investor is the cap on the upside from the underlying asset. Investors should definitely
weight the power that call feature represents and understand S&P/TSX 60 past performance before investing.
Another example of the performance of this note in a period where the market faced a downturn provides better
insight into how investors could benefit from their involvement with this note. If this note was issued for the
period of 2008-2014 on the S&P/TSX, then the investor would have realized a cumulative return of 58.3% at
the end of the six years, while the market would have lost 1% in the same time frame.
Several different investment vehicles could be used by investors. One option that could be used by investors is
an ETF (like the XIU – S&P/TSX 60) that follows the underlying index. By being traded at a more moderate
price, retail investors have the possibility to invest with more facility and are able to capitalize on the full gains
of a strong bull market, but they also hold the potential downside risk. Other derivatives that are trading on the
underlying index come in various forms and could be more beneficial to different investors, like the plain call

Page | 10
and put options. By mixing and matching these options to their specific requirement and views of the future,
investors can enjoy the creation of a note that is more customized to their needs. Investors could also invest in
ETF that allow the holder to receive periodical dividends.
These structured notes could be compared to an investor buying a bull spread but with the left tail having a
secondary drop in price after falling past a certain level; that is the investor benefits the most when the
performance of the underlying asset stays around the range provided. When the underlying asset underperforms
by more than the lower range, the payoff is negative. But if the performance is above the high range, the note is
called back, limiting the potential upside.
Other Structured Products
There are other structured notes that are offered by the other top Canadian banks. Two notes from RBC and one
from National Bank will be discussed. The RBC Lions S&P/TSX 60 Booster Securities, Series 7, RBC
Principal Protected S&P/TSX 60 Notes, Series 3, and The NBC Recovery Note Securities S&P/TSX 60, Series
2 are some of the comparable structured notes that have the same underlying asset.
RBC Lions S&P/TSX 60 Booster Securities, Series 7
This first 7-year note has the following payment structure; Payment at maturity is based on the performance of
the S&P/TSX 60 Index where the note pays a Booster Amount of 53.55% if the performance of the index is
between 0% and 53.55%. Should the index increase by more than 53.55%, the Notes provide 100%
participation in the Index return. Should the Index decrease, the Note provides 100% participation in the
negative performance. An investor looking to invest in this note would have a very positive view about the
market in the future, due to the booster performance that is offered and the lack of downside protection that
would be unnecessary for an investor expecting a strong bull market. As opposed to the CIBC’s note, this note
does not provide the protection that CIBC provides when market returns are negative by less than 25% and it is
a major drawback of the investment.
RBC Principal Protected S&P/TSX 60 Notes, Series 6
This second 7-year note has the following payoff: Return is linked to the upside price performance of the
S&P/TSX 60, subject to a maximum return of 75% (8.32% per annum). This note promises 100% principal
repayment in case the return of the index is negative. For an investor who is seeking to earn the upside of the
market without any of the downside, this note would be the perfect fit. Even though future gains are limited, the
investor is able to hedge the risk of a potential bear market.
The NBC Recovery Note Securities S&P/TSX 60
The third note is a 2-year note with the following payoff structure: it provides investors with the opportunity to
participate in the short-term growth of the Canadian Market via the S&P/TSX 60 Index (the "Reference Index").
If ever the return of the Reference Index at maturity is nil or negative, then the Note Securities will provide
Holders with their Principal Amount of $100 as long as the closing level of the Reference Index has never
reached -60% of the Initial Index Level (the "Barrier"). Otherwise, the Note Securities incur 100% of the
depreciation of the Reference Index. The investors will receive their compensations based on the short-term
appreciation of the Reference Index up to a maximum of 50% or 22.47% annualized. This note is preferable for
an investor who holds a short term investment horizon, looking to capitalize on the rising market, while also
maintaining a good hedge since there is 100 principal protection for up to a decrease of 60% in the Index.
Except for a market crisis like the one observed in 2007-2008, a decrease of 60% in the TSX60 in 2 years in
less than probable.

Page | 11
Recommendations Given the many options available to investors, we would recommend the CIBC structured note for those
relatively long-term investors who consider the market to be volatile, but inside the range given by the note of -
25% to +20%. As was observed before, this note provides the most satisfying return in this type of environment.
The second note seems very similar to the CIBC note, but in fact this note is not as protected when there is a
bear market; even though the investor receives 100% of their investment back, there is no variable payment to
compliment for their opportunity cost.
Reference
CIBC, Pricing Supplement No 112; CIBC Canadian Equity Autocallable Return on Capital Notes,
Series 7 (Due December 1st 2020)
S&P/TSX 60 Index Future price
https://www.quandl.com/MX/SXFH2014-S-P-TSX-60-Index-Standard-Futures-March-2014-SXFH2014
RBC Lions S&P/TSX 60 Booster Securities, Series 7
http://www.rbcnotes.com/note.aspx?p2=70C92C30-396D-4F72-B9E2-4B2D22D10FD8
RBC Principal Protected S&P/TSX 60 Notes, Series 6
http://www.rbcnotes.com/note.aspx?p2=C2A1A19A-9104-4016-9E40-806AC8F4A8BA
The NBC Recovery Note Securities S&P/TSX 60
http://nbcstructuredsolutions.ca/detailProduit.aspx?langue=en&lequel=625
Market Data Website, in the section World Indices
http://markets.ft.com/research/Markets/Equity-Indices
Bank of Canada, long-term interest rates
http://www.bankofcanada.ca/rates/interest-rates/
Derivatives Securities, Notes from John C. Hull – Implied Dividend Yield using Put Call Parity
Theorem
https://www.math.nyu.edu/faculty/avellane/DSLecture3.pdf
Bloomberg, used for historical dividend yields
Morningstar, used for historical dividend yields