Embed Size (px)
Citation preview
January 10, 2017
Administering the Canadian Securities Regulatory System
Les autorités qui réglementent le marché des valeurs mobilières au Canada
CSA CONSULTATION PAPER 81-408 – CONSULTATION ON THE OPTION OF
DISCONTINUING EMBEDDED COMMISSIONS
2
TABLE OF CONTENTS
PART 1 - INTRODUCTION ....................................................................................................... 3
PART 2 – KEY INVESTOR PROTECTION AND MARKET EFFICIENCY ISSUES
RAISED BY MUTUAL FUND FEES AND RELATED EVIDENCE ..................................... 8
PART 3 – OVERVIEW OF THE PROPOSED OPTION TO DISCONTINUE
EMBEDDED COMPENSATION ............................................................................................. 18
PART 4 – REGULATORY IMPACT ....................................................................................... 24
PART 5 – MITIGATION MEASURES .................................................................................... 76
PART 6 – RELATED REGULATORY INITIATIVES AND EXISTING TOOLS ............ 84
PART 7 – COMMENT PROCESS AND NEXT STEPS ........................................................ 95
APPENDIX A – EVIDENCE OF HARM TO INVESTOR PROTECTION AND MARKET
EFFICIENCY FROM EMBEDDED COMMISSIONS .......................................................... 99
APPENDIX B – OTHER OPTIONS CONSIDERED ........................................................... 131
APPENDIX C – INTERNATIONAL MUTUAL FUND FEE REFORMS ......................... 141
APPENDIX D – SUMMARY OF CONSULTATION QUESTIONS .................................. 163

3
PART 1 – INTRODUCTION
Background
On December 13, 2012, the Canadian Securities Administrators (the CSA or we) published CSA
Discussion Paper and Request for Comment 81-407 – Mutual Fund Fees (the Original
Consultation Paper).1 In that paper, we identified potential investor protection and market
efficiency issues arising from the prevailing practice of remunerating dealers and their
representatives for mutual fund sales through commissions, including sales and trailing
commissions, paid by investment fund managers (embedded commissions). In particular, we
identified how embedded commissions give rise to conflicts of interest that misalign the interests
of investment fund managers, dealers and representatives with those of the investors they serve.
Since the publication of the Original Consultation Paper, the CSA completed roundtable
consultations and discussion forums2, and commissioned independent research to further
examine the identified investor protection and market efficiency issues.3 After an extensive
review of these inputs, in addition to our review of many other independent studies, we find that
embedded commissions raise the following three key investor protection and market efficiency
issues in Canada:
1. Embedded commissions raise conflicts of interest that misalign the interests of
investment fund managers, dealers and representatives with those of investors;
2. Embedded commissions limit investor awareness, understanding and control of dealer
compensation costs; and
3. Embedded commissions paid generally do not align with the services provided to
investors.
The evidence we have gathered to date shows that embedded commissions encourage the sub-
optimal behavior of fund market participants, including that of investment fund managers,
dealers, representatives and fund investors, which reduces market efficiency and impairs investor
outcomes. In particular, the data and research we reviewed suggests that embedded commissions
can:
1 The Original Consultation Paper is available on the websites of the members of the CSA.
2 See transcript of Ontario Securities Commission roundtable held June 7, 2013,
https://www.osc.gov.on.ca/documents/en/Securities-Category8/rpt_20130607_81-407_mutual-fund-fees-
roundtable.pdf. The British Columbia Securities Commission and Autorité des marchés financiers held discussion
forums in the summer and fall of 2013, respectively. 3 Brondesbury Group, “Mutual Fund Fees Research”, Spring 2015, https://www.securities-
administrators.ca/uploadedFiles/General/pdfs/Brondesbury%20Mutual%20Fund%20Fee%20Research%20Report_e
ngwr.pdf; Douglas Cumming, Sofia Johan and Yelin Zhang, “A Dissection of Mutual Fund Fees and Performance”
(Feb. 8, 2016), https://www.osc.gov.on.ca/documents/en/Securities-Category8/rp_20160209_81-407_dissection-
mutual-fund-fees.pdf

4
incent investment fund managers to rely more on payments to dealers than on the
generation of performance to gather and preserve assets under management; this
incentive can in turn lead to underperformance and drive up retail prices for investment
products due to a competition between investment fund managers to offer attractive
commissions to secure distribution;
incent dealers and their representatives to sell funds that compensate them the best or
focus on only those funds that include an embedded commission rather than recommend
a more suitable investment product; specifically, they can encourage a push for higher
commission generating funds, such as higher-risk actively managed funds, which can
impair investor outcomes;
due to their embedded nature and complexity, inhibit the ability of investors to assess and
manage the impact of dealer compensation costs on their investment returns; and
cause investors to pay (indirectly through fund management fees) dealer compensation
that may not reflect the level of advice and service they may actually receive; the cost of
the advice and service provided may exceed its benefit to investors.
These issues and their causes appear to be driven by a compensation model with inherent
conflicts of interest that research suggests are pervasive and are difficult to manage effectively.
Based on the evidence we have gathered, we believe that a change to a different compensation
model must be considered. Investors should be provided with a compensation model that
empowers them and that better aligns the interests of investment fund managers, dealers and
representatives with those of investors.
Consultation on direct pay arrangements
Before taking any regulatory action, and while we consider related regulatory initiatives
underway, we want to consult with stakeholders on the potential option of discontinuing
embedded commissions and transitioning to direct pay arrangements that:
better align the interests of investment fund managers, dealers and representatives with
those of investors;
deliver greater clarity on the services provided and their costs; and
empower investors by directly engaging them in the dealer and representative
compensation process.
Direct pay arrangements could consist of various types of compensation arrangements including
upfront commissions, flat fees, hourly fees, fees based on a percentage of assets under
administration or other arrangements, provided in all cases:
i. the arrangement is negotiated and agreed to exclusively by the investor and the dealer,
through the representative, pursuant to an explicit agreement; and
ii. the investor exclusively pays the dealer for the services provided under the agreement.

5
Under a direct pay model, we would expect dealers to offer their clients a compensation
arrangement that suits their particular investment needs and objectives and the level of service
desired. Investment fund managers could facilitate investors’ direct payment of dealer
compensation through payments taken from the investor’s investment (for e.g. deductions from
purchase amounts or periodic redemptions from the investor’s account).
We recognize that such a change could have a profound effect on the fund industry and on
investors in Canada, including potential unintended consequences. Therefore, a decision on
whether to discontinue embedded commissions will only be reached after careful consideration
and assessment of the possible impacts on investors and market participants and consultation
with stakeholders. Accordingly, the aims of this consultation paper (Consultation Paper) are to
obtain the requisite information the CSA needs to make an informed decision about
discontinuing embedded commissions. Specifically, our objectives are to:
assess the potential effects on investors and market participants of discontinuing
embedded commissions, including on:
o the provision and accessibility of advice for Canadian investors, and
o business models and market structure, including the competitive landscape of the
Canadian fund industry;
if we decide to move forward, identify potential measures that could assist in mitigating
any negative impacts of such a change; and
obtain feedback on alternative options that could sufficiently manage or mitigate the
identified investor protection and market efficiency issues.
We emphasize that we have not made a decision to discontinue embedded commissions. While
we continue to consult and contemplate whether regulatory action should be taken to address the
issues we have identified with the current commission-based compensation model, we encourage
industry to create market-driven solutions and innovations that address the concerns we raise in
this Consultation Paper, including adopting business models that:
have at their core the interests of investors;
align the benefits to the investment fund managers, dealers and representatives with the
benefits to investors;
make for more informed, engaged and empowered investors that expect and demand
services that align with the fees they pay; and
promote fair, competitive and efficient capital markets, and foster confidence in our
market.
Impact analysis
This consultation will build on our previous consultations and the important body of research we
have considered to date. We particularly seek from stakeholders analysis and perspectives that:
were not raised in the prior consultations; and

6
wherever possible, are evidence-based, data-centric and Canadian-focused.
The fund industry has to date provided research that finds that higher levels of wealth are
achieved by advised investors over time, and maintains that embedded commissions are essential
to delivering this benefit, particularly to investors with lower levels of wealth who may not
otherwise be able to afford, or may not want to pay directly for, advice.
The fund industry has also pointed to the consequences of relevant regulatory reforms in other
jurisdictions (such as the U.K. and Australia) as potential evidence of the likely impact of the
discontinuation of embedded commissions in Canada. While observations about the impacts of
relevant reforms in other jurisdictions are informative and insightful, we consider that the
potential impacts from similar reforms in Canada might not be the same. The unique features of
those foreign markets, including the characteristics of their respective market participants and the
specific competitive dynamics within which they operate, their market structure, the savings
habits of their local investors, as well as the scope of their respective reforms may all play a role
in shaping the specific impacts.
The objective of this consultation is therefore to identify the potential effects of discontinuing
embedded commissions in Canada based on what we know of our fund market and its
participants, including our investment fund managers, our dealers, and the investors they
currently serve. This objective includes understanding the potential impact such a change may
have on the accessibility and affordability of advice for Canadian investors, including lower-
wealth investors, and identifying ways to minimize this impact. Ultimately, our goal is to ensure
that any regulatory action we may decide to take will provide a Canadian solution to challenges
specific to the Canadian market, will result in more positive outcomes for Canadian investors
and will minimize disruption for market participants. For this purpose, the contribution of the
stakeholders to this consultation is very important.
Related regulatory initiatives and other alternatives
We are aware of the view of many fund industry participants that mutual fund fee reforms may
be unnecessary in the wake of recent reforms aimed at improving investor awareness and
understanding of fees and performance under the CSA’s Point of Sale disclosure (POS) and
Client Relationship Model Phase 2 (CRM2) projects, and the concept proposals to enhance the
registrant-client relationship discussed in CSA Consultation Paper 33-404 Proposals to Enhance
the Obligations of Advisers, Dealers, and Representatives Toward Their Clients (CSA CP 33-
404). We also understand that industry participants are concerned by the number of current
policy initiatives that affect their business and that require substantial changes in their operations
and systems. Industry has urged us to allow full implementation of the POS and CRM2 reforms
and fairly assess their results, and conclude consultations under CSA CP 33-404, before
signaling that significant new reforms are needed.
We are of the view that the discontinuation of embedded commissions could be complementary
to our recent reforms and proposals in that those existing and ongoing initiatives were not
designed to, and may not fully address, the key investor protection and market efficiency issues
we have identified in this Consultation Paper. In particular, we think that as long as dealer
compensation remains embedded in the fund product, investment fund managers may continue to

7
place greater emphasis on payments to dealers than on performance to gather and preserve assets
under management. This compensation model may continue to encourage higher fund fees and
impair investor outcomes and market efficiency, including effective competition in our market.
We believe that discontinuing embedded commissions may address these issues by better
aligning the interests of investment fund managers, dealers and representatives with those of
investors. In this Consultation Paper, we seek your views on our assessment of the extent to
which the discontinuation of embedded commissions may be required to address our key issues,
including your views on whether recent disclosure reforms and proposals to enhance the
registrant-client relationship may on their own sufficiently address our concerns.
We have also canvassed and thoughtfully considered a number of alternative options to address
the investor protection and market efficiency issues we have identified. As more fully discussed
in Appendix B of this Consultation Paper, we did not retain those other options as we found that
they did not directly or fundamentally address the identified issues to the extent that
discontinuing embedded commissions may.
Comment process
We welcome comments from investors, participants in the investment fund and financial services
industries, and all other interested parties to the matters discussed in this Consultation Paper.
Some CSA jurisdictions will hold in-person consultations in 2017 to facilitate additional
feedback and further our consideration of the issues. Please see Part 7 of this Consultation Paper
for information on how to submit comments. The comment period closes on June 9, 2017.
Structure of Consultation Paper
The remainder of this Consultation Paper is structured as follows:
Part 2 discusses the key investor protection and market efficiency issues we have identified
in connection with embedded commissions and highlights the evidence of these issues;
Part 3 describes the potential scope of the discontinuation of embedded commissions if we
were to proceed with rule-making;
Part 4 sets out our assessment of the potential impacts of discontinuing embedded
commissions on the Canadian fund market and specific stakeholders, including the potential
impacts on market structure, business models and access to advice for Canadian investors,
based on an analysis of data about Canadian fund investors and market participants;
Part 5 explores measures that could mitigate the potential impacts and unintended
consequences to investors and the Canadian fund market of discontinuing embedded
commissions;
Part 6 provides an overview of existing regulatory tools and related regulatory initiatives and
our assessment of the extent to which these tools and initiatives may help address the key
investor protection and market efficiency issues we have identified in connection with
embedded commissions;

8
Part 7 explains how stakeholders may provide comments and discusses next steps;
Appendix A provides a detailed overview of the research that provides evidence of the key
investor protection and market efficiency issues discussed in Part 2;
Appendix B discusses other options we previously considered and the reasons why we did
not retain them;
Appendix C provides an overview of relevant reforms pertaining to dealer compensation in
other jurisdictions; and
Appendix D provides a list of the consultation questions.
PART 2 – KEY INVESTOR PROTECTION AND MARKET EFFICIENCY ISSUES
RAISED BY MUTUAL FUND FEES AND RELATED EVIDENCE
Further to the CSA’s consultations on the Original Consultation Paper and our review of recent
Canadian and other independent research on mutual fund fees as well as various other pieces of
evidence, we have identified the following three main investor protection and market efficiency
issues in connection with the mutual fund fee structure in Canada:
1. Embedded commissions raise conflicts of interest that misalign the interests of
investment fund managers, dealers and representatives with those of investors;
2. Embedded commissions reduce investor awareness, understanding and control of dealer
compensation costs; and
3. Embedded commissions paid generally do not align with the services provided to
investors.
Below, we discuss each of the three issues in greater detail and reference various pieces of
research and other data set out in Appendix A that evidence the issues.
We then consider the policy implications of the available evidence and the extent to which they
suggest a need for change.
A. The issues and related evidence:
Issue 1: Embedded commissions raise conflicts of interest that misalign the interests
of investment fund managers, dealers and representatives with those of
investors
Based on the available evidence, the current embedded commission dealer compensation model
appears to facilitate a mutually beneficial relationship between the investment fund managers
who manufacture fund products and the dealers and representatives that distribute them. It aligns
the investment fund manager’s asset gathering and preservation objectives with the dealer’s

9
revenue maximization objectives. The evidence suggests that this alignment of commercial
goals can alter the behavior of investment fund managers, and of the dealers and representatives
who distribute the investment fund manager’s products, in a way that is detrimental to market
efficiency and investor outcomes. Specifically:
i. embedded commissions can reduce the investment fund manager’s focus on fund
performance, which can lead to underperformance;
ii. embedded commissions can encourage dealers and representatives to make biased
investment recommendations which may negatively affect investor outcomes; and
iii. embedded commissions encourage high fund costs and inhibit competition by creating a
barrier to entry.
i. Embedded commissions can reduce the investment fund manager’s focus on fund
performance, which can lead to underperformance
Investment fund managers who pay embedded commissions to dealers may be incented to rely
more on those payments than on generating performance to attract and preserve assets under
management. Consequently, the embedded commission structure may encourage investment
fund managers to regard dealers and representatives, rather than their fund investors, as their
“customers”.4
4 This observation was similarly made by Gloria Stromberg in Regulatory Strategies for the Mid-‘90s,
Recommendations for Regulating Investment Funds in Canada, January 1995, at pages 17-18 where she discusses
this concern as follows:
“Another result that has flowed from the need to secure distribution channels is that independent
investment fund organizations no longer appear to regard the investors in their sponsored investment funds
as being their “customers” in terms of such investors being the persons whose needs, expectations and
interests that their operations are intended to serve. Instead, their organizations regard the distributors – i.e.
mutual fund dealers, mutual fund specialists, financial planners, investment dealers and, in some cases, the
individual sales representatives that are employed by these firms – as being their “customers” and their
immediate focus is on satisfying the needs of these people instead of the needs of the investors in their
sponsored investment funds.”
We note the U.K.’s Financial Services Authority (FSA) (now known as the Financial Conduct Authority) also made
similar observations in the work leading up to its Retail Distribution Review reforms discussed in Appendix C of
this Consultation Paper. In a speech entitled “Is the present business model bust?” given on September 16, 2006, the
Chairman of the FSA stated the following:
“And one of the key questions that must be addressed is this: who is the real customer of the provider – is
it the policyholder who invests their money in the hope of seeing a decent return? Or is it the distributor,
who in the main, secures access to the end-consumer for the provider? If, as many commentators would
have it, it is indeed the distributor who is the actual customer of the provider, this raises all manner of
difficulties which further perpetuate the shortcomings of the current model – particularly with regard to
treating the real customer fairly. I understand well that many are frustrated by what they describe as the
“commission stranglehold” that the advisory community enjoys, but so long as providers continue to
10
The research that we have gathered and reviewed suggests that this inherent conflict of interest
diminishes the investment fund manager’s focus on risk-adjusted outperformance, thus impairing
investor returns.
ii. Embedded commissions can encourage dealers and representatives to make biased
investment recommendations which may negatively affect investor outcomes:
Dealers and representatives who are compensated through embedded commissions may be
incented to make biased investment recommendations that give priority to maximizing
compensation over the interests of the client. The research we have gathered and reviewed
suggests that:
compensation bias arising from embedded commissions can incent dealers and
representatives to:
o recommend higher cost fund products that pay them higher embedded commissions
than other suitable lower-cost and, possibly, better performing products, and
o promote the use of a particular purchase option5, such as the deferred sales charge
(DSC) option6, that pays higher upfront embedded commissions, regardless of the
compete over the attractiveness of their commission proposition, the fundamental flaws in the present
business model will remain.”
5 Mutual funds in Canada can be purchased under one of four primary options:
1. No load: The investor does not pay any direct charges for fund securities purchased or redeemed; the
dealer is paid a trailing commission by the investment fund manager.
2. DSC: The investor does not pay a sales charge for fund securities purchased, but may have to pay a
redemption fee if the securities are sold before a predetermined period has elapsed; the dealer is paid both
an upfront commission and a trailing commission by the investment fund manager. For more details on
this option, see note 6.
3. Front end: The investor pays a negotiable sales charge to the dealer at the time of purchase that is
deducted from the amount invested, but does not pay a redemption fee to redeem; the dealer is paid a
trailing commission by the investment fund manager.
4. Fee based: The investor does not pay a sales charge to purchase, or a redemption fee to redeem, fund
securities, but instead pays an ongoing fee directly to the dealer pursuant to an agreement with the dealer;
the dealer generally does not receive any compensation from the investment fund manager.
6 When purchasing fund investments under the DSC option (also known as the “back end load” option), the investor
does not directly pay a sales commission to their dealer or representative at the time of purchase. The entire amount
paid by the investor is accordingly invested in the fund at the time of purchase. While the investor does not directly
pay a sales commission to the dealer or representative at the time of purchase, the dealer and the representative,
through the dealer, typically receive a commission from the investment fund manager equivalent to 5% of the
amount purchased. The investment fund manager may borrow the money necessary to pay these upfront
commissions and therefore will incur financing costs. These costs are recouped by the investment fund manager
through the ongoing management fees charged to the fund. Accordingly, the cost of the upfront commissions is
embedded in the ongoing costs of the fund.
11
availability of other purchase options that may better suit the investor’s needs and
objectives; and
biased advice has an economically significant cost on investor outcomes.
iii. Embedded commissions encourage high fund costs and inhibit competition by creating a
barrier to entry:
The research we have gathered and reviewed suggests that competition between investment fund
managers to offer high embedded commissions to attract and secure distribution encourages and
preserves high overall fund fees and discourages the manufacturing and sale of lower-cost
alternatives, thus limiting price competition in Canada. This competition on the basis of
commissions has a distorting effect on the allocation of capital by rewarding some investment
fund managers more than is warranted, and others less than is warranted, while discouraging
some from entering the market entirely.
Evidence:
In Appendix A, we provide evidence substantiating how the conflicts of interest inherent in
embedded commissions alter the behavior of investment fund managers, dealers and
representatives at the expense of market efficiency and investor interests.
Issue 2: Embedded commissions limit investor awareness, understanding and control
of dealer compensation costs
Based on the available evidence, embedded commissions appear to limit investor awareness,
understanding and control of dealer compensation costs. Specifically:
While investors do not pay a sales charge to their dealer at the time they make their purchase under the DSC option,
they may pay a redemption fee to the investment fund manager if they redeem their investment within a
predetermined number of years from purchase, typically 5 to 7 years. The redemption fee is designed to deter an
investor from redeeming the investment and accordingly preserve assets under management. The redemption fee
works on a declining scale, typically starting around 6% in the first year and declines by about 1% each year down
to 0% at the end of the specified holding period. The investor may switch his investment to other funds within the
investment fund manager’s fund lineup without triggering redemption fees. However, a switch fee of typically up to
2% may apply.
Many investment fund managers offer a low-load sales charge option, which works like the DSC option, but on a
shorter schedule – typically 3 years or less. The upfront commission paid by the investment fund manager to the
dealer and the redemption fee payable by the investor on a redemption made within the specified holding period are
also correspondingly reduced (down to approximately 2 to 3%).
In this Consultation Paper, unless otherwise indicated, references to the “DSC option” include the “low-load sales
charge option”.
According to data from Investor Economics, as at December 2015, 20% of Canadian fund assets totalling $234
billion were held in the DSC option.

12
i. the lack of saliency of embedded commissions reduces investors’ awareness of dealer
compensation costs;
ii. embedded commissions add complexity to fund fees which inhibit investor understanding
of such costs;
iii. the product embedded nature of dealer compensation restricts investors’ ability to directly
control that cost and its impact on investment outcomes.
i. The lack of saliency of embedded commissions reduces investors’ awareness of dealer
compensation costs:
To facilitate the sale of funds, the Canadian fund industry has over the last several years
gradually shifted away from transaction-based sales commissions paid directly by investors
toward a greater reliance by both investment fund managers and dealers on product embedded
commissions. For example, in 1996, trailing commissions accounted for slightly more than one
quarter of a typical representative’s book of business; by 2011, that share had grown to an
estimated 64%.7
This move away from transaction-based sales commissions has reduced the saliency of dealer
compensation costs for investors and, accordingly, reduced their sensitivity to such costs. The
research we have gathered and reviewed is clear that the majority of Canadian fund investors are
not aware of what they pay for financial advice or that they pay for financial advice at all.8
Consequently, these costs do not figure into their decision-making. The research we have
gathered and reviewed suggests that investors are more sensitive to salient upfront fees like
front-end loads and are more likely to control such visible and salient fees that they must pay
directly.
ii. Embedded commissions add complexity to fund fees which inhibit investor understanding of
such costs:
Further contributing to investors’ limited awareness and understanding of fund fees, including
embedded commissions, is the complexity of fund fees in terms of structure and options on offer.
Although all dealer compensation costs that fund investors pay directly (such as sales charges)
and indirectly through ongoing fund fees (such as trailing commissions) are disclosed in the
fund’s prospectus, the fund facts document and the annual report on charges and other
compensation, the variance in such fees between investment fund managers, fund types (i.e. asset
classes), fund series and purchase options can overwhelm investors’ capacity to understand the
specific fund fees, including dealer compensation costs, that apply to their investment.
7 Investor Economics, Investor Economics Insight, March 2012, at p.9.
8 The new report on charges and other compensation implemented in the context of CRM2 was designed to increase
the transparency of dealer compensation costs for investors. In Part 6 of this Consultation Paper, we provide an
analysis of the extent to which CRM2 is expected to respond to Issue 2 above.

13
The complexity of the mutual fund fee structure can make it challenging for all but sophisticated
investors to measure the value of the services they receive against the costs they pay and assess
the impact of fees on their investment returns.
The research we have gathered and reviewed suggests that price complexity in retail financial
products increases the information asymmetry between investors and product manufacturers and
distributors, which increases investors’ reliance on more informed intermediaries for their
investment choices and decisions.
iii. The product embedded nature of dealer compensation restricts investors’ ability to directly
control that cost and its effect on investment outcomes:
Since the cost of dealer compensation is embedded in the fund’s ongoing management fees,
investors have no ability to directly negotiate this cost and consequently have no control over the
amount they ultimately pay their dealer and their representative. The only control investors have
on dealer compensation costs under the embedded commission model is to vote on a proposed
increase to fund management fees (from which dealer compensation is paid).9
Opportunities for retail investors in Canada to reduce the trailing commissions they indirectly
pay or avoid them altogether are very limited. As a result, investors who may desire little or no
advice (e.g. do-it-yourself investors) may often bear the cost of full unreduced trailing
commissions. And investors who do desire advisory services but who wish to pay for them
directly rather than through embedded commissions similarly have limited options because direct
pay arrangements are typically available only through dealers servicing higher net worth
investors. We note that even though the vast majority of investment fund managers now offer
fee-for-service series (e.g. Series F) for minimal investments, the distribution of such series is
still limited in comparison to the distribution of series with embedded commissions due to the
fee-based account minimums imposed by the dealer.10
Furthermore, because trailing commissions are deducted at the fund level rather than the account
level, some investors indirectly subsidize certain dealer compensation costs that are not
attributable to their investment in the fund, which means they indirectly pay excess fees. This
situation is called “cross-subsidization”. For example, front-end load investors in a fund may
cross-subsidize the costs attributable to DSC investors.11
Opportunities for cross-subsidization
would be reduced if each investor were charged a fee covering his/her own distribution costs at
the account level, which would enable each investor to pay only for his/her costs and thus have
greater control over such costs.
9 Under section 5.1 of National Instrument 81-102 Investment Funds, the prior approval of securityholders of an
investment fund is required for an increase in a fee or expense that is charged to an investment fund or directly to its
securityholders.
10 Investor Economics, Investor Economics Insight, July 2016.
11 We refer you to note 6 where we explain the DSC option and the associated cost to the investment fund manager
of funding the payment of an upfront commission to dealers for sales made under that option.

14
Investors’ inability to make an informed choice based on fund costs, including dealer
compensation, and to control such costs due to their product-embedded nature can lead to sub-
optimal investment choices and outcomes.
Evidence:
At Appendix A, we provide evidence that:
the lack of saliency and the complexity of fund fees, including embedded commissions,
impacts investors’ awareness and understanding of such fees and accordingly reduces the
significance of fund fees as a factor in investor decision-making; and
the product embedded nature of dealer compensation restricts investors’ ability to directly
control that cost and its impact on investment outcomes; this evidence includes an
overview of:
o the cross-subsidization that results from dealer compensation charged at the fund
level, and
o the limited options investors currently have in Canada to limit or avoid the
payment of embedded commissions.
Issue 3: Embedded commissions paid generally do not align with the services
provided to investors
There is generally no clear relationship between the level of embedded commissions set and paid
by the investment fund manager to the dealer and the level of services and advice the dealer and
the representative provide to investors in exchange for such compensation. Specifically:
i. investors do not receive ongoing advice commensurate with the ongoing trailing
commissions paid; and
ii. the cost of advice provided through commissions may exceed its benefit to investors.
i. Investors do not receive ongoing advice commensurate with the ongoing trailing
commissions paid:
As mentioned above, trailing commission rates may vary between investment fund managers,
fund types, fund series and purchase options. They may also in some cases vary over the course
of the investment.12
While a reasonable assumption might be that the rate of the trailing
commission is reflective of the level of service an investor receives from a dealer and their
representative (i.e. the greater the rate, the greater the service), current practice suggests that no
such relationship exists between the fees paid and the services provided in exchange.
12
For example, we have seen trailing commission rates that increase in steps with each year the investor continues
to hold the investment, reaching a specified maximum rate after a certain number of years. It is also typical for
trailing commission rates to double at the expiration of a DSC redemption schedule (5 to 7 years). For example, a
trailing commission rate of 0.50% for an investment held in an equity fund under the DSC option may increase to
1.00% at the expiration of the redemption schedule.

15
Embedded commissions are paid to dealers regardless of the extent of the services that a
representative provides to the investor in connection with an investment in a fund. The same
compensation is paid irrespective of whether the representative provides only transaction-
oriented advice or provides a broader range of ongoing investment services and financial advice
that is tailored to the investor’s specific needs. For example, our review of the Canadian fund
market finds that higher than average trailing commissions are sometimes paid on investment
funds offering pre-packaged investment solutions (i.e. funds-of-funds) that relieve the
representative from having to do much of the fund selection and asset allocation they might
otherwise have to do for a client. Similarly, discount brokers who provide execution-only
services often distribute fund series that pay them the same trailing commission that would be
paid to a full service dealer.
The ‘one-size-fits-all’ nature of the trailing commission payment therefore seems misaligned
with the provision of services and advice customized to the investor’s specific needs,
expectations and preferences. A contributing factor to this misalignment is likely investors’ low
awareness and understanding of fees including dealer compensation (as discussed under Issue 2
above), which causes investors to not demand a level of service and advice commensurate with
the fees they have indirectly paid for.
Absent a clear relationship between the rate of the embedded compensation paid to the dealer
and their representative and the level of services an investor receives in return, the payment of
embedded compensation may be perceived to be tied to the simple distribution of the fund
product as opposed to the provision of ongoing advice and services. Certain industry
submissions received in response to our Original Consultation Paper would seem to confirm this
view as several commenters indicated that trailing commission payments support dealer
operations and sales activity more than the provision of ongoing advice.
If investors are getting basic one-time services centered on the trade as opposed to ongoing
advice and services in exchange for the ongoing embedded commissions paid out of their funds’
management fees, they may be indirectly paying too much for the services they are actually
receiving. Moreover, since the aggregate amount of embedded commissions that investors pay
increases as their holding period increases, those investors who remain invested longer may pay
more fees than others for the same basic service.
ii. The cost of advice provided through embedded commissions may exceed its benefit to
investors:
Some of the research we reviewed suggests that investors may derive no measurable net benefit
from financial advice paid for through embedded commissions and may in some cases be worse
off because of it. Certain research finds that the advice of representatives may be skewed not
only by compensation biases, but may also be affected by representatives’ varying skills and
knowledge about investing which in some cases may benefit from increased proficiency
requirements. Other research suggests that the benefits that investors derive from the advice of
representatives may be largely behavioral and thus intangible in nature, such as the development
of good savings discipline, overcoming inertia, the reduction of anxiety, and the creation of trust.
Evidence:

16
In Appendix A, we provide evidence that:
investors do not receive ongoing advice commensurate with the ongoing trailing
commissions paid; and
the cost of advice provided through embedded commissions may exceed its benefit to
investors.
Questions
1. Do you agree with the issues described in this Part? Why or why not?
2. Are there other significant issues or harms related to embedded commissions? Please
provide data to support your argument where possible.
3. Are there significant benefits to embedded commissions such as access to advice,
efficiency and cost effectiveness of business models, and heightened competition that
may outweigh the issues or harms of embedded commissions in some or all
circumstances? Please provide data to support your argument where possible.
B. Policy implications:
The foregoing shows that product embedded commissions affect the behavior of fund market
participants in a way that undermines investor protection and the fairness and efficiency of our
capital markets as well as confidence in our market. This situation suggests a need to consider
regulatory action.
To address the investor protection and market efficiency issues outlined in this Consultation
Paper, the CSA considered and discussed the range of policy options set out in the chart below:
Potential regulatory options
1. Use existing tools 2. Enhancements to disclosure 3. Investment fund manager focused
initiatives
4. Enhancements
to registrant-
client
relationship
5. Mutual fund fee reforms
Roll out POS and
CRM2 and
monitor
impact
Conduct NI 81-105
mutual fund
sales
practices
reviews
CRM2 cost reporting /
performance
reporting
benchmarking
Better fee disclosure in
fund facts
(giving more
context for
fund costs)
Require separate
series for
each
purchase
option
Make distribution
costs an
expense of
the fund
Require DIY
discount
series
Consider extent to which concept
proposals under
CSA CP 33-404, if
implemented, may
respond to fund fee issues
Cap all forms of embedded
compensation to a
maximum limit
Discontinue all forms of
embedded
compensation
CSA regulatory project
focus
Regulatory options not
retained

17
Guiding considerations for evaluation of options:
Our evaluation of the range of options and determination of which options should be retained
and which ones should not were guided by the extent to which an option directly addresses the
three investor protection and market efficiency issues we identified. We specifically considered
the questions below:
a. How many problems does the option address and to what degree?
b. Would the impact be direct/immediate rather than indirect/over time?
c. What is our level of uncertainty regarding the impacts/what is our expectation regarding
unintended consequences?
d. Does it simplify or add to the complexity of the fund fee structure?
e. Does it enhance competition in our market and market efficiency generally?
Where we determined that an option would potentially address one issue to some degree, but at
the same time would fail to address or would likely exacerbate another issue, or would
potentially increase the complexity of fund fees or fail to enhance competition in the market, we
opted to not retain the option.
When we evaluated the options through this lens, our analysis drew us to not retain the options
highlighted in red and retain the options highlighted in green in the table above.
The options we opted to not retain and the reasons why are described in Appendix B of this
Consultation Paper.
The options we retained include:
i. maintain and use our existing tools, namely enhanced transparency of fund fees under
POS and CRM2, and review of sales incentives under NI 81-105 Mutual Fund Sales
Practices (NI 81-105);
ii. continue to explore concept proposals under CSA CP 33-404 to strengthen the
obligations of dealers and their representative towards their clients; and
iii. discontinue embedded commissions and transition to direct pay arrangements.
Following a thorough evaluation, we believe that options “i” and “ii” may provide only a partial
resolution to the issues identified in this Consultation Paper and that option “iii” may need to be
considered in conjunction with options “i” and “ii” to achieve the desired outcomes. We
accordingly view option “iii” as being complementary to options “i” and “ii”.
In Part 6 of this Consultation Paper, we provide our detailed assessment of the extent to which
the above key issues may be addressed by existing CSA regulation and ongoing proposals, and
seek your views on that assessment.
18
PART 3 – OVERVIEW OF THE PROPOSED OPTION TO DISCONTINUE
EMBEDDED COMPENSATION
In this part, we discuss the potential scope of the discontinuation of embedded commissions
should the CSA decide to move forward with rule-making. In particular, we consider:
what types of securities would be affected, and
what types of payments would be discontinued.
1. Types of securities affected
NI 81-105, implemented in 1998, governs the payments that investment fund managers may
make to dealers in connection with the distribution of securities of a mutual fund.13
While that
rule currently applies only to mutual funds that are reporting issuers, we recognize that its
regulatory objectives have equal application to the distribution of other investment funds and
comparable investment products that we regulate.14
Over the last few years, the CSA have made regulatory changes to ensure a consistent regulatory
framework in key areas for all types of retail investment funds, regardless of whether structured
as a mutual fund, an exchange-traded mutual fund (ETF) or a non-redeemable investment
fund.15
We have also recognized the growth of structured notes16
as a retail investment product
13
NI 81-105 came into force on May 1, 1998. Part 2 of Companion Policy 81-105CP provides background on NI
81-105 and describes its purpose. NI 81-105 was adopted by the CSA as a response to the concern of many
participants in the mutual fund industry that prospectus disclosure of sales practices, coupled with the discipline
imposed by competitive market forces, were not sufficient to discourage sales practices and compensation
arrangements that gave rise to questions as to whether dealers and their representatives were being induced to sell
mutual fund securities on the basis of the incentives they were receiving as opposed to what was suitable for and in
the best interests of their clients.
The purpose of NI 81-105 is to ensure that the interests of investors remain uppermost in the actions of participants
in the mutual fund industry by setting minimum standards of conduct designed to minimize the conflicts between the
legitimate commercial goals of industry participants and the fundamental obligations that are owed by industry
participants toward investors.
14 See “Request For Comments on Sales Practices Applicable To The Sale Of Mutual Fund Securities – Notice of
Proposed Rule and Proposed Companion Policy Under The Securities Act”, Ontario Securities Commission (OSC)
Bulletin, (1996) 19 OSCB, page 4727, in which the OSC sought comments on a local rule proposal that would later
become NI 81-105 and be adopted by all CSA jurisdictions. At page 4728, the OSC states: “Although the proposed
Rule applies only to the distribution of publicly offered mutual funds, the Commission is of the view that the
regulatory objectives of the proposed Rule have equal application to the distribution of all collective money
management schemes. Ultimately, the distribution of all schemes should be subject to the same or equivalent rules
and standards.”
15 See “Modernization of Investment Fund Product Regulation (Phase 2) – Final Amendments”, in force as of
September 22, 2014, https://www.osc.gov.on.ca/en/SecuritiesLaw_ni_20140619_81-102_final-amendments-
phase2.htm. The objective of Phase 2 of this project was to identify and address any market efficiency, investor
protection and fairness issues that arose out of the differing regulatory regimes that applied to publicly offered
mutual funds and non-redeemable investment funds and make the necessary amendments to achieve consistent

19
and communicated our intention to regulate them in a similar manner to investment funds, where
appropriate.17
While investment funds and structured notes sold in the exempt market have to date generally
not been subject to the same requirements as retail investment funds, we consider that the
investor protection and market efficiency issues that stem from embedded commissions, as
evidenced under Part 2, require consistent treatment both in the prospectus-qualified and
prospectus-exempt markets. To do otherwise would create an opportunity for regulatory
arbitrage.18
Recognizing that the fee structure of various types of investment funds and structured notes
commonly includes embedded commissions, and with the aim of promoting a level playing field
amongst comparable investment products and limiting opportunities for regulatory arbitrage, we
currently anticipate that any regulatory proposal to discontinue embedded commissions would
affect:
an “investment fund”19
, as defined under securities legislation and
structured notes,
whether sold under a prospectus or in the exempt market under a prospectus exemption.
product regulation across the spectrum of retail investment funds. Under these amendments, certain investment
restrictions and operational requirements applicable to mutual funds and ETFs were extended to non-redeemable
investment funds.
16 A structured note, or linked note, is a specified derivative, as defined in National Instrument 44-102 – Shelf
Distributions, for which the amount payable is determined by reference to the price, value or level of an underlying
interest that is unrelated to the operations or securities of the structured note issuer. Structured notes issued under
the shelf prospectus are generally non-principal protected securities issued by a deposit taker.
17 In CSA Staff Notice 44-305 – 2015 Update – Structured Notes Distributed under the Shelf Prospectus System
(CSA Staff Notice 44-305), the CSA recognized the growth of structured products as a retail investment product
and our intention to adapt our regulatory approach to ensure consistency, where appropriate, in how we regulate
structured notes and similar retail products such as investment funds. CSA Staff Notice 44-305 noted that some
structured note issuers charge fees on a basis similar to investment funds. These fees may include sales
commissions and embedded ongoing service fees or trailing commissions paid by the structured note issuer to
dealers and their representatives.
18 In the Original Consultation Paper, we recognized that there may be other investment fund products whose fee
structure may raise similar investor protection and fairness issues for investors, and that accordingly, any regulatory
initiative that we would ultimately undertake would assess whether the same initiative should also apply to other
investment funds and comparable securities products.
19 The definition of “investment fund” captures conventional mutual funds, ETFs and non-redeemable investment
funds.

20
Although investment fund-like products, such as segregated funds, are not within the purview of
securities legislation and therefore would not be captured in any CSA rule proposal to
discontinue embedded commissions, we recognize the importance of a harmonized approach to
regulating such products given their similarity to investment fund products, including their
payment of product embedded commissions to intermediaries. The CSA will accordingly
continue to liaise with insurance regulators to address the potential risk of regulatory arbitrage
between investment funds and individual segregated funds.
In the interest of achieving a harmonized approach, the Canadian Council of Insurance
Regulators (CCIR) established a Segregated Funds Working Group in 2015, with a mandate to,
among other things, identify potential gaps in the comparative regulatory frameworks for
segregated funds and mutual funds and assess the potential risk of regulatory arbitrage by dually-
licensed (insurance and mutual funds) insurance agents. In their May 2016 issue paper calling
for input on how to address key gaps between the regulations pertaining to mutual funds and
segregated funds20
, the CCIR indicates that although it is currently not aware of any statistical
evidence to demonstrate that regulatory arbitrage is occurring between mutual funds and
segregated funds, it will act proactively to amend regulation where appropriate to ensure that
intermediaries have little incentive to prioritize their own interests over those of clients. The
issue paper identifies the CSA’s consultation on how to address the potential investor protection
and market efficiency issues arising from embedded commissions as an issue of particular
relevance, and the CCIR will review the CSA policy direction on this matter and assess its
appropriateness for segregated funds.21
Questions
4. For each of the following investment products, whether sold under a prospectus or in the
exempt market under a prospectus exemption:
mutual fund
non-redeemable investment fund
structured note
should the product be subject to the discontinuation of embedded commissions? If not:
a. What would be the policy rationale for excluding it?
b. What would be the risk of regulatory arbitrage occurring in the exempt market if
embedded commissions were discontinued for the product only when sold under
prospectus?
5. Are there specific types of mutual funds, non-redeemable investment funds or structured
notes that should not be subject to the discontinuation of embedded commissions? Why?
20
Canadian Council of Insurance Regulators, Segregated Funds Working Group Issues Paper, May 2016,
http://www.ccir-ccrra.org/en/init/IVIC_POS/IVICs%20Issues%20Paper%20(ENG).pdf.
21 Ibid. p. 15
21
6. Are there other types of investment products that should be subject to the discontinuation of
embedded commissions? Why?
2. Types of payments discontinued
NI 81-105 currently prohibits mutual funds that are reporting issuers and members of the
organization of such mutual funds from making payments to dealers or their representatives in
connection with the distribution of securities of a mutual fund. The rule however excepts from
this prohibition the payment of commissions (including trailing commissions) and the provision
of support to dealers for marketing and educational practices by members of the organization of
mutual funds.
If the CSA were to move forward with a rule proposal, we currently anticipate that we would
seek to discontinue any payment of money to dealers in connection with an investor’s purchase
or continued ownership of a security described above that is made directly or indirectly by any
person or company other than the investor. The rule would preclude compensation to dealers
that is paid or funded by the investment fund or the investment fund manager or structured note
issuer out of fund assets or revenue.
We anticipate this change would at a minimum prohibit the payment by investment funds,
investment fund managers or structured note issuers to dealers of the following embedded
commissions:
ongoing trailing commissions or service fees; and
upfront sales commissions for purchases made under the DSC option.
To be clear, the discontinuation of embedded commissions would enable dealers and their
representatives to adopt various types of compensation arrangements. Under direct pay
arrangements, dealers and their representatives could opt to be compensated through upfront
commissions (such as front-end sales loads), hourly fees, a flat fee, a fee based on a percentage
of the client’s assets under administration (fee-based arrangement), or other suitable
compensation arrangement, provided in all cases:
a. the method and the rate of the representative’s compensation in connection with the
purchase of a security and other services provided to the investor are negotiated and
agreed to exclusively by the investor and the dealer, through the representative, pursuant
to an explicit agreement; and
b. the investor exclusively pays the dealer for the services provided under the agreement.
Under direct pay arrangements, we would expect dealers and representatives to offer their clients
a compensation arrangement that suits their particular investment needs and objectives and
reflects the level of service desired. For example, ongoing fees should be charged for ongoing
services.

22
We believe that the above terms mitigate the close alignment of interests between investment
fund managers, dealers and representatives.
While investment funds, investment fund managers and structured note issuers would no longer
be allowed to pay or fund compensation to dealers from their own assets or revenue in
connection with an investor’s purchase or continued ownership of a security, we anticipate
allowing them to facilitate the investor’s payment of dealer compensation. Specifically, the
investment fund manager would be permitted to collect the dealer’s compensation, either through
deductions from purchase amounts or through periodic withdrawals or redemptions from the
investor’s account, and remit it to the dealer on the investor’s behalf, provided the investor
consents to this method of payment.
At this time, we anticipate that we would permit the following types of dealer compensation
payments:
referral fees paid for the referral of a client to or from a registrant;22
dealer commissions paid out of underwriting commissions on the distribution of
securities of an investment fund or structured note that is not in continuous distribution
under an initial public offering;
payments of money or the provision of non-monetary benefits by investment fund
managers to dealers and representatives in connection with marketing and educational
practices under Part 5 of NI 81-105; 23
and
internal transfer payments24
from affiliates to dealers within integrated financial service
providers25
which are not directly tied to an investor’s purchase or continued ownership
of an investment fund security or structured note.
22
Referral fees are defined in NI 31-103 – Registration Requirements, Exemptions and Ongoing Registrant
Obligations and would continue to be permitted subject to the requirements of that rule.
23 Under Part 5 of NI 81-105, members of the organization of a mutual fund may:
pay to a dealer direct costs incurred by the dealer relating to investor conferences or investor seminars or
other conferences or seminars prepared or presented by the dealer (ss. 5.1 and 5.5),
provide a non-monetary benefit to a representative of a dealer by allowing him or her to attend a conference
or seminar organized and presented by the investment fund manager (s.5.2),
pay the registration fees of a representative of a dealer for a conference, seminar or course that is organized
and presented by a person or company other than the investment fund manager (s.5.3), and
provide a non-monetary benefit of promotional nature and of minimal value to a representative of a dealer,
subject in each case to compliance with specified requirements.

23
We acknowledge that the above types of payments may give rise to conflicts of interest that may
continue to incent registrant behavior that does not favour investor interests. We therefore seek
your responses to the questions below.
Questions
7. Do you agree with the discontinuation of all payments made by persons or companies other
than the investor in connection with the purchase or continued ownership of an investment
fund security or structured note? Why or why not?
8. Are there other fees or payments that we should consider discontinuing in connection with
the purchase or continued ownership of an investment fund security or structured note,
including:
a. the payment of money and the provision of non-monetary benefits by investment fund
managers to dealers and representatives in connection with marketing and educational
practices under Part 5 of NI 81-105;
b. referral fees; and
c. underwriting commissions.
Why? What is the risk and magnitude of regulatory arbitrage through these types of fees and
commissions?
9. If payments and non-monetary benefits to dealers and representatives for marketing and
educational practices under Part 5 of NI 81-105 are maintained further to the discontinuation
of embedded commissions, should we change the scope of those payments and benefits in
any way? If so, why?
10. With respect to internal transfer payments:
a. How effective is NI 81-105 in regulating payments within integrated financial service
providers such that there is a level playing field for proprietary funds and third party
funds?
b. Should internal transfer payments to dealers within integrated financial service
providers that are tied to an investor’s purchase or continued ownership of an
investment fund security or structured note be discontinued? Why or why not? To
what extent do integrated financial service providers directly or indirectly provide
internal transfer payments to their affiliated dealers and their representatives to incent
24
See MFDA Bulletin #0689-P, Implementation of Requirements under CRM2 Phase 2 Amendments to NI 31-103 –
Frequently Asked Questions (FAQs), May 13, 2016. Question #18 and the MFDA response on pages 8 and 9
discuss internal transfer payments.
25 For the purpose of this consultation, an “integrated financial service provider” is a firm that is comprised of at
least one dealer and one investment fund manager or structured note issuer that are affiliates of each other.

24
the distribution of their products?
c. Are there types of internal transfer payments that are not tied to an investor’s
purchase or continued ownership of an investment fund security or structured note
that should be discontinued?
11. If we were to discontinue embedded commissions, please comment on whether we should
allow investment fund managers or structured note issuers to facilitate investors’ payment of
dealer compensation by collecting it from the investor’s investment and remitting it to the
dealer on the investor’s behalf.
PART 4 – REGULATORY IMPACT
The purpose of this part is to outline our assessment of the possible market impacts of
discontinuing embedded commissions. In particular, we assess the potential impacts this change
could have on the Canadian investment fund sector, including on market structures, business
models and on the accessibility and scope of advice provided to retail investors, based on data
we have gathered and the conclusions we have drawn from this data.
The regulatory impact part is divided into four sections. In section one, we provide a number of
important facts about Canadian households, the fund market and the distribution of funds and
securities in general that will help us anticipate possible market impacts of discontinuing
embedded commissions. In section two, we outline possible overall or high-level impacts on the
market in the event of the discontinuation of embedded commissions. This section is followed, in
section three, by a more narrow focus on the impacts to specific stakeholders. Finally, in section
four, we conclude by outlining how the discontinuation of embedded commissions may address
the key issues outlined previously in Part 2 of this Consultation Paper. We look to all
stakeholders to provide feedback and data responding to the conclusions that we draw here.
1. Important facts about the fund market and fund market participants today
A prerequisite for the CSA’s assessment of possible policy options regarding fund fees was to
understand and analyze what we know about the market today and in particular, what we know
about the respective market participants – advised and non-advised fund investors, consumers of
financial services generally, access to advice by retail investors, investment fund distribution
channels and investment fund managers.
We provide pertinent information for each of these groups below using data from Investor
Economics, Investment Industry Regulatory Organization of Canada (IIROC), Mutual Fund
Dealers Association (MFDA), Morningstar Direct and the Ipsos Canadian Financial Monitor
survey.26
26
We have tried to provide the most recent data available wherever possible.

25
a. Canadian Households
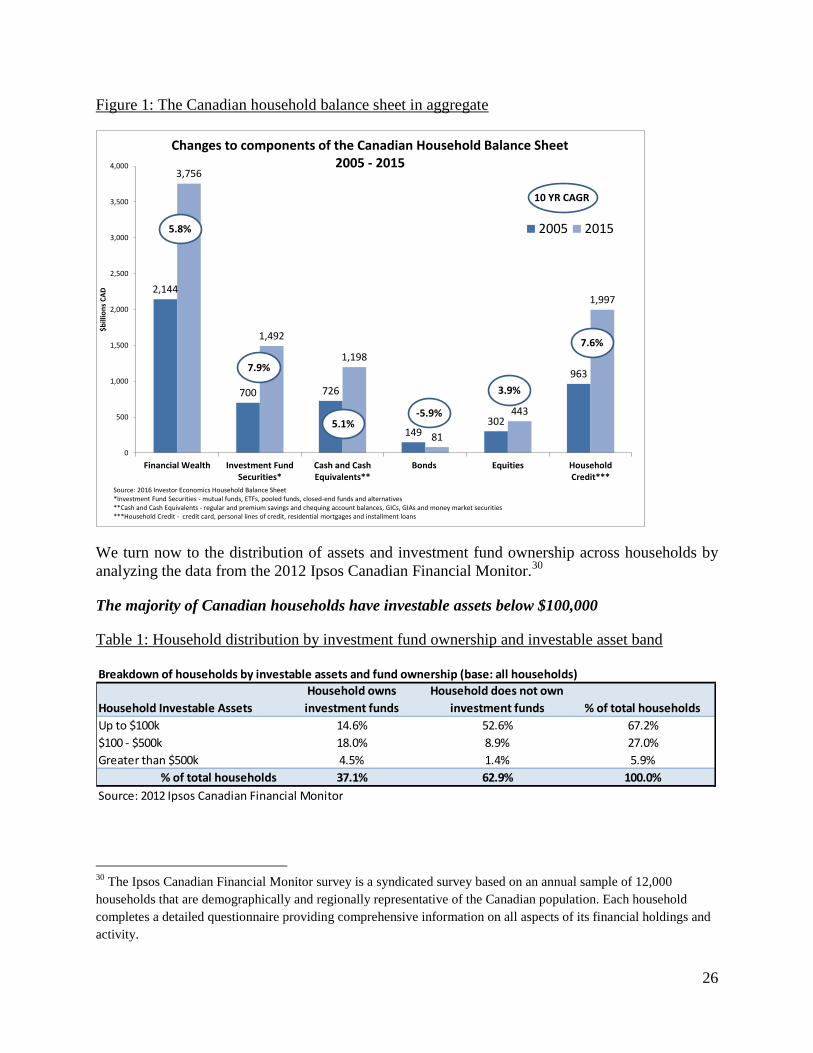
At the end of 2015, financial wealth of Canadian households reached $3.8 trillion dollars,
increasing an average 5.8% per year since 2005. In comparison, household credit (due primarily
to the increase in residential mortgages) grew 7.6% over the same period reaching just under $2
trillion dollars at the end of 2015. In aggregate, and as widely reported elsewhere,27
Canadian
households have become more leveraged over the last 10 years.
Within the asset side of the balance sheet, Canadian households, in aggregate,28
had a significant
and growing share of their total financial wealth in funds and cash and cash equivalents. At the
end of 2015, Canadian households held $1.5 trillion or 40% of their aggregate financial wealth in
investment fund securities and $1.2 trillion or 32% of aggregate wealth in cash and cash
equivalents29
. In comparison, directly held securities (stocks and bonds) made up only $524
billion or 14% of aggregate financial wealth. Total assets held in bonds in particular declined
over the last 10 years while assets held in equities saw relatively modest growth.
While both investment fund securities and cash and cash equivalents made up a significant
portion of aggregate household financial wealth at the end of 2015, assets within investment
funds have grown faster since 2005. On average, investment fund assets increased by 7.9% per
year over the last ten years compared to 5.1% for cash and cash equivalents.
27
See for example, Maciej Onoszko, “Canada’s record household debt is threatening its financial stability, global
bankers fear”, Bloomberg News, October 24, 2016.
28 It is important to note that aggregated household wealth figures do not provide information regarding the
importance of these savings and investment products to the average household or to specific household segments
(e.g. mass market, affluent, etc.). For example, investment funds may make up 40% of aggregate household
financial wealth at the end of 2015 but they do not make up 40% of the average Canadian household’s financial
wealth.
29 Investor Economics, Household Balance Sheet Report, Update and Rebased Forecast, July 2016. In this report,
“Financial Wealth” encompasses financial products held for the purpose of accumulating and preserving wealth
including short-term instruments, deposits (including GICs and market-linked securities), fixed income securities,
equities, investment funds and assets held in capital accumulation plans such as defined contribution plans (but not
defined benefit plans).
26
Figure 1: The Canadian household balance sheet in aggregate
We turn now to the distribution of assets and investment fund ownership across households by
analyzing the data from the 2012 Ipsos Canadian Financial Monitor.30
The majority of Canadian households have investable assets below $100,000
Table 1: Household distribution by investment fund ownership and investable asset band
30
The Ipsos Canadian Financial Monitor survey is a syndicated survey based on an annual sample of 12,000
households that are demographically and regionally representative of the Canadian population. Each household
completes a detailed questionnaire providing comprehensive information on all aspects of its financial holdings and
activity.
2,144
700 726
149302
963
3,756
1,492
1,198
81
443
1,997
0
500
1,000
1,500
2,000
2,500
3,000
3,500
4,000
Financial Wealth Investment FundSecurities*
Cash and CashEquivalents**
Bonds Equities HouseholdCredit***
$b
illio
ns
CA
D
Changes to components of the Canadian Household Balance Sheet2005 - 2015
2005 2015
Source: 2016 Investor Economics Household Balance Sheet*Investment Fund Securities - mutual funds, ETFs, pooled funds, closed-end funds and alternatives**Cash and Cash Equivalents - regular and premium savings and chequing account balances, GICs, GIAs and money market securities***Household Credit - credit card, personal lines of credit, residential mortgages and installment loans
10 YR CAGR
5.8%
7.9%
5.1%-5.9%
3.9%
7.6%
Breakdown of households by investable assets and fund ownership (base: all households)
Household Investable Assets
Household owns
investment funds
Household does not own
investment funds % of total households
Up to $100k 14.6% 52.6% 67.2%
$100 - $500k 18.0% 8.9% 27.0%
Greater than $500k 4.5% 1.4% 5.9%
% of total households 37.1% 62.9% 100.0%
Source: 2012 Ipsos Canadian Financial Monitor

27
The first important fact with respect to Canadian households is that the majority of households
that save have investable assets of $100,000 or less. At the end of 2012, 67% of households had
investable assets31
of $100,000 or less (mass-market households), 27% had investable assets of
between $100,000 and $500,000 (mid-market households) and 6% of households had
investable assets of $500,000 or more (affluent households).
The majority of Canadian households do not own investment funds
The second relevant fact is that the majority of Canadian households do not own investment
funds. At the end of 2012, 37% of Canadian households held investment funds32
while the
balance did not.
Mass-market households make up the largest share of those that do not own investment funds
Table 2: Household distribution by investment fund ownership
By far, the majority of households that do not hold investment funds (84%) are those with
investable assets of $100,000 or less.
However, among investment fund owning households, the majority have relatively modest to
moderate levels of accumulated financial wealth
Yet, like their share of Canadian households generally, mass-market and mid-market households
made up the largest share of households that own investment funds.
At 2012, 39% of all households that owned investment funds were mass-market households,
49% were mid-market households, and the remaining 12% of fund owning households were
affluent households.
31
“Investable assets” include holdings of cash, GICs, bonds, stocks and investment funds. Only households with
positive investable asset balances and households with total income below $30,000 that are holding cash in excess of
30% of household income are considered as possessing investable assets.
32 Throughout this section, we look at holdings of investment fund products and fund wraps of all types including
mutual funds, segregated funds, structured notes, principal protected notes, hedge funds etc. in order to get a sense
of the entire investment fund and fund wrap market as utilized by Canadian households.
Breakdown of households by investable assets and fund ownership (base: fund ownership type)
Household Investable Assets
Household owns
investment funds
Household does not own
investment funds % of total households
Up to $100k 39.4% 83.6% 67.2%
$100 - $500k 48.6% 14.2% 27.0%
Greater than $500k 12.0% 2.2% 5.9%
% of household ownership type 100.0% 100.0% 100.0%
Source: 2012 Ipsos Canadian Financial Monitor
28
Investment funds, like most securities, are more frequently owned by households with higher
levels of accumulated financial wealth
The distribution of fund ownership, like the distribution of financial wealth generally, skews
toward households with higher levels of investable assets.33
Mass-market households appear
underrepresented relative to their share of total households (i.e. only 39% of those households
own funds despite comprising 67% of all households), while the opposite appears true for mid-
market and affluent households. Investment funds, like most securities, tend to be a higher-
wealth product.
Investment funds are less popular than traditional savings vehicles with mass-market
households
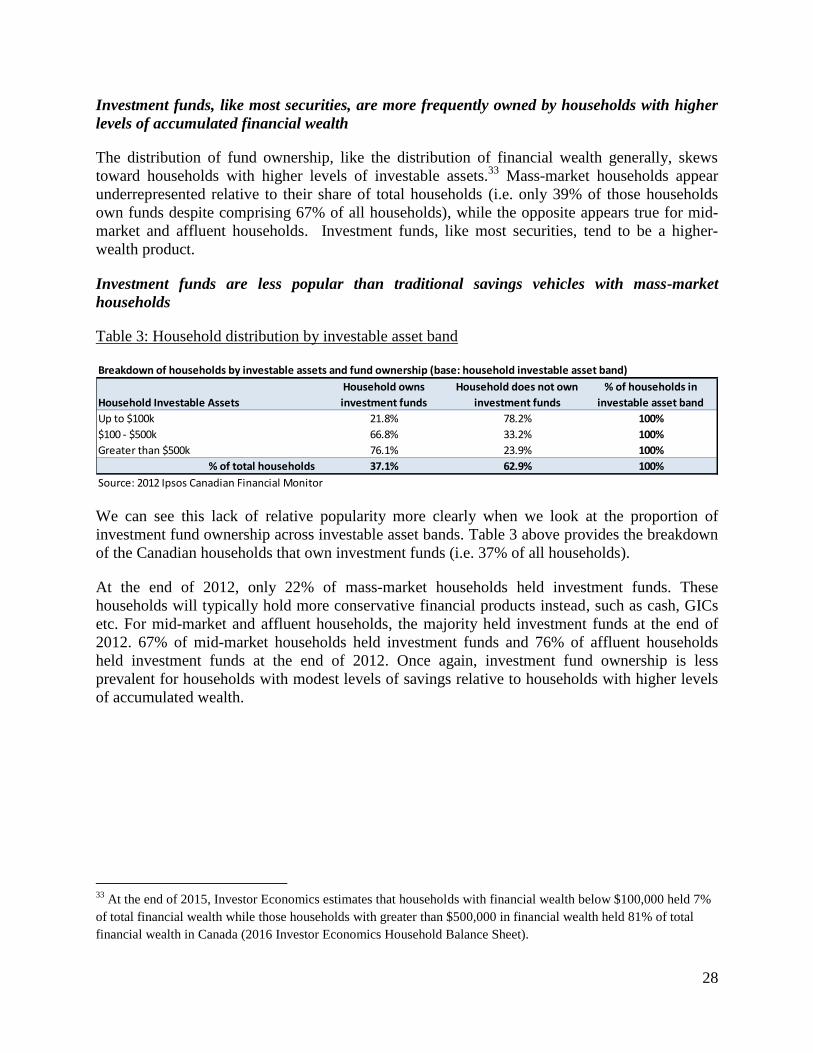
Table 3: Household distribution by investable asset band
We can see this lack of relative popularity more clearly when we look at the proportion of
investment fund ownership across investable asset bands. Table 3 above provides the breakdown
of the Canadian households that own investment funds (i.e. 37% of all households).
At the end of 2012, only 22% of mass-market households held investment funds. These
households will typically hold more conservative financial products instead, such as cash, GICs
etc. For mid-market and affluent households, the majority held investment funds at the end of
2012. 67% of mid-market households held investment funds and 76% of affluent households
held investment funds at the end of 2012. Once again, investment fund ownership is less
prevalent for households with modest levels of savings relative to households with higher levels
of accumulated wealth.
33
At the end of 2015, Investor Economics estimates that households with financial wealth below $100,000 held 7%
of total financial wealth while those households with greater than $500,000 in financial wealth held 81% of total
financial wealth in Canada (2016 Investor Economics Household Balance Sheet).
Breakdown of households by investable assets and fund ownership (base: household investable asset band)
Household Investable Assets
Household owns
investment funds
Household does not own
investment funds
% of households in
investable asset band
Up to $100k 21.8% 78.2% 100%
$100 - $500k 66.8% 33.2% 100%
Greater than $500k 76.1% 23.9% 100%
% of total households 37.1% 62.9% 100%
Source: 2012 Ipsos Canadian Financial Monitor

29
Investment fund owning households with lower levels of accumulated wealth are less likely to
state that they use advice
Table 4: Fund owning household distribution by investable asset band
Table 4 above provides a breakdown of the households that own investment funds (i.e. the subset
of 37% of all households) and their use of an advisor34
.
As Table 4 highlights, the data suggests that advice usage tends to be more of a higher-wealth
product. Its prevalence among investment fund owning households rises with the level of
investable assets. At the end of 2012, only 45% of investment fund owning mass-market
households stated that they used an advisor35
while the majority of investment fund owning mid-
market (66%) and affluent households (72%) used an advisor.
b. Investment Fund Distribution
Whether advised or not, households must purchase their investment funds through a dealer. A
key piece of information needed in order to anticipate the possible market impact of the
discontinuation of embedded commissions is an understanding of where investors access
investment funds today. We will look at this question from a number of different angles and data
sources, starting with the Ipsos Canadian Financial Monitor data.
In the tables below, we have grouped fund distribution by the following firm types:
deposit-taker owned36
fund distributors;
insurer owned37
fund distributors;
34
The term “advisor”, as used in this Consultation Paper, is not indicative of an individual’s category of registration
with Canadian securities regulators, but is rather a plain language term that is commonly used by the public,
including fund industry participants and investors, to refer to a representative.
35 Survey respondents said yes to the question, “Does anyone in your household use a financial planner / advisor to
help manage his / her financial portfolio?” Note that this question is dependent on the respondent’s impression of
whether or not they have an advisor. No specific definition of “advisor” was provided in the survey.
36 We use the term ‘deposit-taker owned’ to refer to dealers or investment fund managers that are owned by deposit
taking institutions including banks, credit unions and caisses populaires.
37 We use the term ‘insurer owned’ to refer to dealers or investment fund managers that are owned by or affiliated
with an insurer.
Investment fund owning households by investable assets and advisor usage (base: household investable asset band)
Household Investable Assets Use Advisor Do not use Advisor
% of households in
investable asset band
Up to $100k 45.0% 55.0% 100%
$100 - $500k 66.0% 34.0% 100%
Greater than $500k 72.4% 27.6% 100%
% of investment fund owning households 58.5% 41.5% 100%
Source: 2012 Ipsos Canadian Financial Monitor

30
independent38
fund distributors; and
other integrated39
fund distributors.
In each of the tables, we take a closer look at where households that hold investment funds
accessed their funds. Households may have multiple relationships with different types of fund
distributors (e.g. a household may work with a deposit-taker and an insurer or a deposit-taker and
an independent or just a deposit-taker etc.). We have cross-tabbed fund distributor types by
grouping deposit-takers and insurers (the traditional integrated financial product distributors)
together and independents and other distributors (the group traditionally labeled as independent
fund dealers) together.
Note that households that have not purchased their funds through a deposit-taker/insurer or
through an independent/other dealer have purchased their funds through an association40
or have
not identified where they purchased their funds.
Most households purchase their funds through a deposit-taker or insurer owned dealer
Table 5: Fund owning household distribution by fund dealer relationship
Deposit-taker and insurer owned fund dealers dominate fund distribution in Canada. At the end
of 2012, of the 37% of households that owned investment funds, 87% purchased their funds
through a deposit-taker/insurer owned distributor while only 18% purchased their funds through
an independent/other fund distributor (a small percentage of households purchased their funds
from both dealer groups).
38
We use the term ‘independent’ to refer to dealers or investment fund managers that are not owned by deposit-
takers or insurers and are not affiliated with an investment fund manager
39 We use the term ‘other integrated’ to refer to dealers that are not owned by or affiliated with a deposit-taker or
insurer but that are affiliated with an investment fund manager, or to investment fund managers that are not owned
by or affiliated with a deposit-taker or insurer but that are affiliated with a dealer.
40 The term ‘association’ refers to a dealer or investment fund manager that is owned by a trade or professional
association.
Households by relationship type (base: All investment fund owning households)
Relationship TypePurchased from
Independent/Other
Not purchased from
Independent/Other
% of investment fund
owning households
Purchased from Deposit-taker/Insurer 8.2% 78.5% 86.7%
Not purchased from Deposit-taker/Insurer 9.5% 3.8% 13.3%
% of investment fund owning households 17.7% 82.3% 100.0%
Source: 2012 Ipsos Canadian Financial Monitor

31
Households with lower levels of accumulated wealth are less likely to purchase their funds
through an independent dealer
Table 6: Mass-market household distribution by fund dealer relationship
Table 7: Mid-market household distribution by fund dealer relationship
Table 8: Affluent household distribution by fund dealer relationship
Mass-market households are less likely to purchase their funds through an independent/other
fund distributor. At the end of 2012, only 14% of mass-market households purchased their funds
through an independent/other fund distributor compared to 18% of households overall and 21%
of affluent households. Mass-market households were also much more likely to be solely
purchasing their funds through a deposit-taker/insurer owned dealer (i.e. 83%) than were
households with higher levels of investable assets (i.e. 76% and 75% respectively for mid-market
and affluent households).
Fund distributors owned by deposit-takers and life insurers dominate investment fund
distribution
Across all levels of investable assets, deposit-taker and insurer owned fund distributors tended to
dominate fund distribution. The majority of households were working with a deposit-
taker/insurer for at least one of their investment fund holdings (i.e. 88% for mass-market, 86%
for mid-market and 87% for affluent households). Usage of deposit-taker/insurer fund
distributors did not fall below 86% of households for all household types and for the industry as
Households by relationship type (base: fund owning households with up to $100k in investable assets)
Relationship TypePurchased from
Independent/Other
Not purchased from
Independent/Other
% of fund owning
households in asset band
Purchased from Deposit-taker/Insurer 5.3% 82.6% 87.9%
Not purchased from Deposit-taker/Insurer 8.8% 3.3% 12.1%
% of fund owning households in asset band 14.0% 86.0% 100.0%
Source: 2012 Ipsos Canadian Financial Monitor
Households by relationship type (base: fund owning households with $100k - $500k in investable assets)
Relationship TypePurchased from
Independent/Other
Not purchased from
Independent/Other
% of fund owning
households in asset band
Purchased from Deposit-taker/Insurer 9.7% 75.9% 85.6%
Not purchased from Deposit-taker/Insurer 10.2% 4.2% 14.4%
% of fund owning households in asset band 19.8% 80.2% 100.0%
Source: 2012 Ipsos Canadian Financial Monitor
Households by relationship type (base: fund owning households with $500k or more in investable assets)
Relationship TypePurchased from
Independent/Other
Not purchased from
Independent/Other
% of fund owning
households in asset band
Purchased from Deposit-taker/Insurer 11.8% 75.3% 87.1%
Not purchased from Deposit-taker/Insurer 9.4% 3.4% 12.9%
% of fund owning households in asset band 21.2% 78.8% 100.0%
Source: 2012 Ipsos Canadian Financial Monitor
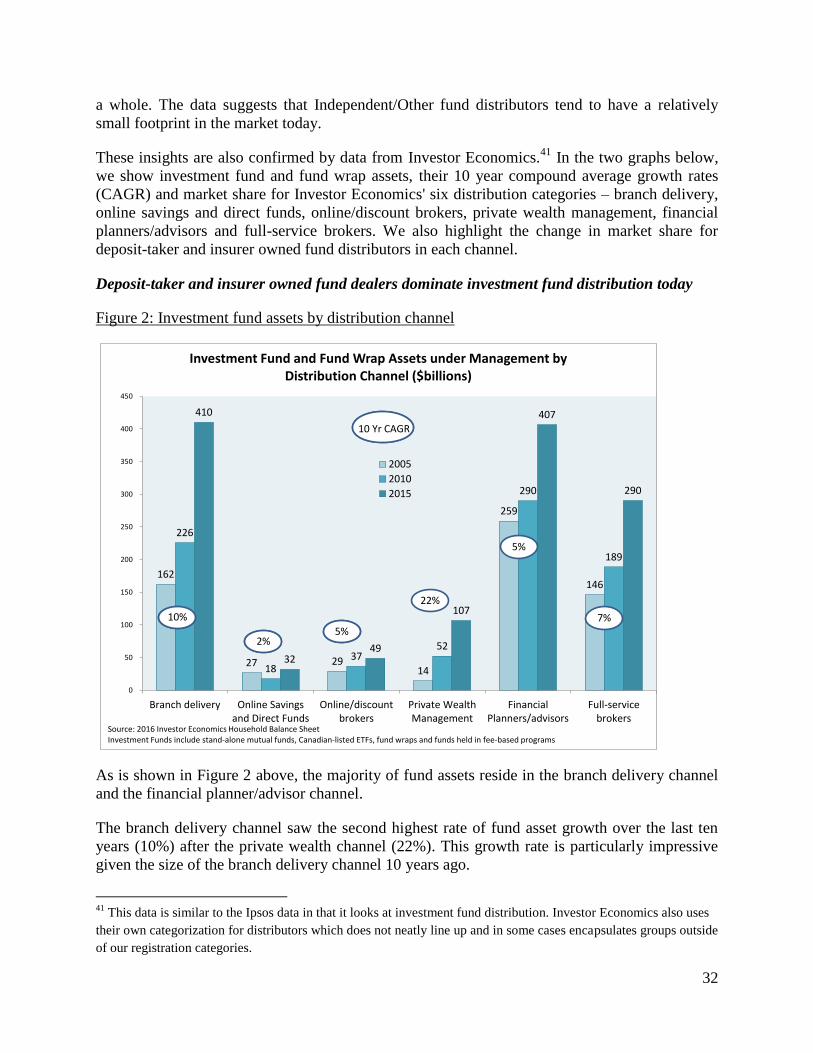
32
a whole. The data suggests that Independent/Other fund distributors tend to have a relatively
small footprint in the market today.
These insights are also confirmed by data from Investor Economics.41
In the two graphs below,
we show investment fund and fund wrap assets, their 10 year compound average growth rates
(CAGR) and market share for Investor Economics' six distribution categories – branch delivery,
online savings and direct funds, online/discount brokers, private wealth management, financial
planners/advisors and full-service brokers. We also highlight the change in market share for
deposit-taker and insurer owned fund distributors in each channel.
Deposit-taker and insurer owned fund dealers dominate investment fund distribution today
Figure 2: Investment fund assets by distribution channel
As is shown in Figure 2 above, the majority of fund assets reside in the branch delivery channel
and the financial planner/advisor channel.
The branch delivery channel saw the second highest rate of fund asset growth over the last ten
years (10%) after the private wealth channel (22%). This growth rate is particularly impressive
given the size of the branch delivery channel 10 years ago.
41
This data is similar to the Ipsos data in that it looks at investment fund distribution. Investor Economics also uses
their own categorization for distributors which does not neatly line up and in some cases encapsulates groups outside
of our registration categories.
162
27 29 14
259
146
226
18 37
52
290
189
410
32 49
107
407
290
0
50
100
150
200
250
300
350
400
450
Branch delivery Online Savingsand Direct Funds
Online/discountbrokers
Private WealthManagement
FinancialPlanners/advisors
Full-servicebrokers
Investment Fund and Fund Wrap Assets under Management by Distribution Channel ($billions)
2005
2010
2015
Source: 2016 Investor Economics Household Balance SheetInvestment Funds include stand-alone mutual funds, Canadian-listed ETFs, fund wraps and funds held in fee-based programs
10 Yr CAGR
10%
10%
10%
10 Yr CAGR
2%
10%
5%
22%
5%
7%

33
The financial planner/advisor channel42
, which had possessed the largest share of investment
fund assets ten years ago, was still the second most important distribution channel at the end of
2015 but had grown much slower than all but the online savings and direct funds and the
online/discount brokerage channels. Investment fund asset growth in the financial
planner/advisor channel was also slower (5%) than in the full-service brokerage channel over the
period (7%). Growth of investment fund assets in the full-service broker channel in particular
was driven by a number of factors including the growth in fee-based account usage and in the
share of investment funds used in these accounts.43
Figure 3: Investment fund assets market share by distribution channel and dealer type
The relative growth of investment fund assets in the financial planner/advisor channel is
noteworthy because this is where the majority of independent mutual fund dealers are captured.
As shown in Figure 3 above, at the end of 2015, the financial planner/advisor channel was the
only channel where the deposit-taker/insurer share of investment fund assets was below 55%.
Although, even in that channel, there has been an increase in deposit-taker and insurer ownership
over the last ten years, increasing from 47% to 53% of investment fund assets in the channel.
42
The financial planner/advisor channel is probably the most heterogeneous of Investor Economics' distribution
channels. It is made up of non deposit-taker mutual fund dealers, non-registered financial planning firms, insurance
firms and some ‘fund-centric’ IIROC firms.
43 Investor Economics, Retail Brokerage and Distribution Advisory Service, (various years) as well as data series
from these reports requested by OSC staff.
25%
4%(14%)
5%(98%) 2%
(87%)
41%(47%)
23%(78%)
69%
28%
2%(67%)
5%(98%)
6%(69%)
36%(49%)
23%(80%)
74%
32%
2%(58%)
4%(97%)
8%(67%)
31%(53%)
22%(84%)
78%
0%
10%
20%
30%
40%
50%
60%
70%
80%
90%
Branch Delivery Online Savings andDirect Funds
Online/DiscountBrokers
Private WealthManagement
FinancialPlanners/Advisors
Full-Service Brokers Total Deposit-Taker/Insurer Share
(All Channels)
% o
f to
tal i
nve
stm
en
t fu
nd
an
d f
un
d w
rap
ass
ets
Investment Fund and Fund Wrap Assets Market Share by Distribution Channel
2005
2010
2015
Source: 2016 Investor Economics Household Balance SheetInvestment Funds include stand-alone mutual funds, Canadian-listed ETFs, fund wraps and funds held in fee-based programs
By definition 100%
Channel Market Share(Deposit-taker/Insurer owned dealer
share of fund assets in channel)

34
As also highlighted in Figure 3, the branch delivery and full-service brokerage channels which
had the second and third highest average annual growth over the last ten years, also had
significant deposit-taker and insurer ownership at the end of 2015 (the former category is by
definition 100% deposit-taker owned distribution).
At the end of 2015, the branch delivery channel held 32% of total investment fund assets, up
from 25% ten years earlier. Much of that growth in market share came at the expense of the
financial planner/advisor channel which saw its share of market decline from 41% to 31% over
the period. The full-service broker channel saw its investment fund market share remain
essentially constant while deposit-taker and insurer owned share of that channel increased from
78% to 84%. In total, at the end of 2015, deposit-taker and insurer owned dealers administered
78% of the investment fund and fund wrap assets held by Canadian households, up from 69% ten
years earlier. In dollars, investment fund assets held through deposit-taker and insurer owned
dealers, across all channels, increased from $443 billion in 2005 to $1 trillion at the end of 2015.
Next, we turn to data from the MFDA and IIROC in order get a sense of whether or not the
insights from the Investor Economics and Ipsos data, which focused on investment fund
distribution, carry over to retail securities distribution generally.
i. MFDA Channel
As outlined above in our review of the Ipsos Canadian Financial Monitor data and the Investor
Economics Household Balance Sheet data, deposit-taker and insurer owned dealers have a strong
market presence in the fund industry. This presence also extends across specific registration
channels with deposit-taker and insurer owned dealers administering the largest share of assets in
the MFDA and IIROC channels.
95% of assets in the MFDA channel are administered by integrated dealers44
Table 9: MFDA member assets and approved persons by dealer type45
44
An “integrated dealer” is a dealer that is owned by or affiliated with an investment fund manager.
45 In addition to the fund dealers which were members of the MFDA at the end of 2015, we note that there were also
21 mutual fund dealers in Québec that were not members of the MFDA and that employed 700 representatives. 71%
of these dealers were independent and employed 83% of the representatives.
MFDA Member Type # Members % of Total
Assets Under
Admin $B % of Total
# Approved
Persons % of Total
Independent 60 61% 29.1 5% 3,399 4%
Integrated 39 39% 552.7 95% 77,970 96%
Of which,
Bank 15 15% 349.1 60% 52,167 64%
Insurer 10 10% 177.0 30% 23,893 29%
Other 12 12% 25.5 4% 1,881 2%
Association 2 2% 1.1 0.2% 29 0.04%
Of which,
Proprietary Only 20 20% 403.3 69% 54,458 67%
Proprietary and Third Party 19 19% 149.4 26% 23,512 29%
Total 99 100% 581.9 100% 81,369 100%
Source: Mutual Fund Dealers Association at December 2015, OSC categorizations

35
The MFDA channel is fairly concentrated and highly integrated. At the end of 2015, there were a
large number of both integrated and independent firms in the channel with the majority of firms
being independent of asset management. However, the majority of the assets in the channel and
approved persons employed were at the integrated firms. At the end of 2015, integrated MFDA
firms administered 95% of assets and employed 96% of approved persons in the channel.
90% of assets in the MFDA channel are administered by deposit-taker and insurer owned
dealers
The 25 deposit-taker owned and insurer owned MFDA firms administered 90% of assets and
employed 93% of approved persons. Independent/Other46
MFDA firms, while making up 73% of
firms in the channel, administered only 9% of assets and employed 6% of approved persons.
Independent MFDA dealers have tended to serve higher-wealth clients
Independent MFDA dealers have tended to serve higher-wealth clients while deposit-
taker/insurer owned firms have tended to serve all client types.47
Deposit-taker/insurer owned
dealers had traditionally focused on clients with investable assets up to $250,000 but have
increasingly focused on more affluent clients. Typically, mass-market clients will be serviced by
front line representatives at the branch, while those with investable assets above $100,000 will be
serviced by ‘financial planners’48
at the branch. Clients with assets above $1 million or more will
typically be referred to the related IIROC dealer or the related private wealth management arm
for service.
For independent/other MFDA firms, typically they will not take on clients unless they have at
least $100,000 in investable assets. This information, coupled with our analysis of the Ipsos data,
suggests that the majority of households (particularly mass-market households) will be working
with a deposit-taker or insurer owned MFDA dealer.
The majority of assets in the MFDA channel today are administered by dealers that focus on
proprietary funds
Given that the majority of integrated mutual fund dealer firms limit their product shelf primarily
to proprietary products49
, this restriction also implies that the majority of mass-market
46
Similar to the Ipsos analysis, “Other” MFDA firms refer to dealers that are owned by non-deposit-taker and non-
insurer asset managers. We group Independent and Other firms together here as this is typically what commentators
refer to as ‘independent’ fund distributors.
47 Information in this section comes from Investor Economics Retail Brokerage Reports as well as OSC review of
mutual fund dealers.
48 Financial planners within the branch will typically have attained a financial planning qualification such as the
Personal Financial Planner (PFP) designation through the Canadian Securities Institute, the Certified Financial
Planner (CFP) designation through the Financial Planning Standards Council or the Institut québécois de la
planification financière.
49 MFDA dealers with 80% or more of their mutual fund assets held in funds managed by an affiliate were
considered proprietary only.

36
households are primarily sold proprietary products. At the end of 2015, 69% of assets in the
MFDA channel were held at dealers that focused primarily on proprietary products.
The majority of investment fund owning mass-market households are working with
representatives that are not compensated by commissions
For many integrated fund dealers and in particular for the deposit-taker owned fund dealers,
compensation for the representative is not derived from commissions but rather through non-
activity based transfer payments from affiliated corporate entities.50
Given that deposit-taker
owned fund dealers administered 60% of the assets and employed 64% of approved persons in
the channel at the end of 2015 and that these firms tend to service the majority of households
with modest levels of investable assets, the majority of mass-market investors today are working
with representatives that are not compensated via embedded commissions.
ii. IIROC Channel
95% of retail assets in the IIROC channel are administered by integrated firms
Table 10: IIROC member assets and approved persons by dealer type
The IIROC channel also has a wide range of both integrated and independent dealers. At the end
of 2015, integrated IIROC firms administered 95% of assets51
and employed 89% of approved
persons in the channel. Independent dealers – when one includes the ‘other integrated’ dealer
category, made up 80% of firms, administered 20% of assets and employed 32% of approved
persons at the end of 2015. Deposit-taker and insurer owned dealers, while only making up 18%
of firms, administered 79% of assets and employed 66% of approved persons.
50
See the discussion in MFDA Bulletin #0689-P, supra note 24 for an explanation.
51 IIROC representatives may deal in a wider range of securities compared to dealer representatives in the MFDA
channel, thus assets here will include not only mutual funds but also equities, fixed income, ETFs and in some cases
options and other derivatives.
IIROC Member Type* # Members % of Total
Assets Under
Admin $B % of Total
# Approved
Persons % of Total
Independent 46 45% 90 5% 2,895 11%
Integrated 56 55% 1,878 95% 22,383 89%
Of which,
Deposit-taker 14 14% 1,515 77% 15,291 60%
Insurer 4 4% 33 2% 1,361 5%
Other 36 35% 306 16% 5,198 21%
Association 2 2% 24 1% 533 2%
Of which,
Proprietary Only 8 8% 6 0.3% 126 0.5%
Proprietary and Third Party 48 47% 1,872 95% 22,257 88%
Total 102 100% 1,968 100% 25,278 100%
Source: Investment Industry Regulatory Organization of Canada at December 2015, OSC categorizations
*Note: Only IIROC members categorized as Retail, Managed Account, Integrated and Discount Broker are included. Total assets
for each firm include both retail and institutional client assets.

37
The IIROC channel is almost entirely “open shelf” today
While slightly less concentrated among integrated dealers than the MFDA channel (where
independent and other integrated firms administered 10% of assets) the IIROC channel is still
dominated by the deposit-taker owned dealers. Where the two channels differ is with respect to
the level of related party product distribution. While the deposit-taker and insurer owned MFDA
firms primarily distribute proprietary funds, their counterparts in the IIROC channel are
primarily open shelf largely due to the types of representatives employed in this channel. Almost
100% of integrated IIROC firms offer proprietary and third party products. IIROC
representatives also have more flexibility and are able to offer a wider variety of security types.
Therefore, IIROC representatives tend to be more independent than their MFDA counterparts,
even if they are working for a firm that offers their own mutual funds, making them and the
whole channel less focused on the sale of proprietary products including proprietary funds.52
Deposit-taker-owned IIROC dealers also tend to differ in their methods of compensating
representatives relative to their mutual fund dealer peers owned by deposit-takers.
Representatives employed by deposit-taker owned IIROC dealers tend to be compensated via
commission grid while their counterparts at deposit-taker owned MFDA dealers are typically
compensated via salary plus a performance bonus which may impact the way in which the firm
can incent behavior in the two channels.
IIROC representatives also tend to be more selective regarding their clientele. IIROC dealers
typically aim to service households with investable assets of $500,000 or more, although some
IIROC dealers will service clients with lower investable assets.53
This fact, coupled with what we
have highlighted from the Ipsos data, suggests that the potential market for the IIROC channel is
roughly 6% to 14% of households. These households are typically the wealthiest households in
Canada which is one of the reasons why retail assets under administration in this channel are
over three times the size of assets in the MFDA channel. The IIROC channel administers more
assets but services fewer households than the MFDA channel.
52
Information in this section comes from Investor Economics and the CSA review of advisor compensation
practices. See for example, the following main stories from Investor Economics, Retail Brokerage and Distribution
Advisory Service: “Investment fund attraction still strong in full-service brokerage channel,” Spring 2011;
“Accessing today’s and tomorrow’s distribution paradigm,” Spring 2012; “Profitability Update: Gauging the
Changing Influence of Revenue Costs and Compensation on the Industry’s Bottom Line,” Summer 2012; “Branch
Advice: Managing Growth and Success into the Future,” Fall 2012; “Mutual Funds in Full-service Brokerage—
Either Ride the Fee-based Wave or Be Pulled Under by It!,” Summer 2016.
53 Investor Economics, Retail Brokerage Report, Winter 2012.

38
Table 11: Combined MFDA and IIROC member assets and approved persons by dealer type
We can see that in total, 95% of the assets under administration in Canada are administered by
integrated firms. 16% of these assets are administered by dealers that primarily offer proprietary
products. As explained above, dealers that only offer proprietary products are concentrated in the
MFDA channel. Deposit-taker and insurer owned dealer firms administered 81% of the assets
and employed 87% of approved persons. We also note that, at the end of 2015, there were
106,647 registered representatives just in the MFDA and IIROC channels alone54
servicing a
total population of 35.8 million Canadians. This equates to one representative for every 336
Canadians.
By way of comparison, in 2011, the year before the Retail Distribution Review (RDR) reforms
were implemented in the United Kingdom (see Appendix C for an overview of the RDR
reforms), there were 40,566 advisers registered55
servicing a total population of 63 million (one
advisor for 1,553 people) and only 21% of these advisers were employed by a bank or building
society.56
This comparison suggests that Canadian investors currently have access to a relatively large
number of representatives, particularly in the deposit-taker owned channel. 63% of the
54
This does not include portfolio manager and exempt market dealer registrants, although it is fair to say that this
number would cover retail securities advice. Note that we have also not included those registered to sell insurance.
55Association of Professional Financial Advisers, The Financial Adviser Market: In Numbers, 2015, page 5,
http://www.apfa.net/documents/publications/financial-adviser-market/apfa-the-financial-adviser-market-in-
numbers-v4.0.pdf.
56 If Canada was to see the same post-ban decline that was experienced in the U.K. - a 23% decline, 3 years after the
ban - we would still have a representative coverage rate close to four times the rate per capita in the U.K pre-RDR.
Total MFDA and IIROC # Members % of Total
Assets Under
Admin $B % of Total
# Approved
Persons % of Total
Independent 106 53% 119.6 5% 6,294 6%
Integrated 95 47% 2,430.6 95% 100,353 94%
Of which,
Deposit-taker 29 14% 1,864.1 73% 67,458 63%
Insurer 14 7% 209.7 8% 25,254 24%
Other 48 24% 331.3 13% 7,079 7%
Association 4 2.0% 25.6 1.0% 562 0.5%
Of which,
Proprietary Only 28 14% 408.9 16% 54,584 51%
Proprietary and Third Party 67 33% 2,021.8 79% 45,769 43%
Total 201 100% 2,550.3 100% 106,647 100%
Sources: Mutual Fund Dealers Association at December 2015, OSC categorizations
Investment Industry Regulatory Organization of Canada at December 2015, OSC categorizations
*Note: Only IIROC members categorized as Retail, Managed Account, Integrated and Discount Broker are included. Total assets
for each firm include both retail and institutional client assets.

39
representatives were employed by a deposit-taker owned dealer and a further 24% were
employed by an insurer owned dealer.
It also suggests that the distribution landscape in Canada is relatively more concentrated and
vertically integrated than is the distribution landscape in the United Kingdom.57
In the next section, we take a closer look at the online/discount brokerage channel – the non-
advised market for funds.
iii. Online/Discount Brokerage Channel
Table 12: Online/discount brokerage assets under administration
The online/discount brokerage channel shows a lower use of investment funds relative to other
channels. As shown in Table 12 above, investment funds’ share of total assets in the
online/discount brokerage channel has been constant over the last five years, remaining at
approximately 17% of channel assets over that period. In contrast, investment funds’ share of
assets in the financial planner/advisor and branch delivery channels stood at 78% and 33%
respectively of channel assets at December 2015.58
In total, there was $330 billion held by do-it-
yourself (DIY) investors in the online/discount brokerage channel at December 2015.
ETFs have become more popular over time with DIY investors
Table 13: Investment funds in the online/discount brokerage channel
ETFs have always been popular with DIY investors and they have become more popular over
time. While the share of investment funds held within the online/discount brokerage channel has
57
For example, at 2012, before RDR was introduced, bank and insurer owned advisory firms serviced only 41% of
advised individuals. See, Deloitte, Bridging the advice gap: Developing investment products in a post-RDR world
(2012), https://www2.deloitte.com/content/dam/Deloitte/uk/Documents/financial-services/deloitte-uk-fs-rdr-
bridging-the-advice-gap.pdf.
58 Investor Economics, 2016 Household Balance Sheet, page 141.
Online/Discount Brokerage Channel
$Millions Dec 2011 Dec 2012 Dec 2013 Dec 2014 Dec 2015
Investment Fund Assets held in Online/Discount Brokerage 38,706 42,607 47,398 55,109 56,516
Total Online/Discount Brokerage Assets under Administration 231,560 254,480 292,606 324,665 330,448
Investment Fund % Share 17% 17% 16% 17% 17%
Source: Investor Economics
Online/Discount Brokerage Investment Funds
$Millions Dec 2011 Dec 2012 Dec 2013 Dec 2014 Dec 2015
Mutual Funds 26,059 26,083 27,893 29,792 30,227
Exchange Traded Funds (ETF) 12,647 16,524 19,505 25,317 26,289
Investment Funds Total 38,706 42,607 47,398 55,109 56,516
ETF % Share 33% 39% 41% 46% 47%
Source: Investor Economics
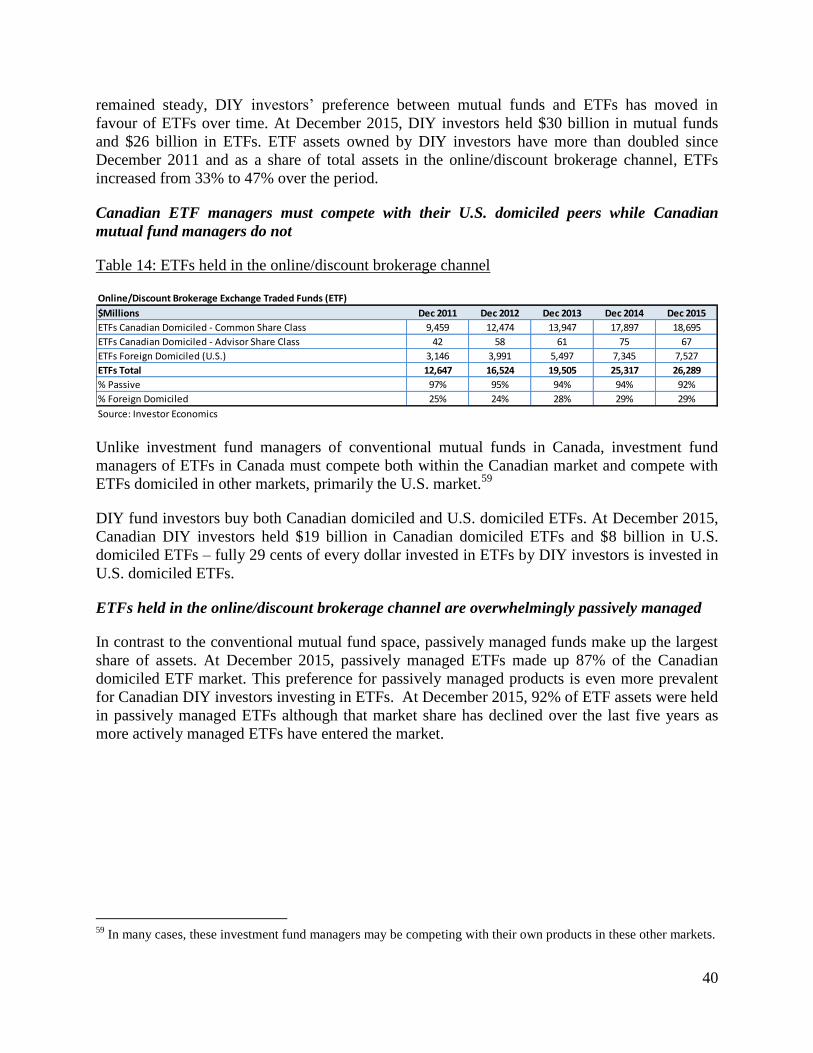
40
remained steady, DIY investors’ preference between mutual funds and ETFs has moved in
favour of ETFs over time. At December 2015, DIY investors held $30 billion in mutual funds
and $26 billion in ETFs. ETF assets owned by DIY investors have more than doubled since
December 2011 and as a share of total assets in the online/discount brokerage channel, ETFs
increased from 33% to 47% over the period.
Canadian ETF managers must compete with their U.S. domiciled peers while Canadian
mutual fund managers do not
Table 14: ETFs held in the online/discount brokerage channel
Unlike investment fund managers of conventional mutual funds in Canada, investment fund
managers of ETFs in Canada must compete both within the Canadian market and compete with
ETFs domiciled in other markets, primarily the U.S. market.59
DIY fund investors buy both Canadian domiciled and U.S. domiciled ETFs. At December 2015,
Canadian DIY investors held $19 billion in Canadian domiciled ETFs and $8 billion in U.S.
domiciled ETFs – fully 29 cents of every dollar invested in ETFs by DIY investors is invested in
U.S. domiciled ETFs.
ETFs held in the online/discount brokerage channel are overwhelmingly passively managed
In contrast to the conventional mutual fund space, passively managed funds make up the largest
share of assets. At December 2015, passively managed ETFs made up 87% of the Canadian
domiciled ETF market. This preference for passively managed products is even more prevalent
for Canadian DIY investors investing in ETFs. At December 2015, 92% of ETF assets were held
in passively managed ETFs although that market share has declined over the last five years as
more actively managed ETFs have entered the market.
59
In many cases, these investment fund managers may be competing with their own products in these other markets.
Online/Discount Brokerage Exchange Traded Funds (ETF)
$Millions Dec 2011 Dec 2012 Dec 2013 Dec 2014 Dec 2015
ETFs Canadian Domiciled - Common Share Class 9,459 12,474 13,947 17,897 18,695
ETFs Canadian Domiciled - Advisor Share Class 42 58 61 75 67
ETFs Foreign Domiciled (U.S.) 3,146 3,991 5,497 7,345 7,527
ETFs Total 12,647 16,524 19,505 25,317 26,289
% Passive 97% 95% 94% 94% 92%
% Foreign Domiciled 25% 24% 28% 29% 29%
Source: Investor Economics

41
The majority of DIY investors investing in mutual funds pay full trailing commission despite
not receiving advice
Table 15: Do-it-yourself mutual funds
If we look more closely at the types of mutual fund series sold through the online/discount
brokerage channel, we see that the majority of fund series sold are the full trailing commission
fund series despite the increased availability of Discount/DIY fund series (typically denoted “D”
series) 60
in the market. Consequently, many DIY mutual fund investors in the online/discount
brokerage channel indirectly pay for services they do not receive.
Assets held in the Discount/DIY mutual fund series are however slowly increasing. These assets
totaled $12 billion at December 2015 up from $11 billion in December 2011, although by the
most recent estimate, the majority of these assets were not held in the online/discount brokerage
channel. At the end of 2015, it is estimated that out of the total $12 billion of Discount/DIY fund
series assets, only $4.6 billion was actually held in the online/discount brokerage channel.61
This
data suggests that $25 billion of the total $30 billion held in mutual funds in the channel (83%)
remains in the full trailing commission paying fund series.
As is the case for many DIY mutual fund investors in the online/discount brokerage channel,
there are also some DIY ETF investors that indirectly pay trailing commissions without
receiving advice because they hold the trailing commission paying “Advisor” class units of the
ETF.62
However, the amount of assets held in these “Advisor” class units is relatively low (only
60
Some investment fund managers offer a series (typically Series D) of their funds that is designed for
Discount/DIY investors. These fund series pay a much lower trailing commission than do the traditional full service
retail series (typically 25 bps compared to 100 bps for the traditional full service retail series of an equity fund) to
account for the fact that no advice is provided to investors in the online/discount brokerage channel. This is further
discussed in Appendix A.
61
Investor Economics estimate. The remaining $7.4 billion of DIY series assets was purchased directly by investors
outside of the online/discount brokerage channel.
62 Advisor class units that are offered by some ETF providers are designed for advised investors and are meant to be
purchased through an advisor. The only difference between this class of units and the common class units is the
trailing commission component (or alternatively denoted the “service fee” component) embedded in the
management fee of the Advisor class.
We do not know if these holdings of Advisor class units in the online/discount brokerage channel are a consequence
of previously advised assets transferring in or are due to investor error. However, we note that some discount
brokerages do make Advisor class units available for trade on their platforms.
Low Cost/Discount Brokerage Fund Series (Series D)
$Millions Dec 2011 Dec 2012 Dec 2013 Dec 2014 Dec 2015
Total 10,746 10,705 10,752 11,961 11,957
% Passive 6% 9% 12% 14% 16%
Estimated amount of Series D in the Online/Discount Brokerage at the end of 2015 - 4.6 Billion
Source: Investor Economics
Mutual Funds (Series D)

42
$67 million at December 2015) in comparison to the share of full trailing commission paying
mutual funds in the online/discount brokerage channel.
Finally, we note that unadvised fund investors as a group (those buying Discount/DIY fund
series) have a higher share of assets invested in passively managed mutual funds relative to
advised mutual fund investors.
At the end of 2015, 1.5% of total mutual fund assets (excluding ETFs) were held in passively
managed funds. Index fund market share has remained essentially unchanged over the last 10
years. However among the relatively new Discount/DIY fund series, index funds made up a
much larger share of assets (16% or $2 billion) that has been growing steadily over time.63
Figure 4: Index mutual funds in Canada
We now turn our attention to some important facts about investment fund managers.
63
Some have argued that while index mutual fund ownership among advised investors is perennially low in Canada,
index fund usage by Canadians is substantially higher when one includes the index-tracking ETFs held by
Canadians. In fact, within the full service brokerage channel, of the $47 billion in ETFs held in this channel only $17
billion was held by clients of commission-based advisors (not all of which was held in index tracking ETFs). The
remaining $29 billion was held by clients of fee-based advisors. Source: Investor Economics ETF and Index Fund
Report 2016 Q2.
5.5
13.512.5
7.3
18.8
1.6%
2.9%
1.3%
1.5%
0.0%
0.5%
1.0%
1.5%
2.0%
2.5%
3.0%
3.5%
2
4
6
8
10
12
14
16
18
20
Jan
1999
Jan
2000
Jan
2001
Jan
2002
Jan
2003
Jan
2004
Jan
2005
Jan
2006
Jan
2007
Jan
2008
Jan
2009
Jan
2010
Jan
2011
Jan
2012
Jan
2013
Jan
2014
Jan
2015
Jan
2016
Shar
e o
f To
tal M
utu
al F
un
d M
arke
t (%
)
Ass
ets
$Bill
ion
s
Index Mutual Fund Assets and Market Share
Source: Investor Economics
Assets
Market Share

43
c. Investment Fund Management
Mutual funds are by far the dominant type of investment fund sold in Canada today. This has
been the case since organized investment fund asset monitoring in Canada started in the early
1990s. At the end of 2015, Canadians held $1.2 trillion in mutual fund assets, $90 billion in ETF
assets, $110 billion in segregated fund64
assets, $172 billion in group segregated fund assets, and
$199 billion in pooled fund, closed end funds and alternative fund assets. Although there have
been articles at various times in the past regarding the growth of ETFs and segregated funds, and
despite impressive annual growth rates for ETFs, the dominance of mutual funds has never been
challenged in a significant way. 65
Figure 5: Investment funds by fund type
64
Segregated Fund - a separate and distinct group of assets (fund) maintained by an insurer in respect of which the
non-guaranteed benefits of a variable insurance contract are provided. Source: Canadian Life and Health Insurance
Association (CLHIA) Guideline G2 – Individual Variable Insurance Contracts Relating to Segregated Funds;
Autorité des marchés financiers, Guideline on Individual Variable Insurance Contracts relating to Segregated Funds,
January 2011.
65 See for example, Rob Carrick, “Segregated funds on the rise: Seven key things you need to know”, Globe and
Mail, May 29, 2015.
772
603
1285 58 63
1,559
1,203
90
199
110172
0
200
400
600
800
1000
1200
1400
1600
1800
Total InvestmentFunds (double-
counting removed)
Mutual Funds(ex-ETFs)
ETFs Pooled funds,closed-end fundsand alternatives
Segregated funds* Group segregatedfunds*
$B
illio
ns
Investment Funds in Canada
2005
2015
Source: 2016 Investor Economics Household Balance Sheet*Segregated funds and group segregated funds are not securities and therefore are not governed by securities lawNote: Fund assets do not sum to total due to fund wrapping.
7.3%
7.2%22.3%
8.9%6.6% 10.9%
10 Yr CAGR

44
Fund management is concentrated but is less concentrated than fund distribution
Table 16: Mutual funds by investment fund manager type
Similar to what we found with the Ipsos, Investor Economics, IIROC and MFDA data, the
investment fund manager market in Canada is dominated by the deposit-taker and insurer owned
fund managers. At the end of 2015, integrated investment fund managers66
made up 42% of the
firms but managed 78% of mutual fund assets. Deposit-taker and insurer owned investment fund
managers managed 64% of the mutual fund assets. We also note that 73% of all mutual fund
assets were managed by the 10 largest investment fund managers in Canada.67
While asset management is concentrated among the deposit-taker and insurer owned investment
fund managers, it is relatively less concentrated than distribution where deposit-taker and insurer
owned dealer firms administered 81% of assets in the combined IIROC and MFDA channel.
Using the traditional definition of independent investment fund manager which would
encompass both ‘Independent’ and ‘Other Integrated’ investment fund managers, these firms
managed 34% of industry assets.
66
An “integrated investment fund manager” is an investment fund manager that is affiliated with at least one dealer.
67 Sources: Investor Economics Insight, January 2016 Annual Review; SEDAR; SEC filings at December 2015;
OSC calculations.
IFM Type AUM $M % of Total #IFMs % of Total
Independent 288,619 22% 61 58%
Integrated 1,010,263 78% 44 42%
Of which,
Deposit-taker 625,598 48% 13 12%
Insurer 199,712 15% 9 9%
Other 150,065 12% 15 14%
Association 34,888 3% 7 7%
Total 1,298,882 100% 105 100%
Source: Investor Economics, SEDAR, SEC Filings at December 2015. OSC Categorizations

45
d. Fund Purchase Option Popularity
Figure 6: Mutual fund assets (ex-ETFs) by fund purchase option
25% of mutual fund assets (net of wrapping) are held in institutional/high net worth series
Figure 7: Mutual fund market share (ex-ETFs) by purchase option
205.4Back-end load
178.0
125.5
Front-end load298.3
14.0
Low load62.8
152.9
Retail No Load287.3
24.4
Direct to Client31.0
11.1
Fee-based68.7
Discount/E-banking4.5
169.5
Institutional/HNW**302.1
219.5Total deferred sales
charge
240.8
50
100
150
200
250
300
350
Dec 2006 Dec 2007 Dec 2008 Dec 2009 Dec 2010 Dec 2011 Dec 2012 Dec 2013 Dec 2014 Dec 2015
Fun
d P
urc
has
e O
pti
on
AU
M $
Bill
ion
s
Mutual Fund Assets By Purchase Option
Source: Investor Economics (various surveys)Load assets estimated from survey data collected from 19 fund companies representing 76% of industry assets**This category is reported as a residual to remove double-counting of the assets used in fund-of-fund products. Due to data constraints, assets held by high net worth investors cannot be broken out from assets held by true institutional investors.
29.2%
Back-end load14.4%
17.8%
Front-end load24.2%
2.0%
Low load5.1%
21.7%Retail No Load
23.3%
3.5%Direct to Client
2.5%1.6%
Fee-based5.6%
Discount/E-banking0.37%
24.1%
Institutional/HNW**24.5%
31.2%
Total deferred sales charge
19.5%
0%
5%
10%
15%
20%
25%
30%
35%
Dec 2006 Dec 2007 Dec 2008 Dec 2009 Dec 2010 Dec 2011 Dec 2012 Dec 2013 Dec 2014 Dec 2015
Fun
d P
urc
has
e O
pti
on
% M
arke
t Sh
are
Mutual Fund Assets By Purchase Option
Source: Investor Economics (various surveys)Load assets estimated from survey data collected from 19 fund companies representing 76% of industry assets**This category is reported as a residual to remove double-counting of the assets used in fund-of-fund products. Due to data constraints, assets held by high net worth investors cannot be broken out from assets held by true institutional investors.

46
We update fund assets by purchase option, a graph included in the Original Consultation Paper,
to show how fund purchase options have changed over the last few years.68
In terms of the types of fund purchase options available in the industry today, the
institutional/high net worth (HNW) purchase option, which typically does not pay trailing
commissions, made up the largest share of fund assets totaling $302 billion or 25% of market at
December 2015. HNW fund series assets have grown by 51% over the last five years.
The majority of mutual fund assets are still held in traditional fund series that include
embedded commissions
The front end purchase option69
was the second largest purchase option by assets with $298
billion or 24% of market at the end of 2015, growing 93% over the previous five years.
The retail no load purchase option – the option commonly offered within the branch network and
through some vertically integrated fund managers – was the third largest purchase option by
assets at $287 billion at December 2015, making up 23% of the market and growing 70% over
the last five years.
The back-end load and low-load purchase options, which are both a form of DSC purchase
option, remained a large component of industry assets at the end of 2015. Though DSC options
have been falling in terms of market share, assets in these series continue to grow.70
In total,
$241 billion was held in DSC options at the end of 2015, and these options grew 19% over the
last five years (largely due to the growth of low load fund series assets which grew 101% over
the last five years versus 3% for traditional back-end load series).71
It is still the case that trailing commission paying fund series make up the bulk of mutual fund
assets in Canada. At the end of 2015, trailing commission paying purchase options – back-end,
low load, front end, and retail no load – made up 67% of assets and increased by 58% over the
five years ending 2015.
68
CSA Discussion Paper and Request for Comment 81-407 Mutual fund fees, (2012), 35 OSCB, page 11248.
69 Although there are reports that many front end load funds are sold with 0% commissions, this is based on surveys
of investment fund managers rather than fund distributors. We still see many front end fund sales with commissions
in the market today. We would expect front-end sales commissions to continue to be charged in order to reflect
factors such as differences in the scope and timing of advice and services provided, and the experience and skill
level of the advisor, etc.
70 The decline in market share also masks its importance to certain investment fund managers and fund dealers
where DSC share of firm assets can be as high as 80% or more.
71 The Canadian fund market is unique in its relative reliance on DSC and low load options. While making up 20%
of mutual fund assets in Canada today, these options make up less than 1% of mutual fund assets in the United
States and Europe.

47
A small, but fast growing, share of mutual fund assets are held in fee-based purchase options
Fee-based purchase options remain a very small part of the mutual fund market, but they are
growing quickly. Fee-based fund series made up only $69 billion or 6% of industry assets at the
end of 2015. However, fee-based assets had the highest rate of increase over the five years
ending 2015, increasing by 248%.
Fee-based options, while growing quickly, remain a small part of the mutual fund market as
these purchase options are not available to all investors in all channels.
Not all purchase options are available to all investors in all channels
Given the number of series and purchase options available in the market, it may seem that
investors are provided a wide range of purchase options.72
However, not all (or in some cases not
many) purchase options are made available to all investors in all channels.
Figure 8 below lays out the availability of fund purchase options in Canada using the information
previously discussed regarding the MFDA and IIROC channels and data from Investor
Economics, Morningstar, and Ipsos. Availability of products and purchase options tend to vary
by the level of investable assets, by distribution channel, and by distributor type.
Mass-market households will typically choose between the purchase of proprietary funds with
advice73
or the full universe of fund products (and securities generally) with no advice, and may
have limited access to certain other purchase options, such as fee-based options.
Dealers that offer an open shelf of fund products typically service investors with $100,000 or
more in investable assets. Investors that do not want proprietary funds may have to forgo advice
and purchase through a DIY channel. As previously discussed, despite the availability of
Discount/DIY purchase options, the majority of online/discount brokerage channel purchase
options will be sold under the no load or front end (with front end commission waived) options
with the same rate of trailing commission paid as the fully advised channel.
Fee-based purchase options are typically not available for mass-market households. In terms of
the purchase options available to mass-market households, all purchase options (no load, DSC
purchase options and front end load) except for fee-based options are generally available. If the
fund investor is investing through a deposit-taker owned mutual fund dealer, the investor will
typically be offered a no load purchase option. If the investor is working with an insurer owned
mutual fund dealer, the investor will typically be offered front end, no load and DSC purchase
options. Fund investors with little to invest are the most likely to be offered DSC purchase
72
See page 1 of Investment Funds Institute of Canada, Paying for Advice: Why Options are Important, August 2014
for example.
73 We note that there tends to be more variation with respect to the use of proprietary products across insurer owned
fund dealers relative to deposit-taker owned fund dealers, with some offering primarily proprietary products and
others offering a wider universe of both proprietary and non-proprietary products. However, it is not clear that
insurer owned fund dealers offering a wider universe of products target mass-market households.

48
options and some firms primarily offer their clients DSC options.74
The dealer will typically
choose which purchase options to make available and if multiple options are made available, the
representative will choose which of these options are presented to the client depending on their
needs and the representative’s revenue requirements.
Fund investors typically gain access to advice and a wider range of product options as their
investable assets increase. For mid-market households, those with investable assets between
$100,000 and $500,000, there will be a wider range of products and types of advisor available.
These investors can choose to invest through a deposit-taker owned or insurer owned mutual
fund dealer focused on proprietary products or an independent mutual fund dealer offering the
full universe of fund products.75
They will also be able to invest in a wider range of investment
fund and non-investment fund securities through an IIROC dealer.
Fee-based purchase options have historically been limited for mid-market households, although
access to these options has begun to increase recently.76
When purchasing through a deposit-
taker owned mutual fund dealer, mid-market households will typically be offered a no load
option. When purchasing through other mutual fund dealers or through independent IIROC
dealers, mid-market households will typically be offered front end, no load and DSC options.
These investors also have the option of foregoing advice and choosing to purchase their funds
directly without trailing commissions through direct-to-client purchase options77
offered by some
investment fund managers.
Those with large amounts of investable assets get access to advice, product options and a broader
choice in purchase options. Affluent households, those with investable assets above $500,000,
have access to all purchase options, product options and advisory options available in the market.
They can access a fee-based or commission-based advisor who can offer them the universe of
fund products (and other securities), or they can choose to work with a traditional commission-
based mutual fund dealer (who may also be a financial planner). Investors with $1 million or
more in investable assets can also work with a deposit-taker owned portfolio manager and those
74
We note that one of the largest integrated firms in Canada recently announced that they will discontinue offering
the DSC option. See Rudy Luukko, “Investors Group will eliminate deferred sales charge option”, Morningstar
Canada, September 19, 2016. We estimate that, based on assets at December 2015, this change will impact 25% of
total assets held in the DSC option.
75 Although open shelf fund dealers can offer the full universe of fund products, they will typically focus on a subset
of funds from a smaller list of preferred fund families. See for example, the 2015 Environics Advisor Perception
Study (http://environicsresearch.com/wp-content/uploads/2016/02/Infographic-E_FINAL.pdf).
76 See for example, Rudy Mezzetta, “Credential introduces fee-based product for mutual fund advisors”, Investment
Executive, January 26, 2016, and Rudy Luukko, “Investors Group eases into fee-based investing”, Morningstar
Canada, November 22, 2016. We also note that other deposit-takers have recently been slowly rolling out fee-based
options within their branch networks.
77 Purchase options that are offered by an investment fund manager that sells investment funds directly to investors
through a related mutual fund dealer via online or telephone access.

49
with investable assets above $500,000 can work with an independent portfolio manager firm
directly, typically through a fee-based arrangement.78
We have provided data and our analysis of the mutual fund and securities market in Canada
today. In the next section, we look at the anticipated effects if we transition away from embedded
commissions.
78
We note that the number of households working directly with portfolio managers is relatively low (i.e. below
200,000 households or less than 1% of all households). These firms also vary considerably in their usage of
investment funds.

50
Fig
ure
8:
Mutu
al f
und p
aym
ent
opti
ons
by c
han
nel
and a
ccount
size
Bro
adN
arro
w0
- $
10
0K
$5
00
k -
$1
M$
1M
+
De
po
sit-
take
r o
wn
ed
Insu
rer
ow
ne
d +
sm
all f
ee
-bas
ed
Ind
ep
en
de
nt/
Oth
er
Ind
ep
en
de
nt
FE/D
SC/L
L
De
po
sit-
take
r/In
sure
r o
wn
ed
Ind
ep
en
de
nt
PM
De
po
sit-
take
r/In
sure
r o
wn
ed
Fee
-bas
ed
/Ne
goti
able
NL
- n
o lo
ad, F
E -
fro
nt
en
d lo
ad, L
L -
low
load
, DSC
- d
efe
rre
d s
ale
s ch
arge
Pay
men
t o
pti
on
s fo
r re
tail
inve
sto
rs in
th
e C
anad
ian
mu
tual
fu
nd
mar
ket
tod
ay
Ch
ann
elA
cco
un
t Si
ze
$1
00
- $
50
0k
Wit
ho
ut
advi
ce
On
lin
e/D
isco
un
tN
L fu
ll t
rail
er/
NL
red
uce
d t
rail
er
(se
rie
s D
)
Dir
ect
-to
-cli
en
t
N
L n
o t
rail
er
(fe
e-b
ase
d)
typ
ical
ly $
10k
- $5
0k m
inim
um
FE/D
SC/L
L +
very
sm
all f
ee
-bas
ed
IIR
OC
FE/D
SC/L
L +
Fee
bas
ed
FE/D
SC/L
L +
Fee
bas
ed
Wit
h a
dvi
ce
Fee
-bas
ed
/Ne
goti
able
FE/D
SC/L
L/N
L -
Pro
pri
eta
ry s
old
an
d p
rop
rie
tary
on
lyM
FDA
NL
- P
rop
rie
tary
on
ly

51
2. Overall market impact of the discontinuation of embedded commissions
For the discussion that follows, unless otherwise indicated, we assume that the market has
transitioned away from embedded commissions and that current details about the market hold.
We also assume that the requirements in CRM2 and POS are fully implemented, and where
applicable, we discuss the implication of potential intersections between the discontinuation of
embedded commissions and the proposals set out in CSA CP 33-404.
i. Reduction in fund series and in fund fee complexity:
We anticipate that the number of fund series available in Canada would significantly decline as a
result of a transition away from embedded compensation. As also discussed in Appendix A, this
effect is expected because the vast majority of fund series available in the market today differ
only by the level and type of embedded compensation paid to the dealer.79
The transition away
from embedded commissions would make these series redundant given the embedded
commission free fund series (i.e. series F and high net worth fund series) that are already
available today.
Based on figures from Morningstar Direct at February 2016, if we were to eliminate the fund
series that include some form of embedded compensation from the market today, the total
number of fund series would fall from 13,899 to 4,901 – a 65% decline. This would significantly
simplify fund fee structures which are currently very complex and difficult for investors to
understand, as shown in Part 2. Fund series that remain would be larger on average after the
change. For example, using total industry assets at December 2015 ($1.2 trillion) and the number
of fund series that we estimate would remain after the discontinuation of embedded commissions
if it were to take immediate effect today (4,901), average assets per fund series would rise from
$86.6 million to $245.5 million – a 184% increase. We anticipate that this impact alone could
drive down fund costs.80
79
In addition to the number of fund series available, some fund series are available for purchase under more than
one purchase option (e.g. back end, low load, front end purchase options available within one fund series). Taking
into account available purchase options, there were 39,848 unique mutual fund series/purchase option combinations
available in Canada (source: FundSERV - mutual fund and fund wrap products) at the end of June 2016 and a total
of $1.3 trillion ($999 billion USD) invested in mutual funds (source: Investor Economics) at the end of June 2016.
In contrast, there were 32,555 unique fund series/purchase option combinations available in the United States
(source: Morningstar Direct) at the end of June 2016 and a total of $15.9 trillion invested in mutual funds (source:
Investment Company Institute) at the end of June 2016.
80 We also note that in some cases, investment fund managers today charge management fees on their series F that
are less than the management fees net of trailing commission for their retail – trailing commission paying - series. If
this pricing differential were to persist after the discontinuation of embedded commissions, then we would also
expect to see a decline in fees from this as well. We also note that some investment fund managers, recognizing the
extent of the complexity and confusion in the market, have already begun to rationalize their series offerings in order
to simplify the cost structures for advisors and investors and to reduce price discrimination (see for example R.
Luukko, “RBC flexes its muscle on fund fees”, Morningstar Canada, February 29, 2016; J. Hemeon, “TDAM
lowers management fees on certain funds series”, Investment Executive, November 22, 2016).

52
Accompanying the simplification and standardization of fund series would be a simplification of,
and amendments to, fund disclosure documents (fund facts, simplified prospectus, management
report of fund performance, etc.). We do not anticipate significant cost implications arising from
these amendments to fund disclosure documents.81
Rather, we anticipate that any costs incurred
would be offset by significantly lower ongoing fund series maintenance costs (in terms of both
disclosure documents and marketing materials).
We do not anticipate that any switches between series of the same fund that may occur as a
consequence of the simplification of fund series would have any financial or tax implications for
fund investors because, as is the case today for switches between fund series of the same fund,
these switches would not be considered a deemed disposition for tax purposes.
We do anticipate that, as is the case today with switches between series of the same fund, this
activity will generate many in-kind transactions or book adjustments on client account statements
that may require a conversation between the advisor and client to explain the occurrence or may
be accompanied by a notice from the investment fund manager and/or fund dealer. Each would
entail one-time costs.82
ii. New lower-cost product providers may enter the market:
We anticipate that new lower-cost product providers would enter the mutual fund market after a
transition away from embedded compensation. Some lower-cost mutual fund providers have
expressed to the CSA the view that embedded commissions function as a barrier to market
entry.83
We anticipate that these new product providers would enter the market with a wide range
of passively and actively managed mutual funds.
Based on an analysis of low-cost fund product provider pricing in other markets,84
while taking
into account pricing practices specific to Canada (e.g. tax differences such as the HST etc.), the
81
We anticipate these amendments to include only deletions from current disclosure documents and significant
simplification and removal of sections such as the dealer compensation from management fee section, etc. We
anticipate that investment fund managers will choose to merge assets into existing, and likely repriced, fund series
rather than launch new series.
82 We anticipate that these costs would be incurred in any case as the representative and client would need to
communicate and agree on a direct pay arrangement going forward.
83 See for example the transcript of OSC Roundtable Re Discussion Paper and Request for Comment 81-407 Mutual
Fund Fees (June 7, 2013) at p.98 - Question from Commissioner Deborah Leckman to Atul Tiwari, Managing
Director/Head of Canada for Vanguard Investments, infra note 201. Other evidence that embedded commissions
inhibit competition by creating barrier to entry is provided in Appendix A.
84 The estimates for low-cost manager pricing come from a cross-sectional regression of non-institutional
management fees and MERs controlling for fund size, domicile (U.S., Canada, U.K. Ireland, Australia), product
structure (ETF or mutual fund), broad asset class and management type (active or passive). Current fee-based fund
series pricing is for the Canadian fund market only. Currently, the average fixed income fund fee-based series MER
in Canada is 48 bps for an index tracking fund and 92 bps for an actively managed fund. The average equity fund
fee-based series MER in Canada is 77 bps for an index tracking fund and 124 bps for an actively managed fund. All
data is sourced from Morningstar Direct at July 2016.

53
estimates suggest that management expense ratios (MER) for index funds offered by these new
entrants could be up to 40 bps lower than average index fund costs today. Also, MERs for
actively managed funds offered by these new entrants could be up to 75 bps lower than average
actively managed fund costs today.
Aside from certain large low-cost product providers, it may be possible for smaller emerging
asset managers that have a good track record of risk-adjusted performance to enter the mutual
fund market (either through a public fund launch or through a sub-advisory relationship) after the
transition away from embedded commissions. Those managers that offer a distinct mandate or a
niche style - a comparative advantage – could have a greater chance of success in a post trailing
commission world as they would compete on their performance without the trailing commission
factor.
iii. Increased price competition / decrease in fund management costs:
Over time, the discontinuation of embedded commissions should curtail the incentive for mutual
fund dealers and their representatives to recommend products that give priority to maximizing
revenue over the interests of clients. Mutual fund dealers and their representatives are therefore
likely to focus more on fund performance and fund fee levels, which in turn will put pressure on
investment fund managers to improve their performance and reduce their fees. Investment fund
managers with affiliated mutual fund dealers are also likely to be affected by this pricing and
performance pressure over time.
The potential entrance of lower-cost product providers will likely increase the competitive
pressure to decrease fund management costs even further (if not also distribution costs)85
over
time. We anticipate that the impact of new entrants into the mutual fund market will lead to a
decline in the cost of existing funds as incumbent investment fund managers may adjust their
pricing to retain market share. Based on the estimates provided above for low-cost provider
pricing, we may see an MER decline of 25 to 50 bps for actively managed equity funds and 10 to
25 bps for actively managed fixed income funds shortly after the discontinuation of embedded
commissions.86
85
See for example, Victor Reklaitis, “The Vanguard effect on fund fees, in one handy table”, Market Watch,
November 16, 2015, http://www.marketwatch.com/story/the-vanguard-effect-on-fund-feeds-in-one-handy-table-
2015-11-13.
86 This estimate is based on incumbent investment fund managers reducing their existing fees by one third to two
thirds of the difference between their fees and those charged by new low-cost market entrants. Note, as well, that
we saw similar price declines after the entrance of low-cost ETF providers into the Canadian market in 2011 and in
reaction to competition from U.S. domiciled ETFs which were going through their own pricing war at about the
same time. Unlike the mutual fund market, the ETF market in Canada is open to competition from abroad.
Canadians routinely purchase U.S. domiciled ETFs. At March 2016, 27 cents of every retail dollar invested in ETFs
in Canada was held in a U.S. domiciled ETF.

54
iv. Shift in product recommendations to lower-cost / passively managed products:
It is reasonable to assume that the transition away from embedded commissions, coupled with
the growth of lower-cost passively managed fund products, will also likely drive a shift to lower-
cost passively managed funds in terms of the (i) product shelf chosen by dealers, (ii)
recommendations made by representatives, and (iii) funds chosen by mutual fund investors over
time. However, we are cautious regarding the extent and pace at which this shift would likely
occur. As noted earlier and in Appendix A, the Canadian mutual fund market (excluding ETFs)
is overwhelmingly focused on actively managed funds.87
While the level of trailing commissions
paid historically on index funds relative to actively managed funds was likely a driver of their
lack of popularity with fund dealers and representatives, we also acknowledge that it takes time
for habits to change.88
In addition, while there are several investment fund managers that have
offered and continue to offer index funds, they have historically not always ‘actively’ marketed
them.89
If we consider the experience in the U.K.,90
they began to see a significant increase in both sales
and assets held in index tracking funds several years before the RDR reforms were introduced in
January 1, 2013. According to data from the Investment Association, shown in Figure 9 below,
index tracking fund (“tracker funds”) market share began to significantly increase after 2009.91
Market share of index tracking funds increased from 6.3% to 12.4% and assets under
management increased by 251% (₤77 billion) between December 2009 and December 2015.
87
While the mutual fund industry launches an average of about 200 funds a year, the most recent index fund launch
was in 2013.
88 Recent research highlighting the sub-optimality of the investment choices made by financial advisors for their
portfolios suggests that established beliefs coupled with a lack of proficiency can be significant obstacles to change
(See Juhani T. Linnainmaa, Brian T. Melzer, and Allessandro Previtero, “Costly Financial Advice: Conflicts of
Interest or Misguided Beliefs?”, December 2015,
http://faculty.chicagobooth.edu/juhani.linnainmaa/MisguidedBeliefs.pdf). It’s not clear from this research however
how much of this product bias might be driven by the dealer’s decisions regarding the product shelf. We know that
the majority of mutual fund dealers in Canada are either proprietary only or are proprietary focused.
89 See for example, Rob Carrick, “TD's e-series funds: Easy to love, hard to buy”, Globe and Mail, May 9, 2011;
Dan Bartolotti, “More Fun With the TD e-Series Funds”, Money Sense Magazine Online, September 23, 2010; Dan
Bartolotti, “TD Responds to e-Series Concerns”, Money Sense Magazine Online, August 20, 2010.
90 As mentioned in Part 1, while the analysis of relevant reforms in other jurisdiction is informative and insightful,
the unique features of those markets, including the characteristics of their respective market participants and the
specific competitive dynamics within which they operate, their market structure, the savings habits of their local
investors, as well as the extent of their respective reforms, the specific impacts from the reforms in those
jurisdictions might not be the same for the Canadian market.
91 While final rules and guidance for the U.K.’s RDR reforms were released in March 2010, they were announced
well before this date which allowed the securities industry to adjust in anticipation of the change (see for example,
David Ricketts, “Rapidly evolving online platforms face competition”, Financial Times, September 7, 2008).

55
Figure 9: Growth of Tracker Funds in the United Kingdom
If we were to see a similar increase in the run up to the discontinuation of embedded
commissions in Canada, we would expect index fund market share to increase from their current
share of 1.5% of market today ($18.8 billion92
) to between 5% and 10% of market five years
after the transition away from embedded commissions.93
v. Shift in assets across existing investment fund managers:
A shift toward lower-cost and passively managed funds stemming from the discontinuation of
embedded commissions94
would also likely occur between funds managed by the same
investment fund manager. We may also see a shift of assets between conventional mutual funds
and ETFs (whether managed by the same investment fund manager or not). In such cases, we
would expect that all investment fund managers would be reviewing their fund offerings with
respect to cost and performance and, in some cases, introducing or expanding their passively
managed fund offerings.
Beyond the shift to passively managed products, we would also expect a potential shift in assets
across active investment fund managers. For example, if active investment fund managers will
need to compete more on the level of their risk adjusted performance after the discontinuation of
92
See Figure 4 above (source: Investor Economics).
93 This estimate is dependent on both how fast index fund demand increases after the discontinuation of trailing
commissions and how strong aggregate growth is in the fund industry (among other factors). For example, if growth
in the mutual fund industry over the last 10 years of around 7% were to persist, we were to see similar growth rates
for index funds in Canada as we have seen in the U.K., and we were to eliminate embedded commissions in 2020,
this would suggest total assets invested in index funds would grow from $18.8 billion today to $125 billion by 2025
– a 5% market share. If aggregate fund industry growth was to substantially slow (to 1 to 2% per year) and index
fund growth was to remain the same, then index fund market share would move closer to the 10% mark.
94 Besides the discontinuing of embedded commissions, many other factors could result in a shift in allocation of
capital to lower-cost and passively managed funds.
13.6
30.7
107.7
5.26.3
12.4
0
2
4
6
8
10
12
14
20
40
60
80
100
120
2000 2001 2002 2003 2004 2005 2006 2007 2008 2009 2010 2011 2012 2013 2014 2015
% o
f m
arke
t
Ass
ets
Bill
ion
s G
BP
U.K. Index ("Tracker") Fund Assets and Market Share
AUM Market Share
Source: Investment Association

56
embedded commissions than they do presently, it is reasonable to assume that actively managed
funds producing negative alphas today could be considered at risk over time.
Based on a review of current actively managed fee-based (series F) fund offerings95
and their
five year alphas, the data suggests that:
87% of investment fund managers offering actively managed funds today have some
funds with negative alphas which could be at risk of redemption if embedded
commissions were discontinued and these managers were not able to adjust their fees or
improve performance;96
For active investment fund managers that manage funds with negative alphas, the
proportion of assets at risk or redemption could be on average 53% of firm assets;
In aggregate, an estimated 44% of actively managed fund assets may experience
redemption and reallocation pressure to competitor investment fund managers over time
if embedded commissions were discontinued and these managers were not able to adjust
their fees or improve performance; and
For active investment fund managers with little or no access to related party
distribution97
, on average 59% of assets at these firms may experience redemption
pressure over time assuming once again these managers were not able to adjust their fees
or improve performance.
As we have emphasized throughout this section, much depends on how investment fund
managers react to the discontinuation of embedded commissions. And as noted earlier, we expect
investment fund managers to alter the way that they compete over time by reducing prices and
refocusing their distribution efforts toward improvements in risk adjusted performance to retain
market share.
95
Since we are looking at what would happen after the discontinuation of embedded commissions, we have focused
on 5 year alpha based on fee-based pricing. All analysis in this section is based on data from Morningstar Direct at
June 2016.
96 These assets may already be at risk today. However with the discontinuation of embedded commissions we would
expect this risk to increase further. For funds that are already in net redemptions, their redemption rate may increase
further.
97 We focus here on those investment fund managers without significant access to captive distribution because
Canadian and other international research has shown that affiliation (i.e. access to affiliated distribution) can be an
effective barrier to price and performance competition (see for example, Douglas Cumming et al., supra note 3).
However, we note in the next section that even for fund managers with access to captive distribution we anticipate
that there could be significant product price and performance pressure after the removal of embedded commissions.

57
vi. Market innovations in product distribution and advice:
When considering the overall effects on product distribution and advice, it is important to note
that the discontinuation of embedded commissions would not require dealers to move to a fee-
based arrangement. As discussed in Part 3, dealers could still charge commissions to clients
directly, move to a fee-based arrangement, move to an hourly rate, or move to any other
combination of payments as long as compensation is not embedded within the product or paid by
the investment fund manager.98
It is anticipated that if we were to discontinue embedded commissions, existing and new market
innovations would help ensure that mass-market households still have access to advice.
As we highlighted earlier, the majority of mass-market households do not own investment funds
and would not be affected by the discontinuation of embedded commissions. However, based on
current market developments, they are likely to have more access to online advice over the next
few years.99
Online advice (typically referred to as robo-advice) is still an emerging sector within Canadian
financial services, though there are a number of online advice platforms that have been
established for some time. While online advisers100
have yet to make a large impact, either in the
number of households serviced or in the share of wealth held by these firms, considering that
online advisers typically offer investment fund products under an asset allocation service, there
are a number of reasons why we should anticipate that they will be disruptive to the status quo
and could have the potential to increase access to advice over time.
First, online advice is often less expensive than traditional advice channels and would likely
remain so particularly if we were to discontinue embedded commissions.
98
For example, in its latest data bulletin, the FCA reports that a number of charging structures are popular post-RDR
including charging based on hourly rates (20% of firms), percentage of assets (48% of firms), fixed fees (22% of
firms) and combined structures (10% of firms). Note that, unlike our current proposal, new front end commission
arrangements were prohibited in the U.K. (Financial Conduct Authority, Data Bulletin Issue 7, October 2016).
99 The result of a survey published by Ernst & Young in 2016 show that, in Canada, 8.2% of digitally active
consumers have used at least two digital/online (FinTech) products within the last six months, in the form of money
transfers and payments, and savings and investments, in comparison to 15.5% globally. The survey also shows that,
if awareness of the available FinTech products by consumers increases, adoption rates could triple within a year
from 8.2% to 24.1%.
100 We refer to “online advisers” because in the Canadian market, advisers that provide advice using an online
platform must be registered portfolio managers and restricted portfolio managers. These firms provide discretionary
investment management services at a low cost to retail investors through an interactive website. Online advisers still
have to review the accounts created through the automated process as outlined in CSA Staff Notice 31-342
Guidelines for Portfolio Managers Regarding Online Advice. The online advisers that have been approved to carry
on business in Canada are not "robo-advisers" of the kind that are operating in the United States, which may provide
their services to clients with little or no involvement of a representative of the adviser. By comparison, Canadian
online advisers can be seen as providing hybrid services, in that they use an online platform for the efficiencies it
offers, while their representatives remain actively involved in (and responsible for) decision-making.
58
The cost of distribution and advice when dealing with a traditional mutual fund dealer from a
vertically integrated firm, not including any account fees or product costs, is typically 1% of
assets or more.101
Account pricing for online advice, net of mutual fund product costs, is
typically between 0.15% and 0.7% of assets per year depending on the amount invested,102
and
the average fund MER on these platforms is approximately 0.25%. This ability of online advisers
to undercut the costs of the dominant advice delivery channel for investment fund owning
households with modest levels of accumulated wealth is likely to limit what this channel can
charge going forward for investment fund distribution and advice.
In Figure 10 below, we show what the minimum, maximum and average online adviser costs in
dollars are today for account assets up to $1 million. Against the traditional 1% mutual fund
distribution cost model, it seems that online advice has the potential to become an important
distribution model in Canada.
However, as we said at the outset, online advice is an emerging sector in Canada. Early pricing
and services provided may not be indicative of pricing over the long term. For example, it
remains to be seen whether these new online adviser entrants can gain enough scale before
incumbents adopt innovation.103
If these new entrants do not gain sufficient scale, the current
pricing pressures that their entrance has brought about may be transitory. In addition, we have
yet to see the entrance of low-cost, hybrid, online advice models in Canada as we have seen in
other markets.104
If we were to discontinue embedded commissions, the ability of incumbents to limit this pricing
pressure could be curtailed by the actions of more established and better capitalized entrants into
the market post the discontinuation of trailing commissions.
101
The majority of mutual funds sold through bank branches are fund-of-funds (see for example, Investor
Economics, Insight Report, November 2016, page 3). These funds typically include a posted trailing commission of
1% and in some cases more than 1%.
102 We note however that not all online advice costs are this low today.
103 We have seen some evidence of this already with BMO and RBC either moving or getting ready to move into
online advice and Power Financial providing a large investment into Wealth Simple. See, for example: Fiona Collie,
“RBC Wealth Management explores adding robo-advisor”, Investment Executive, October 8, 2015; Paul Lucas,
“Royal Bank of Canada turns to robo advisors”, Wealth Professional, February 4, 2016. Several online advisers
have also expanded to provide financial advisors a web-based platform that will allow them to keep offering services
to non-core clients (i.e. mass-market households).
104 See for example, the Vanguard Personal Advice Service offered in the United States, which offers clients with a
minimum of $50,000 to invest automated advice coupled with access to a traditional advisor for an advice cost of 30
bps which decreases as assets rise (https://personal.vanguard.com/pdf/vpabroc.pdf). The program has been more
successful relative to other automated advice only offerings. Assets in the program totaled $41 billion, one year after
launch (see Alex Eule, “The Future of Mutual Funds”, Barron’s, July 9, 2016.).
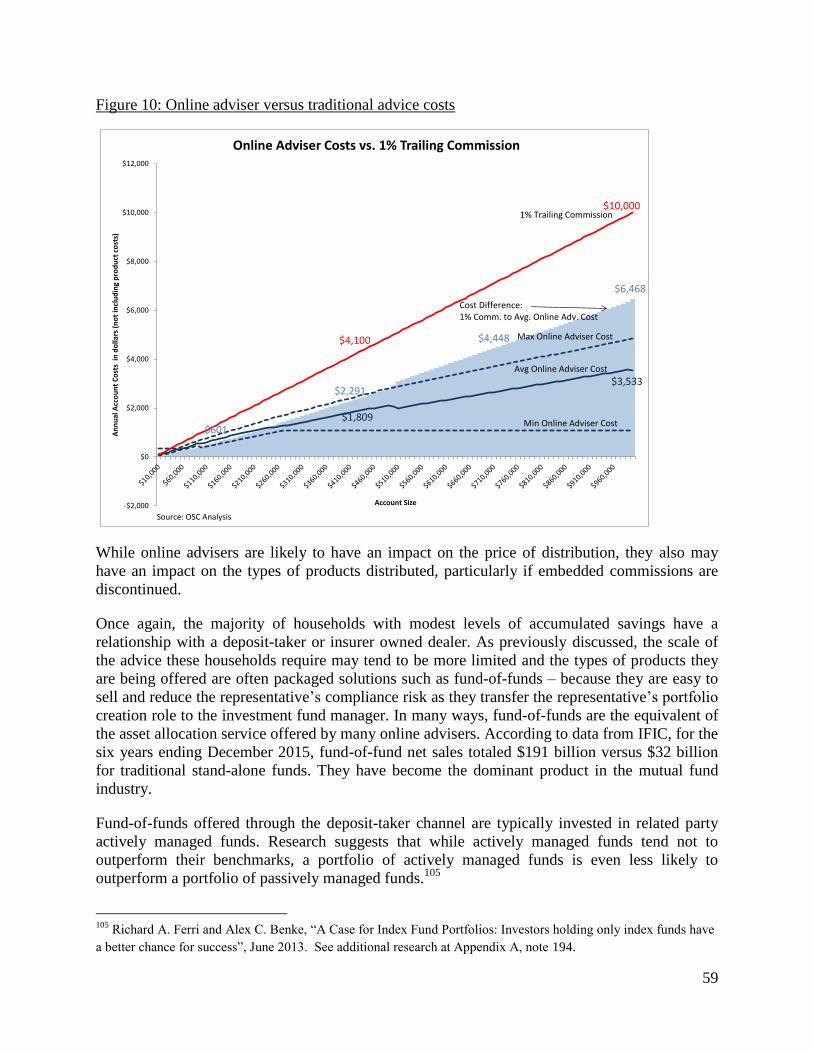
59
Figure 10: Online adviser versus traditional advice costs
While online advisers are likely to have an impact on the price of distribution, they also may
have an impact on the types of products distributed, particularly if embedded commissions are
discontinued.
Once again, the majority of households with modest levels of accumulated savings have a
relationship with a deposit-taker or insurer owned dealer. As previously discussed, the scale of
the advice these households require may tend to be more limited and the types of products they
are being offered are often packaged solutions such as fund-of-funds – because they are easy to
sell and reduce the representative’s compliance risk as they transfer the representative’s portfolio
creation role to the investment fund manager. In many ways, fund-of-funds are the equivalent of
the asset allocation service offered by many online advisers. According to data from IFIC, for the
six years ending December 2015, fund-of-fund net sales totaled $191 billion versus $32 billion
for traditional stand-alone funds. They have become the dominant product in the mutual fund
industry.
Fund-of-funds offered through the deposit-taker channel are typically invested in related party
actively managed funds. Research suggests that while actively managed funds tend not to
outperform their benchmarks, a portfolio of actively managed funds is even less likely to
outperform a portfolio of passively managed funds.105
105
Richard A. Ferri and Alex C. Benke, “A Case for Index Fund Portfolios: Investors holding only index funds have
a better chance for success”, June 2013. See additional research at Appendix A, note 194.
$601
$2,291
$4,448
$6,468
$1,809
$3,533
$4,100
$10,000
-$2,000
$0
$2,000
$4,000
$6,000
$8,000
$10,000
$12,000
An
nu
al A
cco
un
t C
ost
s in
do
llars
(n
ot
incl
ud
ing
pro
du
ct c
ost
s)
Account Size
Online Adviser Costs vs. 1% Trailing Commission
1% Trailing Commission
Max Online Adviser Cost
Min Online Adviser Cost
Avg Online Adviser Cost
Cost Difference: 1% Comm. to Avg. Online Adv. Cost
Source: OSC Analysis

60
This trend is borne out by the performance of fund-of-funds in Canada. At the end of March
2016, and not accounting for survivorship bias,106
which would reduce the percentage of
outperformers further, only 8% of fund-of-fund products were able to beat their indices on a risk-
adjusted basis107
over 3 years, only 10% over 5 years, and only 8% over 10 years. Notably, only
3 funds were able to do it over all three periods.
As most fund-of-funds tend to be actively managed while many (but not all) portfolios managed
by online advisers tend to be made up of lower-cost passively managed ETFs or mutual funds,
we should expect that these portfolios will do at least as well as traditional fund-of-funds offered
by vertically integrated firms today. Moreover, we should expect that the sophistication of online
advice offerings will improve over time.
The fact that the advice is more automated means that, with the same number of representatives,
online advice platforms have the potential to service more households relative to traditional
advice channels. Furthermore, given that online advice tends to be less expensive and that it
encompasses at least part of the benefits thought to be the potential drivers of value with
traditional advice108
, we anticipate that its growth could potentially increase investors’ access to
advice in the future.109
Increased automation is also expected to benefit the traditional advice channel such that we
should expect productivity gains here too. Automation may make it possible for the traditional
advice channel to service parts of the market previously not covered.110
The discontinuation of embedded commissions, along with any potential enhancements to the
obligations of dealers and representatives and the growth of online advisory services, may also
drive up the demand and the supply of discretionary management111
in Canada. This change is
106
Not accounting for funds that have closed or merged over the period. Including these funds would have reduced
the percentage of outperforming funds even further.
107 As measured by information ratios over the time periods cited.
108 From the Vanguard Advisor Alpha report – the drivers of value that would be incorporated into online advice
options would be asset allocation, usage of low-cost products and rebalancing. Ryan Rich, Colleen M. Jaconetti,
Francis M. Kinnery Jr., Donald G. Bennyhoff, and Yan Zilbering, “Putting a value on your value: Quantifying
Vanguard Advisor's Alpha in Canada”, 2015, The Vanguard Group, Inc.
109 Accenture notes that “much of the initial uptake and interest in robo-advice is coming from the “mass-affluent,
delegator” market segment, which has traditionally been underserved”. See Accenture “The Rise of Robo-Advice:
Changing the Concept of Wealth Management,” 2015, page 2.
110 See for example: Tessie Sanci, “Nest Wealth readies launch of new tool for financial advisors”, Investment
Executive, April 19, 2016; James Langton, “Canada’s robo-advisor market to see robust growth”, Investment
Executive, May 19, 2016; Tessie Sanci, “Wealthsimple for Advisors readies for launch”, Investment Executive, May
11, 2016.
111 Discretionary management means a form of investment management in which a portfolio manager has the
authority to make investment decisions for a client’s account, including the discretion to trade in securities for the

61
expected because these initiatives, along with the CRM2 initiative, may encourage dealers and
their representatives to explain their value proposition to clients in a way many have never had
to. In some cases, the easiest way for the representative to do this will be to show the client that
the use of discretionary advice creates a savings discipline, simplifies their life and frees up their
time. There is some evidence that this shift has occurred in the U.K. post-RDR and across
Europe generally where similar changes have been introduced.112
There is also an expectation
that use of discretionary advice will continue to grow in these markets for the foreseeable future.
It is important to note that this trend, were it to occur either in response to the discontinuation of
embedded commissions or other ongoing policy initiatives, would be likely to drive up the cost
of advice. However we should also expect, in such a scenario, that the level of service and advice
would be potentially more aligned with the costs paid.
Whether or not this shift is a benefit to investors depends on whether investors or dealer firms
are driving the change. For example, European and U.K. firms surveyed have suggested that they
have moved or are expecting to move more toward discretionary advice at least in part because
they consider it is a less-time intensive (and thus more profitable) model to run from a
compliance cost perspective relative to traditional advisory services.113
Others surveyed have
argued that, while this model is simpler and more scalable, what is equally driving the change is
the fact that this model is also easier for clients to understand and thus more valuable to them.114
We anticipate that some dealers would be less impacted by the discontinuation of embedded
commissions than others, at least initially. Those dealers, typically deposit-taker and insurer
owned mutual fund dealers, that do not receive embedded commissions today but instead receive
transfer payments unrelated to an investor’s purchase or continued ownership of a mutual fund
security from their non-securities registered parent firm, may be less affected by the
discontinuation of embedded commissions. It is anticipated that even these firms would be
encouraged to make changes over time to their products and services and their pricing in order to
compete with new low-cost distribution models.115
We focus in the next section on the potential impact to specific stakeholders.
account without requiring the client’s express consent to a transaction (ref.: definition of “managed account” in
National Instrument 31-103 – Registration Requirements, Exemptions and Ongoing Registrant Obligations).
112 See for example: Joint report of Oliver Wyman and J.P. Morgan, “The Future of European Wealth Management:
Imperatives for Success”, November 2014; BlackRock, “Wealth Management Industry Survey 2015”; David Boyle,
“A strong DFM market”, Defaqto, March 26, 2016; “DFMs open up a greater choice for clients”, FT Adviser,
October 24, 2016.
113 Joint report of Oliver Wyman and J.P. Morgan, “The Future of European Wealth Management: Imperatives for
Success”, November 2014, page 15.
114 BlackRock, “Wealth Management Industry Survey 2015”.
115 It is worth noting that some firms have anticipated these changes and have already begun to simplify their
purchase options, lower product costs, and introduce direct pay arrangements within their branch network (see note
80).

62
3. Impact of the discontinuation of embedded commissions on specific stakeholders
a. Investors
We set out below the potential impact of the discontinuation of embedded commissions on
different investor segments. The impact we have outlined for one segment of investors could also
apply to a certain degree to another segment of investors.
i. Investors with investable assets below $100k (mass-market)
As explained above, we anticipate that, like all fund investors, this group of investors would
likely see the cost of active management and fund management generally decline. New players
entering the market would likely service these investors and their usage of low-cost, passively
managed funds would likely increase. In order to service these investors, dealers will likely be
encouraged to increase or introduce the use of simplified online advice options. An implication
of this development, coupled with the discussion earlier about the number of households in this
group that do not own investment funds today, is that the size of this group has the potential to
grow over time. Fund ownership has the potential to move beyond 37% of all Canadian
households today.
Considering the shift in product recommendations discussed previously, we anticipate that
representatives, particularly at independent mutual fund dealers which offer an open product
shelf, would focus more on lowering product costs and choosing better performing products over
time. The discontinuation of embedded commissions would also eliminate the incentive for
representatives to potentially engage in unsuitable leverage strategies. A potential negative
impact of the discontinuation of embedded commissions for mass-market households is that
some independent fund dealers may choose not to continue to service these households.116
Some investors, when presented with the cost of advice may not see value in it and choose to
move to another dealer, to an online/discount broker or to an online adviser. We do question
though the extent to which this change will occur given that the implementation of the new
CRM2 annual report on charges and other compensation will have been completed. It is possible
that investors that do not see value from advice, in reaction to the CRM2 disclosures, may have
already moved their assets to another dealer, to an online/discount broker or to an online adviser.
Where we may see movement is for those investors who want to use mutual funds but do not
want to use advice. For investors that move their assets to an online/discount broker, they will no
longer bear the cost of full trailing commissions if they make the switch.
It is fair to say that this group of investors is the group most at risk of falling into the “advice
gap” – the group of investors who cannot obtain the amount of advice they desire at the price
they are willing to pay – today.117
As was outlined earlier, this is also the group of fund investors
116
We note that based on the Ipsos data, an estimated 14% of mass-market households work with an
independent/other integrated fund dealer today. About 38% of these households also have a relationship with a
deposit-taker or insurer owned dealer.
117 In the FCA and HM Treasury’s Financial Advice Market Review: Final Report (March 2016), “advice gap” is
similarly defined as situations in which consumers are unable to get advice and guidance on a need they have at a

63
that are least likely to be receiving advice today and when they do receive advice, the range of
services118
provided tends to be less than for those with higher levels of wealth.119
Households
with little to invest are considered to be the most difficult for the industry to service today given
the costs and scalability of existing advice models versus the potential revenue gained.
Admittedly, in terms of the number (though not in terms of the share of total wealth) this group
makes up the largest share of households.
For a number of reasons alluded to earlier in this section, despite the potential risks, we do not
anticipate a significant advice gap in the event that we move forward with our proposals.
First, with respect to the risk of increasing the “advice gap”, we note that the majority of mass-
market households do not own investment funds and that for the mass-market households that do
own investment funds, the majority have tended to purchase them through a deposit-taker or
insurer owned dealer. We anticipate that deposit-taker and insurer owned dealers will continue to
serve mass-market households if we transition away from embedded commissions. As noted
earlier, by virtue of being both vertically and horizontally integrated, many deposit-taker and
insurer owned dealers (particularly in the mutual fund dealer channel where we have shown the
majority of these households are serviced) have already moved away from traditional grid based
compensation that relies on embedded commissions.120
Their high level of horizontal integration
has led these firms to focus less on any one business line (e.g. mutual funds, GICs, mortgages,
credit cards etc.) and focus more on gathering assets across all business lines and on directing
clients to the appropriate business line.121
The discontinuation of embedded commissions by itself will likely have little direct impact on
these integrated business models. They will continue to provide a wide array of financial
products and services (including mutual funds) to households with little to invest. We have
already outlined trends with respect to automation that may actually increase access to advice for
price they are willing to pay. Based on the experience in other jurisdictions, we note that an advice gap is not a
phenomenon that occurs only because of a ban on embedded commissions, but rather it is a function of a number of
factors (changes to existing business models, changes to consumer preferences, technological changes etc.) that
occur normally in any competitive market for financial services.
118 Financial services and advice can, but need not always, encompass a broad range of services such as investment
recommendations, asset allocation, the setup of systematic savings plans and/or registered plans, the preparation of a
written financial plan, tax planning, estate planning, debt management, budgeting cash flows, etc.
119 As noted earlier when looking at the Ipsos household survey data, the usage and, likely, the breadth of advice
tend to increase with household wealth.
120 For example, see the discussion in MFDA Bulletin #0689-P, supra note 24, regarding the cost disclosure
requirements for dealers that do not receive commissions but instead receive transfer payments from affiliates based
upon a management agreement with the corporate parent. Also see previous research completed by CSA staff into
advisor compensation practices.
121 For example, to their related branch direct, branch advice, financial advisor, full-service dealer or private wealth
management arm.

64
this group122
and we have noted the much higher levels of advice coverage and advisor
availability in Canada versus other jurisdictions such as the U.K.
With respect to the developments in the advice market in the U.K. post-RDR, it is important to
take note of the other factors that have led to the advice gap that are not present in the Canadian
context.
In the recent financial advice market review conducted by the Financial Conduct Authority
(FCA) and HM Treasury in the U.K.123
, they identify that the standards and professionalism in
the industry have increased. As well, the move to a direct pay model for advice on retail
investment products has improved transparency and significantly reduced certain conflicts of
interest. However, they also identified a number of obstacles post-RDR implementation that are
limiting accessibility and affordability of advice, including:
a need for clarity as to when general forms of advice become or are considered “regulated
advice” 124
;
a need for clarity on responsibilities when providing guidance that is not “regulated
advice” (e.g. online calculators and tools, providing general behavioural nudges to
clients);
a need for clarity on how to tailor suitability assessments when providing narrow forms
of advice;
extending the time new employees can work under supervision while obtaining
qualifications in order to provide more flexibility to train a new generation of advisers;
clarifying the length of time a firm can cross-subsidize the cost of new advice delivery
models while still ensuring that over the long-term the charges for their advice service
cover the costs of providing that service (the cross-subsidization rule); and
assistance in introducing new technologies to automate advice and to streamline and
codify the fact finding process used in traditional advice in order to reduce the cost of
suitability assessments.
None of these obstacles limiting access and affordability were found to be related to the removal
of embedded commissions but rather they tended to be tied to the particular way in which the
FCA chose to raise the standard of care.
The new standard for advisors implemented in the U.K. with RDR has much wider scope, in
terms of the types of advice covered and the limitations on business conduct, than is
122
See also Accenture, “2016 North American Consumer Digital Banking Survey, Banking on Value: Rewards,
Robo-Advice and Relevance,” 2016.
123 Financial Conduct Authority, HM Treasury, Financial Advice Market Review: Final report, March 2016.
124 Advice relating to a particular investment given to a person in their capacity as an investor or potential investor
(or their agent) and relates to the merits of them buying, selling, subscribing for, or underwriting (or exercising
rights to acquire, dispose of, or underwrite) the investment. See Financial Conduct Authority, Finalised Guidance
FG15/1: Retail investment advice: Clarifying the boundaries and exploring the barriers to market development,
January 2015 (http://www.fca.org.uk/static/documents/finalised-guidance/fg15-01.pdf).
65
contemplated in CSA CP 33-404. For example, the CSA has not contemplated an equivalent to
the FCA’s cross-subsidization rule which seems to have played a role in limiting the introduction
of new advice delivery models in the U.K. Therefore, we do not anticipate the same obstacles to
the development of new lower-cost distribution models in Canada after the discontinuation of
embedded commissions.
In addition, as discussed later in Part 5, if the CSA were to discontinue embedded commissions,
the CSA would aim for a transition period sufficient to allow market participants time to adjust
their business models with the objective of mitigating any investor harm. Finally, as has been the
case with the introduction of CRM2 and POS, we anticipate that the industry will find it in its
interest to educate and prepare their clients for such a change in order to minimize disruption to
its business.125
It is possible, however, that the cost of traditional advice may rise for this group. ‘Bricks and
mortar’ advice is also likely to decline for this group (although this change may occur anyway
for this group over the next few years as account minimums to access advice may continue to
increase).
As mentioned in Part 5, the transition to direct pay arrangements and the implementation of other
regulatory reforms may lead to an increase in the cost of dealers’ operations and compliance,
which may lead to an increase in the cost of advice. Some investors may be pushed into online
advice relationships, other more simplified forms of advice, or the online/discount brokerage
channel even though these services may not meet all their needs and even though they may
prefer, but can no longer afford, face-to-face advice.126
We do not anticipate that there would be a significant change in the fund products recommended
through integrated mutual fund dealer firms although, as we have noted, the cost and
performance of those products may change in reaction to new market entrants. There is also the
possibility that some representatives may have less of an incentive to service clients after the
initial sale were we to move to more widespread use of fee-based arrangements. This may lead
to reverse churning.127
125
James Langton, “MFDA, IFIC help inform investors about pre-sale disclosure”, Investment Executive, February
25, 2016; Rosemary McCracken, “Talk with your clients about compensation before CRM2 comes into effect”,
Insurance & Investment Journal, November 20, 2015.
126 We note however that recently released data on the cost of fee-based – percentage of asset fee – charges in the
U.K. post-RDR suggest the fees are not too different from the fees charged today in Canada. Initial fees of 1% to 3%
with annual ongoing fees of 0.5% to 1% of assets (see Financial Conduct Authority, Data Bulletin Issue 7, October
2016, page 11).
127 Churning typically occurs when a dealer engages in excessive buying and selling of securities in a customer’s
account chiefly to generate commissions that benefit the dealer. In contrast, “reverse churning” occurs when a dealer
places a customer’s assets in a fee-based account (or receives some form of asset based compensation) chiefly to
collect the fee then subsequently does little for the client, in terms of actual advice, trading or account activity, in
exchange for that fee.

66
As the investor may not be equipped to negotiate the fees or may not fully appreciate that there is
a cost to distribution, moving to a fee-for-service model could have the consequence of
discouraging some investors from seeking financial advice, particularly where they are indirectly
paying for but are not receiving advice (outside of the required suitability assessment) today, as
they may be unwilling to pay a fee for such advice.128
Finally, where representatives choose to
offer their services to clients under a transaction-based commission arrangement, they may be
incented to churn the account.129
ii. Investors with investable assets between $100k and $500k (mid-market)
Similar to investors with modest levels of accumulated wealth, we would expect this group to
benefit from lower fund management costs, whether funds are actively or passively managed.
We also expect that new players entering the market would tend to target this group and their
usage of passively managed funds would likely increase. A transition away from embedded
commissions will likely drive a shift in products recommended by representatives and made
available on the dealer product shelf toward lower-cost and passively managed funds, which
could improve investor outcomes. We expect client engagement with this segment of investors to
increase with respect to the services and advice options offered (e.g. full, partial, à la carte
options). These different types of service and advice options are likely to give investors more
control and more clarity over the advisor/client relationship. This group is also likely to be
offered more discretionary advice over time.
Similar to the push toward online advisory services for investors with less than $100,000 to
invest, it is possible that some “buy-and-hold” investors may be moved into fee-based accounts
when transaction-based fees may be better for their circumstances (we note that this shift is
already occurring today). We anticipate that the concept proposals outlined in CSA CP 33-404, if
implemented, would limit this potential impact. As outlined above, there is also the potential for
reverse churning in these arrangements.
iii. Investors with investable assets above $500k (affluent)
We anticipate that this group of investors will be the least impacted by the discontinuation of
embedded commissions as they are the most likely to be using non-embedded forms of dealer
compensation today. They would, however, likely benefit from the fund management cost
declines outlined above. As with the other two investor groups, representatives at private wealth
management firms and representatives at IIROC dealers would likely focus more on
recommending lower-cost and passively managed funds to their affluent clients where it is
appropriate to do so. Usage of discretionary advice is likely to go up substantially for this group.
We anticipate similar potential negative impacts as those anticipated for the other two investor
groups. Given that the affluent group of investors is the most sought after by advisors today, we
128
A recent article questions how much advice is provided to the typical advised client given the number of clients
typically serviced by the average advisor (see Dan Hallett, “Advice gap exists now,” Investment Executive, Mid-
November 2016.
129 Although churning is something that can typically be detected easily and that self-regulating organizations (SRO)
and compliance officers routinely check for.
67
anticipate that they will continue to be provided the most flexibility in terms of payment
arrangements and the most number and scope of advice delivery and service offerings.
iv. Do it yourself investors
For DIY investors, the discontinuation of trailing commissions would significantly lower costs as
we would expect them to benefit from the decline in fund management costs and the removal of
the full trailing commission costs they often pay today. The supply of DIY fund series options
may also increase from 493 today to 4,901 options (based on a comparison of the D series and F
series available today). These investors will, however, be required to pay transaction-based or
asset-based fees directly, to offset the revenue lost from trailing commissions. We do not expect
these payments to be any higher than the trailing commissions paid on DIY fund series today –
typically 0.25% - which would represent a 75 bps decline from what they would typically pay
today.
b. Dealers and investment fund managers
Based on the facts outlined in the previous sections of Part 4, we anticipate that, if we were to
discontinue embedded commissions, all industry stakeholders would take the necessary steps to
adapt to direct pay arrangements by innovating, segmenting their products and services, and
using new technologies, to the extent possible within firm specific resource constraints.
i. Independent investment fund managers
As outlined previously, we expect fund management costs to decline and the share of lower-cost
funds and passively managed funds sold in Canada to increase over time. Given that total mutual
fund assets have been growing at an average 7.2% per year over the last ten years, we anticipate
that a potential increase in the sale of passively managed funds would not necessarily involve a
decline in the sale of actively managed funds in Canada nor a decline in the total dollars invested
in actively managed funds.
We also estimate that, based on current five year fund alphas, there would be some proportion of
actively managed fund assets likely at risk of experiencing redemption pressure. For relatively
higher cost active investment fund managers with a large proportion of negative alpha funds and
no access to affiliated dealer distribution today, there would likely be more challenges in the
event that there is a discontinuation of embedded commissions. These investment fund managers
could potentially have fewer options to cross-subsidize across business lines relative to their
integrated investment fund manager peers.
We do anticipate, however, that the remaining active investment fund managers are more likely
to be high alpha producing firms. For those active investment fund managers that do not pay
trailing commissions or pay relatively lower trailing commissions today, it is reasonable to
assume that they will have better access to the discount brokerage channel than they do today.130
The discontinuation of embedded commissions could also provide high alpha generating
independent investment fund managers with a better opportunity to access the IIROC channel
130
Gail Bebee, “Choosing a discount broker”, Morningstar Canada, April 15, 2014

68
and the independent MFDA channel than is the case today as we anticipate that fund
performance would become a more important driver of fund flows resulting in a shift in market
share towards these managers.
While we anticipate increased access to lower-cost fund products in the IIROC and independent
MFDA platforms, we also anticipate that independent investment fund managers will still be at a
disadvantage as they may not be able to gain access to those firms with closed, proprietary only,
product shelves (predominantly deposit-taker and insurer owned MFDA firms). As an
alternative, these investment fund managers may be required to set up a direct to client channel
and obtain a dealer registration in order to compete in this space or alternatively, access these
investors via a third party online advisory service.
ii. Independent mutual fund dealers
We anticipate that independent mutual fund dealers, similar to the situation for investment fund
managers, would be required to compete more on their overall level of services and advice in a
market that is likely to be transformed significantly by automated solutions and technological
change generally over the next few years. Despite the increase in competition, there may be
opportunities that arise for these firms as well.
The introduction of more low-cost fund products is likely to allow independent dealers, at least
initially, to put pressure on their integrated fund dealer competitors. Representatives at
independent firms will be further encouraged to study the product market on behalf of their
clients with price and performance in mind which may result in better recommendations and
better outcomes for their clients over time. Representatives are also likely to have access to more
tools that will allow them to service a wider range of clients than is the case today.131
It is
possible that, similar to the case for independent investment fund managers, these firms could
have fewer cross-subsidization options relative to their integrated fund dealer peers.
We anticipate that some independent dealers, if they cannot explain their value proposition, may
have trouble maintaining their assets under administration. However, this may already become a
trend to a certain degree with the introduction of the annual report on charges and other
compensation (CRM2), whether or not embedded commissions are discontinued. Client
engagement for the remaining firms will increase as will the service options that can be offered
to clients.
There is also a risk that some dealers and representatives that can recommend non-securities
products may prioritize their compensation interests over the interests of their clients by
131
Some established online advisory firms are now offering advisor access to their platforms to help financial
advisors better serve small retail investors and reduce the administrative burden related to the administration of
smaller accounts. See for example, Tessi Sanci, “Wealthsimple for Advisors readies for launch”, Investment
Executive, May 11, 2016 (http://www.investmentexecutive.com/-/wealthsimple-for-advisors-readies-for-launch) and
Wealthsimple website (https://www.wealthsimple.com/advisors).

69
inappropriately shifting their clients’ assets to non-securities investment products with embedded
fees.132
All things being equal, following the discontinuation of embedded commissions, it is expected
that dealers will compensate for the loss of revenue from embedded commissions with revenue
from direct pay arrangements. It is possible that the discontinuation of embedded commissions
may disadvantage small-to-medium sized independent mutual fund dealers relative to full-
service IIROC dealers because they rely more heavily on embedded commissions than do IIROC
dealers.
As at September 2014, trailing commissions represented approximately 27% of the fee revenue
and mutual fund commissions represented 16% of annual commission revenue for full-service
IIROC dealers.133
We recognize that this change will represent an important shift in the business
model of independent MFDA dealers and, were we to move forward, the method by which we
would transition would be key to its success (as outlined in Part 5 of this Consultation Paper).
iii. Integrated financial service providers
We set out below the potential impacts specific to a dealer or an investment fund manager that is
part of an integrated financial service provider. The impacts outlined above may also apply to
them to a certain degree.
For the asset management arms of integrated financial service providers, we anticipate that new
entrants to the market would put pressure on asset management pricing. Integrated investment
fund managers would likely need to lower their asset management pricing to compete. They
would also likely need to reassess their product pricing and would be encouraged to distribute
their low-cost, passively managed fund options. It is important to note however that, given their
access to their closed shelf related mutual fund dealer channel, these firms would likely not feel
the same pricing and redemption pressure as their independent investment fund manager peers, at
least initially.
For integrated dealers that choose to be open shelf, due to the potential introduction of the
enhancement to KYP obligations as currently outlined in CSA CP 33-404, representatives may
be required to study the market, including the use of non-proprietary funds, on behalf of their
132
Such recommendations would however have to be in compliance with the requirements of the regime applicable
to non-securities products. If an important shift to non-securities products were to happen, we would assume that
the SROs and regulators of non-securities products (including some CSA members) would remain vigilant and take
any necessary action in the case of non-compliance. Non-securities regulators are increasingly considering
regulatory initiatives in order to ensure a harmonized approach with securities regulators on similar products. See
Part 3. Also, with the introduction of POS and CRM2, we continue to monitor the potential for regulatory arbitrage.
We note the data in Figure 5 above showing assets and growth rates of mutual funds versus other investment funds
does not suggest that regulatory arbitrage is occurring today. This is also borne out when we look at net sales and
sales rates for these products and advisor dual licensing.
133 Investor Economics, Retail Brokerage and Distribution Advisory Service, Fall 2015 edition.

70
clients with price and performance in mind which could result in better recommendations and
better outcomes over time.
For integrated dealers that choose to offer a closed shelf, as mentioned above, they would not
feel the same level of pressure and would, at least initially, still be able to operate mostly as they
do today, although as previously mentioned, the cost of the proprietary funds offered may fall.
Furthermore, we would anticipate that both the discontinuation of embedded commissions and
the potential KYP reforms proposed in CSA CP 33-404 would be unlikely to reverse, and may
even increase, the trend toward retaining mid-market and affluent households within the branch
network134
(rather than referring them to their related party open shelf platforms or private
wealth management arms). Integrated firms as a whole would have more options, at least
initially, to cross subsidize across both securities and non-securities business lines to maintain
market share.
Over time however, it is reasonable to assume that even these firms would feel pricing pressure
in their closed shelf distribution channels which may incent these firms to embrace new
technologies, adopt new pricing strategies and service offerings and rely less on traditional
advice (many are already doing so). Furthermore, the potential entrance of low-cost hybrid
online adviser models into Canada would likely put further pressure on the integrated fund
distribution model.
Now that we have looked at the potential overall and specific market impacts of the
discontinuation of embedded commissions, we discuss how this policy change may address our
identified concerns.
4. How does the discontinuation of embedded commissions potentially address some of
the CSA’s concerns?
Eliminating important inherent conflicts of interest
The discontinuation of embedded commissions would eliminate an important inherent conflict of
interest that research has shown misaligns the interests of investment fund managers, dealers and
representatives with those of investors. Our analysis leads us to believe that discontinuing
embedded commissions would increase investment fund managers’ focus on fund performance
and discourage biased recommendations that may prioritize the maximization of compensation
over the interest of the investor. The discontinuation of embedded commissions would also
eliminate the incentive for representatives to potentially engage in unsuitable leverage strategies
(as explained in Appendix A). The discontinuation of embedded commissions is the clearest and
most direct way to address these conflicts of interest. In addition, when combined with certain
concepts in CSA CP 33-404, if implemented, the representative-client compensation discussion
is more likely to result in a compensation arrangement that is more appropriate for the client’s
situation.
134
On the increase in the client wealth “ceiling” within the branch network see, Investor Economics, Retail
Brokerage Report, Fall 2012, page 10.

71
The discontinuation of embedded commissions also complements the proposals outlined in CSA
CP 33-404. Generally, jurisdictions that have enhanced the advisor’s standards and obligations
have eliminated embedded commissions at the same time (as outlined in Appendix C) because
they have recognized that these payments are one of the main obstacles preventing the advisor
from working in the interest of their clients. Research suggests that these payments are a conflict
that is very difficult to manage or mitigate, except through avoidance. 135
Addressing dealer affiliation biases
To a lesser extent, discontinuing embedded commissions may address some dealer affiliation
biases directly through the IIROC channel where representatives are paid trailing commissions
and indirectly through the mutual fund dealer channel where, despite the focus on proprietary
products, asset management fees would need to fall in-line with the rest of the market in order to
be competitive on total costs. We recognize that discontinuing embedded commissions does not
address all dealer affiliation issues. However the proposals outlined in CSA CP 33-404, if
implemented, in conjunction with this proposal may address some conflict issues with respect to
internal compensation arrangements at the dealer.136
Reducing the number of mutual fund series and the fee complexity that these series create
The fund fee structure has grown increasingly complex due to the growing number of fund series
on offer, with each series charging different fees (largely due to differences in dealer
compensation). We anticipate that the discontinuation of embedded commissions would
significantly simplify the fund fee structure in Canada, facilitate easier product cost and
performance comparisons, and incrementally reduce information asymmetry for all market
participants (in particular, for retail investors).137
Increasing the transparency of dealer compensation costs
We anticipate that eliminating embedded commissions would address fund fee and dealer
compensation awareness concerns. Unlike disclosure, which only requires delivery and not
understanding, the discontinuation of embedded commissions requires the representative to
engage in an in-depth discussion with the client and obtain the client’s agreement upfront in
order to get paid.138
More general compensation disclosure such as when a new product is being
introduced to the portfolio (fund facts) or more specific compensation disclosure 12 months after
engaging the representative (CRM2) serves many purposes and is important, but research
135
Note that Part 6 of this Consultation paper also explores these issues in the context of why existing reforms may
not go far enough.
136 See CSA CP 33-404, Appendix A.
137 See for example, Dan Hallett, “Be wary of unmentioned fees in ads for F-Series funds”, Globe and Mail, May 30,
2016.
138 The outset of the relationship is arguably when the investor has the highest level of bargaining power as a
opposed to 12 months after the engagement of the advisor when they receive their cost disclosure statements and the
investor may incur switch costs to make a change.
72
suggests that this may not be as effective as an upfront discussion and agreement regarding
compensation.
Better alignment between the costs paid by investors for financial advice and the services
provided to clients by dealers and representatives
The discontinuation of embedded commissions, replaced by an upfront discussion and agreement
regarding compensation, also addresses the questions regarding what fees are being paid and
more importantly, what they are being paid for. As we have seen already with high net worth
client relationships, moving to a direct pay model may allow services and pricing to be more
easily tailored to the client’s needs.139
The discontinuation of embedded commissions would incent investment fund managers, dealers
and representatives to be clear about, and to better demonstrate, their respective value
propositions. It also allows DIY fund investors to forgo advice and the cost of advice.
In addition, after the discontinuation of embedded commissions, the representative-client
compensation discussion is more likely to result in a compensation arrangement that is most
appropriate for the client’s situation. Transition to direct pay arrangements may also help to
increase investors’ control over dealer compensation costs and the services provided.
Encouraging new lower-cost fund providers to enter the market
The discontinuation of embedded commissions may encourage new low-cost fund providers to
enter the market with a range of passive and actively managed funds. These new entrants will
likely service retail investors in all wealth segments as they do today in other jurisdictions in
which they compete.
Increasing price competition and decreasing fund management costs
It has been well-documented that one of the things new lower-cost entrants bring to the markets
that they enter is significant competitive pressure on incumbents to decrease fund management
costs over time.140
We anticipate that their entrance will encourage the manufacturing and
distribution of lower-cost funds. We would expect to see a shift in product recommendations to
lower-cost and passively managed products, and a shift in the allocation of capital across active
investment fund managers that will ultimately benefit investor outcomes.
139
Advisors making the switch to fee-based and other direct pay arrangements today are routinely counselled to
make sure that they understand and can communicate their value proposition to their clients before making the
change. See for example, Ahmad Hathout, “Transition to fees requires support”, Investment Executive, June 2016.
140 See for example, “Index we trust”, The Economist, June 11, 2016.

73
Questions
Where possible, we strongly encourage commenters to provide data to support responses.
Addressing the issues
12. Based on a consideration of the data and evidence provided in this Part, would a proposal to
discontinue embedded commissions address the three key investor protection and market
efficiency issues discussed in Part 2?
13. Are there other ways in which the CSA could address these issues that could be introduced in
conjunction with, or separate from, the discontinuation of embedded commissions?
14. Are there other conflicts of interest that could emerge following a transition to direct pay
arrangements that would not be addressed in the current securities regulation framework?
Change in investor experience and outcomes
15. What effect do you think the removal of embedded commissions will have on investor
experience and outcomes? In particular:
Will investors receive advice and financial services that are more aligned with the
fees they pay?
What effect will the proposal have on the growth of automated advice? Is this likely
to be beneficial to investors?
Is discretionary advice likely to increase in Canada as we have seen in the other
markets that have transitioned away from embedded commissions and, if so, would
this shift be positive or negative for investors?
What effect will the proposal have on the growth of the online/discount brokerage
channel and cost of fund products offered in this channel? Is this likely to be
beneficial to investors?
What effect will the proposal have on the cost and scope of advice provided to
specific investor segments?
16. What types of payment arrangements are likely to result if this proposal is adopted? In
particular:
Would the payment arrangements offered by dealers to investors differ based on
investor segment? If so, how and why?
17. Do you think this proposal will lead to an advice gap? In particular:
Which segments of the market are likely to be affected? Please consider
segmentation by wealth, geography (size and location of community e.g. remote,
small, medium, large), age, technological sophistication, the level of fund ownership
across households, etc.
74
Do you agree with our definition of an advice gap?
Should we differentiate between an advice gap for face-to-face advice and an advice
gap generally?
What types of advice or services currently provided today would be most affected by
the proposal?
Are there any potential interactions between this proposal, existing reforms such as
CRM2 and other potential reforms such as CSA CP 33-404 that may affect the size of
any potential advice gap?
How could a potential advice gap, face-to-face advice gap or financial service gap be
mitigated?
Do you think that online advice could mitigate an advice gap? If so, how?
Do you think that the significant market share of deposit-taker owned and insurer-
owned dealers in fund distribution in Canada will affect the size or likelihood of an
advice gap to develop?
Industry change independent of regulatory response to discontinue embedded commissions
18. Given some of the changes we have seen in the industry over the past few years (fee
reductions, introduction of DIY series, streamlining of fund series, automatic fee reductions
increasing access to fee-based options etc.), what is the likelihood that the fund industry will
transition away from embedded commissions without regulatory action? In particular:
Will the industry continue to transition away from embedded commissions if the CSA
does not move forward with the proposal?
19. How accurate is Figure 8 regarding the purchase options available to fund investors by
channel, account size and firm type? In particular:
Do you see payment options and business models evolving at present?
How are they likely to change over time if the CSA were to choose not to move
forward with the proposal?
20. We note that the distribution of fee-based series is still relatively limited in Canada versus
other markets. Are there obstacles (structural, operational, regulatory, investor demand, etc.)
specific to Canada limiting the use of fee-based series by dealers?
Potential impact on competition and market structure
21. Please describe how discontinuing embedded commissions will affect competition and
market structure and whether you agree with the analysis set out in Part 4? In particular:
Do you think the proposal will have an impact on the level of industry consolidation
or integration? What about with respect to the concentration of mass-market investor
assets held in investment products managed by deposit-taker owned firms?
What are the likely impacts on investor outcomes and market efficiency of any
potential consolidation?

75
What opportunities and what challenges do you think the proposal would introduce
for specific industry stakeholder groups?
o Independent dealers?
o Independent fund manufacturers?
o Integrated financial service providers?
o Mutual fund dealers?
o IIROC dealers?
o Online/discount brokers?
What is the likelihood and magnitude of regulatory arbitrage across similar financial
products such as segregated funds and deposit-taker products?
What would be the impact on dually-licensed mutual fund dealers and insurance
agents?
Will the proposal lead new, lower-cost entrants to the market? Why and how?
Does the interaction between this proposal and the proposals set out in CSA CP 33-
404 change your responses to the questions above and, if so, how?
Will a transition away from embedded commissions reduce fund series and fee
complexity, as we have contemplated?
Do integrated financial service providers have an advantage in terms of their ability to
cross-sell and cross-subsidize across business lines? If so, how?
What are the potential effects on competition of the rise in online advice? Are these
effects likely to be large and positive?
22. What impact will the proposal have on back office service processes at the investment fund
manager or at the fund dealer? In particular:
Is there any specific operational or technological impact that we should take into
consideration?
23. The payment of embedded commissions requires the dealer and the investment fund manager
to implement controls and oversight (with associated compliance costs) in order to mitigate
the inherent conflicts of interest today.
Would the transition to direct pay arrangements alleviate the need for some of these
controls and oversight?
To what extent, if any, does the use of direct pay arrangements by representatives
today (e.g. when a representative provides services under a fee-based arrangement)
alleviate the need for some of these controls and oversight?
24. Embedded commissions, especially trailing commissions, provide a steady source of revenue
for dealers and their representatives. If embedded commissions were discontinued, would
dealers be able to compensate for the loss of this revenue with direct pay arrangements?
25. Aside from commission grids and salaries, what other approaches to representative
compensation might dealers use if we were to discontinue embedded commissions? How are
these approaches likely to change over time?

76
26. What impact will the proposal have on representatives in the industry? In particular, what
impact will the proposal have on the:
career path;
attractiveness of the job;
typical profile of individuals attracted to the career;
recruitment; and
relative attractiveness of careers in competing financial service business lines?
PART 5 – MITIGATION MEASURES
The CSA appreciate that a transition to direct pay arrangements would be a significant policy
change that would take considerable time to implement and that may have unintended
consequences for both investors and fund industry participants. Therefore, to the extent we may
decide to move forward with a rule proposal discontinuing embedded commissions, our goal is
to proactively identify and incorporate into our rule proposal various mitigation measures as well
as transition options that could help alleviate any negative impacts and facilitate a successful
transition to direct pay arrangements.
1. Measures to mitigate potential unintended consequences
In response to our Original Consultation Paper, several fund industry stakeholders submitted that
the discontinuation of embedded commissions could have unintended consequences for retail
investors and the fund industry,141
including:
a reduction in access to advice for lower-wealth investors due to:
o substantial changes to dealer business models, and
o reticence of investors to pay directly for advisory services;
the elimination of choice in how investors may pay for financial advice; and
an uneven playing field among competing products and opportunities for regulatory
arbitrage.
a. Access to advice:
The data we consider in Part 4 on Canadian fund investors and the institutions that currently
serve them suggests that the discontinuation of embedded commissions is not likely to lead to a
significant advice gap for lower-wealth investors in Canada. Nevertheless, we recognize that
141
See CSA Staff Notice 81-323 Status Report on Consultation under CSA Discussion Paper and Request for
Comment 81-407 Mutual Fund Fees, published on December 17, 2013, which provides a summary of the key
comments received on the Original Consultation Paper.

77
such a change may (i) impact dealer business models in a way that may reduce the range and
affordability of advice and (ii) affect the behavior of certain investors in a way that may reduce
their use of advice.
i. Impact to dealer business models
We recognize that a transition to direct pay arrangements would involve substantial changes in
current dealer business models. The transition could have the following potential impacts on
dealers, among others:
dealers may incur potentially costly changes in information technology systems, as well
as changes in operational and compliance processes, that may increase the cost to
provide advisory services142
;
the transition would require dealers and their representatives to communicate with their
clients to inform them of, and obtain their agreement to, the direct pay arrangement;
going forward, dealers would need to collect their compensation directly from their
clients on an individual basis, rather than be compensated on a wholesale basis through
trailing commissions; this change would impose new administrative processes which
may reduce efficiencies and increase costs; and
overall revenues may be reduced due to the loss of a form of cross-subsidy from high net
worth fund investors to lower-wealth fund investors; this change may increase the cost
of servicing lower-wealth investors.143
We acknowledge that these potential impacts could be magnified for smaller independent
dealers. Some dealers may not be able to adequately compensate with direct pay arrangements
their loss of revenue stemming from the discontinuation of embedded commissions and the costs
associated with the transition. Some dealers and their representatives may decide to refocus their
business on high net worth fund investors and/or charge a fee for advisory services that some
investors may not be able to afford, thus increasing the potential for certain investors to lose
access to advisory services.
We anticipate that some of these impacts could be alleviated to some extent by innovations in
technology, including various forms of online advice, which could be used by dealers and their
142
We note these costs would be in addition to those already incurred in connection with the implementation of POS
and CRM2 and the costs associated with the potential implementation of any of the CSA CP 33-404 proposals.
143 Industry stakeholders have submitted that lower-wealth investors in a fund benefit financially from the current
embedded commission structure because the cost of providing advice and services to lower-wealth investors is
subsidized by the higher-wealth investors in the fund who pay more on account of their larger assets under
management. It is reasonable to assume that the mandated use of direct pay arrangements would eliminate this
pooling of fees from both higher-wealth and lower-wealth investors and cause the price of servicing lower-wealth
investors to increase.

78
representatives to automate part of the advice process.144
The integration of such technology into
the business models of dealers and their representatives could potentially add new capabilities
and deliver efficiencies that could make the provision of advisory services to smaller accounts
more viable.
We think they could also be alleviated to a certain extent by our proposal, as discussed in Part 3,
to allow investment fund managers to facilitate investors’ payment of dealer compensation by
collecting payments from the investor’s fund investment (for e.g. deductions from purchase
amounts or periodic withdrawals or redemptions from the investor’s account) and remitting them
to the dealer on the investor’s behalf.145
ii. Impact to investor use of advice
We recognize there are a number of factors, including behavioral factors, which may influence
the decision of investors to use financial advice.146
For example, the requirement for investors to
directly pay for advisory services provided by their representative under direct pay arrangements
may affect the behavior of certain investors in a way that may reduce their use of advice.
Specifically, some investors may consider direct payments less convenient relative to the current
embedded commission model, which may accordingly deter them from seeking advisory
services.
We also understand that retail investors’ varying levels of financial literacy and lack of frame of
reference as to what is a reasonable fee for advisory services may reduce their ability to assess
the value of such services or to negotiate a fair fee under direct pay arrangements.
In order to address the risk that some investors may be deterred from using financial advice due
to the requirement to pay upfront for their representative’s services, we would propose, as
discussed in Part 3, to allow investors to pay for their representative’s compensation through
deductions from their purchase amounts or redemptions from their investment fund holdings that
144
Some Canadian firms are now offering online advice services designed for use by advisors. See note 131.
145 We recognize that not all investment fund managers may have the capability to offer this service to dealers.
Some investment fund managers may need to implement new systems and processes and may therefore incur
additional costs to offer this option.
146 In their Financial Advice Market Review: Call for input (October 2015), https://www.fca.org.uk/publication/call-
for-input/famr-cfi.pdf, the Financial Conduct Authority and HM Treasury identified eight factors preventing people
from seeking financial advice. These factors include: 1) the price of advice; 2) the lack of trust investors have
toward financial advisory firms; 3) investors’ lack of knowledge of their need for financial advice and how to obtain
it; 4) investor overconfidence – believing they do not require help in making financial decisions; 5) investors’ access
to face-to-face advice; 6) the lack of engagement, where investors who are disengaged with financial services are
unlikely to seek financial advice; 7) the lack of skills to use new channels such as the internet if available, and 8) the
lack of need for financial advice.

79
would be effected by the investment fund manager and remitted to the dealer on the investor’s
behalf.147
A factor which may further mitigate the risk that investors may not want to pay upfront for
advice is the extent to which the front-end purchase option – where investors may pay both a
direct commission at the time of purchase and an ongoing embedded trailing commission – is
currently used by investors in Canada. As discussed in Part 4, assets held under the front end
purchase option made up 24% of the market ($298 billion) at the end of 2015, growing 93% over
the previous five years. Investors who make their fund investments under the front-end purchase
option may be more sensitized to upfront fees for advice and may accordingly be less affected by
a transition to direct pay arrangements.
As for the issue of low financial literacy potentially hindering investors’ ability to assess the
value of advisory services or to negotiate fair fees for such services, the CSA anticipate
continuing to work on investor literacy initiatives to increase investors’ awareness of investing
costs and empower them to confidently engage in the negotiation of fees with their
representative. We also expect that our recent POS and CRM2 reforms (further discussed in Part
6) will improve investors’ awareness and understanding of fund and dealer compensation costs
in the lead up to any potential rule proposal discontinuing embedded commissions. This
improved awareness and understanding in turn should give investors an initial point of reference
from which to gauge the appropriateness of advisory fees under direct pay arrangements.
However, industry participants have submitted that a transition to direct pay arrangements would
decrease the transparency of dealer compensation costs as investors would not have any
benchmark to help them assess the reasonableness of the fees they are paying for advice. As
discussed in Appendix B, the CSA considered the option of making certain enhancements to cost
disclosure, including providing certain benchmarking information on product and advice costs.
However, we identified certain drawbacks to that option which led us to decide not to further
pursue it at this time. If we decide to proceed with the discontinuation of embedded
commissions, we anticipate further exploring the potential issue of reduced cost transparency.
b. Choice for investors
Several fund industry stakeholders submit that the discontinuation of embedded commissions
will eliminate the ability of investors to choose148
the payment arrangement they prefer and that
is most convenient to them, and force all investors to enter into fee-based arrangements under
147
We recognize that periodic redemptions may trigger tax consequences (i.e. capital gains or losses) for some
investors. Investors would need to understand the potential tax consequences of this method of payment before
agreeing to it.
148 Many fund industry stakeholders submit that investors currently have the option of choosing fee-based
arrangements by investing in a fee-based series of a fund (for e.g. Series F). In Parts 2 and 4 and Appendix A of this
Consultation Paper, we suggest that the fee-based series may not be a true option for all investor segments due to the
fact that dealers offering fee-based arrangements typically require a minimum investment amount of $250,000 or
more prior to establishing an account.
80
which they would have to pay a fee that is based on a percentage of their assets under
administration.
We recognize that fee-based arrangements may not be suitable for all investors in all
circumstances. Accordingly, as discussed in Part 3, we expect that further to the discontinuation
of embedded commissions, dealers and representatives would offer their clients a compensation
arrangement that suits their particular investment needs and objectives and reflects the level of
service desired. Such compensation arrangements could include commissions on trades, hourly
fees, a flat fee, a fee-based arrangement, or other suitable arrangement. We would expect
representatives to fully inform their clients of the types of accounts available, and the differences
between those accounts, both in terms of service and cost. Our expectation is that investors
would have more choice in how they may pay for advisory services further to the discontinuation
of embedded commissions, not less.
c. Uneven playing field and regulatory arbitrage
Several fund industry stakeholders submit that to require mutual funds to move away from
embedded commissions would create an uneven playing field between mutual funds and
competing financial products with embedded commissions, including banking and insurance
investment products. As discussed in Part 3, we anticipate that any rule proposal we might
undertake would discontinue embedded commissions for all types of investment funds and
similar products that are governed by securities regulation. The rule proposal would capture not
only conventional mutual funds, but also ETFs, non-redeemable investment funds, and structured
notes, whether sold under a prospectus or in the exempt market. Accordingly, this would assure
a level playing field amongst investment fund and fund-like products that the CSA regulates.
We recognize the potential for regulatory arbitrage in banking and insurance products, and as
discussed in Part 3, the CCIR does as well. It is examining potential gaps in the regulatory
framework for segregated funds and assessing the risk of regulatory arbitrage by dually-licensed
insurance agents and has indicated an intention to act proactively to amend regulation where
appropriate to address this risk. The CSA plans to continue to liaise with other regulators to
discuss the risk of dealers and representatives prioritizing their compensation interests over the
interests of their clients by inappropriately shifting their clients’ assets to other investment
products with embedded fees.
Questions
27. How practicable are the mitigation measures discussed and how effective would these
measures be at assuring:
access to advice for investors,
choice of payment arrangements for all investor segments, and
a level playing field amongst competing investment products?
28. What other measures should the CSA consider to mitigate the above unintended
consequences?

81
29. Other than the potential impacts we have identified in Part 4, what other potential unintended
consequences, including operational impacts and tax consequences, may arise for fund
industry stakeholders and investors further to the discontinuation of embedded commissions?
In particular:
a. Would there be a negative tax impact to investors associated with their payment of
dealer compensation under direct pay arrangements? In particular, would the
investor’s payment of dealer compensation through periodic fund redemptions
facilitated by the investment fund manager attract tax consequences? Please explain.
b. To the extent a transition to direct pay arrangements results in the rationalization of
fund series, could this rationalization attract negative tax consequences for investors?
c. What, if any, measures, regulatory or otherwise, could assist in mitigating potential
operational and tax impacts?
30. With respect to the loss of a form of cross-subsidy from high net worth investors to lower-
wealth investors in a fund further to a transition to direct pay arrangements,
a. to what extent (please quantify where possible) would the loss of this cross-subsidy
increase the cost of providing advice and services to lower-wealth fund investors
under direct pay arrangements?;
b. does the existence of this form of cross-subsidy suggest that high net worth fund
investors may be indirectly paying fees that are not aligned with the services they are
receiving (i.e. do the fees they pay exceed the actual cost of the services and advice
they receive?); and
c. what measures may mitigate the potential effects on dealers, representatives and
investors from the loss of the cross-subsidy?
31. What measures could fund industry participants proactively take to mitigate the unintended
consequences that may stem from the discontinuation of embedded commissions?
2. Transition options
We recognize that a transition to direct pay arrangements would require fund industry
participants to adopt new business models that would likely entail the use of new systems and the
adoption of new processes that would take a significant amount of time to set up and implement.
We also recognize that this change would have important implications for investors, and that it
would be essential for fund industry participants, including investment fund managers, dealers
and representatives, to successfully manage their clients’ experience during a transition.

82
Therefore, to the extent we may decide to move forward with a rule proposal discontinuing
embedded commissions, we wish to identify potential transition options that could mitigate
possible negative business and client impacts that may result throughout a transition.
With the foregoing in mind, we are currently considering a number of alternative measures that
could be used to assist in promoting a successful transition while minimizing any resulting
negative impacts. However, before we decide to implement any particular transition option, we
want to ensure we have a full understanding of, and carefully consider, each option’s potential
impacts and consequences.
The following provides a brief discussion of some potential transition options we could consider.
We seek your feedback on these options and any other possible options.
Option 1: Transition to direct pay arrangements within a defined transition period
One potential option could be to discontinue all embedded commission payments within a
certain time period (the Transition Date) after the effective date of any final rule implementing
such a transition (the Effective Date). For greater certainty, such payments would include
trailing commissions and other ongoing service fees paid to dealers by an investment fund,
investment fund manager or structured note issuer, and internal transfer payments from affiliates
to dealers within integrated financial service providers which are directly tied to an investor’s
purchase or continued ownership of an investment fund security or structured note. The sale of
investment funds by means of DSC purchase options would also cease upon the Transition Date.
Under this option, existing redemption schedules set by DSC purchase options (including those
entered into before the Effective Date) could either be maintained after the Transition Date until
the redemption schedule is completed (i.e. redemption fees could continue to be charged until the
schedule expires in its normal course), or discontinued contemporaneously with all other
payments at the Transition Date.
In our view, to successfully achieve a transition to direct pay arrangements, dealers would need
sufficient time to design and implement direct pay arrangements, and representatives would need
to meet with their clients to explain the upcoming changes and their associated impact.
Likewise, investment fund managers and structured note issuers would need sufficient time to
modify affected areas of their business. For instance, we anticipate that issuers will likely
rationalize the number of purchase options or series options offered for their investment fund
products as a result of a transition to direct pay arrangements. Disclosure documentation will
also need to be revised to account for changes that may result from the transition (for example, to
account for the specific fees that may apply following the transition periods, or to account for
any change in the number of purchase and series options).
Investment fund managers, structured note issuers, dealers and representatives would also need
time to make necessary system, compliance, procedural and process changes needed to
implement the potential transition. Issuers and dealers will also need time to coordinate and
cooperate to successfully manage the associated client impact resulting from the transition (for

83
example, to move clients from one series of a fund to another to the extent certain series are no
longer offered).
Given what we understand will need to be completed by investment fund managers, structured
note issuers, dealers and representatives, we recognize that it will be imperative to provide
sufficient time to all affected parties to ensure a successful transition. In this regard, we suggest
that a Transition Date of 36 months after the Effective Date could provide sufficient time to
complete all required transition steps. We are open to other transition periods and encourage
stakeholders to specifically comment on this point.
Option 2: Transition to direct pay arrangements by account
An alternate option could be to transition to direct pay arrangements in phases, by phasing in a
dealers’ account base over multiple periods. This approach would require dealers to transition a
certain percentage of accounts by a certain date, a further percentage by a later date, and so on
until all accounts have fully transitioned.
Similar to option 1, existing redemption schedules set by DSC and low-load purchase options
(including those entered into before the transition) could either be maintained until the
redemption schedule is completed (i.e. redemption fees could continue to be charged until the
schedule expires in its normal course), or discontinued contemporaneously with all other
payments at the Transition Date. Consistent with option 1, we anticipate that if the Transition
Date were 36 months after the Effective Date, it could provide sufficient time to transition to the
final percentage of accounts, but are open to other transition periods and encourage stakeholders
to specifically comment on this point.
We recognize that there may be some logistical and practical constraints in transitioning to direct
pay arrangements via a phased-in approach. For example, it may be difficult to coordinate
tailored disclosure for investment products with the various time points, and it may also be
difficult for issuers to rationalize their series and purchase options. We are therefore interested
in your feedback on these potential approaches.
Questions
32. For each transition option, please tell us how your business (investment fund manager or
dealer) would have to operationally change or restructure in terms of systems and processes
and the related cost implications. Where possible, please provide data on the estimated
costs.
Are there unique costs or challenges to specific businesses?
What transition period would be appropriate?
Should existing redemption schedules for DSC and low-load purchase options be
maintained until the redemption schedule is completed, or discontinued at the
Transition Date?

84
33. Which transition option would you prefer? Why? Are there alternative transition options
that we should consider?
34. As discussed in Appendix B, the CSA did not retain the option of capping embedded
commissions, either as a stand-alone solution to the key issues discussed in Part 2 or as an
interim step toward an eventual discontinuation of embedded commissions. Should the
CSA further consider using a fee cap as a transition measure? Why?
PART 6 – RELATED REGULATORY INITIATIVES AND EXISTING TOOLS
In this part, we consider the extent to which related CSA initiatives and existing regulatory tools
may help address the market efficiency and investor protection issues we identified in Part 2.
The initiatives and tools discussed below include:
1. The POS and the Client Relationship Model (CRM) disclosure requirements and
enhancements;
2. Compliance review initiatives; and
3. The proposals under CSA CP 33-404.
1. Discussion of Point of Sale & CRM
Overview of POS and CRM reforms
Over the last several years, the CSA have through the POS and CRM reforms, enhanced the
disclosure of fund fees and dealer compensation provided to investors at the point of sale, at
account opening, and in the account performance reporting process. The POS and CRM reforms
aim to improve investors' awareness and understanding of the initial and ongoing costs
associated with their investment, including their dealer’s compensation, in order to enable them
to:
make a more informed investment decision at the time of the initial sale; and
assess the cost of the services their dealer and representative provides over the course of
the registrant-client relationship.
The fee disclosure enhancements under the POS and CRM reforms are briefly summarized
below.
i. Point of Sale
The POS reforms introduced the four page fund facts disclosure document that, as at June 13,
2014, has replaced the lengthier simplified prospectus as the document that dealers are required
to send or deliver to investors in connection with a trade in a conventional mutual fund. As at
85
May 30, 2016, the fund facts is required to be delivered to the investor ‘pre-trade’; that is, before
the dealer accepts an instruction from the purchaser for the purchase of the security.
The fund facts aims to improve fee transparency by disclosing, in summary form, the costs of
buying, owning, and selling conventional mutual fund securities. The costs disclosed include:
the sales charges that an investor may pay at the time of purchase and any deferred sales
charges that an investor may pay if the securities are redeemed within a specified period
after purchase, each expressed in percentages and in dollars based on a $1,000
investment;
the commission, expressed on a percentage basis, that the investment fund manager pays
to the dealer for purchases made under the DSC option;
the range of the trailing commissions paid by the investment fund manager to the dealer
for each purchase option, expressed both in percentages and in dollars based on a $1,000
investment; and
the management expense ratio, trading expense ratio, and fund expenses, expressed in
percentages. The fund expenses are also expressed in dollars based on a $1,000
investment.
To alert investors to the conflict of interest created by embedded compensation such as trailing
commissions, the foregoing cost disclosure is required to be prefaced by a statement that “higher
commissions can influence representatives to recommend one investment over another”. The
disclosure also includes a general description of what trailing commissions pay for.
While the fund facts document currently only applies to conventional mutual fund securities, the
CSA will, at the time of publication of this Consultation paper, have published final rules
introducing a similar summary disclosure document for exchange traded funds, called “ETF
Facts”.
ii. CRM
The CRM reforms, which have been implemented in phases over the last several years,
introduced new requirements in a number of areas related to a client’s relationship with a
registrant. The first phase of CRM introduced relationship disclosure information delivered to
clients at account opening (by explaining, for example, the types of products and services
provided by the registrant), and comprehensive conflicts of interest requirements. CRM2
introduced new disclosure requirements relating to investment performance at the account level
and the commissions and other amounts paid to dealers. A particular objective of this second
phase was to increase mutual fund investor’s awareness of trailing commissions paid to dealers.
CRM2 was not intended to address product costs. Generally, the CRM reforms apply broadly to
all types of securities held by a client.
As a result of the CRM reforms, at account opening, clients are now provided with more fulsome
information on charges, including transaction charges, which they may expect to pay in
86
connection with their investment. Where the investment is in mutual funds, for example, the
information should include:
the management fee paid by the fund;
the initial sales charge and DSC options available to the client (along with an explanation
of how such charges work); and
any trailing commissions or other embedded fees paid in connection with the investment.
Following a transaction, clients are provided with a trade confirmation that includes disclosure of
each transaction charge, deferred sales charge or other charge applying to a transaction, and the
total amount of all charges. Thereafter, on an annual basis, the report on charges and other
compensation now provides a summary of all charges incurred by the client and all
compensation received by the dealer that relates to each account the client holds with the dealer,
including:
the total dollar amount of each type of transaction charge related to the purchase or sale
of securities paid by the client during the period covered by the report, and the total
amount of those charges;
the total dollar amount of each type of payment, other than a trailing commission, that is
made to the dealer or any of its representatives by a securities issuer or another registrant
(e.g. an investment fund manager) in relation to registerable services to the client – this
amount captures upfront commissions that investment fund managers pay to dealers for
sales made under DSC arrangements; and
the total dollar amount of trailing commission received by the dealer in connection with
securities held in the client’s account, accompanied by a statement advising the client that
the trailing commission is paid by investment fund managers, that its amount varies
depending on the purchase option selected, and that these fees affect the client because
they reduce the amount of the fund’s returns.
The client’s annual investment performance report for each account held with the dealer also
includes the following information to better enable the client to evaluate how their investments
have performed:
a detailed breakdown of all deposits into and withdrawals out of the account;
the change in market value of the account (in dollars); and
the annualized total percentage return of the account for the previous year, as well as the
previous three, five, and ten years.
87
How POS and CRM may address the identified issues
The CSA will monitor the impact of the POS and CRM.149
While we expect it will be a number
of years before these impacts may be fully evaluated, generally, we expect the reforms to
appreciably improve investors’ awareness and understanding of mutual fund costs and
performance, and make them more informed consumers of investment fund products and advice
services. We anticipate that these improvements will partially address the key issues we have
identified.
The following discussion provides further analysis for each of the key issues:
Issue 1 – Embedded commissions raise conflicts of interest that misalign the interests of
investment fund managers, dealers and representatives with those of investors
We anticipate that the enhanced disclosure required at the time of sale (by the POS reforms), at
account opening and annually thereafter (by the CRM reforms) will lead to increased
transparency of fund costs and dealer compensation. The increased transparency should better
enable investors to compare the costs of investing in one mutual fund over another, which should
equip investors with better tools to manage the impact of fund costs on their returns.
The introduction of account performance reporting coupled with the heightened transparency of
fund costs and dealer compensation (and in particular trailing commissions) may also cause
investors to question the services that their representatives provide and allow investors to better
assess the true costs and value of the services they receive. This awareness in turn may, over
time, lead to changes in the consistency and level of services provided by dealers and
representatives to investors, and the selection of lower-cost funds and, possibly, better
performing funds. To the extent this occurs, we anticipate that investment fund managers may
respond to dealers’ different product demands by producing lower-cost funds and focusing more
on performance, thus potentially increasing competition and market efficiency. The investment
fund manager response may be further shaped by the extent to which the POS and CRM reforms
may cause clients to also question the cost of the investment fund manager.
Overall, these potential positive effects of enhanced disclosure on the registrant-client
relationship and investment fund manager behavior may combat some of the harms resulting
from Issue 1. However, we believe disclosure alone may fall short of fully addressing the
inherent conflicts of interest under Issue 1 for the reasons below:
i. The research we have reviewed (see Part 2 and Appendix A) suggests that, as long as
product embedded commissions continue to be permitted,
a. the compensation bias in such commissions may continue to incent dealers and
their representatives to recommend to investors products that give priority to
149
The CSA recently began a multi-year research project to measure the impacts of CRM2 and POS on investors
and the industry. The research will measure outcomes related to investor knowledge, attitude and behavior,
registrant practices, and fund fees and product offerings. It will cover activity from 2016 through 2019 and is
expected to be completed in 2021.
88
maximizing revenue over the interests of clients – potentially impairing investor
outcomes and market efficiency; and
b. investment fund managers will continue to be incented to compete for sales on the
basis of the compensation they pay dealers, reducing the likelihood that they will
compete on the basis of performance and skill – potentially disadvantaging skilled
fund managers who do not pay higher than standard trailing commissions or who
do not pay any trailing commissions. As discussed in Part 2, this incentive can
drive up fund costs overall and limit the availability of low-cost and passively
managed funds, thus impairing competition and market efficiency;
ii. Research has shown that disclosure alone may not be an effective remedy at addressing
conflicts of interest in an advisor-client relationship. Specifically, research suggests that
advisors provide more biased advice when a conflict of interest is disclosed than when it
is not, and that advisees may not sufficiently discount the advice to counteract the
increased bias.150
Further research also suggests that disclosure of a conflict of interest
can have unintended, perverse effects such as advisees being more likely to follow
conflicted advice.151
To the extent such effects occur in the advisor-client relationship as
a result of the disclosure, advice and decision making may be suboptimal leading to poor
investor outcomes and decreased market efficiency; and
iii. Investors’ high level of trust and reliance on their advisors for investment decisions may
cause them to not thoroughly review disclosure documents and reports, and thus limit the
benefits to be derived from disclosure. For example, a recent study conducted by the
British Columbia Securities Commission (BCSC) found that, among other things, 89% of
respondents described their existing level of trust in their investment representative as
strong or very strong. This trust led some clients to place less importance on reading
their account statements because they were confident that their representative was taking
care of their investments.152
Similarly, a recent survey conducted by the CSA shows that
investors’ primary source of investment information is their advisors, with 43% of
investors classified as exclusively relying on their advisor.153
To the extent that clients do
not rely on disclosure for their investment decisions, the resulting benefits of the
disclosure may be limited as they may not be fully informed with respect to all account
150
Daylain M. Cain, George Loewenstein and Don A. Moore, “The Dirt on Coming Clean: Perverse Effects of
Disclosing Conflicts of Interest”, The Journal of Legal Studies, Vol. 34, No. 1 (January 2005), pp. 1-25,
http://www.arts.uwaterloo.ca/~dkoehler/ACC784/CainLoewensteinMoore2006.pdf.
151 Sunita Sah, “The Paradox of Disclosure”, The New York Times, July 8, 2016,
http://nytimes.com/2016/07/10/opinion/sunday/the-paradox-of-disclosure.html?_r=0.
152 BC Securities Commission, National Smarter Investor Study, Public Opinion Research (November 2015),
https://investright.org/wp-content/uploads/2016/09/Smarter-Investor-Study-FULL-REPORT-1.pdf.
153 The CSA Investor Education Study 2016, https://www.osc.gov.on.ca/documents/en/About/csa_investor-
education-study.pdf.

89
fees and performance, and may not fully or effectively question or assess the services
provided.
Issue 2 – Embedded commissions limit investor awareness, understanding and control of
dealer compensation costs
As discussed in connection with Issue 1 above, the enhanced and more prominent disclosure of
fund fees, including embedded dealer compensation, should increase an investor’s awareness and
understanding of such costs and better equip them to manage the impact of those costs on their
investment returns.
However, to the extent dealer compensation continues to be paid out of fund management fees,
we think the POS and CRM reforms may only partially address Issue 2 for the reasons below:
i. The fund fee structure will remain relatively complex which, as discussed in Part 2, may
continue to impede investors’ understanding of dealer compensation costs and fund fees;
ii. Investment fund managers will continue to determine the compensation paid to the dealer
without any direct involvement of the client. This current arrangement limits a client’s
engagement in the dealer compensation process and consequently limits their awareness
and control over that compensation.
Discontinuing embedded commissions would remove the investment fund manager from the
dealer compensation process and enable the direct involvement of the client with their
representative over the compensation paid. This involvement in turn may lead to greater fee
awareness, as well as create opportunities for a client to negotiate, and have greater control over,
the ultimate compensation paid.
Issue 3 – Embedded commissions paid generally do not align with the services provided
to investors
As noted in Issue 1 above, the increased performance reporting coupled with the increased
saliency of fund costs and dealer compensation should cause investors to question the services
provided by their representative. To the extent that investors respond to fund fee disclosure
under CRM2 by either questioning the overall level of services and advice they are receiving
from their representative or switching to lower-cost alternatives, we would expect the
representative to respond by demonstrating their value proposition and reviewing the level of
services provided. To the extent this change occurs, these disclosure reforms may improve the
alignment between the embedded dealer compensation paid and the services provided to
investors and therefore assist in addressing Issue 3. Nevertheless, embedded commissions will
remain a “one-size-fits-all” fee that may not align well with the services and advice actually
provided to individual investors in accordance with their specific needs, expectations and
preferences. This misalignment in turn may cause some investors to pay more fees than
necessary relative to the services received, thus impeding investment returns.

90
2. Discussion of Compliance Review Initiatives
Overview of the compliance review initiatives
Some CSA members are completing various compliance review initiatives on sales incentives
that may give rise to conflicts of interest when distributing investment funds. In certain cases,
the compliance initiatives are also being coordinated with the MFDA and IIROC.
While some reviews are completed and others are ongoing, the reviews include an examination
of, among other things, practices that are designed to influence the selection of investment funds
for distribution by a representative to clients. For example, in early 2016, the Ontario Securities
Commission (OSC) completed a focused review of mutual fund sponsored conferences
organized and presented by investment fund managers to assess compliance with NI 81-105.
The OSC and the Autorité des marchés financiers (AMF) have also issued a survey requesting
information from a sample of investment fund managers relating to management fee discounts
that are based on total assets held by a dealer.
How the compliance review initiatives may address the identified issues
The CSA will monitor the results of the compliance reviews to determine the full extent to which
the review addresses each of the market efficiency and investor protection issues identified.
While the full effect of the reviews remains to be determined, the CSA do not at this time
anticipate that the initiatives will, on their own, materially address the identified key issues.
The following discussion provides further analysis for each of the key issues:
Issue 1 – Embedded commissions raise conflicts of interest that misalign the interests of
investment fund managers, dealers and representatives with those of investors
The CSA expect that the reviews may reduce the incidence of inappropriate practices designed to
drive sales. To the extent inappropriate practices designed to drive sales are reduced, the CSA
anticipate a reduced incentive for products to be recommended on the basis of inducements
received by the representative – potentially leading to a shift in recommendations from funds that
were inappropriately favored to those that may be more suitable for an investor. If these funds
are better performing funds, the shift in recommendations may reward better performing
investment fund managers with an increase in market share, which should in turn lead to greater
competition in the marketplace and efficiency in general (as investment fund managers would
face increasing pressure to compete on the basis of performance, and not on incentives they offer
to dealers).
Given the foregoing, the CSA expect that the review may partially assist in addressing Issue 1.
However, we do not anticipate that the review will fully address Issue 1 primarily because the
payment of trailing commissions and other forms of embedded compensation will continue to be
permitted. As a result, the conflicts of interest facing dealers and representatives will continue to
be present, which may continue to encourage investment recommendations that may impair
investor outcomes. Additionally, the continued presence of embedded commissions will not
address the conflicts that exist at the investment fund manager level, maintaining the potential
for underperformance and higher-costs overall.

91
Issue 2 – Embedded commissions limit investor awareness, understanding and control of
dealer compensation costs
The CSA do not expect the outcomes of the review to address Issue 2. As this initiative will be
focused on incentives provided to dealers and representatives and is not disclosure or client
focused, it is not expected to increase investors’ overall awareness, understanding and control of
dealer compensation costs and fund fees. Additionally, we do not anticipate the review having
any impact on reducing the complexity of the mutual fund fee structure or on the industry
generally.
Issue 3 – Embedded commissions paid generally do not align with the services provided
to investors
The CSA also do not expect the outcomes of the review to address Issue 3. Similar to Issue 2, as
this initiative will be focused on incentives provided to dealers and representatives and is not
disclosure or client focused, there are no aspects of this review that are expected to directly
increase the alignment between embedded commissions and services provided to fund investors.
3. Discussion of the proposals to enhance the obligations of advisers, dealers and
representatives toward their clients outlined in CSA Consultation Paper 33-404
Overview of CSA Consultation Paper 33-404
On April 28, 2016, the CSA published CSA CP 33-404 seeking comment on proposed regulatory
action aimed at enhancing the obligations and duties of advisers, dealers, and representatives
toward their clients. The proposals, which are in response to issues the CSA identified in the
client-registrant relationship, include measures to:
better align the interests of registrants to the interests of their clients;
clarify the nature of the client-registrant relationship; and
improve outcomes for clients.
The concept proposals outlined in CSA CP 33-404 introduce a number of targeted reforms to
National Instrument 31-103 Registration Requirements, Exemptions and Ongoing Registrant
Obligations that include, among others, proposals to strengthen the regulation of conflicts of
interest, the know-your-client (KYC) and KYP requirements, the suitability obligation,
proficiency of representatives, and the use of titles.
For example, with respect to the regulation of conflicts of interest, dealers and representatives
would be required to respond to each identified material conflict of interest in a manner that
prioritizes the interests of the client ahead of their own. Moreover, any disclosure given to a
client about a conflict of interest would need to be prominent, specific, and clear. Importantly,
the disclosure should be meaningful to the client to allow the client to fully understand the
conflict, including the implications and consequences of the conflict for the client. CSA CP 33-
404 states that disclosure alone is a generally inadequate mitigation mechanism because of its
92
limited impact on a client’s decision-making process.154
That consultation paper also provides
guidance on specific conflict of interest situations related to compensation practices.
The KYC process would also be improved to ensure it results in a thorough understanding of the
client, and as a result would require a representative to gather more client-centered information
relating to the client’s investment needs and objectives, financial circumstances, and risk profile.
Amendments to the KYP process would explicitly require representatives to have sufficient
knowledge of a product, together with the KYC analysis, to support a proper suitability analysis.
Ultimately, this process would require representatives to thoroughly consider, among other
things, the product strategies, features, costs and risks of each security on the firm’s product list.
Moreover, representatives would be required to understand and consider how a product being
recommended compares to other products and how the recommendation would fit within the
client’s account and overall strategy.
Dealers would be required to identify whether they have a proprietary or mixed/non-proprietary
product shelf. Dealers with a mixed shelf would be required to undertake a fair and unbiased
market investigation of a reasonable universe of products to satisfy themselves they have a range
of products that are most likely to meet the investment needs and objectives of its clients based
on its client profiles.
The suitability analysis would also be reinforced to ensure that recommendations satisfy the
following three broad elements: basic financial suitability, investment strategy suitability, and
product selection suitability. Of note, the product selection suitability determination would need
to take into account the impact on the performance of the product of any compensation paid to
the registrant by the client or a third party in relation to the product.
The proposals would also introduce new requirements aimed at increased proficiency for
representatives, including increased proficiency of how product costs and investment strategies
(such as active and passive) can impact investment outcomes for clients.
In addition to the targeted reforms discussed above, all of the CSA jurisdictions other than the
BCSC are consulting on a regulatory best interest standard, accompanied by guidance, that
would form both an over-arching standard and governing principle against which all other client-
related obligations would be interpreted. Generally, a regulatory best interest standard would
require that a registered dealer and its representatives deal fairly, honestly, and in good faith with
its clients and act in its clients’ best interests. Several CSA members have expressed strong
reservations relating to the adoption of a regulatory best interest standard.
If the potential reforms outlined in CSA CP 33-404 are implemented, they would cover a broad
spectrum of obligations for registrants and apply to all advisers, dealers and representatives,
including those who are members of IIROC and the MFDA. Ultimately, these potential reforms
are intended to work together to improve the overall client-registrant relationship.
154
See CSA CP 33-404, Appendix A.
93
How the CSA CP 33-404 proposals may address the identified issues
It is important to note that the concept proposals discussed in CSA CP 33-404 are not
specifically designed to address the key investor protection and market efficiency issues
identified in this Consultation Paper. The CSA will however monitor the development of those
proposals over the consultation process and continue to evaluate the extent to which they may
address our key issues. We consider that the potential reforms discussed in CSA CP 33-404
may, to the extent they are adopted in their current form, better align the interests of registrants
with the interests of their clients, clarify the nature of the client-registrant relationship and
improve outcomes for investors overall. The CSA expect that these potential reforms may assist
in addressing, to a partial extent, the investor protection and market efficiency issues we have
identified in this Consultation Paper.
The following discussion provides further analysis for each of the key issues:
Issue 1 – Embedded commissions raise conflicts of interest that misalign the interests of
investment fund managers, dealers and representatives with those of investors
The CSA anticipate that the potential reforms discussed in CSA CP 33-404 would, if
implemented, lead to better conflict of interest management that may, in turn, assist in mitigating
the conflict of interest that embedded commissions raise for dealers and representatives. We are
of this view for several reasons, including because representatives would be required to respond
to conflicts of interest in a manner that prioritizes the interests of the client ahead of their own.
With respect to dealer compensation, for example, dealers would need to assess whether any
remuneration could reasonably be expected to inappropriately influence how representatives
interact with their clients. To the extent that the compensation gives rise to a conflict, firms
would need to ensure that there are adequate controls and oversight in place to mitigate the
conflict. Importantly, if the conflict cannot be managed, it must be avoided.
We are also of the view that the CSA CP 33-404 proposals would lead to better conflict of
interest management because dealers and representatives would specifically be required to
consider the impact of their compensation on performance as part of the suitability analysis. To
the extent a product is recommended because it benefits the dealer or representative, but there is
another equally suitable product on the dealer’s product list that would be less costly for the
client, such recommendation would not comply with the suitability obligation or the dealer’s
general duties to their client.
As a result of the foregoing, the CSA anticipate that tied forms of compensation may play less of
a role in product recommendations. Combined with the enhancements to KYC, KYP, suitability,
and proficiency, the CSA anticipate that representatives’ recommendations may shift to more
suitable products that may be lower-cost and, possibly, better performing products. To the extent
that the CSA CP 33-404 proposals result in shifts in product recommendations toward lower-cost
and better performing products, we anticipate that those proposals may also have an indirect
effect over time on investment fund managers as they may respond to these shifts by producing
lower-cost funds and placing a greater emphasis on performance. This shift would potentially
reward better performing investment fund managers with increased market share, thereby
improving competition and market efficiency.

94
Given the apparent benefits of the foregoing, the CSA expect that the concept proposals outlined
in CSA CP 33-404 (if adopted in its current form), in combination with the POS and CRM
reforms as well as the compliance review initiatives, may address Issue 1. For the following
reasons, we are nevertheless considering whether discontinuing embedded commissions may
also be necessary.
Firstly, the proposals were not developed to address the conflict that embedded commissions
raise at the investment fund manager level. As a result, the anticipated positive effects of the
proposals on investment fund manager behavior (i.e. production of lower-cost funds and
increased focus on performance), as well as the consequential positive effects on competition and
market efficiency, are dependent on the effect the proposals have on representatives’
recommendations. While the extent to which representatives’ recommendations would shift
remains to be determined, there are certain aspects of the proposals that may lessen its ultimate
impact on investment fund manager behavior, competition and market efficiency generally.
Until such time as dealer recommendations shift to the degree necessary to trigger change at the
investment fund manager level (if at all), investment fund managers may continue to be incented
to rely more on the payment of embedded commissions rather than on skill to sell their products
and gain market share. As discussed in Part 2 above, the payment of embedded commissions can
reduce a manager’s focus on performance and lead to underperformance.
Secondly, the payment of embedded commissions is not addressed under CSA CP 33-404.
Embedded commissions may continue to create a barrier to entry that may reduce the likelihood
of lower-cost providers entering the market. As discussed in Part 4, the entrance of lower-cost
providers may place competitive pressure on fund costs and encourage the manufacturing and
distribution of lower-cost funds. Embedded commissions may also dampen the extent to which
independent investment fund managers are able to access the IIROC and independent mutual
fund dealer distribution channels. Taken together, these effects may limit price competition and
market efficiency.
Finally, in our view, a potential discontinuation of embedded commissions may complement the
concepts outlined in CSA CP 33-404. We are of this view because a discontinuation may
remove the conflict of interest that embedded commissions raise for dealers, representatives and
investment fund managers and may better align their interests with those of investors.
Issue 2 – Embedded commissions limit investor awareness, understanding and control of
dealer compensation costs
CSA CP 33-404 was not designed to address Issue 2. While transparency of fees may increase to
the extent embedded dealer compensation arrangements are disclosed as part of the conflict of
interest mitigation process, investment fund managers would still continue to determine the
compensation paid to dealers without any direct involvement of the client. The lack of direct
client involvement in the dealer compensation process may limit fee awareness, as well as the
level of control a client has over the compensation ultimately paid to their dealer and their
representative for the services provided. Moreover, the presence of embedded compensation
may continue to make the fee structure more complex, which may continue to inhibit investors’
understanding of such costs.

95
Issue 3 – Embedded commissions paid generally do not align with the services provided
to investors
CSA CP 33-404 was also not designed to address Issue 3. The CSA expect that the
enhancements to KYC, KYP, suitability, and proficiency requirements, along with improved
conflict of interest mitigation, may encourage the provision of advice and services to investors
that better meet their needs and objectives. However, embedded commissions will still remain a
“one-size-fits-all” fee that may not align well with the services and advice actually provided to
individual investors in accordance with their specific needs, expectations and preferences. This
misalignment may cause some investors to pay more fees than necessary relative to the services
received, thus impeding investment returns.
Questions
35. Please explain whether you think each of the initiatives discussed above will, either alone or
in combination:
address the three investor protection and market efficiency issues and their sub-issues
identified in Part 2; and
address or not address any additional harms or issues that you have identified.
36. Are there alternative options or measures, whether regulatory or market-led, that could
successfully address the three investor protection and market efficiency issues and their sub-
issues identified in Part 2. If so, please explain.
PART 7 – COMMENT PROCESS AND NEXT STEPS
The issues addressed in this Consultation Paper are important ones which affect all participants
in the Canadian capital markets. Due to the broad impact of the policy option discussed in this
Consultation Paper, the contribution of stakeholders is important. We invite all interested parties
to make written submissions.
Some CSA jurisdictions will hold in-person consultations in 2017 to facilitate additional
feedback and further our consideration of the issues discussed in this Consultation Paper. The
details of any in-person consultations will be announced.
Once we have considered the feedback received through the written comment process and any
in-person consultations, we will decide on the appropriate policy response, if any, communicate
our policy direction and propose any necessary rule changes to implement the policy. Any rule
proposal would be published for comment in accordance with the regular rule-making process.
Please submit your comments in writing on or before June 9, 2017. You may provide written
comments in hard copy or electronic form. If you are not sending your comments by email,
please send a CD containing the submissions (in Microsoft Word format).

96
Certain CSA regulators require publication of the written comments received during the
comment period. We will publish all responses received on the websites of the Autorité des
marchés financiers (www.lautorite.qc.ca), the Ontario Securities Commission
(www.osc.gov.on.ca), and the Alberta Securities Commission (www.albertasecurities.com).
Therefore, you should not include personal information directly in comments to be published. It
is important that you state on whose behalf you are making the submission.
Please address your submission to all of the CSA as follows:
British Columbia Securities Commission
Alberta Securities Commission
Financial and Consumer Affairs Authority of Saskatchewan
Manitoba Securities Commission
Ontario Securities Commission
Autorité des marchés financiers
Financial and Consumer Services Commission, New Brunswick
Superintendent of Securities, Department of Justice and Public Safety, Prince Edward Island
Nova Scotia Securities Commission
Securities Commission of Newfoundland and Labrador
Superintendent of Securities, Northwest Territories
Superintendent of Securities, Yukon
Superintendent of Securities, Nunavut
Deliver your comments only to the addresses below. Your comments will be distributed to the
other participating CSA regulators.
The Secretary
Ontario Securities Commission
20 Queen Street West
19th Floor, Box 55
Toronto, Ontario M5H 3S8
Fax: 416-593-2318
Me Anne-Marie Beaudoin
Corporate Secretary
Autorité des marchés financiers
800, square Victoria, 22e étage
C.P. 246, tour de la Bourse
Montréal (Québec) H4Z 1G3
Fax : 514-864-6381
Questions
If you have any comments or questions, please contact any of the CSA staff listed below :

97
Kathryn Anthistle
Senior Legal Counsel
Legal Services, Capital Markets Regulation
British Columbia Securities Commission
Tel: 604-899-6536
Chantal Mainville
Senior Legal Counsel
Investment Funds and Structured Products
Ontario Securities Commission
Tel: 416-593-8168
Wayne Bridgeman
Deputy Director, Corporate Finance
The Manitoba Securities Commission
Tel: 204-945-4905
Danielle Mayhew
Legal Counsel
Alberta Securities Commission
Tel: 403-592-3059
Melody Chen
Senior Legal Counsel
Legal Services, Corporate Finance
British Columbia Securities Commission
Tel: 604-899-6530
John Mountain
Director
Investment Funds and Structured Products
Ontario Securities Commission
Tel: 416-593-3660
George Hungerford
Senior Legal Counsel
Legal Services, Corporate Finance
British Columbia Securities Commission
Tel: 604-899-6690
Andrew Papini
Legal Counsel
Investment Funds and Structured Products
Ontario Securities Commission
Tel: 416-263-7652
Heather Kuchuran
Senior Securities Analyst
Financial and Consumer Affairs Authority of
Saskatchewan
Tel: 306-787-1009
Mathieu Simard
Senior Advisor, Investment Funds
Autorité des marchés financiers
Tel: 514-395-0337, ext. 4471
Toll-free: 1-800-525-0337, ext. 4471
Hugo Lacroix
Senior Director, Investment Funds
Autorité des marchés financiers
Tel: 514-395-0337, ext. 4461
Toll-free: 1-800-525-0337, ext. 4461
Dennis Yanchus
Senior Economist
Strategy and Operations – Economic Analysis
Ontario Securities Commission
Tel: 416-593-8095

98

99
APPENDIX A
EVIDENCE OF HARM TO INVESTOR PROTECTION AND MARKET EFFICIENCY
FROM EMBEDDED COMMISSIONS
Issue 1: Embedded commissions raise conflicts of interest that misalign the interests
of investment fund managers, dealers and representatives with those of
investors
i. Embedded commissions can reduce the investment fund manager’s focus on fund
performance, which can lead to underperformance
Trailing commissions and DSC arrangements may influence fund flows and negatively
impact fund performance:
Research by Douglas Cumming et al155
, examining whether sales and trailing commissions
influence fund sales and using fund level data provided by Canadian investment fund
managers, finds that trailing commissions insulate the investment fund manager by reducing
flow sensitivity to past performance, evidencing the misalignment of interests associated
with embedded commissions. Key findings from the research included:
All flows, with the exception of flows originating from affiliated dealers of the
investment fund manager, are sensitive156
to past performance. Funds that
outperform receive more sales, while funds that underperform receive less sales;
The sensitivity of fund sales to past performance is considerably reduced when:
a. investment fund managers pay embedded commissions to dealers/representatives
– the greater the payment, the greater the level of net flows that is indifferent to
past portfolio manager skill (i.e. alpha). At a 1% trailing commission – the
amount typically paid by front end equity/balanced funds and funds-of-funds in
Canada today – the investment fund manager could expect inflows to increase by
0.3% of assets per month or 3.7% per year, regardless of past performance.
Similarly, a 1.5% trailing commission was found to increase the average monthly
flows by 0.45% of assets under management each month or 5.4% per year
regardless of past performance. On the converse, the research found that fund
flows for mutual fund series that do not pay embedded commissions (fee-based
series) are more sensitive to past performance; and
b. investors are invested under the DSC option. Investments under that option
155
Douglas Cumming et al., supra, note 3.
156 ‘Sensitivity’ is referring to the relationship between past risk-adjusted outperformance and future fund flows after
controlling for all other product specific factors (e.g. fund type, risk classification, series type, etc.) that may provide
a reason for investors and their dealers/representatives to select the product.

100
show the lowest sensitivity to past performance out of all purchase options,
which reflects the impact of the redemption fee on investor behavior; it may
deter investors from redeeming even in the face of consistently poor
performance.
The payment of trailing commissions impacts the relationship between performance
and fund sales such that, for any increase (decrease) in performance, inflows
(outflows) are 15% less than what they would be in the absence of trailing
commissions.
Reduced sensitivity to past performance also impacts future fund performance and
this result applies to funds that pay embedded commissions, funds sold under DSC
arrangements and funds that receive affiliated dealer flows. For example, an
increase in trailing commissions and sales commissions under the DSC by 1% is
indirectly associated with a reduction in future outperformance before fees by 1.4%
and 0.6% respectively, relative to the average monthly performance. This finding
potentially suggests that investment fund managers who pay trailing commissions to
dealers, understanding that outperformance may not be rewarded with additional
inflows, may have a tendency to cease trying to outperform.
Consistent with the Cumming et al. research, a study by Susan Christoffersen et al157
which
examined fund flows between 1993 and 2009 among U.S. mutual funds with loads or
revenue-sharing found that higher payments to fund brokers lead to higher inflows and that
net returns are approximately 50 basis points lower for every 100 basis points of loads.
In contrast to the above research, a study by Investor Economics for the Investment Funds
Institute of Canada158
argues that no single factor can satisfactorily explain the volume of
mutual fund sales and redemptions into a specific fund at a given point in time. Rather,
their study asserts that the flow activity in and out of Canadian mutual funds reflects the
interplay of more than 40 factors, of which they argue the following three to be the most
relevant:
i. macro-economic and demographic factors;
ii. individual fund investment return characteristics; and
iii. preferred access to distribution, via either direct affiliation or strategic alliance.
157
Susan Kerr Christoffersen, Richard B. Evans and David K. Musto, “What do Consumers’ Fund Flows
Maximize? Evidence from Their Brokers’ Incentives”, The Journal of Finance, Vol. 68, Issue 1, (February 2013),
pp. 201-235, available on SSRN: http://papers.ssrn.com/sol3/papers.cfm?abstract_id=1393289.
158 Investor Economics, Analysis of Factors Influencing Sales, Retention and Redemptions of Mutual Fund Units,
September 2015 Study for The Investment Funds Institute of Canada, https://www.ific.ca/wp-
content/uploads/2015/12/Investor-Economics-Analysis-of-Factors-Influencing-Fund-Flows-September-
2015.pdf/12353/
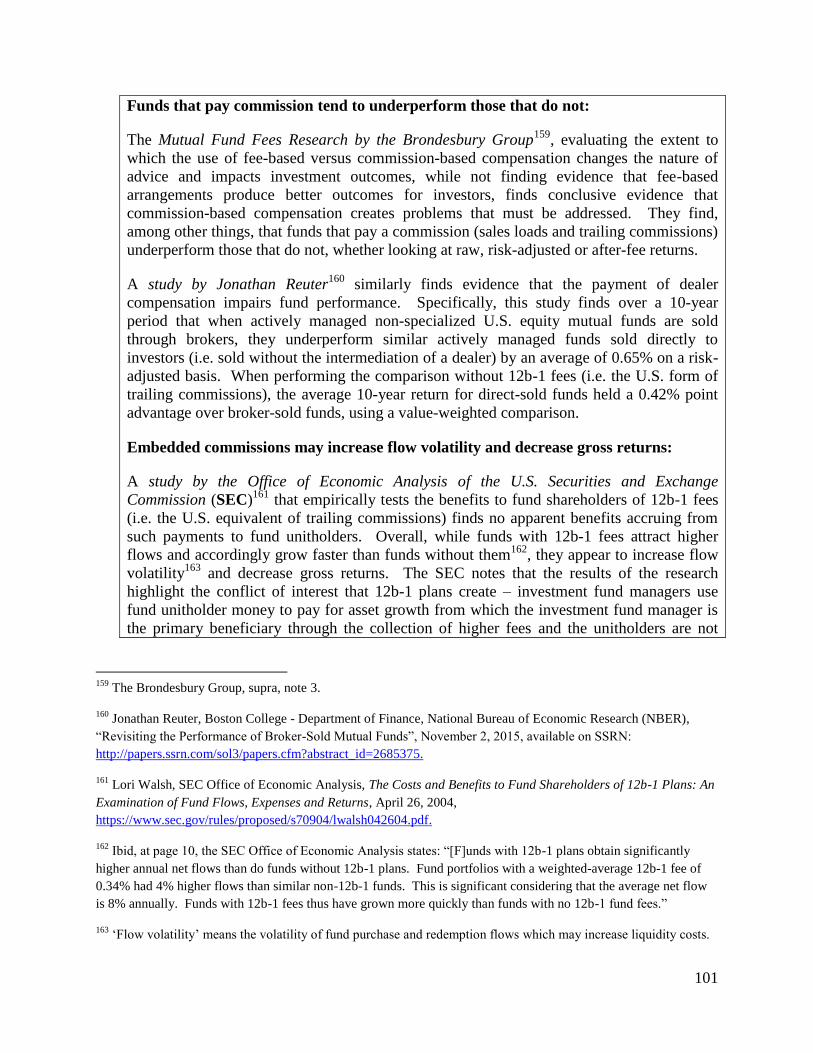
101
Funds that pay commission tend to underperform those that do not:
The Mutual Fund Fees Research by the Brondesbury Group159
, evaluating the extent to
which the use of fee-based versus commission-based compensation changes the nature of
advice and impacts investment outcomes, while not finding evidence that fee-based
arrangements produce better outcomes for investors, finds conclusive evidence that
commission-based compensation creates problems that must be addressed. They find,
among other things, that funds that pay a commission (sales loads and trailing commissions)
underperform those that do not, whether looking at raw, risk-adjusted or after-fee returns.
A study by Jonathan Reuter160
similarly finds evidence that the payment of dealer
compensation impairs fund performance. Specifically, this study finds over a 10-year
period that when actively managed non-specialized U.S. equity mutual funds are sold
through brokers, they underperform similar actively managed funds sold directly to
investors (i.e. sold without the intermediation of a dealer) by an average of 0.65% on a risk-
adjusted basis. When performing the comparison without 12b-1 fees (i.e. the U.S. form of
trailing commissions), the average 10-year return for direct-sold funds held a 0.42% point
advantage over broker-sold funds, using a value-weighted comparison.
Embedded commissions may increase flow volatility and decrease gross returns:
A study by the Office of Economic Analysis of the U.S. Securities and Exchange
Commission (SEC)161
that empirically tests the benefits to fund shareholders of 12b-1 fees
(i.e. the U.S. equivalent of trailing commissions) finds no apparent benefits accruing from
such payments to fund unitholders. Overall, while funds with 12b-1 fees attract higher
flows and accordingly grow faster than funds without them162
, they appear to increase flow
volatility163
and decrease gross returns. The SEC notes that the results of the research
highlight the conflict of interest that 12b-1 plans create – investment fund managers use
fund unitholder money to pay for asset growth from which the investment fund manager is
the primary beneficiary through the collection of higher fees and the unitholders are not
159
The Brondesbury Group, supra, note 3.
160 Jonathan Reuter, Boston College - Department of Finance, National Bureau of Economic Research (NBER),
“Revisiting the Performance of Broker-Sold Mutual Funds”, November 2, 2015, available on SSRN:
http://papers.ssrn.com/sol3/papers.cfm?abstract_id=2685375.
161 Lori Walsh, SEC Office of Economic Analysis, The Costs and Benefits to Fund Shareholders of 12b-1 Plans: An
Examination of Fund Flows, Expenses and Returns, April 26, 2004,
https://www.sec.gov/rules/proposed/s70904/lwalsh042604.pdf.
162 Ibid, at page 10, the SEC Office of Economic Analysis states: “[F]unds with 12b-1 plans obtain significantly
higher annual net flows than do funds without 12b-1 plans. Fund portfolios with a weighted-average 12b-1 fee of
0.34% had 4% higher flows than similar non-12b-1 funds. This is significant considering that the average net flow
is 8% annually. Funds with 12b-1 fees thus have grown more quickly than funds with no 12b-1 fund fees.”
163 ‘Flow volatility’ means the volatility of fund purchase and redemption flows which may increase liquidity costs.
102
obtaining the benefits they should from the payments of 12b-1 fees.
ii. Embedded commissions can encourage dealers and representatives to make biased
investment recommendations which may negatively affect investor outcomes
Commissions encourage biased representative recommendations:
The research by Douglas Cumming et al164
referenced above showed that a rise in trailing
commissions reduces the sensitivity of fund flows to past risk adjusted performance (i.e.
portfolio manager skill), suggesting that these payments bias dealers/representatives toward
funds that pay higher trailing commissions, and away from funds that do not pay industry
standard trailing commission rates, regardless of their performance;
The study by Susan Christoffersen et al165
referenced above found that higher payments to
U.S. fund brokers led to higher inflows, suggesting that brokers’ recommendations are
biased by the payments they receive;
A study by Daniel Bergstresser et al.166
examining broker-sold and direct-sold funds in the
U.S. from 1996 to 2004 found “that flows in broker-sold funds are positively related to
distribution fees, suggesting that sales in the broker sector might reflect broker
compensation incentives.”;
The Mutual Fund Fees Research by the Brondesbury Group167
, referenced above found
that:
higher embedded commissions drive mutual fund sales;
financial advisor recommendations are sometimes biased in favour of higher
commission generating products; and
commissions affect the effort made by financial advisors to overcome investor
behavioral biases, including biases that may lead to sub-optimal returns;
A study by John Chalmers and Jonathan Reuter168
studying the impact of financial advisors
164
Douglas Cumming et al. supra, note 3.
165 Susan Kerr Christoffersen et al, supra, note 157.
166 Daniel Bergstresser, John Chalmers and Peter Tufano, “Assessing the Costs and Benefits of Brokers in the
Mutual Fund Industry,” Review of Financial Studies, Vol. 22, (2009), pp. 4129-4156, at p.4131,
https://pdfs.semanticscholar.org/192b/4d9cde7f484200b037ffbdadabef1b90b800.pdf.
167 The Brondesbury Group, supra, note 3.
168 John Chalmers and Jonathan Reuter, “What is the Impact of Financial Advisors on Retirement Portfolio Choices
and Outcomes?”, NBER Working Series/Working Paper 18158, (09 June 2012), https://www2.bc.edu/jonathan-
reuter/research/NBER_WP18158.pdf.

103
on the retirement portfolios of a large sample of U.S. public college and university
employees finds empirical evidence that commissions, rather than the suitability of financial
products, drive sales. Chalmers and Reuter conclude in their analysis that “funds paying
higher broker fees receive economically and statistically significantly higher retirement
contributions from broker clients. Our evidence that broker incentives influence broker
recommendations highlights the agency conflict that can arise when financially
unsophisticated investors seek advice from intermediaries.”169
A study by Sendhil Mullainathan et al170
, using an audit methodology where trained auditors
met with U.S. retail commission-based financial advisors and presented different types of
portfolios, examined whether advisors reinforce investor biases that help further the
advisor’s own economic interests. The study found that financial advisors fail to de-bias
their clients and often reinforce biases that are in the advisor’s interests. Financial advisors
encourage returns-chasing behavior and push for actively managed funds that have higher
fees, even if the client starts with a well-diversified low-fee portfolio. The researchers state
that “[t]he evidence suggests that most of the interaction is driven by the need to generate
fees rather than to respond to the client’s rebalancing needs.”171
Embedded commissions incent unsuitable use of DSC arrangements:
In addition to embedded trailing commissions, there is evidence that embedded
commissions paid by investment fund managers to dealers/representatives on sales made
under the DSC option can similarly incent unsuitable recommendations. A recent MFDA
compliance review completed in December 2015172
uncovered instances of the inappropriate
use of the DSC option. The MFDA examined the use of that option, particularly with senior
clients, and dealers’ supervision, suitability assessment, and disclosure practices in this area.
The review covered 12 firms of various sizes with assets totalling $140 billion (30% of all
mutual fund dealers) and employing 24,650 approved persons (30% of all approved
persons).
The review uncovered several problematic practices, including:
clients over age 70 that were sold funds under DSC arrangements;
clients who were sold funds with DSC redemption schedules that are longer than
their investment time horizon; and
evidence of poor disclosure of the redemption fees at certain firms and poor
169
Ibid, page 4.
170 Sendhil Mullainathan, Markus Noeth and Antoinette Schoar , “The Market for Financial Advice: An Audit
Study”, NBER Working Paper 17929, (2012) http://www.nber.org/papers/w17929.
171 Ibid p. 16.
172 MFDA Bulletin #0670-C, 2015 DSC Sweep Report, December 18, 2015.

104
suitability assessment and supervision of sales under the DSC option.
In a recent MFDA Review of Compensation, Incentives and Conflicts of Interests, the
MFDA identified compensation and incentive practices that increased the risk of mis-selling
funds under the DSC option.173
Further analysis of MFDA enforcement files show that the DSC option can attract
dealers/representatives promoting unsuitable leverage strategies on their clients or churning
the client accounts.174
Recommendations that clients borrow to invest in funds on a DSC
basis enable the dealer and their representative to increase the total compensation they can
earn from the investment. Specifically, they may receive a referral fee from the financial
institution in connection with their client’s loan in addition to the 5% upfront commission
(plus the ongoing trailing commission) they may receive from the investment fund manager
on the purchase transaction.
The Inspections Branch of the AMF also issued a compliance notice in July 2015 that
reported that the AMF found some important risks of non-compliance with the KYC rules
among mutual fund dealers in Québec. In particular, certain dealers’ compliance systems
permitted the sale of funds with DSC redemption schedules to investors with short
investment horizons.
These findings suggest that the DSC option remains an attractive option for dealers and their
representatives because it offers a guaranteed initial commission of up to 5% of the
purchase amount (paid by the investment fund manager rather than the investor), plus the
ongoing trailing commission.
The DSC option may have a significant impact for the investor, being the redemption fee
payable on investments that are redeemed within a certain number of years of purchase
(typically up to 6 years from the date of purchase) where an investor wishes to redeem its
investment from the firm. This penalty, which aims to discourage redemptions in order to
preserve assets under management, has progressively reduced the popularity of the DSC
option with investors.
Recent market data suggests that the use of the DSC option in Canada remains in stark
contrast to its very limited use in other jurisdictions. As at the end of 2015, 19% of the
Canadian fund assets totalling $234 billion were held in DSC options.175
The latest data from
173
MFDA Bulletin #0705-C, Review of Compensation, Incentives and Conflicts of Interest, December 15, 2016.
174 See for example, the cases against Enzo DeVuono, George William Popovich, Michael Darrell Harvey, Tony Siu
Fai Tong, Jacqueline De Backer, Carmine Paul Mazzotta and David John Ireland.
175 Investor Economics, Insight Monthly Update, May 2016. The 19% figure includes DSC (14.4%) and low load
(5.1%).

105
the U.S. and Europe shows that less than 1% of assets in each jurisdiction are invested under
the DSC option (0.71% for the U.S. and 0.49% for Europe).176
We note that an important Canadian group of mutual funds has announced that it will
discontinue the DSC purchase option effective January 1, 2017.177
Conflicted advice may negatively affect investor outcomes:
A study by the Executive Office of the President of the United States178
examined the
evidence on the cost of conflicted investment advice and its effects on Americans’
retirement savings. It found that conflicted advice leads to lower investment returns.
Savers receiving conflicted advice earn returns roughly 1 percentage point lower each year
(for example, conflicted advice reduces what would be a 6 percent return to a 5 percent
return).
A similar study by John Chalmers et al179
examined whether conflicted advice yielded
better investment outcomes than no advice. Researchers examined account-level data for
participants in a defined contribution plan over time, allowing them to compare the
portfolios of advised and non-advised clients with similar attributes over time and to
compare advisor recommendations against a simple default option – a target date fund180
.
They found that:
investors that used the services of a broker earned annual after-fee returns that were
2.98% lower than they would have earned investing in a target date fund - offering
similar levels of risk;
brokers are significantly more likely to place their clients in funds that pay them
higher fees.
176
U.S. – Morningstar Direct Non-Institutional B Shares with minimum investment below $25,000 USD at February
2016; Europe – Morningstar Direct Non-Institutional series Open-End and SICAV with minimum investment below
25,000 (base currency) at February 2016.
177 Investors Group website: https://www.investorsgroup.com/en/media-releases/deferred-sales-charge-purchase-
optionto-be-discontinued.
178 Executive Office of the President of the United States, “The Effects of Conflicted Investment Advice on
Retirement Savings” (2015), https://www.whitehouse.gov/sites/default/files/docs/cea_coi_report_final.pdf.
179 John Chalmers and Jonathan Reuter, “Is Conflicted Advice Better than No Advice?”, NBER Working Paper
18158, (2012), http://www.nber.org/papers/w18158.
180 A “target date fund”, also known as a “lifecycle fund”, is designed to provide a simple pre-packaged investment
solution through a portfolio whose asset allocation mix becomes more conservative as the target date (usually
retirement) approaches. These funds relieve the dealer and their representative from performing any asset allocation
and rebalancing for the investor as this occurs automatically within the fund’s portfolio as time progresses and the
investor nears the target date.
106
In Canada, a study by Stephen Foerster et al181
analyzing the value of advice by tracking
account level data from three mutual fund dealers covering 581,044 investors and 5,920
representatives over a 14 year period reached similar results. Researchers found that:
representatives encourage increased risk taking among their clients, allocating as
much as 30% more to higher risk mutual funds (with higher fees/dealer
compensation) than non-advised clients. The higher expected return (i.e. the equity
risk premium) that should be generated as a result of greater risk taking is
completely nullified by the higher costs borne by clients in high fee mutual funds.
For the average investor, it is the representative and mutual funds who capture all of
the additional returns from the increased risk taking;
variation in client attributes tended not to result in a variation in client portfolios.
Client portfolios tend to resemble the representative’s own portfolio over time,
independent of their clients’ risk preferences and stage in the life cycle. Investor
characteristics including risk tolerance and point in the lifecycle explain only 13% of
the variation in risky share across clients; and
the costs of advice are economically significant given the lack of customization.
The average advisor generated a yearly negative alpha of -3.34%, reflecting the
average fees borne by the clients each year (nearly 2.7% on average) and the
underperformance of the advised portfolio on a before-fees basis, compared to using
low-cost passive index funds. Investors’ net underperformance therefore equals (or
exceeds) the fees that they pay.
Foerster et al. concludes that for the average investor, “investment advice alone does not
justify the fees paid to advisors”.182
Finally, a study by Daniel Bergstresser et al.183
sought to measure the benefits that advised
investors enjoy in exchange for the distribution costs they pay. Their research, which
studied “broker-sold” and “direct-sold” funds from 1996 to 2004 in the U.S. market, failed
to find that brokers deliver substantial tangible benefits. In comparison to investors in
direct-sold funds, they found that clients of brokers, on average, purchase funds that deliver
lower risk-adjusted returns (on a pre-distribution fee basis) and pay substantial distribution
charges, and that the broker channel displays no obvious asset allocation skills that help
their investors time the market.
181
Stephen Foerster, Juhani Linnainmaa, Brian Melzer and Alessandro Previtero, “Retail Financial Advice: Does
One Size Fit All?”, NBER Working Paper 20712, (2014), http://www.nber.org/papers/w20712.
182 Ibid, at page.27.
183 Daniel Bergstresser et. al., supra, note 166.
107
iii. Embedded commissions encourage high fund costs and inhibit competition by
creating a barrier to entry
Certain research finds that price formation in retail financial markets runs counter to classic
microeconomic theory telling us that more competition leads to lower prices. This research
suggests that the prevalence in Canada of mutual funds with higher fees is largely due to
financial product providers relying on intermediaries to distribute their product and paying
them incentives to promote their collective profit maximization aims. The pursuit of these
mutual goals serves to entrench higher fee arrangements and to curb the growth of less
costly alternatives.
Commissions tend to drive up retail prices for financial service products:
A paper by Mark Armstrong on the economics of consumer protection states that
commissions drive up retail prices for financial service products. The increase in price is
“due to competition between firms to offer high sales commissions to have their product
promoted, which artificially inflates the marginal cost of selling a product”.184
Intermediaries are incented to promote high fee arrangements:
Research by Kathryn Judge examining the influence of intermediaries in financial markets
finds that the continued prevalence of higher-cost institutional arrangements despite the
presence of more efficient alternatives is due to the influence of intermediaries that use
positional and informational advantages to promote self-serving high-fee arrangements in
order to maximize their revenue. She also finds that intermediary influence has a distorting
effect on the allocation of capital as it may cause certain firms to receive more capital than
may be warranted. Her research also shows that the intermediary’s influence helps to
explain an array of observable trends such as the growth and increasing complexity of the
financial sector.185
184
Mark Armstrong, “Economic Models of Consumer Protection Policies”, MPRA/Paper No.34773 (16 November
2011), p.14, https://mpra.ub.uni-muenchen.de/34773/1/MPRA_paper_34773.pdf. At pages 15 and 16, Armstrong
goes on to state:
“This section has described a model where firms attempt to influence a salesman’s marketing efforts by
means of per-sale commission payments. The salesman gives prominence to the product which pays the
highest commission, and in equilibrium this entails steering uninformed consumers toward the more
expensive products. Competition between sellers to set the highest commission means that the marginal
cost of supply is inflated and equilibrium retail prices are high. Therefore, the outcome for consumers,
both informed and uninformed, is poor: worse than the situation without commission payments where the
uninformed shop randomly, and far worse than the situation in which consumers pay directly for advice.
This model therefore gives some support to consumer policies which restrict the use of commission
payments as a marketing tactic.”
185 Kathryn Judge, "Intermediary Influence", University of Chicago Law Review, Vol. 82, Issue 2, Article 1, (2015),
pp. 573-642, http://chicagounbound.uchicago.edu/cgi/viewcontent.cgi?article=5853&context=uclrev. At page 629,
Judge states:
108
Pricing complexity and incentive contracts tend to maintain high prices in retail
financial markets, even as more firms enter:
Research by Bruce Ian Carlin examining pricing in retail financial markets finds that,
despite the large number of firms in the market, prices remain above marginal cost and may
even rise as more firms enter. He finds that these anomalies arise when product providers
(i) add complexity to their price structures which affects consumer literacy about prices,
thereby preserving market power and corporate profits, and (ii) align themselves with the
advice channel and sign incentive contracts that are mutually profitable. These incentive
contracts make it more profitable for the advice channel to hold back information from
consumers and preserve industry profits.186
The findings from the above research may offer an explanation for why the embedded
dealer compensation model remains predominant in Canada, despite the availability of
alternatives, and why high fund fees continue to persist in Canada.
Mutual fund fees in Canada are consistently among the highest in the world:
The persistence of high fund fees in Canada has been observed by a number of research
studies published over the last 13 years which, when comparing mutual fund ownership
costs globally, consistently conclude that Canadian mutual fund fees are among the highest
in the world.187
“Intermediary influence may also distort the allocation of capital in systematic ways. When intermediaries
earn greater fees from particular types of transactions, they tend to use their influence to favor that
transaction type. The greater the influence an intermediary enjoys, the greater the resultant distortion in the
mix of transactions actually consummated, that is, the greater the fee effects. Thus, when intermediary
influence results in institutional arrangements that make parties more reliant on a particular type of
intermediary, greater fee effects generally result. And, when certain firm types or sectors of the economy
receive capital through pathways that are particularly profitable for financial intermediaries, greater fee
effects result in greater capital being allocated to those firms and sectors than is socially optimal. At the
extreme, asset bubbles can result. A closely related effect is that when firms or sectors are funded in ways
that are less profitable for intermediaries, those firms or sectors may receive less capital than is socially
optimal.”
186 Bruce Ian Carlin, “Strategic Price Complexity in Retail Financial Markets” (December 4, 2006). Available on
SSRN: http://ssrn.com/abstract=949349.
187 Examples of such studies include: B.N. Alpert et al., “Morningstar Global Fund Investor Experience Study (June
2015); B.N. Alpert et al., “Morningstar Global Fund Investor Experience”, 2013 Report; B.N. Alpert et al.,
“Morningstar Global Fund Investor Experience 2011” (March 2011); J. Rekenthaler et. al., “Morningstar Global
Fund Investor Experience 2009 (May 2009); A. Khorana et al., “Mutual Fund Fees Around the World” (July 23,
2007); and K. Ruckman, “Expense Ratios of North American Mutual Funds”, Canadian Journal of Economics
(February 2003) p. 192-223.
109
In response to these studies, a study by Investor Economics and Strategic Insight for The
Investment Fund Institute of Canada188
proposed an analytical framework189
to enable
comparisons of the total cost of mutual fund ownership by mutual fund investors in the
United States and Canada as well as other countries. The framework identifies and
highlights the impact of structural differences between the U.S. and Canadian mutual fund
industries, including differences in taxation of management fees, economies of scale in
mutual fund distribution and investment management, and the manner in which advisory
fees are charged, as being among the factors that combine to explain the differences in the
level of the cost of ownership of funds in the two countries and make it difficult to make
detailed comparisons between the two jurisdictions. Beyond these differences, the study
suggests that the cost of ownership of funds in advised relationships in Canada – both
commissions and fee-based – is at a comparable level to the average cost of ownership
incurred by a typical fee-based investor in the U.S. On a tax-adjusted basis, through the
elimination of the impact of Canadian taxes on management fees, the asset-weighted cost of
ownership in Canadian advice channels is estimated to be 2.02% of invested assets
compared to the level of approximately 2% in the U.S.
According to recent Investor Economics data, the average asset-weighted fund industry
MER for long term funds has fallen from 2.01% in 2004 down to 1.95% in 2015.190
Management fee reductions by several investment fund managers are responsible for the
bulk of the six basis point MER decline during this period.
Low availability of low-cost passively-managed index funds in Canada:
Passively-managed index mutual funds in Canada typically:
bear a substantially lower management fee – usually no more than 0.50% compared
188
Investor Economics and Strategic Insight, “Monitoring Trends in Mutual Fund Cost of Ownership and Expense
Ratios, A Canada – U.S. Perspective”, November 2012, a study for The Investment Funds Institute of Canada. This
study was subsequently updated in: Investor Economics and Strategic Insight, “Monitoring Trends in Mutual Fund
Cost of Ownership and Expense Ratios: A Canada – U.S. Perspective, 2015 Update”, May 2015 Update to the 2012
study by Investor Economics and Strategic Insight For The Investment Funds Institute of Canada.
189 These findings are based on the assumption that investment choices (i.e. the usage of actively managed mutual
funds) remain the same whether the advisor uses a fee-based or commission-based arrangement and reflect the fact
that large low-cost fund providers in the U.S. were not included in the cost comparisons. The total cost of
ownership in the U.S. would otherwise be lower if this assumption was relaxed and if the sample were changed. In
addition, as highlighted by Investor Economics at page 17 of their separate report on the Canadian fund market
(Investor Economics, Mutual Fund MERs and Cost to Customer in Canada: Measurement, Trends and Changing
Perspectives, September 2012), the total cost of ownership in Canada would be lower if the switch to fee-based
compensation led to higher usage of ETFs and index funds.
190 Investor Economics, Investor Economics Insight, July 2016. Investor Economics looks at the average asset-
weighted fund industry MER for long term funds which excludes money market funds, funds with performance fees,
funds with management fees charged at the account level and labor-sponsored funds.

110
to the more typical 1.5 to 2% charged on actively managed equity funds; and
pay a substantially lower trailing commission to dealers – usually between 0.10%
and 0.25%, compared to the more typical 1% trailing commission paid on actively
managed equity funds.
The lower cost of passively managed index mutual funds suggests that these funds are
substantially less profitable for both investment fund managers and dealers, which in turn
reduces the incentive to manufacture and distribute these lower-cost products.191
At June 2015, low-cost passively-managed mutual funds (excluding ETFs) in Canada made
up only 1.5% of mutual fund total assets under management - a level that has remained
essentially unchanged over the last 10 years - while the remaining 98.5% of mutual fund
assets is actively managed. By comparison, passively-managed mutual funds comprise
15.3% of the U.S. market and 11.2% of the U.K. market.192
The low availability of low-cost passively managed mutual funds persists in Canada despite
the volume of research finding that most actively-managed funds generally tend to not
perform sufficiently well to justify their higher fees193
and tend to underperform their
passive counterparts on a net of fees basis.194
191
Morningstar Canada discusses the reasons why index funds have not grown in popularity in Canada. See C.
Davis, “Why hasn’t indexing taken root in Canada”, Morningstar Canada, November 23, 2016.
192 Source: Based on data from Investor Economics and internal OSC analysis.
193 Eugene F. Fama and Kenneth R. French, “Luck Versus Skill in the Cross Section of Mutual Fund Returns”,
Journal of Finance, Vol. 65, (2010), pp. 1915-1947 (at p. 1916 finding that the evidence regarding the value of
actively managed funds is “disheartening”. They find “that few active funds produce benchmark adjusted expected
returns that cover their costs,” indicating that “if many managers have sufficient skill to cover costs, they are hidden
by the mass of managers with insufficient skill.”); Mark Carhart, “On Persistence in Mutual Fund Performance”,
Journal of Finance, Vol. 52, (1997) pp. 57-82 (at p.80 finding that “[a]lthough the top decile mutual funds earn back
their investment costs, most funds underperform by about the magnitude of their investment expenses. The bottom-
decile funds, however, underperform by about twice their reported investment costs.”); Martin J. Gruber, “Another
puzzle: The growth of actively managed mutual funds”, Journal of Finance, Vol. 51, (1996), pp. 783-810 (at page
789 finding that actively managed “mutual funds underperform an appropriately weighted average of the indices by
about 65 basis points per year” because even though “active management adds value, . . . mutual funds charge the
investors more than the value added”). We note however certain research finding that some actively managed
mutual funds perform sufficiently well to justify the associated fees, but such funds are the minority and they do not
perform sufficiently well to justify the average actively managed fund. For example, Malcolm Baker et al., “Can
Mutual Fund Managers Pick Stocks? Evidence from Their Trades Prior to Earnings Announcements”, Journal of
Financial and Quantitative Analysis, Vol. 45, (2010) pp. 1111-1131, (at p. 1119 finding that “the average mutual
fund . . . does not appear to possess stock picking ability,” but that some funds do outperform the market); Robert
Kosowski et al., “Can Mutual Fund “Stars” Really Pick Stocks? New Evidence from the Bootstrap Analysis”,
Journal of Finance, Vol. 61, (2006), pp. 2551-2595 (at p. 2553 finding that “while most funds cannot compensate
for their expenses and trade costs, a subgroup of funds exhibit stock-picking skills that more than compensate for
such costs”).

111
A similar trend may generally be observed with ETFs. Most Canadian ETFs are passively
managed (86.2%) and typically do not pay embedded commissions.195
Most ETFs bear
lower management fees – 88.3% of Canadian ETFs pay management fees of less than
0.75%. However, ETF assets under management have increased significantly over the last
few years. As at June 2016, ETFs made up 7.3% of investment fund total assets under
management. By comparison, ETFs represented a total of 11.6% of the U.S. investment
company total assets.196
Countries with low levels of index funds may experience poor price competition:
A recent study by Martijn Cremers et al197
suggests that countries with low levels of
explicitly indexed funds (i.e. passive index tracking investment funds that are advertised as
such) experience poor price competition and thus higher fees. The study examined the
relation between indexing and active management in the mutual fund industry worldwide.
They found that actively managed funds are more active and charge lower fees when they
face competitive pressure from low-cost explicitly indexed funds. Moreover, the average
194
Morningstar Canada Research, “Have Active Canadian Equity Fund Managers Earned Their Keep?”, May 7,
2015 (finding that fund fees gobble up most of Canadian equity funds’ excess returns: Just 18% of funds in the
category outperformed the passive alternative on a net-of-fees basis over the 10-year period); Morningstar Manager
Research, “Morningstar’s Active/Passive Barometer: A new yardstick for an old debate”, June 2015 (finding that
U.S. actively managed funds have generally underperformed their passive counterparts, especially over longer time
horizons and experienced mortality rates (i.e. many merged or closed). In addition, the report finds that failure
tended to be positively correlated with fees (i.e. higher cost funds were more likely to underperform or be shuttered
or merged away and lower-cost funds were likelier to survive and enjoyed greater odds of success) and that fees
matter as they are one of the only reliable predictors of success.); Vanguard Research by Christopher B. Philips et
al., “The Case for Index-Fund investing for Canadian Investors”, April 2015 (finding that low-cost index funds have
displayed a greater probability of outperforming higher-cost actively managed funds, even though index funds
generally underperform their targeted benchmarks); Richard A. Ferri and Alex C. Benke, “A Case for Index Fund
Portfolios: Investors holding only index funds have a better chance for success”, June 2013 (finding that diversified
portfolios of index funds consistently outperform portfolios of actively managed funds – specifically, when
comparing a ten-fund index fund portfolio to a portfolio consisting of ten randomly selected actively managed funds
using identical asset class categories and weightings, the ten-fund index fund portfolio beat actively managed
portfolios 90% of the time over a 10 year period running from 2003 to 2012).
195 There are currently 93 ETFs that offer advisor class shares for which the investment fund manager will pay an
ongoing commission (usually called “service fee”) to the dealers. These ETFs represent less than 1% of Canadian
ETF assets under management.
196 Based on data from Investor Economics and the 2016 Investment Company Fact Book, 56
th edition, Investment
Company Institute, https://www.ici.org/pdf/2016_factbook.pdf.
197 Martijn Cremers, Miguel A. Ferreira, Pedro P. Matos and Laura T. Starks, “Indexing and Active Fund
Management: International Evidence”, Journal of Financial Economics, Forthcoming; Darden Business School
Working Paper No. 2558724, (February 1, 2015). Available on SSRN:
http://papers.ssrn.com/sol3/papers.cfm?abstract_id=2558724.

112
alpha generated by active management is higher in countries with more explicit indexing
and lower in countries with more closet indexing.198
Overall, the evidence from the study
suggests that explicit indexing improves competition in the mutual fund industry. Canada
was found to have low levels of explicit indexing with explicit indexing ETFs and mutual
funds collectively making up only 7% of the market.
‘Direct-to-client’ funds may have difficulty competing on an equal basis in Canada:
Lower-cost mutual funds that are sold under the ‘direct-to-client’ model199
(i.e. without the
intermediation of a third party dealer) and that do not pay any dealer compensation make up
only 2.8% of assets under management in Canada. Assets in the ‘direct-to-client’ channel
have remained flat, with no increase in market share over the last several years.200
The
investment fund managers of these funds must rely strictly on the performance and
attributes of their product to attract sales rather than the payment of compensation to
dealers.
New low-cost providers may have difficulty entering the Canadian market:
The slow growth of the ‘direct-to-client’ model in Canada may have discouraged new low-
cost providers from entering the market in Canada. Specifically, when Vanguard, one of the
largest U.S. ‘direct-to-client’ mutual fund and ETF manufacturers, entered the Canadian
fund market in 2011, it did so with its ETFs only, and not with its ‘no trailing commission’
mutual funds that are widely distributed in the U.S. Vanguard Investments Canada stated
that the barrier to entry in Canada was the requirement to pay for distribution.201
This
198
“closet indexing” refers to an investment fund that purports to be actively managed but actually follows more or
less a benchmark index.
199 There exist only a handful of Canadian fund companies that sell directly to the public. In those cases, the
investment fund manager or a related party is registered as a mutual fund dealer and sells its funds directly to the
public.
200 Source: Investor Economics (various surveys).
201 See transcript of OSC Roundtable Re Discussion Paper and Request for Comment 81-407 Mutual Fund Fees
(June 7, 2013) , supra, note 2, at p.98 - Question from Commissioner Deborah Leckman to Atul Tiwari, Managing
Director/Head of Canada for Vanguard Investments:
“COMMISSIONER LECKMAN: So I have a final question for Atul, and then maybe there will be some
more questions from either the panelists or from the audience. You came into Canada and chose only to
use ETFs. What was the business reason you chose not to offer your conventional mutual funds that don’t
pay trailers in Canada?
MR. TIWARI: Good question. Well, Vanguard actually looked at coming into Canada for well over 20
years; I’m told this was the seventh business plan that had been put together. We are a pretty prudent and
deliberate organization, to say the least. The original barriers all had to do with paying for distribution.
Again, Vanguard doesn’t pay for distribution. So when you look at the structure of the market in Canada, it
would be a tough slog to kind of come in and have a business proposition that’s based around trying to sell
mutual funds without a trailer.”
113
statement suggests that the payment of trailing commissions may essentially be the ‘price of
admission’ to the Canadian market and that low-cost investment fund providers that do not
pay any or low trailing commissions may not be able to access major fund distribution
channels. This barrier to entry inhibits effective price competition in our market.
Issue 2: Embedded commissions limit investor awareness, understanding and control
of dealer compensation costs
i. The lack of saliency of embedded commissions reduces investors’ awareness of
dealer compensation costs
Investors tend to understand ‘visible’ fees the most:
A report by the Brondesbury Group on performance reporting and cost disclosure202
found
that:
The fees that investors understand the most appear to be those that are most visible,
such as transaction-based commissions and account fees, which were understood by
two-thirds of investors who participated in the study;
only 4 out of 10 respondents indicated they understood DSCs;
only one-third of respondents indicated they understood trailing commissions; and
only half of respondents reported that they discussed costs with their advisor.
Investors are generally more apt to attempt to control salient fees:
A study by Brad Barber et al.203
found that investors are less apt to control the impact of
fees paid from fund assets. It found that mutual fund investors are more sensitive to salient,
upfront fees, like front-end loads and direct commissions, than a fund’s operating expenses.
This study analyzes U.S. mutual fund flows over a period of 30 years and, when assessing
how investors respond to expenses while investing in mutual funds, finds that investors treat
front-end loads and fund expenses differently. It finds a negative relation between flows
and front-end loads, but finds no relation between operating expenses and flows. This
research suggests that investors are more apt to attempt to control visible fees which they
202
The Brondesbury Group, “Report: Performance Reporting and Cost Disclosure”, prepared for: Canadian
Securities Administrators (September 17, 2010), at p.15-16, http://www.osc.gov.on.ca/documents/en/Securities-
Category3/rpt_20110622_31-103_perfomance-rpt-cost-disclosure.pdf.
203 Brad M. Barber et al., “Out of Sight, Out of Mind: The Effects of Expenses on Mutual Fund Flows”, The Journal
of Business, Vol. 78, no 6 (2005), pp. 2095-2120,
http://faculty.haas.berkeley.edu/odean/papers%20current%20versions/Out%20of%20Signt.pdf
114
must pay directly, but remain passive about ongoing fund fees paid out of fund assets.
Canadian investors are generally not aware of what they pay for financial advice or
that they pay for financial advice at all:
The fund industry’s latest Pollara opinion survey204
found that only:
27% of investors could say they “definitely” believe that part of the fees charged
within mutual funds are used to compensate their financial advisor, while 45%
replied “I think so”. Another 21% do not believe they pay for financial advice
through embedded fees, while the remaining 10% indicated they “don’t know”;
56% of investors recalled that their advisor discussed his/her compensation when
they last purchased a mutual fund;
62% of investors recalled that their advisor discussed mutual fund fees such as front-
end sales charges and DSCs; and
57% of investors recalled that their advisor discussed MERs;
A BCSC National Smarter Investor Study205
finds that 23% of Canadians do not know how
their advisor is paid. Over half (53%) do not know how much they paid to their advisor in
the last 12 months;
The OSC Mystery Shop report206
found that while 56% of the investors were told about fees
for products, just 25% were told about how the advisor would be compensated;
A study by PMG Intelligence207
found that:
investors are confused about fees (whether they are disclosed or not, whether they
pay them or not, whether they are discussed or not); and
most investors aren’t sure how much they pay for advice and what fees they pay for
but acknowledge some form of disclosure;
A recent survey by Tangerine Investments208
found that:
204
POLLARA Inc., “Canadian Investors’ Perceptions of Mutual Funds and the Mutual Fund Industry” (2016),
Report Prepared For: The Investment Funds Institute of Canada, https://www.ific.ca/wp-
content/uploads/2016/09/IFIC-Pollara-Investor-Survey-September-2016.pdf/15057/.
205 BC Securities Commission, supra note 152.
206 OSC Staff Notice 31-715 – Mystery Shopping for Investment Advice, September 17, 2015,
http://www.osc.gov.on.ca/documents/en/Securities-Category3/20150917-mystery-shopping-for-investment-
advice.pdf .
207 PMG Intelligence, “The Value and Price of Advice – A Benchmark Study 2014 Edition”.

115
although the majority of investors surveyed (89%) describe themselves as either
“very knowledgeable” or “somewhat knowledgeable” when it comes to their
investments, many were unaware of the associated fees – 36% of those surveyed
claimed they do not pay any fees, and another 11% were unsure if they pay fees at
all;
when the survey narrowed in on the 67% of investors who use a financial advisor,
24% of those surveyed said they do not pay fees or commissions for their advisor’s
services, and another 13% were unsure; and
of those who were aware of fees for their advisor’s services, when asked how well
they understood the fee structure, nearly 40% said “not very well” or “not at all”.
A report by the Brondesbury Group on advisor relationships and investor decision-
making209
found that investors have minimal knowledge of mutual fund fees and what
affects them, including how their advisors can get paid. Specifically, they found that:
unless investors are told what affects the amount of fees they pay, they are unlikely
to reach an accurate conclusion on their own. Even when the full range of fees and
what affects them are identified, it is difficult for investors to assess the implications
of what they have learned;
only one third of investors were able to recognize several common compensation
arrangements and one-third indicated they were aware of trailing commissions; and
out of the one-third who indicated they were aware of trailing commissions, about 4
out of 10 respondents agreed that the amounts of these commissions may vary
depending on the type of mutual fund and the mutual fund manufacturer that offers
the fund.
This same study assessed respondents’ knowledge about how advisors were paid by
presenting them with five statements to agree or disagree with. The percentage agreement
was so similar across all five statements that the authors concluded that “the results
demonstrate that investors have little or no idea about how advisors can get paid.”210
208
Tangerine Investments conducted an online survey from June 29 to July 4, 2016 among 1,003 randomly selected
Canadian adults. The results are discussed here: http://www.newswire.ca/news-releases/many-canadian-investors-
unaware-of-fees-theyre-paying-to-invest-586603691.html.
209 The Brondesbury Group, “Investor behavior and beliefs: Advisor relationships and investor decision-making
study”, a report prepared for the Investor Education Fund, 2012, http://getsmarteraboutmoney.ca/en/research/Our-
research/Documents/2012%20IEF%20Adviser%20relationships%20and%20investor%20decision-
making%20study%20FINAL.pdf.
210 Ibid. page 25.

116
Costs do not figure significantly into investor-decision making:
According to the same report by the Brondesbury Group on advisor relationships and
investor decision-making211
, costs do not figure significantly into investor decision-making
due largely to investors’ lack of awareness and/or understanding of fund fees, as highlighted
above. The cost of buying is a factor for only 2 out of 10 investors, but almost never a
decisive factor. Management fees are treated similarly. Costs may deter 1 out of 6 of
buying.
This study also found that most investors do not consider information in fund disclosure
documents to make their investment decision, preferring instead to rely on their advisor for
their investment decision. For 8 out of 10 investors, the advisor’s opinion dominates all
other sources as a factor in buying decisions. Investors trust their advisor to provide advice
that benefits the client first.
ii. Embedded commissions add complexity to fund fees which inhibit investor
understanding of such costs
Embedded dealer compensation results in numerous fund series that adds complexity
to fund fees:
The fund fee structure has grown increasingly complex over the last several years due to the
growing number of fund series on offer, with each series having different fees. The
numerous fund series available today on most funds has effectively resulted in an ‘alphabet
soup’ of fund series212
that can be confusing to investors and overwhelm their ability to
understand the fees that apply to their investment.
Mutual funds typically offer various series of their securities which may be designed for:
ii. specific types of dealer business models and the investors they serve (for example,
retail, higher-net-worth, institutional, fee-based, DIY/discount brokerage), or
iii. a specific purpose (for example, hedged series or ‘tax-advantaged’ series paying fixed
distributions that include a portion of return of capital).
Some Canadian investment fund managers may offer in excess of 30 different series of their
funds. Each series is denoted with a different letter, but there is no official standard
governing how investment fund managers use letter designations for their fund series. Each
211
Ibid.
212 The following news articles acknowledge the complexity of the Canadian mutual fund series “alphabet soup”.
See John Heinzl, “What do all those letters mean after mutual fund names?”, Globe and Mail, August 16, 2013,
http://www.theglobeandmail.com/globe-investor/funds-and-etfs/funds/what-the-f-the-abcs-of-mutual-
funds/article13816786/; Bryan Borzykowski, “Decoding the mutual fund alphabet soup”, Money Sense, August 16,
2012, http://www.moneysense.ca/save/investing/mutual-funds/decoding-the-mutual-fund-alphabet-soup/.

117
series may:
have different eligibility requirements (e.g. specified investment thresholds);
have different management fees (typically, the higher the investment threshold, the
lower the management fee);
be sold under various sales charge options (front-end load, low-load, DSC, fee-
based, no-load); and
pay different compensation (trailing commissions and other embedded sales
commissions) to the dealer.
As at the end of June 2016, taking into account underlying purchase options, there were
39,848 unique mutual fund series/purchase option combinations available in Canada213
in
which were invested a total of $1.3 trillion214
.
Further adding complexity is the fact that trailing commissions payable on various fund
series may vary based on:
the investment fund manager – they may differ between similar funds and fund
series managed by different investment fund managers, i.e. some investment fund
managers may pay more/less than others;
the asset class of the fund - they are typically highest on equity funds, lower on fixed
income funds and lowest on money market funds;
the main investment strategy – they are typically higher for actively managed funds
and lower for passively managed funds;
the purchase option selected - they are typically higher on fund investments made
under the front-end load and low-load options and lower on fund investments made
under the DSC option; and
the length of time the investment is held - for example, they may:
o in some cases increase in steps with each year the investor continues to hold the
investment, reaching a specified maximum after a certain number of years; or
o where the investment has been made under the DSC option, double at the
213
Source: FundSERV – mutual fund and wrap products. By contrast, there were 32,555 unique mutual fund
series/purchase option combinations available in the United States (source: Morningstar Direct) at the end of June
2016 in which were invested a total of $15.9 trillion USD (source: Investment Company Institute).
214 Source: Investor Economics.
118
expiration of the redemption schedule (6 years on average).
The wrong choice of fund series may subject an investor to excess fund fees:
The complexity of fund fees created by the plethora of series on offer requires dealers to
maintain robust systems of controls and supervision to ensure that investors are being
invested in the fund series that is right for them. The failure to have such systems can result
in investors holding the wrong fund series securities and paying excess fees as a result. In
recent no-contest settlements215
, OSC staff alleged that certain dealers had inadequacies in
their systems of controls and supervision which formed part of their compliance systems
which caused clients to not be invested or switched into a lower-fee series of a fund for
which they were eligible (further to having met the minimum investment threshold for
investment in the series). OSC staff further alleged that these inadequacies resulted in
clients paying excess fund management fees. These settlements were concluded after the
dealers self-reported to the OSC. As part of the settlement agreements, the dealers
undertook to pay compensation to affected clients and former clients.
Disclosure generally does not help investors identify the best fund series based on
compensation:
The Brondesbury Group Mutual Fund Fees Research216
finds that:
most investors are unable to understand and assess different forms of compensation.
They cannot make the economic assessment due to the complexity of calculations
and the difficulty of choosing the right underlying assumptions, nor can they assess
the implications of compensation arrangements for creating potential conflicts of
interest in the advice that advisors give them; and
in a commission-based environment, disclosure does not help investors identify
either the best advisor or the best fund series based on compensation. The end result
is that the advisor will propose the fund series and it will be advantageous to them.
The complexity of fund fees may discourage investors from asking about dealer
compensation – investors trust the compensation is fair and reasonable:
The BCSC National Smarter Investor Study217
finds that:
215
See the no-contest settlements in the matters of TD Waterhouse Private Investment Counsel Inc.
(http://www.osc.gov.on.ca/documents/en/Proceedings-SET/set_20141113_td-waterhouse-private-investment.pdf),
Quadrus Investment Services Ltd. (http://www.osc.gov.on.ca/documents/en/Proceedings-
SET/set_20151106_quadrus.pdf), Scotia Capital Inc. (http://www.osc.gov.on.ca/documents/en/Proceedings-
SET/set_20160725_scotia-capital.pdf), CIBC World Markets Inc.
(http://www.osc.gov.on.ca/documents/en/Proceedings-SET/set_20161024_cibc.pdf) and BMO Nesbitt Burns Inc.
(http://www.osc.gov.on.ca/documents/en/Proceedings-SET/set_20161209_bmo.pdf).
216 The Brondesbury Group, supra, note 3, at pages 46 to 48.
217 BC Securities Commission, supra, note 152.

119
the complexity of fund fees is intimidating to investors and discourages investors
from asking about their dealer/representative’s compensation. Specifically, the
study finds that 23% of Canadians have never asked their advisor what fees they
pay. Of these individuals, 37% agreed that they would ask about compensation
more often if they had a better understanding of how fees and commissions for
advisors worked;
for Canadians who invest with an advisor but say they do not always ask about
compensation, trust was the key reason they do not ask more often – 72% indicated
that they trust that their advisor’s compensation is fair and reasonable.
Complexity in fund pricing can increase investors’ reliance on dealer/representative’s
advice:
Research by Kathryn Judge suggests that complexity in financial products is deliberate to
ensure investors’ reliance on intermediaries for investment decisions and assure
intermediaries’ long-term returns. She states that: “[G]reater complexity can make an
investor more reliant on an intermediary’s guidance and other services. This increases the
probability that the investor will continue to use that intermediary’s services in the future,
increasing the intermediary’s long-term expected returns. Complexity can also make it
more difficult for any of the parties involved to see the full range of fees an intermediary is
earning on a transaction. To the extent that salience affects a party’s inclination to push for
a lower fee, intermediaries may prefer less transparent, and hence more complex,
transactions and market structures.” 218
Retail financial product providers may strategically use price complexity to limit
awareness of fees:
Research by Bruce Ian Carlin219
suggests that product providers in retail financial markets
strategically add price complexity to their product to maintain consumer ignorance about
prices, which in turn preserves the provider’s ability to gain market power and earn
corporate profits. This complexity ultimately leads to failure of competition, despite the
large number of firms in retail financial markets. He finds that: “increased competition
always leads to higher industry complexity. When more firms compete for market share,
the probability that they receive demand from the informed consumers decreases. To
maximize expected profits, the firms tend to increase complexity in order to optimize the
revenues they receive from uninformed consumers. Increased complexity and higher
cognitive load makes it harder for consumers to become informed. If a larger fraction of
consumers remain uninformed when more firms are present, then prices rise.”
218
Kathryn Judge, supra note 185 at page 627.
219 Bruce Ian Carlin, supra note 186 at page 4.
120
iii. The product embedded nature of dealer compensation restricts investors’ ability to
directly control that cost and its effect on investment outcomes
Dealer compensation charged at the fund level may cause cross-subsidization:
Embedding dealer compensation costs into fund management fees charged to a mutual fund
rather than charging and collecting such compensation at the account level can cause some
investors to subsidize the cost of certain commissions or other services that are not
attributable to their specific investment in the fund. This cross-subsidization of dealer
compensation costs can result in some investors indirectly paying excessive fees beyond
their control.
One example of such cross-subsidization is the subsidization by front-end load investors of
the specific distribution costs attributable to DSC investors. Specifically, investment fund
managers may use part of the management fees they earn on a fund to fund the payment of
upfront sales commissions to dealers on sales made under the DSC option.220
The cost of
these embedded sales commissions is allocated to the fund as a whole, and therefore to all
investors in the fund, irrespective of the purchase option under which they made their fund
investment. As a result, even though these costs are unique to the DSC option, investors
who purchase under the front-end load option (under which the investor may have already
paid a sales charge directly to their dealer or representative at the time of purchase) bear the
same ‘higher’ management fee as, and therefore subsidize, those investors who purchase
under the DSC option.
Less than a handful of Canadian investment fund managers have addressed this type of
cross-subsidization by offering a different series or class of their funds for each of the
various purchase options, with each bearing a different management fee reflecting the
different costs associated with the different purchase options. In these cases, the
management fee of the front-end load series is typically 15 basis points lower than the
management fee of the DSC series.
We note that in the U.S., mutual funds offer separate classes of securities for each purchase
option. The A share class is the front-end load purchase option and the B share class is the
DSC purchase option. The B share class expenses are typically 0.60 to 0.75 percent higher
each year than on class A shares.221
Discount/DIY series not widely available:
Some investment fund managers offer a discount series (e.g. series D) of their funds for
DIY investors whose lower management fees reflect a reduced embedded trailing
commission of typically no more than 0.25%. However, those investment fund managers
220
See note 6 for a description of the DSC option.
221The difference in expenses is observable by reviewing fee disclosure in U.S. mutual fund prospectuses. See also
FINRA Investor Alert: “Class B Mutual Fund Shares: Do They Make the Grade?”,
http://www.finra.org/investors/alerts/class-b-mutual-fund-shares-do-they-make-grade.

121
that do offer a discount series typically offer it on only a portion of their fund lineup rather
than all their funds222
and their accessibility is limited. Discount series are typically
available only online through certain discount dealers. Industry data shows that:
only 1% of Canadian mutual fund assets is held in a discount/DIY series;223
and
the bulk (roughly 84%)224
of mutual fund assets held in the online/discount
brokerage channel remain invested in the regular retail fund series paying full
unreduced trailing commissions to the discount broker.
Fee-based option not a true choice for everyone:
Many investment fund managers offer a fee-based series (e.g. series F) for investors in fee-
based arrangements with their dealer/representative whose reduced management fees reflect
the absence of embedded trailing commissions. Instead, the investor pays the dealer
directly for advisory services rendered in connection with their account.
While most investment fund managers offer a fee-based series of their funds which have
relatively low investment minimums, not every investor can access this series because:
dealers often impose significant account size requirements ($250,000+) that must be
met in order for investors to be eligible to participate in a fee-based program; and
not all dealers/representatives work under a fee-based model. Many
dealers/representatives (particularly in the MFDA channel) operate on a
commission-only basis which means that they do not offer the fee-based series to
their clients. Only the fund series with embedded compensation is placed on their
product shelf.
Fee-based fund series made up only $40 billion or 4% of fund industry assets at the end of
2013. While fee-based assets increased significantly over the five years ending 2015,
222
At February 2016, there were 17 investment fund managers offering at least one discount/DIY fund series on a
total of 439 funds. Source: Morningstar Direct, SEDAR at February 2016.
223 As at September 2015, assets in discount/DIY mutual fund series totaled $12.053 billion, up from $11 billion in
December 2011, although not all of this was held in the online/discount brokerage channel. The $12 billion figure
includes an estimated $4.6 billion in series D mutual fund assets held in the online/discount brokerage channel, as
well as other similar discount/DIY series sold directly by the investment fund manager. Source: Investor
Economics.
224As at September 2015, a total of $29.585 billion in mutual fund assets was held in the online/discount brokerage
channel. Investor Economics estimated that only $4.6 billion in discount/DIY fund series assets was actually held in
the online/discount brokerage channel. This suggests that $25 billion of the total $29.585 billion of mutual fund
assets in the online/discount brokerage channel remains invested in the regular retail fund series paying full trailing
commissions. Source: Investor Economics.

122
increasing by 248% over that period, fee-based options still only made up $69 billion or 6%
of fund industry assets at the end of 2015.225
Direct-to-client funds not widely available:
As explained above, only a few investment fund managers in Canada offer lower-cost
mutual funds under the ‘direct-to-client’ model. These mutual funds charge lower
management fees reflecting the absence of embedded trailing commissions. These mutual
funds typically have minimum investment thresholds of $10,000 of more, which means that
they may not be within reach of many retail investors. Mutual funds sold under the ‘direct-
to-client’ model make up only 2.8% of assets under management in Canada.226
The lack of availability and/or accessibility of the above options for many Canadian
investors allows embedded commissions to prevail and ultimately limits investors’ ability to
control the impact of these fees on their investment outcomes.
Issue 3: Embedded commissions paid do not align with the services provided to
investors
i. Investors do not receive ongoing advice commensurate with the ongoing trailing
commissions paid
No rules requiring specified ongoing services:
The fund facts document for mutual funds typically states that trailing commissions are for
the services and advice the dealer and its representative provide to the investor.
However, there is currently no securities regulation that prescribes, or guidance that
articulates, the specific services that an advisor is expected to provide in exchange for
ongoing trailing commissions. Under NI 31-103 – Registration Requirements, Exemptions
and Ongoing Registrant Obligations (NI 31-103), dealers/representatives are required to
provide certain services at the time of the trade (e.g. suitability, know-your-client), but no
requirement to provide ongoing advice focused on the client’s portfolio.
Trailing commission payments are largely used to support dealer operations and sales
activity:
The various comment letters submitted by fund industry participants in response to the
Original Consultation Paper indicate that trailing commissions are largely used to support
dealer operations and to compensate the advisor for work done at the time of the original
225
Source: Investor Economics.
226 See notes 199 and 200 above and related discussion under Issue #1.

123
investment, rather than for ongoing advice provided over the term of the investment.
IFIC’s response letter dated April 12, 2013, states that the bulk of trailing commission
payments are used to support dealer operations. At page 3 of their letter, IFIC states:
“The first misconception is found in the Discussion Paper’s underlying theme that
trailing commissions are used exclusively for the compensation of advisors. The
reality is that trailing commissions are paid to the dealer firm to cover a whole host
of regulatory and supervisory functions and services in addition to advisor
compensation. The dealer may retain one half or more of the trailing commission to
pay for, for example: tier 1 and tier 2 supervision and the systems that support it,
regulatory costs including fees to fund the SROs, OBSI, and securities commissions,
client complaint handling processes, advisor investigation and enforcement
requirements, general compliance obligations of the SROs, OBSI, and securities
commissions, client reporting, due diligence on products, etc.”
The letter dated April 12, 2013 from the Investment Industry Association of Canada (IIAC)
similarly indicates that trailing commissions are used to cover the cost of a host of services
other than the provision of investment advice, many of which may be provided equally by
execution only and full-service dealers. At page 5 of their letter, IIAC states:
“The following is a list of some services supported by trailing commissions that are
provided by investment dealers on an ongoing basis (many apply equally to
execution only and full-service dealers):
Printing and mailing of disclosure documents (prospectuses, Fund Facts, other
shareholder communications, including proxy material);
Processing of corporate events and distributions (Since mutual funds held by
investment dealers are typically registered in nominee name, the dealer takes
on responsibility for updating client account records for things such as mutual
fund reorganizations and client payments of interest, dividends, etc.);
Preparation and distribution of tax reporting information such as annual
trading summaries, and, in some cases, T3 and T5013 tax slips;
Provide the widest selection of mutual funds from multiple fund families (This
requires efforts by the dealer/advisor to conduct extensive product due
diligence and legal documentation before making these funds available to
clients.);
Custody services;
Portfolio monitoring of margin requirements;
Clearing and settlement of purchase and sales through FundSERV and/or
CDS.
The services above should be taken into consideration with respect to the importance
of trailers to advisors and their firms.”
The letter dated April 12, 2013 from Investors Group states that trailing commissions pay
for distribution and a variety of dealer costs, and not just the provision of ongoing services
124
by dealers and their representatives. At page 4 of their letter, Investors Group states:
“This proposal [to tie trailing commissions to the provision of specific services by
advisors] arises from a misunderstanding that 100% of trailing commissions are
paid for ongoing services provided by advisors. In fact, the compensation is paid to
the dealer in connection with the distribution of the financial products and is
generally the only source of revenue for mutual fund dealers. This revenue pays for
a variety of dealer costs, including supervision, back office functions, client
statement production, insurance and similar expenses – many of which, we note,
have increased as a result of recent regulatory requirements – in addition to the cost
of compensating advisors. The dealer, not the manufacturer, determines the level of
service its advisors are to provide.
Of the industry average of two-thirds of the trailing commission actually paid to
advisors by the dealer, there are two facets involved. First, they represent deferred
compensation to advisors for the initial work done by them in providing advice to
clients at the time of the original investment. Second, these payments are to
compensate for the ongoing service provided by the advisor to the client. Because of
this, the services provided by advisors to investors will vary depending on a number
of factors, including the size of the portfolio and specific needs of the particular
client including desired frequency of contact and updates.”
An IFIC paper227
notes that, on average, 0.78% of the assets invested in a long-term fund
are paid annually by the fund to the dealer, of which approximately two-thirds may go to the
representative for advisory services and the rest kept by the dealer to pay for administrative,
compliance and regulatory oversight functions.
Varying trailing commissions between different investment fund managers, fund types
and purchase options:
As explained above, trailing commissions may vary between different investment fund
managers and will generally further vary based on the asset class of the fund and the
purchase option selected.228
There is no evidence of different services despite the
differences in fees. For example, trailing commissions are typically higher on equity funds
and lower on fixed income funds. In such case, there is no evidence that an investor
purchasing an equity fund would be provided with more services and advice than if the
investor were to invest in a fixed income fund.
Higher trailing commissions for pre-packaged advice:
Most investment fund managers offer ‘funds-of-funds’, which are mutual funds that invest
227
The Investment Fund Institute of Canada, “Paying for Advice: Why Options are Important” (August 2014), at
p.7.
228 Trailing commissions are higher on equity funds and balanced funds (typically 1%) than on fixed income funds
(typically 0.50%) and on money market funds (typically 0.25%). Trailing commissions are also higher on
investments made under the front-end load option (typically 1%) than under the DSC option (typically 0.50%).

125
in other funds - most typically a portfolio of proprietary funds. They are pre-packaged
mutual fund investment portfolios which relieve the dealer and their representative from
having to do the fund selection and asset allocation they may otherwise be expected to do on
their own for a client. Notwithstanding the efficiencies that funds-of-funds may provide for
advisors, investors do not ultimately benefit from these efficiencies as the trailing
commissions payable on funds-of-funds are the same or higher than on stand-alone equity
mutual funds.229
Accordingly, advisors who sell funds-of-funds receive greater
compensation for seemingly less service and advice. The favourable dealer compensation
paid on funds-of-funds may explain why this product makes up the bulk of net sales.
According to data from IFIC, for the six years ending December 2015, funds-of-funds net
sales totaled $191 billion versus $32 billion for traditional stand-alone funds. They have
become the dominant product in the Canadian fund industry.
DIY investors in the discount channel may pay full trailing commissions:
As discussed above in connection with Issue 2, not all investment fund managers offer a
discount/DIY series (e.g. Series D with reduced trailing commission of 0.25% or less) on
their funds, nor do all discount brokers opt to put these series on their shelf when available.
These series are available for purchase through certain discount brokerages only. Those
investment fund managers that do not offer a discount/DIY series typically make their
regular retail series available for purchase through the discount channel. These series pay
full unreduced trailing commissions of 1% to the discount brokerage for execution-only
services.
ii. The cost of advice provided through embedded commissions may exceed its benefit
to investors
Investors may not derive offsetting financial benefits from the payment of trailing
commissions:
Several studies show that investors derive almost no offsetting financial benefit from the
payment of distribution fees, including trailing commissions. We refer to the studies by the
Executive Office of the President of the United States230
, John Chalmers et. al.231
, Stephen
Foerster et. al.232
and Daniel Bergstresser et al.233
discussed above in connection with Issue
1 – ii. Embedded commissions can encourage biased investment recommendations by
dealers which negatively affect investor outcomes. These studies overall show that:
229
See data on funds-of-funds provided in the Original Consultation Paper, Figure 10. Funds-of-funds are very
popular products that account for almost half of all long-term mutual fund assets under management.
230 See research by the Executive Office of the President of the United States, supra note 178.
231 John Chalmers et al., supra note 179.
232 Stephen Foerster et al., supra note 181.
233 Daniel Bergstresser et al., supra note 183.
126
investors receiving conflicted advice through the payment of embedded
commissions tend to perform worse than non-advised investors or passive
benchmarks; and
dealers/representatives collect more fees and commissions than any monetary value
their investment advice may add to the account.
The following research however offers contrasting views on the value of advice:
An econometric study by the Centre interuniversitaire de recherche en analyse des
organisations (CIRANO)234
finds that, on average, advised investors accumulate
significantly more financial assets than do non-advised investors with similar socio-
economic characteristics. This benefit of financial advice grows with the length of
time households have received advice: after four to six years, the advised households
have accumulated 1.58 times the amount accumulated by non-advised households;
after 15 years, the difference has increased to 2.73 times. This difference in
financial assets is explained most significantly by higher household savings rates
and greater allocation into non-cash investments, not by better returns due to advisor
skill;
A paper by the School of Public Policy at the University of Calgary235
asserts that
embedded commissions facilitate affordable and broadly accessible financial advice
which leads to greater individual wealth accumulation, which in turn makes a
positive contribution to the retirement readiness of Canadian households and,
ultimately, the economy. Based on a review of academic, government, regulatory
and industry research, including the CIRANO study above, the author of the paper
argues that eliminating embedded commissions would hurt less affluent investors
who may not be willing or able to pay for advice upfront, thus creating an advice
gap which would be a major setback for Canada-wide retirement savings and
Canadians’ quality of life in retirement;
234
Claude Montmarquette et al., “Econometric Models on the Value of Advice of a Financial Advisor”, CIRANO
Institute, July 2012, http://www.cirano.qc.ca/pdf/publication/2012RP-17.pdf. Claude Montmarquette, one of the
authors of that study, later admitted that a survivorship bias exists in the study and that he would like to see a more
formal longitudinal study intimately tracking the performance of advised versus non-advised groups over a long
period of time. See “Financial Industry overselling value of financial advice”, Globe and Mail, November 15, 2012,
http://www.theglobeandmail.com/globe-investor/personal-finance/household-finances/financial-industry-
overselling-value-of-financial-advice/article5360796/. The study does not establish a causal relationship between the
payment of trailing commissions and wealth accumulation as it does not identify whether its participants received
advice through trailing commissions or other compensation arrangements. The study also does not factor into its
findings any liabilities that its participants may have incurred through financial advice, which may offset the total
wealth accumulation.
235 Pierre Lortie, “A Major Setback for Retirement Savings: Changing How Financial Advisers Are Compensated
Could Hurt Less-Than-Wealthy Investors Most”, University of Calgary School of Public Policy Research Papers,
Vol. 9, Issue 13, (April 2016), https://www.policyschool.ca/wp-content/uploads/2016/05/financial-advice-lortie.pdf.

127
The fund industry’s latest Pollara opinion survey236
finds that investors perceive the
advice they receive from their advisor to be beneficial. Specifically, 95% of
respondents indicated they can rely on their advisor to provide sound advice and
88% agreed they get better returns as a result of the advice they receive. Eighty-two
percent attributed better savings and investment habits to their advisor, while 91%
said they get value for the money they pay to their advisor;
Research by Vanguard Investments Canada Inc.237
finds that working with an
advisor can theoretically add about 3% in net returns when following the Vanguard
Advisor’s Alpha framework for wealth management which involves the application
of the following five wealth management principles:
o Being an effective behavioral coach by helping clients maintain a long-term
perspective and a disciplined approach (potential value add: 1.50%);
o Applying an asset location strategy, i.e. allocating assets between taxable and
tax-advantaged accounts (potential value add: from 0% to 0.42%);
o Employing cost-effective investments, i.e. passively managed funds
(potential value add: 1.31%);
o Maintaining the proper allocation through rebalancing (potential value add:
0.47%); and
o Implementing a spending strategy to help clients make important decisions
about how to spend from their portfolios (potential value add: 0% to 0.41%).
Vanguard’s research emphasizes that the potential 3% in net returns for clients
should not be viewed as an annual value-add, but is likely to be intermittent, as some
of the most significant opportunities to add value occur during periods of market
duress or euphoria when clients are tempted to abandon their well-thought-out
investment plans. The research also stresses that the applicability of the
management principles, and the resulting value added, will vary by client
circumstances (based on each client’s time horizon, risk tolerance, financial goals,
portfolio composition, and marginal tax bracket, to name a few) as well as
implementation on the part of the advisor.
The beliefs of representatives may affect their advice:
A study by Juhani Linnainmaa et al.238
, using the same data as that used in the Foerster et al
study239
, suggests that the quality of representatives’ advice may be affected not only by
236
Pollara, supra note 204.
237 Vanguard research, “Putting a value on your value: Quantifying Vanguard Advisor’s Alpha”, (September 2016),
https://www.vanguard.com/pdf/ISGQVAA.pdf.
238 Juhani T. Linnainmaa, Brain T. Melzer and Alessandro Previtero, “Costly Financial Advice: Conflicts of Interest
or Misguided Beliefs?”, December 2015, http://faculty.chicagobooth.edu/juhani.linnainmaa/MisguidedBeliefs.pdf.
239 Stephen Foerster et al., supra note 181.

128
conflicts of interest which can incent self-interested behavior, but also by personal beliefs
and preferences regarding investment strategies (for e.g. the belief that active management –
even after commissions – dominates passive management). They find that representatives
manage their personal portfolios just like they manage their clients’ portfolios. They trade
frequently, chase returns, and prefer expensive, actively managed funds over low-cost index
funds for both their clients and for themselves. Differences in representatives’ beliefs affect
not only their own investment choices, but also cause substantial variation in the quality and
cost of advice they give to clients, raising costs for some investors.
The benefits of representatives’ advice may largely be intangible:
Certain research suggests that, to the extent investors derive benefits from dealings with
representatives, such benefits may be largely behavioral and thus intangible in nature, such
as the development of good savings discipline, overcoming inertia, the reduction of investor
anxiety, and the creation of trust. Such research includes:
the CIRANO Research which finds that advised households in Canada accumulate
greater financial assets over time, but that this finding is mainly due to their
improved savings discipline due to the advisor.240
Another CIRANO study finds that
the discipline imposed by a financial advisor on the financial behavior of households
and the increased savings of advised households are key to improving asset values of
households relative to comparable households with no advisor.241
the paper by the School of Public Policy at the University of Calgary which reviews
a body of research showing that pervasive behavioral biases in decision-making
limit an individual’s ability to make sound financial decisions on their own. Such
biases include the tendency to prefer short-term gratification (consumption) over
longer-term returns (saving), inertia and status quo bias and a propensity to push to a
later date actions that require self-control. The author asserts that financial advisors
can help individuals overcome these behavioral weaknesses which can lead them to
make sub-optimal investment decisions when left to their own devices.242
research by Foerster et al., which posits on the possible reasons why fund investors
prefer to use the services of dealers/representative despite the research’s finding that
the investment advice provided through commissions does not justify the fees paid.
He states: “Given householders’ strong preference for using financial advisors, it is
likely that they receive other benefits beyond investment advice. Our results,
however, impose constraints on the set of plausible benefits. The benefits cannot be
of one-time nature because investors pay the fee continually as they remain advised.
Such benefits may come in the form of financial planning, including advice on
240
Claude Montmarquette et al., supra note 234.
241 Claude Montmarquette et al., The Gamma Factor and the Value of Financial Advice, CIRANO Institute, August
2016, http://www.cirano.qc.ca/files/publications/2016s-35.pdf.
242 Pierre Lortie, supra note 235, at pages 6 and 7.

129
saving for college and retirement, tax planning and estate planning. It is also
possible that financial advisors add value by mitigating psychological costs rather
than providing financial benefit; that is, reducing anxiety (Gennaioli, Shleifer, and
Vishny 2014) or eliciting feelings of trust (Guiso, Sapienza, and Zingales 2008)
rather than improving investment performance.”;243
research by Bergstresser et al. which, further to their failure to find that brokers
deliver substantial tangible benefits to investors in broker-sold funds, speculates that
brokers may deliver substantial intangible benefits that we do not observe. The
researchers state that “[b]rokers may help their clients save more than they would
otherwise save, they may help clients more efficiently use their scarce time, they
may help customize portfolios to investors’ risk tolerances, and they may increase
overall investor comfort with their investment decisions;” 244
and
research by Gino et al. which finds a robust relationship between anxiety and advice
seeking and between anxiety and advice taking. Specifically, this research finds that
anxious individuals are found to be more likely to seek and rely on advice than are
those in a neutral emotional state. The relationships between anxiety and advice
seeking and anxiety and advice taking are mediated by self-confidence. Although
anxiety also impairs information processing, impaired information processing does
not mediate the relationship between anxiety and advice taking. Anxiety motivates
individuals to seek advice from others and to be less discriminating between good
and bad advice and between advice from advisors with and without a conflict of
interest.245
243
Stephen Foerster et al., supra note 181 at pages 27-28.
244 Bergstresser et. al., supra note 233, at p. 4131.
245 F. Gino, A.W. Brooks and E. Schweitzer, “Anxiety, Advice, and the Ability to Discern: Feeling Anxious
Motivates Individuals to Seek and Use Advice”, Journal of Personality and Social Psychology, Vol. 102, No. 3,
(2012), pp. 497-512,
http://www.hbs.edu/faculty/Publication%20Files/gino_brooks_schweitzer_jpsp_2012_fd79893e-9f44-4a69-9460-
848527d2d598.pdf.

130
131
APPENDIX B
OTHER OPTIONS CONSIDERED
In determining how best to address the investor protection and market efficiency issues
identified, the CSA considered the merits of a number of other policy options in addition to
discontinuing embedded commissions and those discussed in Part 6 of this Consultation Paper.
Some of these options were proposed in the Original Consultation Paper, while some options
were identified following the consultation. Each option was thoroughly and thoughtfully
evaluated.
Generally, where we determined that an option would potentially address one issue to some
degree, but at the same time fail to address or even exacerbate another issue, we opted not to
pursue the option. Other options were not retained because they were found to be inconsistent or
redundant with options proposed in CSA CP 33-404.246
Like the options discussed in Part 6 of this Consultation Paper, for each of the options discussed
below, we analyzed the anticipated positive and negative impacts/effects on each of the
following stakeholders:
advised investors (specifically those with investable assets below $100K, between $100K
and $500K, and above $500K);
DIY investors;
independent investment fund managers;
independent fund dealers; and
integrated financial service providers.
The following discussion provides a brief overview of the primary alternative options considered
by the CSA and why we have decided not to pursue such options further.
1. Enhancements to Disclosure
The CSA considered making a number of disclosure-based enhancements to the current account
statements247
and fund fact documents required by the CRM2 and POS reforms respectively.
The primary focus of these enhancements would be to increase investor awareness of the costs
associated with their investments and the impact that such costs play on investor returns. The
particular enhancements considered are discussed below.
i. CRM2 account statement enhancements
The CSA considered enhancing the disclosure on dealers’ websites and/or in the account
statement currently provided by dealers to provide the median percentage return and total cost in
246
For example, the option of defining and disclosing advisor service levels in exchange for trailing commissions as
set out in the Original Consultation Paper wasn’t retained due to the proposals noted in CSA CP 33-404.
247 Report on charges and other compensation and content of investment performance report.

132
dollars for a range of account sizes and risk types. The following diagram illustrates an example
of the disclosure contemplated:
The foregoing information would be based on data aggregated at the firm level in respect of all
accounts for which dealers are required to produce a report on charges and other compensation
and investment performance.
If implemented, the CSA would anticipate this benchmarking exercise to have the following
benefits:
it may better allow investors to assess their performance and costs relative to others,
which in turn may allow investors to better assess the quality of the services they receive
from their advisor; and
it may over time create competition among advisors and incent advisors to enhance their
level of service, which could also lead to potential cost reductions in the services
provided.
The drawbacks of this option would be that:
it would be difficult to control for variability in services provided, as well as investor
objectives and time horizon, making comparisons misleading and/or ineffective;
investors may require a certain level of investment knowledge to fully understand and
interpret the additional information to benefit from the added disclosure (especially when
considered in the context of all of the other information provided in the account
statement); and
some dealers who distribute proprietary products and are part of larger, integrated
financial service providers, do not receive commission revenue such as trailing
commissions and instead receive internal transfer payments from affiliates based on
agreements with their corporate group. In these instances the true costs of the services
provided may be difficult to compare across different dealers.
ii. POS fund facts enhancements
One potential way we considered to enhance the disclosure in the fund facts document was to
provide more prominent fee disclosure, and greater context about the fees charged and their
impact on performance. For example, as shown in the following diagram, the CSA considered
Low Medium High Low Medium High
0 - $100,000 2.5% 5.0% 3.0% 0 - $100,000 750.25 801.38 1,002.30
$100,000 - $500,000 2.5% 7.0% 3.0% $100,000 - $500,000 7,538.20 8,951.02 15,892.30
$500,000 and over 4.0% 10.0% 5.0% $500,000 and over 38,582.89 52,891.40 74,120.00
Client Risk Tolerance
Acc
ou
nt
Size
Client Risk Tolerance
Acc
ou
nt
Size
Median Client Account Returns in 2015 Median Client Account Costs 2015

133
requiring an illustration of where a fund’s MER falls on a spectrum from “low” to “high” based
on industry averages:
In conjunction with the foregoing, the CSA also considered requiring disclosure of the actual
dollar amount of fees paid and returns foregone (each demonstrated over certain investment
periods assuming specified returns). This disclosure could also have been supplemented with
educational statements to alert a potential investor of the impact that fees play on their
investments, such as “fees reduce the returns on your investment”.
As an alternative to the foregoing, the CSA also considered amending the fund facts to provide
enhanced disclosure regarding fund MERs and what they pay for. For example, the CSA
considered breaking down the individual components of the MER to give an investor a more
complete picture of the fund’s expenses. Such information expressed in dollars would include,
for example, the portion of management fees paid by the fund that directly compensates the
investment fund manager for its services, the portion paid for operating expenses of the fund, and
the portion that is used for distribution (such as all compensation paid to a dealer, including
trailing commissions and sales commission, and marketing and promotional material). In
addition, the CSA considered changing the term “trailing commissions”, which is used in the
fund facts and other reports provided to investors, to a more descriptive term such as “fees for
advice and dealer services”.
If implemented, the CSA expect that the disclosure enhancements could have the following
benefits:
investors may have greater fee awareness at the time of sale, which may also cause
investors to consider the impact of the fees on their investment and/or the value of their
advisor’s advice before making an investment decision;
investors may be prompted to ask more questions about the costs of the investment fund
products being recommended and potentially ask for lower-cost alternatives; and
to the extent that such disclosure leads advisors to recommend less expensive
alternatives, competition among investment fund managers may be increased over time as
managers may be pressured to lower costs to compete for market share.
Some drawbacks with this approach, however, would be that:
investors may require a certain level of investment knowledge to fully understand and
interpret the additional information to benefit from the added disclosure (especially when
considered in the context of all of the other information provided in the fund facts
document);
The annual management expense ratio (MER) for this fund in 2015 was 2.38%
Low 2.38 High
Cost of $10,000 investment over 5 years if it returns 5% per year $1,513.53
Fees reduce the returns on your investment

134
the costs associated with the amendments may be burdensome and would be borne by
investment fund managers (and ultimately, by fund securityholders);
it may be difficult to compare information between different fund types (for example,
between fixed income and equity funds); and
it may suggest that fund types that typically have lower fees are better than fund types
that typically have higher fees.
Why the CSA is not pursuing enhancements to disclosure
Provided that the disclosure is simple and easy to understand, the CSA anticipate that the
enhancements discussed above may lead to greater fee awareness among investors, as investors
would be provided with more prominent fee disclosure that would include additional information
to help an investor assess the costs and performance of their investment (both at the time of sale
and ongoing).
Notwithstanding the enhanced disclosure, the CSA chose not to proceed with this option as it
does not anticipate that it will have any measurable effect in addressing any of the other investor
protection and market efficiency issues identified by the CSA, particularly the conflicts of
interest stemming from embedded commissions. In our view, and as discussed in more detail in
Part 6, we think that disclosure alone may not be an effective remedy for conflicts of interest in
an advisor-client relationship.
Moreover, the CSA do not believe it is prudent to pursue additional enhancements to disclosure
until such time as the effectiveness of the current POS and CRM2 requirements has been tested
through a post-implementation review.248
2. Investment Fund Manager Focused Initiatives
The CSA also considered implementing a number of targeted reforms at the investment fund
manager level to help address the investor protection and market efficiency issues identified.
The particular initiatives considered are discussed below.
i. Require a separate series or class of funds for each purchase option
One option considered was to require investment funds to maintain a separate series or class of
securities for each available purpose option (i.e. front end sales charge, DSC and no load)249
.
When an investment fund has multiple purchase options, part of the management fees earned by
an investment fund manager are typically used to fund the payment of sales commissions to
dealers on sales made under the DSC option. The cost of these commissions is commonly
248
The CSA recently began a multi-year research project to measure the impacts of CRM2 and POS on investors
and the industry. See note 149.
249 We note that currently there a few mutual funds that separate fund series by each purchase option (i.e. front end,
no load, and DSC). In these instances, we note that pricing for the DSC/low-load series is generally greater than
other series to reflect the higher distributions costs associated with this series.

135
allocated to the fund as a whole and, by consequence, all investors in the fund regardless of the
purchase option they chose. As a result, investors who purchase under the front end load option
(who generally make an upfront commission payment directly to the dealer at the time of
purchase) bear the same management fee as those investors who purchase under the DSC option
(who do not make such upfront payments because the dealer’s commission is paid directly by the
investment fund manager).
To the extent investment funds would be required to maintain a separate series or class of
securities for each available purchase option, the CSA would expect the resulting benefits to be
that:
the management fee charged to the particular series or class would reflect the costs
attributable to that particular series or class; and
costs incurred by each series or class would be borne only by investors in that particular
series or class, as opposed to all investors equally.
However, if this proposal was implemented, the CSA would expect some of the following
drawbacks:
a proliferation in the number of individual fund series currently offered by investment
fund managers, which may negatively impact investors as it will add further complexity
to the investment choice, and potentially reduce fee awareness due to the increased
number of options;
a fund facts document would be required for each purchase option as each purchase
option would be an individual series. This requirement would lead to increased costs on
the investment fund manager (and ultimately, fund securityholders) and require investors
to refer to the prospectus to discern all of the other available purchase options, further
adding to the complexity of this option; and
there would be no guarantee that the pricing for the separate series or class would reflect
only the costs attributable to that particular series or class.
ii. Require trailing commission and other embedded sales commissions to be
charged as an expense of the fund
Another potential approach was to require all trailing commissions and other embedded
commissions (such as sales commissions paid on DSC options) to be an expense of the fund. In
particular, this option would require separation of the trailing commission from the management
fee and require disclosure of any trailing commission paid as an individual, asset-based fee of the
fund. This approach would be similar to the current practice in the U.S., where investment
companies that pay trailing commissions to advisors bear an asset-based “12b-1 fee”250
, which is
separate and apart from the management fee and covers the cost of distribution.
250
Details regarding “12b-1 fees” may be found at: https://www.sec.gov/answers/mffees.htm.
136
If this approach was implemented, the CSA would expect the requirement to make all embedded
costs, which would include the sales commissions paid on DSC options, an expense of the fund
to:
necessitate the separation of purchase options into individual series (leading to the same
benefits and drawbacks as the option discussed above);
provide investors with greater transparency of the actual costs of advice and fund
management; and
allow investors to have greater control over, and awareness of, the costs and advice of
distribution (as any increases to the commission, which would be an expense of the fund,
would be subject to security holder approval). Similarly, the fund’s independent review
committee would also be in a position to provide governance and oversight over any
potential rate increases.
There would be, however, several drawbacks to this approach that may reduce its effectiveness.
For example:
it could potentially lead to negative tax implications at the fund level;
the funds offered by vertically integrated fund managers who make transfer payments
rather than pay trailing commissions to their affiliated dealers may appear to have lower
distribution costs than funds offered by independent fund managers as there may be no
trailing commission to disclose; and
changes to transfer payments would also not be subject to securityholder or IRC
approval, which would limit the governance and oversight, as well as investor control,
over these types of embedded payments.
iii. Require a standard class for DIY investors with no or reduced trailing
commission
A further option considered was to require each investment fund to have a low-cost, “execution
only” series or class of securities available for direct purchase by DIY investors and to require
discount dealers/brokerages to offer such series or class. This series or class could be made
available to investors in a number of ways, including through discount brokerages as well as
directly from the investment fund manager. Since DIY investors typically do not seek advice,
this series or class would have a lower management fee to reflect that no, or nominal, trailing
commissions are paid to advisors. While advice is not provided to investors in these instances,
the CSA understand that any nominal trailing commission paid would cover the costs of
administrative, compliance, and technological services provided by the dealer or manufacturer.
One potential benefit to this option would be that investors could choose to either: (a) use an
advisor for the purchase of a fund and assume the higher costs associated with this choice; or (b)
not use an advisor and have access to the same fund at a reduced cost. Accordingly, this option
could:
make the true costs of advice more apparent, which would allow those who use an
advisor to better evaluate the value of the advice/services they receive;

137
over time, lead investors to have greater awareness of, and control over, the level of fees
paid with their investment; and
improve the alignment between embedded dealer compensation paid and the services
provided to DIY investors.
One potential significant drawback to this approach, however, is that it may not be feasible or
possible for the CSA to compel investment fund managers to create a new “execution only”
series; and/or compel dealers to distribute this type of series.251
Why the CSA is not pursuing the investment fund manager focused initiatives
The CSA acknowledges that these options would appear to introduce a beneficial governance
mechanism to the fee structure that could help mitigate the conflict of interest that embedded
compensation raises for the investment fund manager, and also possibly improve the
transparency and fairness of fees for some investors. However, the CSA chose not to proceed
with these initiatives as we determined that the costs associated with these reforms would likely
outweigh any potential benefit to be received. Moreover, these reforms would fail to directly
address some of the important investor protection and market efficiency issues we have
identified, in particular the bias that embedded compensation engenders in sales
recommendations and its detrimental effect on investor outcomes and market efficiency.
The CSA also determined that to the extent the initiatives would respond to an issue, it would
mainly do so for only a small part of the market (in particular DIY investors)252
. Moreover,
these options would very likely add further complexity to our current fund fee structure through
an expected significant increase in the number of new fund series, and fail to have a meaningful
impact on competition.
3. Cap commissions
Another option considered by the CSA was the possibility of setting a maximum limit (i.e. cap)
on embedded commissions that investment fund managers may pay to dealers/representatives.
Under this option, dealer firms and their representatives would be free to directly charge their
clients commissions or fees for their services, either as a supplement or a substitute to embedded
commissions. The CSA considered that this option could also be a possible interim step toward
an eventual discontinuation of embedded commissions.
251
As further discussed in Part 4 of this Consultation Paper, we note that since 2012, certain investment fund
managers have launched a series of securities for direct purchase for DIY investors (see for example, series D
securities). However, the majority of mutual fund assets held in the discount brokerage channel still remain in a
series that pay a full trailing commission. As a result, the CSA are of the view that this option could only reach its
optimal effectiveness if investment fund managers are required to create, and dealers are required to sell, a discount
series.
252 According to Investor Economics, as at December 2015, only $56 billion of investment fund assets were held
through the online/discount brokerage channel.

138
A potential way to implement this option would be to limit the trailing commission rate payable
from the investment fund manager’s management fee revenue. This option could also be
complemented by additional disclosure in fund offering documents that would plainly describe
the fees charged as “ongoing sales commissions”. In addition to, or as an alternative to, setting a
cap on trailing commissions at the investment fund level, another potential option considered
was to impose a cap on the aggregate sales charge (in terms of a total dollar value) that could be
paid by an individual investor at the account level over the length of a fund investment. In this
way, once the cap is reached, the investor’s assets could be switched to a series or class of
securities that does not have any ongoing trailing commission or other embedded commission
payment, bringing certainty of costs to the investor.
The CSA anticipates the primary benefits of this option to be:
standardization and reduction in the variability of trailing commissions across funds,
which may reduce incentives for (a) dealers and their representatives to sell funds based
primarily on the trailing commission, and (b) investment fund managers to rely on the
trailing commission to attract and preserve assets under management;
reduction of the incentive for dealers and their representatives to promote the use of DSC
options as the offering of these options is likely to be reduced or possibly eliminated as a
result of the cap on embedded commissions; and
decreased fund costs (as DSC purchase options typically tend to be more costly to
administer than front end or no load options, we would expect a modest decline of 15-25
bps based on the pricing practices of investment funds that separate these purchase
options into unique series).
The shortcomings with this approach would be:
as the payment of embedded commissions will continue to be permitted, they may
continue to create a barrier to entry that may reduce the likelihood of lower-cost
providers entering the market;
the presence of embedded commissions may continue to make the fee structure more
complex, which may continue to inhibit investors’ understanding of such costs;
embedded commissions will still remain a “one-size-fits-all” fee that may not align well
with the services and advice actually provided to individual investors in accordance with
their specific needs, expectations and preferences; and
to the extent DSC options are reduced or eliminated, this approach would tend to place
firms that rely on these options (e.g. independent investment fund managers and dealers)
at a disadvantage relative to those that do not (e.g. integrated investment fund managers
and dealers).
Why the CSA is not pursuing a fee cap
Despite the apparent benefits to this approach, it is not being further considered by the CSA at
this time, either as a stand-alone option or as an interim step toward discontinuing embedded
commissions because, as the shortcomings demonstrate, many of the issues we have identified
would likely continue to persist in the presence of a fee cap.

139
This option would also cause the CSA to take a non-traditional role of setting fee caps for
investment products, rather than implementing measures intended to promote market efficiency.
Moreover, the CSA is not prepared to cap commissions due to the potential unintended
consequences that may result from a cap. For example, research has shown that a price cap can
indirectly cause average prices to rise.253
Accordingly, it would be very challenging to determine
and justify the appropriate cap rate in the circumstances.
253
Mark Armstrong, supra note 184. At page 6, Armstrong states: “Although the direct effect of a price cap is to
reduce prices, the indirect effect of reduced search lessens each firm’s demand elasticity so much that prices on
average go up. This formalizes a claim sometimes made informally, which is that imposing price controls on an
oligopoly market could raise equilibrium prices. One intuition for such a claim is that a price cap acts as a focal
point for tacit collusion.”

140

141
APPENDIX C
INTERNATIONAL MUTUAL FUND FEE REFORMS
Regulators of several international jurisdictions have implemented or are considering
implementing regulatory reforms with a view to addressing some of the issues we discuss under
Part 2 of this Consultation Paper. Below, we give an overview of the relevant reforms that have
been implemented or proposed in the U.S., the U.K., Australia, New Zealand, Singapore, the
European Union (EU), and in some of the EU’s member states, namely the Netherlands,
Germany and Sweden. We also give an account of their impact to date, as assessed further to
initial post-implementation reviews.
1. United States
On April 6, 2016 the United States Department of Labor (DOL) issued a final rule to address
conflicts of interest situations in the advisor-client relationship concerning the provision of
retirement advice (the Fiduciary Rule).254
i. Scope of the regulation
The Fiduciary Rule significantly broadens the scope of who is considered a “fiduciary” under the
Employee Retirement Income Security Act of 1974 (ERISA). Generally, and among other
requirements, those who are considered fiduciaries will need to abide by a fiduciary standard in
the provision of investment advice to retirement accounts.
ii. Overview of the regulation
Under the Fiduciary Rule, any individual receiving compensation for providing advice that is
individualized or specifically directed to a particular plan sponsor (e.g. an employer with a
retirement plan), plan participant, or Individual Retirement Account (IRA) owner for
consideration in making a retirement investment decision is a fiduciary. Such decisions can
include, but are not limited to, what assets to purchase or sell and whether to rollover from an
employer-based plan to an IRA. The fiduciary can be a broker, registered investment advisor,
insurance agent, or other type of advisor. Basic order-taking is not considered a fiduciary
activity.
To the extent an advisor is considered a fiduciary under ERISA, the advisor will need to abide by
a fiduciary standard. The advisor must also, among other requirements, either avoid payments
that create conflicts of interest (including, for example, trailing commissions) or comply with
certain exemptions that will mitigate the conflict. Among the available exemptions is the “Best
Interest Contract Exemption” (the BIC Exemption).
The BIC Exemption allows advisors to continue to receive commission-based compensation
provided that they meet certain conditions intended to mitigate the conflict created by such
compensation. Generally, advisors must acknowledge fiduciary status, provide advice that is in
254
The Fiduciary Rule and summary by the DOL may be found at:
http://www.dol.gov/ebsa/regs/conflictsofinterest.html

142
their client’s best interest, avoid making misleading statements, and receive no more than
reasonable compensation. The firm must also ensure it has policies and procedures aimed at
mitigating conflicts of interest, must not provide incentives to its employee advisors to make
recommendations that are not in the client’s best interest, and must ensure all conflicts of interest
are disclosed.
iii. Impacts
As compliance with the Fiduciary Rule will not be required until April of 2017, and there will be
a further transition period for many requirements of the BIC exemption to January 1, 2018, the
impacts of the Fiduciary Rule have yet to be determined.
2. U.K. – Retail Distribution Review
On December 31, 2012, the predecessor of the Financial Conduct Authority (FCA), the Financial
Services Authority, introduced new rules under their Retail Distribution Review (RDR) reforms
that aimed to raise advisor qualifications levels, improve the transparency of advisor charging
and services, and realign advisor incentives with those of consumers by removing the
commission they received from product providers.
i. Scope of the regulation
The commission ban relates to retail investment products only (including, but not limited to,
investment funds and life insurance with investment component). It excludes mortgages and pure
protection products such as non-investment life insurance, critical illness and income protection
insurance.
The commission ban originally applied in the case of any advisor (whether tied to or independent
of a product provider) making a recommendation in respect of a retail investment product to a
retail client. It requires advisors to be paid through fees charged directly to clients and not solicit
or accept from providers any other commissions, remuneration or benefit of any kind (regardless
of whether they intend to refund the payments or pass the benefits on to their retail clients).
Ongoing commission payments generated by transactions entered into on or before the RDR
entered into effect were not affected.
The commission ban was subsequently extended to retail platform service providers on April 6,
2014, with a sunset clause permitting ongoing commission payments generated by transactions
executed on or before April 5, 2014 to continue until April 5, 2016 (when they were required to
terminate).
ii. Overview of the regulation
The reforms under RDR introduce the following requirements:
Ban on conflicted advisor remuneration: The rules require advisors to set their own
charges for their services in agreement with their clients. Advisors may no longer receive
commissions from product providers or commissions otherwise embedded in the cost of
the product. Their charging structure must be based on the level of service they provide,

143
rather than the particular provider or product they recommend. Whether the charging
structure is based on a fixed fee, an hourly rate or a percentage of funds invested is for
the advisor to decide together with the client, provided the advisor always bears in mind
its duty to act in the client’s best interests.255
Ongoing fees are permitted only where a
client is paying for an ongoing service that has been properly disclosed or where the
product is one in which the client makes regular payments, and may be cancelled by the
client at any time without penalty.
Consumers can choose to pay an advisor’s fee separately from the payments for the
product, or have the advisor’s fee deducted from their investment/insurance contribution.
The FCA allowed for “provider facilitation” of payments under which the customer
agrees to payments with their intermediary, but it is the provider that delivers the
payment to the intermediary, for example from premiums paid. If payment is to be taken
from the investment, the product provider must obtain clear instructions from the client
about the amount to be deducted.
“Independent” vs. “Restricted” advice: The rules aim to ensure that investors
understand the services they receive by requiring advisors to clearly describe their
services as either “independent” or “restricted”. An “independent” advisor provides
personal recommendations that are: (a) based on a comprehensive and fair analysis of the
relevant market, and (b) unbiased and unrestricted. Where this test is not satisfied, an
advisor offers “restricted” advice (e.g. advice limited to proprietary products or a reduced
range of products).
Increased proficiency and professionalism: The rules require that individual advisors
meet higher proficiency requirements, subscribe to a code of ethics, carry out at least 35
hours of continuing professional development a year, and hold a statement of
professional standing from an accredited body. Advisors that do not meet these standards
are no longer able to make personal recommendations to retail customers since December
31, 2012.
The desired outcomes of the RDR were set out in a discussion paper (FSA DP07/01) and
included, among others:
standards of professionalism that inspire consumer confidence and build trust;
an industry that engages with consumers in a clearer way about products and services;
and
compensation arrangements that allow competitive forces to work in favour of
consumers.
255
In the U.K., the Financial Conduct Authority Handbook provides that all registrants must act honestly, fairly and
professionally in accordance with the best interest of the client. This best interest standard is qualified, however,
since registrants are subject to a spectrum of requirements which vary according to the nature of the advice given to
clients (“independent”, namely on a broad range of products, and “restricted”, namely on mainly proprietary or other
specific products).

144
iii. Impacts
a. FCA – First stage of RDR post implementation review:
On December 16, 2014, the FCA published the findings from the first stage of its post
implementation review.256
While the FCA cautioned that it is too early to obtain a definitive
picture of the impact of RDR, the evidence from the first stage of the review showed a positive
picture, with encouraging signs that the RDR is on track to deliver its objectives in many areas.
The main findings are described below:
Reduced product bias: The removal of commission paid by providers to advisors has
reduced product bias from advisor recommendations, reflected in a decline in the sale of
products which paid higher commissions pre-RDR and an increase in the sale of those
which paid lower or no commission pre-RDR. This reduced bias has led to an increased
focus by advisors on the provision of more holistic ongoing advice services and an
enhanced quality of advice for at least some consumers.
Reduced product cost and improved competition: Product prices have fallen by at
least the amounts paid in commission pre-RDR, and there is evidence some product
prices may have fallen even further. This is due in part to the introduction of simpler
products and funds with lower fees and advisors and platforms exerting more competitive
pressure on providers, with platforms increasingly able to negotiate lower product costs.
The removal of commission also means that providers who sold lower or no commission
products pre-RDR (e.g. index tracker funds) are now competing on a more equal basis.
Higher advice costs for some: Post-RDR, one-off charges appear in line with pre-RDR
initial commissions paid to advisors and ongoing charges have increased relative to
ongoing commissions for at least some firms and in some regions of the U.K. There
however lacks a comprehensive evidence base (particularly for the pre-RDR period) to
tell whether payments to advisors have increased more generally, or whether such
changes will be long-term. A longer post-RDR trend in advisor charges will help inform
this.
Number of firms/advisors not significantly impacted: While there was some exit from
the advisory business in the period leading up to RDR, by the banks and by some
financial advisors (largely due to the requirement to meet higher proficiency
requirements and also due to a number of market factors), there remains a large number
of advisory firms and advisors to serve consumers. Average revenues and profitability of
these advisory firms has increased.
Increased focus on higher wealth clients: The reforms have led many firms to consider
the fundamentals of their business models and make key changes, e.g. segmenting their
256
FCA, Post-Implementation review of the Retail Distribution Review – Phase 1, December 2014,
https://www.fca.org.uk/publication/research/post-implementation-review-rdr-phase-1.pdf. The FCA commissioned
external consultants Europe Economics to undertake the first phase of the review. Their full report is available here:
https://www.fca.org.uk/static/documents/research/rdr-post-implementation-review-europe-economics.pdf.
145
customers, with some focusing on services to those with higher levels of investible assets
and more complex (and profitable) investment advice needs.
Limited evidence of an “advice gap”: There was limited evidence of an advice gap
emerging for lower-wealth consumers as a result of some firms having moved to target
higher net worth clients post RDR and not being able or willing to provide advice to
consumers outside this segment. The evidence however suggested that the number of
consumers affected by this was generally small and that these consumers were likely to
have been picked up by other advisory firms. The FCA determined that there was little
evidence that the availability of advice had reduced significantly as a result of the RDR,
with the majority of advisors still willing and able to take on more clients. At the same
time, there was evidence that consumers were increasingly buying products on a non-
advised basis. The FCA also found that the group of consumers who seek advice but
were not willing to pay the true cost of such advice on the grounds that it did not
represent value for money was likely to have increased under the RDR. The FCA
however pointed out that these consumers existed to a degree prior to the RDR and that it
was arguable as to whether this group was in fact part of an “advice gap”. The FCA
further noted that the increase in this group of consumers had been limited by the
adoption by the majority of advisory firms of contingent charging structures rather than
upfront fees. The FCA also noted the efforts they were making to increase the supply of
lower-cost simplified advice to meet consumer demand.
The FCA expects to publish the next phase of its post-implementation review in 2017, which will
allow it to draw from at least three years of evidence. A subsequent, third phase of the review
will consider the longer-term implications.
b. HM Treasury and FCA – Financial Advice Market Review:
In the face of concerns of a potential advice gap for some consumers and a lack of engagement
with financial services, the HM Treasury (HMT) and the FCA launched the Financial Advice
Market Review (FAMR) with a consultation paper (Call for input) published on October 12,
2015257
, seeking input on how to make financial advice work better for consumers. The aim of
the review was to explore ways in which government, industry and regulators can take individual
and collective steps to stimulate the development of a market which delivers affordable and
accessible financial advice and guidance to everyone, at all stages of their lives.
The review explored the supply and demand sides of the market for financial advice and
guidance, the barriers to providing these services and the potential remedies.
HMT and the FCA published the final FAMR report on March 14, 2016.258
Some of the report’s
key findings include:
257
HM Treasury & FCA, FAMR – Financial Advice Market Review – Call for input, October 2015,
http://www.fca.org.uk/static/documents/famr-cfi.pdf.
258 https://www.fca.org.uk/publication/corporate/famr-final-report.pdf.
146
Access to advice: Following the RDR, FAMR notes that the U.K. has a high quality
financial advice market and that standards and professionalism in the industry have
increased. The drive for higher standards and professionalism, along with other factors,
has however contributed to a reduction in advisor numbers. The move to fee-based advice
on retail investment products has improved transparency and eliminated conflicts of
interest caused mainly by a commission-driven model. Nonetheless, advice is expensive
and is not always cost-effective for consumers, particularly those seeking help in relation
to smaller amounts of money or with simpler needs. It may not be economical for firms
to serve consumers with lower amounts to invest or with simple needs. These changes
have highlighted concerns that there is an advice gap in the U.K. as not all consumers can
currently access the advice they need at a price they are willing or able to pay. FAMR
also notes that the low levels of consumer demand for advice are also contributing to the
advice gap. Such low demand is driven by several factors, including but not limited to
high costs (especially relative to small amounts available to invest), limited confidence in
engaging with financial issues, and a lack of trust following past instances of mis-selling.
Decline in advisor numbers: The review notes a decline in advisor numbers over recent
years (an approximate 23% decline of registered advisors between 2011 and 2014) for a
range of reasons, including the introduction of the RDR. FAMR identifies that the
majority of advisors exiting the market during this period were those employed by the
banks and building societies. There are a number of reasons for these exits, including
declining profitability of branch-based distribution models, a lesser role for branch-based
activity, anticipation of the RDR and the consequences of past episodes of mass mis-
selling (in terms of redress and reputational damage).
Services to mass market customers: FAMR also identifies that banks, insurers and
other large firms have, however, traditionally been more likely to serve mass-market
customers with lower levels of wealth. The FCA’s recent survey of advisors found that
customers with pension wealth of less than £30,000 made up 27% of customers advised
by medium or large advisory firms and 19% of customers advised by very small firms
(those with only one or two advisors). This is likely to be because firms with high
numbers of advisors are able to benefit from economies of scale, which make it possible
to serve consumers with lower levels of affluence. Larger, more diversified financial
services firms also benefit from having an existing customer base across which they can
cross-sell their advisory services.
Cost of receiving advice: FAMR notes that there are many consumers who would be
willing to pay for advice but who are discouraged by higher prices. The responses
received to the Call for input noted, among other things, that the perception and the
reality of clients affect their willingness or their ability to pay fees for advice. FAMR also
notes that it is currently difficult for the traditional model of advice to serve consumers
economically at lower fee levels.
Cost of providing advice: For the cost of providing advice, a 2016 industry survey of
advice firms suggested that, over the last two years, the proportion of firms who ask for a
minimum portfolio of more than £100,000 has more than doubled, from around 13% in

147
2013 to 32% in 2015. The FCA’s recent survey of advisors also supports this, suggesting
that 45% of firms very rarely advise customers on retirement income options, if those
customers have small funds (i.e. less than £30,000) to invest. There are several reasons
for this. A consistent theme emerging is that there are significant minimum costs per
customer associated with supplying face-to-face advice which inevitably affect
commercial decisions about whether to offer services to consumers with lower amounts
to invest. It will also inevitably affect whether the consumer feels that the service they
receive represents good value for money.
FAMR notes, however, that some larger firms have recently signalled a return to the
advice market. In some cases this is being facilitated by effective and creative use of new
technologies. A number of firms currently in the advice market are also planning to
increase the number of customers they serve. The FCA’s recent survey of advisors found
that around 30% of firms surveyed expect to grow the number of advisors over the next
year.
The FAMR’s recommendations for tackling the barriers to consumers accessing advice fall into
3 key areas:
Providing affordable advice to consumers – these recommendations include proposals
to make the provision of advice and guidance to the mass market more cost-effective.
FAMR makes a number of recommendations intended to allow firms to develop more
streamlined services and engage with customers in a more engaging and effective way.
These recommendations include a proposal that the FCA should set up a dedicated team
to assist firms that are seeking to develop automated advice models to bring those to
market more quickly;
Increasing the access to advice – these recommendations are aimed at increasing
consumer engagement and confidence in dealing with financial advice. FAMR proposes
a number of measures to help consumers engage more effectively with advice. These
recommendations include making their own information more easily available to those
that advise them; the development of ‘rules of thumb’ and the use of nudges to
encourage customers to seek support at key life stages and recommendations to help
employers give more support to their staff in financial matters; and
Addressing industry concerns relating to liabilities and consumer redress – these
recommendations aim to address concerns about the boundary between regulated advice
and more general forms of guidance. In particular, firms do not feel able to develop
more streamlined advice services that meet simple consumer needs in the absence of
clarity around the liabilities involved in providing simpler forms of advice or guidance.
Firms consider that if streamlined advice services cannot be guaranteed to involve lower
liabilities, it may not be commercially worth the risk to provide it. FAMR makes a
number of recommendations to increase clarity and transparency about the way in which
the Financial Ombudsman Service deals with consumer complaints. The report also
includes proposals relating to the funding of the Financial Services Compensation
Scheme to assist in managing longer term liabilities.
148
In June 2016, a Financial Advice Working Group was established to take forward the three
recommendations outlined above. Since then, the FCA has set up an Advice Unit to provide
regulatory feedback to firms developing automated models that seek to deliver lower-cost advice
to consumers.259
In addition, HMT has issued a consultation looking to narrow the current
definition of regulated investment advice.260
c. FCA – Retail Mediation Activities Return results:
In October 2016, the FCA issued a Data Bulletin261
providing insights into the activities, revenue
and charges of advice firms post RDR. These insights are based on the FCA’s analysis of data
from the Retail Mediation Activities Return, which is submitted by approximately 12,000 FCA
regulated firms. The FCA’s findings are:
Overall revenue: Overall revenue from retail investment business increased by 16%
between 2013 and 2015 and the number of firms increased by 6% over the same period;
Revenue from commission vs direct fees/charges: In 2015, commission accounted for
31% of revenue earned and direct fees/charges accounted for 64%, compared to 2013
when commission accounted for 56% and direct fees/charges accounted for just 37%.
The reduced but continuing revenue from commissions consists of legacy (pre-RDR)
business which advice firms are allowed to continue to receive under RDR subject to
certain conditions;
Type of advice: 83% of retail advice firms report that they provide independent advice
with only 14% providing restricted advice and 3% both types. However, restricted
advice accounted for 62% of revenue from advisor charges (with independent advice at
38%). These numbers reflect that, although fewer in number, the restricted advice
population includes some very large firms that account for a significant slice of the total
business conducted;
Method of advisor payment: Payments facilitated by product providers are the main form
of advisor payment accounting for 81% of initial charges and 74% of ongoing charges,
with 19% and 26% respectively being paid direct to the advisor by the client;
Charging method: The main advisor charging methods include charging by the hour, as
a percentage of investment value, fixed fee, or a combined charging structure, with the
259
Further details about the Advice Unit can be found here: https://www.fca.org.uk/firms/project-innovate-and-
innovation-hub/advice-unit.
260 Further details of this consultation can be found here: https://www.gov.uk/government/consultations/amending-
the-definition-of-financial-advice-consultation/amending-the-definition-of-financial-advice-consultation.
261 FCA Data Bulletin, October 2016, Issue 7, https://www.fca.org.uk/publication/data/data-bulletin-issue-7.pdf

149
most typical charging method used being charging as a percentage of investment value.
Some firms may use more than one method of charging;
Fee rates: Where charging as a percentage of investment value, the average charges for
initial advice are 1% (minimum) and 3% (maximum). For ongoing charges, the average
rates are 0.5% (minimum) and 1% (maximum). Where charging an hourly fee, the most
common hourly rate nationally is £150 per hour. National average minimum and
maximum rates vary between £150 and £195 per hour, with regional variations in
charges.
As for insights into the activities of product providers post-RDR, a sales activity report from the
Investment Management Association262
shows that from 2012 to 2015, gross retail sales of
investment funds in the U.K. increased from £105.4 billion to £160.2 billion, a 52% increase.
3. Australia – Future of Financial Advice
The Future of Financial Advice Reforms (FOFA) came into effect in Australia on July 1, 2012.
Its primary objective was to improve the quality of financial advice, and access to this advice for
Australian consumers. Compliance with the new rules was voluntary in the first year of
operation, and became compulsory from July 1, 2013.
i. Scope of the regulation
The regulation under FOFA applies to all advice given to retail clients on any retail financial
product except non-life insurance products and basic banking products.
ii. Overview of the regulation
Key changes introduced under FOFA include those listed below:
Prospective ban on conflicted remuneration: Any monetary or non-monetary benefits
that could reasonably be expected to influence the distribution of, and advice to clients
about, retail financial products are considered to be conflicted remuneration. There is a
prospective ban on upfront and trailing commissions as well as a ban on any form of
volume-based payments in relation to distribution and advice given on retail investment
products. Commissions paid by product providers to advisors in relation to investments in
place prior to the coming into force of the FOFA reforms are not banned and can
continue to be paid. The key aim of this change is to ensure the interests of advisors and
retail clients are more closely aligned, improving the quality of advice provided, as well
as removing the potential for providers to influence the advisor’s recommendation.
262
The Investment Association, “Summary of UK Domiciled Unit Trust / OEIC Sales 2006-2016”,
http://www.theinvestmentassociation.org/assets/files/press/2016/stats/stats0116-02.pdf

150
Advisor charging regime: Advisors are expected to agree on their fees directly with
their clients, and disclose those fees in a clear manner. If an advisor is providing an
ongoing service for which clients pay ongoing fees such as asset-based fees, they are
required to ask clients to opt in (or renew) their advice agreement every two years.
Moreover, advisors are prohibited from charging asset-based fees on borrowed amounts
that are to be used to acquire financial products by or on behalf of a client. If a client has
a portfolio of products purchased with a combination of borrowed and non-borrowed
amounts, asset-based fees can be charged on the proportion of the portfolio purchased
with non-borrowed amounts.
Statutory best interest duty: Advisors are required to act in the best interests of their
clients, subject to a ‘reasonable steps’ qualification263
, and place the best interests of their
clients ahead of their own when providing personal advice to retail clients.
Annual fee disclosure statement: Advisors must give each client an annual statement
containing information from the previous 12-month period about:
o the amount of fees paid by the client;
o the services that they were entitled to receive; and
o the services that they did receive.
In 2014, a newly elected Australian Government introduced a Bill proposing several
amendments to the new requirements under FOFA with the aim of streamlining the regulations
and reducing compliance costs. In November 2015, the Senate passed a motion regarding the
Bill, effectively disallowing a number of the proposed amendments, and otherwise implementing
minor and technical changes,264
none of which eliminated or changed the above core elements of
the FOFA reforms.
iii. Impacts: FOFA Post Implementation Review
On September 17, 2014, the Australian Securities and Investments Commission reported on the
findings of its review of the implementation of the FOFA reforms.265
Key findings include:
Most dealer registrants did not change their service offerings as a result of FOFA,
although some indicated an increase in scaled advice;266
263
There is a safe harbour that advice providers can rely on if they can show that reasonable steps relating to know
your client, know your product, suitability and proficiency are taken by the registrant.
264 For example, one amendment that was passed included an extension of the time for advisors to provide renewal
opt-in notices and fee disclosure statements to retail clients from 30 to 60 days after the clients’ renewal notice day.
265 ASIC Report 407, Review of the financial advice industry’s implementation of the FOFA reforms, September
2014, http://download.asic.gov.au/media/1845586/rep407-published-17-september-2014.pdf. The findings in the
report are based on ASIC’s review of 60 registrants accounting for close to 10,000 advisors servicing 4.6 million
retail clients.

151
One-third of the registrants had changed the composition of their product shelf in light of
the best interest duty and related FOFA obligations;267
Advisor numbers had not changed;
The advice industry remained concentrated,268
and registrants were often affiliated with
issuers of financial products;269
Most registrants reported changes to their revenue streams, with a reduction in
commissions after the ban and an increase in advice fees;
Most registrants stated the biggest challenges they had experienced in implementing the
reforms related to the requirement to provide fee disclosure statements and the related
changes they needed to make to their systems; and
Registrants considered the best interest duty to pose a relatively high risk of non-
compliance in the future. To mitigate this risk, registrants had revised their advice
systems and procedures, and most were relying on the “reasonable steps” safe harbour
provision to demonstrate their compliance with the best interests duty and related
obligations.
4. New Zealand – Review of Financial Advisers Act 2008 and Financial Service Providers
Act 2008
In July 2016, the Ministry of Business, Innovations and Employment (MBIE) of New Zealand
published a review270
of two acts governing the financial advice industry, namely the Financial
266
The FOFA reforms allowed for “scaled advice”, being a form of personal advice that is limited in scope, either by
being in response to a limited range of issues or by addressing a specific area of the investor’s needs (for example,
insurance needs or saving for a home). ASIC stated its view that “scaled advice” must still be of the same high
quality as more comprehensive advice and is therefore subject to the same legal requirements as advice that is fully
comprehensive, including ensuring that the advice provided is in the best interests of the client.
267 Of the changes to approved product lists, 14% were decreases to the types and number of products, 11% related
to benchmarking and only 4% increased the number or types of products.
268 Over 90% of the retail clients of licensees in the sample were clients of the 15 largest licensees (25% of the
sample), with the remaining 75% of licensees in the sample accounting for just 10% of the clients.
269 For large firms, 25% of the products on their approved product lists were issued by related parties.
270 Ministry of Business, Innovation & Employment – Factsheet – Review of the operation of the Financial Advisers
Act 2008 and the Financial Service Providers (Registration and Dispute Resolution) Act 2008 – July 2016,
http://www.mbie.govt.nz/info-services/business/business-law/financial-advisers/review-of-financial-advisers-act-
2008/pdf-document-library/factsheet-review-fa-fspa-13-july-2016.pdf.
See final report here: http://www.mbie.govt.nz/publications-research/publications/business-
law/Final%20report%20on%20the%20review%20of%20the%20FA%20and%20FSP%20Acts.pdf.

152
Advisers Act 2008271
and the Financial Service Providers (Registration and Dispute Resolution)
Act 2008.
The 2016 review had four main objectives:
Ensure consumers can access the financial advice they need;
Improve the quality of financial advice;
Be enabling and not impose any undue compliance costs, complexity or barriers to
innovation; and
Ensure access to redress.
The MBIE concluded that new reforms were needed to move the legislator’s focus away from
professionalizing advisors toward creating a level playing field of regulation for all those
providing financial advice. The MBIE stated that the reforms were to be refined through
consultations and would be officially introduced to the New Zealand legislative authorities at the
end of 2016.
Currently the MBIE expects to make the following key changes to the legislation governing
financial advice:
Removing some regulatory boundaries: The requirement for advice tailored for a
consumer to be provided by a natural person will be removed in order to enable robo-
advisors to offer tailored advice;
Best-interest standard: All individuals or robo-advisors providing financial advice will
be required to place the interests of the consumer first and to only provide advice where
competent to do so. All financial advice will also be subject to a Code of Conduct, where
standards will be set that are consistent with those legislative obligations. In addition, a
client-care obligation will also be introduced, requiring advisors to ensure that consumers
are aware of the limitations of their advice, such as how many products and how many
providers they have considered;
Professional designations: To improve consumer understanding, current financial
advisor designations will be replaced with simpler ones;
Disclosure: More meaningful disclosure requirements for all types of advice will be
introduced to improve consumer understanding and transparency. Disclosure will be
simplified and shortened to include core information about the scope of service,
271
The scope of the Financial Advisers Act encompasses advice for several financial products, including but not
limited to debt securities, equity securities, managed investment products, investment-linked insurance contracts and
derivative products. Section 18 of the Financial Advisers Act stipulates who is permitted to provide personalized
service to retail clients in relation to certain financial products.

153
remuneration (including commissions) and competence, and would be available in user-
friendly formats;
Licensing: Anyone (or any robo-advisor) providing financial advice will need to be
licensed. Licensing will be required at the firm level. There will be flexibility,
depending on the size and nature of the firm, in how prospectus licensees will be
expected to meet the licensing requirements;
Stronger connection to New Zealand: To maintain the reliability of the regulation of
New Zealand financial markets, firms will only be able to be licensed if they are in the
business of providing financial services from a place of business in New Zealand or if
they are providing services to New Zealanders.
In their review, the MBIE states that they will not prohibit sales commissions because they
believe banning is not a ‘silver bullet’ that will improve the quality of advice. They recommend
focusing on the conduct of those providing financial advice, rather than imposing a ban or
restriction on commissions. They believe a ban might limit access to financial advice, especially
when New Zealanders are already reluctant to pay for financial advice. The MBIE states that it
also believes that banning commissions would not address conflicts of interest arising from soft-
commissions, bonuses and the sale of proprietary products.
Nonetheless, the MBIE states that they will closely monitor the conduct of advisors, alongside
the New Zealand Financial Market Authority, to determine whether their reforms will be
sufficient to ensure consumers have access to quality and transparent financial advice.
5. Singapore
In March 2012, the Monetary Authority of Singapore (MAS) announced the launch of the
Financial Advisory Industry Review (FAIR) with the aim of raising the standards of practice in
the financial advisory industry and improving the efficiency in the distribution of life insurance
and investment products in Singapore. A panel, chaired by MAS and comprising representatives
from industry associations, consumer and investor bodies, academia, media, and other
stakeholders (FAIR Panel), was formed in April 2012 to conduct the review. In January 2013,
FAIR Panel released their recommendations272
under the following key themes:
raising the competence of financial advisors;
raising the quality of financial advisory firms;
making financial advising a dedicated service;
lowering distribution costs; and
promoting a culture of fair dealing.
272
Monetary Authority of Singapore, Consultation on Recommendations of the Financial Advisory Industry Review,
March 2013,
http://www.mas.gov.sg/~/media/resource/publications/consult_papers/2013/5%20Mar%202013%20Consultation%2
0Paper%20on%20FAIR.pdf
154
In particular, the FAIR Panel recommended that financial advisory firms be prohibited from
paying their financial advisors cash and non‐cash incentives which are:
tied to the sales volume of a specific investment product; and
over and above the typical commissions paid to financial advisors for selling that
investment product.
In response to the public consultation on the recommendation of the FAIR Panel, the MAS stated
that they would not change the remuneration structure of financial advisors by capping or
banning commissions273 for the following reasons:
based on an April 2012 survey conducted by the MAS, 80% of respondents said they
were not willing to pay an upfront fee for advice;
the implementation of a fee-based regime could result in consumers needing to pay more
for their protection or investment needs, especially for consumers with smaller
investments; and
there could be other unintended consequences, such as a reduction in the number of
financial advisors in the industry, exacerbating the lack of financial and protection
planning by consumers.
The MAS stated that they will take into consideration the effectiveness of the current measures
and the experience of other jurisdictions with a mandated fee-based regime.
In 2015, under the New Financial Advisers Remuneration and Incentive Regulations, the MAS
introduced a cap on specified commissions that financial advisors can receive from sales of life
insurance policies274
. This rule was due to come into force in January 2016, but its
implementation has been delayed until January 2017 further to the industry’s request for more
time to implement the changes.
6. European Union – Markets in Financial Instruments Directive II (MiFID II)
MiFID II is designed to take into account developments in the trading environment since the
implementation of MiFID in November 2007 and, in light of the financial crisis, to improve the
functioning of financial markets making them more efficient, resilient and transparent. MiFID II
came into force on July 2, 2014, and is required to be transposed into national law by Member
273
Monetary Authority of Singapore, Response to Feedback Received – Public Consultation on Recommendations
of the Financial Advisory Industry Review, September 2013, page 55,
http://www.mas.gov.sg/~/media/MAS/News%20and%20Publications/Consultation%20Papers/Response%20to%20
Feedback%20Received%20on%20Public%20Consultation%20on%20Recommendations%20of%20the%20Financia
l%20Advisory%20Industry%20Review.pdf 274
Additional information is available here: http://www.mas.gov.sg/news-and-publications/speeches-and-monetary-
policy-statements/speeches/2015/explanatory-brief-financial-advisers-amendment-bill-2015-and-insurance-bill-
2015.aspx and here:
http://www.mas.gov.sg/~/media/MAS/News%20and%20Publications/Consultation%20Papers/Annex%2017%20Ne
w%20Financial%20Advisers%20Remuneration%20and%20Incentive%20Regulations.pdf.

155
States by July 3, 2017, and must generally apply within European Union Member States by
January 3, 2018.275
i. Scope of the regulation
MiFID II introduces new investor protection measures, which include, among other changes, a
ban on inducements for independent advisors and portfolio managers (discretionary investment
management). The ban applies to all “financial instruments” within the scope of MiFID II that
they sell to both institutional and retail clients (including, but not limited to, funds).
ii. Overview of the regulation
Some of the key investor protection measures introduced by MiFID II include those listed below:
Ban on inducements: Firms providing independent advice or portfolio management may
not accept and retain276
any fees, commission, or monetary or non-monetary benefits
from third parties in relation to the advice or service. Minor non-monetary benefits from
third parties (such as training on the features of a product) are permitted, provided they
are: (a) capable of enhancing the quality of service provided to a client; (b) of a scale and
nature such that they could not be judged to impair compliance with the firm’s duty to act
in the best interest of the client; and (c) are clearly disclosed. Commissions on non-
independent advice (e.g. in respect of in-house products) are still allowed. However, any
such commissions must: (a) be designed to enhance the quality of the relevant service to
the client; (b) not impair compliance with the firm’s duty to act honestly, fairly and
professionally in accordance with the best interest of its clients; and (c) be clearly
disclosed to the client, in a manner that is comprehensive, accurate and understandable,
prior to the provision of the relevant service.
Independent vs non-independent advice: Firms must tell clients in advance whether
their advice is provided on an independent basis or a more restricted analysis of the
market and, in particular, whether the range is limited to financial instruments issued or
provided by related entities. Firms that provide advice on an independent basis must
assess a sufficiently large number and diversity of financial instruments available on the
market and should not limit the range to instruments issued by the firm or related entities.
Bundled services: Firms have to inform clients whether they can buy the different
components of a bundled service separately, providing information about costs and
charges in respect of each component.
Suitability: Existing suitability requirements applying to investment firms providing
investment advice or portfolio management are enhanced with the requirement to now
275
For more details of the regulation, consult the website of the European Commission at:
http://ec.europa.eu/finance/securities/isd/mifid2/index_en.htm.
276 Firms may accept compensation from third parties if that compensation is passed through to the client in its
entirety and hence is not retained by the firm.

156
take into account the client’s risk tolerance and ability to bear losses.277
In addition, when
an investment firm recommends a bundled package of services or products, the overall
package must be suitable. And finally, firms providing investment advice must provide
clients a suitability report before the transaction is made or immediately after the client
becomes bound, specifying how the advice given meets the preferences, objectives, and
other characteristics of the client.
Information on costs and charges: Information on all costs and charges, including the
cost of advice and the cost of the product must be disclosed, the method of payment
stated, along with details of any third-party payments. All costs and charges should be
aggregated so the client understands the overall cost as well as the cumulative effect on
the return of the investment (with an itemized breakdown should a client request it).
Information about costs and charges is to be provided, where applicable, at least annually
post-sale.
Product governance: Manufacturers of financial instruments will have to maintain a
product approval process that will identify the target market for each product and assess
all relevant risks. Firms that offer such products but do not manufacture them will have to
understand the features of those products, including the identified target market.
iii. Impacts
As the new requirements won’t apply until 2018, the impacts of these new measures remain to be
determined.
7. Netherlands – Ban on commissions (provisieverbod)
On January 1, 2013, the Netherlands Authority for the Financial Markets (AFM) introduced a
complete ban on commissions on financial products outside the scope of the original EU Markets
in Financial Instruments Directive (MiFID), such as mortgages and life insurance, with the aim
of achieving a cultural shift from product-driven sales of financial products toward client-
centered advice. On January 1, 2014, the ban was extended to all retail investment services (e.g.
investment advice (whether independent or restricted), execution-only and (individual) portfolio
management) in respect of financial instruments within the scope of MiFID, such as funds.
i. Scope of the regulation
The ban on commissions now applies to all financial products sold by way of (individual)
portfolio management, investment advice or execution only. The products covered by the ban
include mortgages, insurance (except property and casualty insurance)278
, savings products such
as annuities, and investment funds.
277
Current suitability requirements under MiFID include the requirement to obtain information regarding the client’s
knowledge and experience, their financial situation and investment objectives.
278 In determining which products should be covered by the ban, the Minister of Finance considered both (i) product
complexity and (ii) the intensity of competition in the market for products. If a product was found to be subject to

157
ii. Overview of the regulation
The key elements of the reforms include those listed below:
Ban on inducements: Commission payments on all financial products are banned.279
Advisors have to set distinct prices for advice and intermediation. Fees are agreed
between the intermediaries and consumers. To help consumers spread the cost of
distribution over time, intermediaries and consumers can agree on the fee payment being
spread over a set period (maximum 24 months).
‘Cost price’ approach: Fees charged for advice have to cover the costs incurred in the
process of giving the advice. Providers of financial products who are also advisors (direct
sales) are also required to ensure that fees for advice/intermediation are cost-effective,
and that they do not fall below the direct cost of providing the advice/arranging the
intermediation.
Remuneration transparency: Advisors must prepare a summary disclosure document
which presents:
o Information on the fees they charge (for an average customer);
o The type and scope of their advice; and
o The costs they incur.
The document must be provided to investors prior to a transaction and is intended to
allow investors to more easily compare costs and the scope of advice across different
advisors.
Knowledge and experience test for execution only: Consumers who declare their
intention to purchase execution-only financial services must first pass a knowledge and
experience test to show they have sufficient knowledge and experience to purchase
financial services execution-only.280
strong competition among providers, and consumers were found to have a good understanding of these products and
awareness of there being multiple providers, the product was excluded from the ban. As a result, while motor
vehicle and content and liability insurance are excluded from the ban, life insurance and funeral insurance are not.
279 The key elements of the reforms are discussed in a report by Oxera Consulting, “Regulating remuneration
systems: effective distribution of financial products”, January 2015, at pages 24 to 29,
http://www.oxera.com/getmedia/c28539cd-c6dc-42e4-9940-a624b0ff47ea/Remuneration-systems_Final-
report_Jan2015.pdf.aspx?ext=.pdf.
280 The AFM has indicated that, while it allows consumers to purchase financial products without purchasing
financial advice (execution-only), it believes that such advice should be recommended to most consumers,
particularly if the financial products are complex. In response to concerns that requiring consumers to pay for advice
could lead to an unwarranted increased demand for execution-only products, the AFM introduced a knowledge and
experience test. It is unclear how the AFM is enforcing this requirement.

158
iii. Impacts
During the 2009-2013 period, various related pieces of regulation were implemented in
Netherlands, which makes it challenging to separate the effects of the ban and other pieces of
regulation. The market for financial advice appears to have consolidated over recent years. This
development cannot however necessarily be attributed to the ban on commissions as the trend
towards consolidation had already begun before implementation of the ban. A full assessment of
the impact of the ban is expected to be undertaken in the first half of 2017. Anecdotal evidence
to date suggests that:
the ban may have caused a reduction in fees for advice; and
consumers may be somewhat reluctant to pay for advice, and may be purchasing less
advice. Evidence in both mortgages and annuities suggests that consumers are opting for
execution-only more frequently.
8. Germany – Strengthening Investor Protection Act and Fee-Based Financial Advice Act
In the wake of the 2007-2008 financial crisis, the German Federal Financial Supervisory
Authority (Bundesanstalt für Finanzdienstleistungsaufsicht, or BaFin), introduced a series of
reforms aimed at improving the quality of financial advice that retail consumers receive.
Specifically, the Act relating to Strengthening Investor Protection and Improving the
Functionality of the Capital Market (Strengthening Investor Protection Act) became effective
in November 2012. This reform was followed by the Act on the Promotion and Regulation of
Fee-Based Investment Advice regarding Financial Instruments (Fee-Based Investment Advice
Act), which came into force in August 2014.
i. Scope of the regulation
The new rules aim to improve the quality of advice by increasing advisor monitoring and advisor
qualifications, as well as increasing the transparency of fees and commissions paid for
investment advice. 281
ii. Overview of the regulation
The Strengthening Investor Protection Act contained the following three key provisions targeting
financial advice:
Product information sheet: Financial advisors must provide their clients with a short
product information sheet for each investment product advised to purchase. The product
information sheet should contain all the information required for an investor to make an
281
Additional information is available here:
https://www.bafin.de/SharedDocs/Veroeffentlichungen/EN/Fachartikel/2014/fa_bj_1407_honorar-
anlageberatung_en.html and in a report by RAND, “Financial Advice Markets: a cross-country comparison”, Jeremy
Burke, Angela A. Hung, October 2015, at pages 14 to 16, http://www.rand.org/pubs/research_reports/RR1269.html.
159
informed comparison across financial instruments, including the nature of the
recommended financial instrument, how it works, and its associated costs and risks;
Increased advisor monitoring: Institutions must disclose to BaFin the individual
employees who provide financial advice to clients and all complaints lodged against an
advisor based on the advice provided. With this information, BaFin created a database to
monitor and respond to abuses;
Increased advisor qualifications: Financial institutions must ensure that their advisors
have sufficient expertise to provide financial advice. In particular, all advisors must have
expertise in contract law and securities law and be knowledgeable about the functioning,
risks, and costs of the financial instruments on which they advise.
Commission-based investment advice is the predominant model in the German market. BaFin
found that although advisors are legally obligated to disclose to clients any inducements received
from product providers or issuers of financial instruments, many clients remain unaware of that
conflict. The Fee-Based Financial Advice Act was introduced with the aim of increasing
transparency about advisor compensation and promoting non-conflicted advice. The regulation
introduced “fee-based investment advice” as a legally protected designation and imposed
specific restrictions on those seeking to become fee-only advisors.
In order to designate their services as “fee-based investment advice”, financial institutions must
register with BaFin by submitting an audit certificate establishing that their advisors meet the
following requirements:
Remunerated only by the client: To promote non-conflicted financial advice, fee-only
financial advisors must receive remuneration directly from their clients and may not
receive inducements from third parties;282
Adequate range of offered financial products: The range of offerings which the
advisor’s recommendations are based on must be sufficiently diversified with regards to
providers and issuers of financial instruments. If associated with a product provider,
financial advisors must ensure that their range of financial products is large enough to
provide their clients with suitable recommendations. Fee-based investment advisors are
prohibited from offering only financial instruments from sellers or issuers who are
closely affiliated with the advisor’s investment firm or with which they are otherwise
economically linked. In all cases, the advice provided must be market-oriented;
Disclosure of manufacturer affiliation: If affiliated with a product manufacturer,
financial advisors must disclose that affiliation to their clients;
282
When neither the recommended financial instrument nor a comparable suitable one is available free of
commission, the fee-based investment advisor can make the recommendation and any commissions received must
be passed on to the client in full immediately after they are received.

160
Functionality and organizational separation: Financial institutions providing fee-based
investment advice must segregate fee-only advisors from conventional advisors to help
ensure that fee-based investment advice is not influenced by commissions-based
investment advice. In addition, firms are preventing from setting sales targets for their
fee-only advisors that may conflict with the interests of clients.
To promote and ensure access to the new legally protected “fee-based advisors”, BaFin created a
publicly available registry of certified fee-only advisors for German investors to consult.
iii. Impacts
The specific impacts of the reforms are unknown at this time.
9. Sweden – Proposal to ban commissions in the financial industry
On February 3, 2016, Finansinspektionen, the Swedish financial supervisory authority (FI),
published a report on its investigations and research on how to improve the Swedish savings
market.283
FI witnessed problems on the savings market that are due to the conflicts of interests
that arise when advisors and intermediaries receive payments from the product provider in the
form of commissions. FI notes that the size of these commissions varies a significantly
depending on the product and the firm, which gives rise to a conflict of interest that is very
difficult to manage. Their investigations showed that funds that are sold through advisors have
higher fees than those sold through, for example, fund trading platforms. FI states that the current
rules regarding the management of conflicts of interest as well as the self-regulation initiatives of
the financial advisory industry were insufficient to tackle the identified issues and proposed to
impose a ban on all types of commissions.
i. Scope of the proposal
FI proposed to ban all commissions for investment advice, portfolio management, as well as for
life insurance with an investment component, as a necessary step towards a better functioning
savings market even if such a ban would not solve all the problems facing Swedish savers.
ii. Overview of the proposal
The Swedish authority stated its reasons behind its proposal and tackled the concerns voiced
about a ban of commissions and its possible consequences. Some of its conclusions are as
follows:
Market failure: Consumers in the savings market are at an information disadvantage in
relation to the firms that offer financial services and products. They are unable to judge
the quality or price of products and services which prevents them from influencing the
market. Financial advice today exacerbates consumers’ information disadvantage because
283
Finansinpektionen – A Necessary Step for a Better Savings Market, February 3 2016,
http://www.fi.se/upload/90_English/20_Publications/10_Reports/2016/battre_sparandemarknad_engNY.pdf
161
it is influenced by the size of commissions paid by producers instead of the needs of the
consumer.
Harming competition: There are concerns that a commission ban could harm
competition in the advisory market by favouring large banks. On the contrary, FI finds
that a ban would be a necessary step to improve competition by forcing independent
advisors to offer truly independent advice and to challenge the banks’ dominance on the
advisory market.
Major industry adjustments: A commission ban would entail major adjustments and
transition costs for the Swedish financial industry. With transparent pricing, firms
providing financial advice will need to demonstrate what value they are adding whereas
product providers that pay high commissions to get their products onto the market will
instead have to compete on pricing and quality. FI believes this will lead to simplified
advisory services and an increased range of lower-fee products and argues that the gains
from a better functioning savings market will outweigh the transition costs on the long
term.
Advice gap: With respect to concerns that a commission ban would potentially cause
firms to no longer offer advice and result in a shortage in the supply of advisory services
to consumers with modest assets, FI finds no empirical proof that this would be the case.
FI also notes that to argue against a ban on commissions on the basis that consumers
won’t be willing to pay a price which they have always been paying, but which is now
clearly visible, is not a good argument. In FI’s view, clear pricing creates possibilities for
consumers to influence the supply of advisory services. If advice, as it looks today, is
perceived to be expensive in relation to the value it provides, there is an opportunity for
other types of advisory services to emerge – services that are more cost-efficient and
adapted to consumers’ willingness to pay. Accordingly, FI finds that transparent pricing
for advice can lead to simplified advisory services that are more adapted to consumers’
needs.
On May 24, 2016, Sweden’s minister of Financial and Consumer Affairs communicated that the
government will be proposing legislation in response to the EU directives such as MiFID II and
the Insurance Distribution Directive, but that the government would not introduce a general ban
on third party remuneration or commissions at this stage.284
284
Jonathan Boyd, “Swedish government proposes not to ban commission-led sales”, Investment Europe, (May 24,
2016), http://www.investmenteurope.net/regions/swedendenmarkfinlandnorway/swedish-government-proposes-not-
ban-commission-led-sales/

162

163
APPENDIX D
SUMMARY OF CONSULTATION QUESTIONS
Part 2
1. Do you agree with the issues described in this Part? Why or why not?
2. Are there other significant issues or harms related to embedded commissions? Please
provide data to support your argument where possible.
3. Are there significant benefits to embedded commissions such as access to advice, efficiency
and cost effectiveness of business models, and heightened competition that may outweigh the
issues or harms of embedded commissions in some or all circumstances? Please provide data
to support your argument where possible.
Part 3
4. For each of the following investment products, whether sold under a prospectus or in the
exempt market under a prospectus exemption:
mutual fund
non-redeemable investment fund
structured note
should the product be subject to the discontinuation of embedded commissions? If not:
a. What would be the policy rationale for excluding it?
b. What would be the risk of regulatory arbitrage occurring in the exempt market if
embedded commissions were discontinued for the product only when sold under
prospectus?
5. Are there specific types of mutual funds, non-redeemable investment funds or structured
notes that should not be subject to the discontinuation of embedded commissions? Why?
6. Are there other types of investment products that should be subject to the discontinuation of
embedded commissions? Why?
7. Do you agree with the discontinuation of all payments made by persons or companies other
than the investor in connection with the purchase or continued ownership of an investment
fund security or structured note? Why or why not?
8. Are there other fees or payments that we should consider discontinuing in connection with
the purchase or continued ownership of an investment fund security or structured note,
including:
a. the payment of money and the provision of non-monetary benefits by investment fund
managers to dealers and representatives in connection with marketing and educational
practices under Part 5 of NI 81-105;

164
b. referral fees; and
c. underwriting commissions
Why? What is the risk and magnitude of regulatory arbitrage through these types of fees and
commissions?
9. If payments and non-monetary benefits to dealers and representatives for marketing and
educational practices under Part 5 of NI 81-105 are maintained further to the discontinuation
of embedded commissions, should we change the scope of those payments and benefits in
any way? If so, why?
10. With respect to internal transfer payments:
a. How effective is NI 81-105 in regulating payments within integrated financial service
providers such that there is a level playing field for proprietary funds and third party
funds?
b. Should internal transfer payments to dealers within integrated financial service
providers that are tied to an investor’s purchase or continued ownership of an
investment fund security or structured note be discontinued? Why or why not? To
what extent do integrated financial service providers directly or indirectly provide
internal transfer payments to their affiliated dealers and their representatives to incent
the distribution of their products?
c. Are there types of internal transfer payments that are not tied to an investor’s
purchase or continued ownership of an investment fund security or structured note
that should be discontinued?
11. If we were to discontinue embedded commissions, please comment on whether we should
allow investment fund managers or structured note issuers to facilitate investors’ payment of
dealer compensation by collecting it from the investor’s investment and remitting it to the
dealer on the investor’s behalf.
Part 4
Addressing the issues
12. Based on a consideration of the data and evidence provided in this Part, would a proposal to
discontinue embedded commissions address the three key investor protection and market
efficiency issues discussed in Part 2?
13. Are there other ways in which the CSA could address these issues that could be introduced in
conjunction with, or separate from, the discontinuation of embedded commissions?
14. Are there other conflicts of interest that could emerge following a transition to direct pay
arrangements that would not be addressed in the current securities regulation framework?

165
Change in investor experience and outcomes
15. What effect do you think the removal of embedded commissions will have on investor
experience and outcomes? In particular:
Will investors receive advice and financial services that are more aligned with the
fees they pay?
What effect will the proposal have on the growth of automated advice? Is this likely
to be beneficial to investors?
Is discretionary advice likely to increase in Canada as we have seen in the other
markets that have transitioned away from embedded commissions and, if so, would
this shift be positive or negative for investors?
What effect will the proposal have on the growth of the online/discount brokerage
channel and cost of fund products offered in this channel? Is this likely to be
beneficial to investors?
What effect will the proposal have on the cost and scope of advice provided to
specific investor segments?
16. What types of payment arrangements are likely to result if this proposal is adopted? In
particular:
Would the payment arrangements offered by dealers to investors differ based on
investor segment? If so, how and why?
17. Do you think this proposal will lead to an advice gap? In particular:
Which segments of the market are likely to be affected? Please consider
segmentation by wealth, geography (size and location of community e.g. remote,
small, medium, large), age, technological sophistication, the level of fund ownership
across households, etc.
Do you agree with our definition of an advice gap?
Should we differentiate between an advice gap for face-to-face advice and an advice
gap generally?
What types of advice or services currently provided today would be most affected by
the proposal?
Are there any potential interactions between this proposal, existing reforms such as
CRM2 and other potential reforms such as CSA CP 33-404 that may affect the size of
any potential advice gap?
How could a potential advice gap, face-to-face advice gap or financial service gap be
mitigated?
Do you think that online advice could mitigate an advice gap? If so, how?
Do you think that the significant market share of deposit-taker owned and insurer-
owned dealers in fund distribution in Canada will affect the size or likelihood of an
advice gap to develop?

166
Industry change independent of regulatory response to discontinue embedded commissions
18. Given some of the changes we have seen in the industry over the past few years (fee
reductions, introduction of DIY series, streamlining of fund series, automatic fee reductions
increasing access to fee-based options etc.), what is the likelihood that the fund industry will
transition away from embedded commissions without regulatory action? In particular:
Will the industry continue to transition away from embedded commissions if the CSA
does not move forward with the proposal?
19. How accurate is Figure 8 regarding the purchase options available to fund investors by
channel, account size and firm type? In particular:
Do you see payment options and business models evolving at present?
How are they likely to change over time if the CSA were to choose not to move
forward with the proposal?
20. We note that the distribution of fee-based series is still relatively limited in Canada versus
other markets. Are there obstacles (structural, operational, regulatory, investor demand, etc.)
specific to Canada limiting the use of fee-based series by dealers?
Potential impact on competition and market structure
21. Please describe how discontinuing embedded commissions will affect competition and
market structure and whether you agree with the analysis set out in Part 4? In particular:
Do you think the proposal will have an impact on the level of industry consolidation
or integration? What about with respect to the concentration of mass-market investor
assets held in investment products managed by deposit-taker owned firms?
What are the likely impacts on investor outcomes and market efficiency of any
potential consolidation?
What opportunities and what challenges do you think the proposal would introduce
for specific industry stakeholder groups?
o Independent dealers?
o Independent fund manufacturers?
o Integrated financial service providers?
o Mutual fund dealers?
o IIROC dealers?
o Online/discount brokers?
What is the likelihood and magnitude of regulatory arbitrage across similar financial
products such as segregated funds and deposit-taker products?
What would be the impact on dually-licensed mutual fund dealers and insurance
agents?
Will the proposal lead new, lower-cost entrants to the market? Why and how?

167
Does the interaction between this proposal and the proposals set out in CSA CP 33-
404 change your responses to the questions above and, if so, how?
Will a transition away from embedded commissions reduce fund series and fee
complexity, as we have contemplated?
Do integrated financial service providers have an advantage in terms of their ability to
cross-sell and cross-subsidize across business lines? If so, how?
What are the potential effects on competition of the rise in online advice? Are these
effects likely to be large and positive?
22. What impact will the proposal have on back office service processes at the investment fund
manager or at the fund dealer? In particular:
Is there any specific operational or technological impact that we should take into
consideration?
23. The payment of embedded commissions requires the dealer and the investment fund manager
to implement controls and oversight (with associated compliance costs) in order to mitigate
the inherent conflicts of interest today.
Would the transition to direct pay arrangements alleviate the need for some of these
controls and oversight?
To what extent, if any, does the use of direct pay arrangements by representatives
today (e.g. when a representative provides services under a fee-based arrangement)
alleviate the need for some of these controls and oversight?
24. Embedded commissions, especially trailing commissions, provide a steady source of revenue
for dealers and their representatives. If embedded commissions were discontinued, would
dealers be able to compensate for the loss of this revenue with direct pay arrangements?
25. Aside from commission grids and salaries, what other approaches to representative
compensation might dealers use if we were to discontinue embedded commissions? How are
these approaches likely to change over time?
26. What impact will the proposal have on representatives in the industry? In particular, what
impact will the proposal have on the:
career path;
attractiveness of the job;
typical profile of individuals attracted to the career;
recruitment; and
relative attractiveness of careers in competing financial service business lines?
Part 5
27. How practicable are the mitigation measures discussed and how effective would these
measures be at assuring:
access to advice for investors,

168
choice of payment arrangements for all investor segments, and
a level playing field amongst competing investment products?
28. What other measures should the CSA consider to mitigate the above unintended
consequences?
29. Other than the potential impacts we have identified in Part 4, what other potential unintended
consequences, including operational impacts and tax consequences, may arise for fund
industry stakeholders and investors further to the discontinuation of embedded commissions?
In particular:
Would there be a negative tax impact to investors associated with their payment of
dealer compensation under direct pay arrangements? In particular, would the
investor’s payment of dealer compensation through periodic fund redemptions
facilitated by the investment fund manager attract tax consequences? Please explain.
To the extent a transition to direct pay arrangements results in the rationalization of
fund series, could this rationalization attract negative tax consequences for investors?
What, if any, measures, regulatory or otherwise, could assist in mitigating potential
operational and tax impacts?
30. With respect to the loss of a form of cross-subsidy from high net worth investors to lower-
wealth investors in a fund further to a transition to direct pay arrangements,
to what extent (please quantify where possible) would the loss of this cross-subsidy
increase the cost of providing advice and services to lower-wealth fund investors
under direct pay arrangements?;
does the existence of this form of cross-subsidy suggest that high net worth fund
investors may be indirectly paying fees that are not aligned with the services they are
receiving (i.e. do the fees they pay exceed the actual cost of the services and advice
they receive?); and
what measures may mitigate the potential effects on dealers, representatives and
investors from the loss of the cross-subsidy?
31. What measures could fund industry participants proactively take to mitigate the unintended
consequences that may stem from the discontinuation of embedded commissions?
32. For each transition option, please tell us how your business (investment fund manager or
dealer) would have to operationally change or restructure in terms of systems and processes
and the related cost implications. Where possible, please provide data on the estimated costs.
Are there unique costs or challenges to specific businesses?
What transition period would be appropriate?

169
Should existing redemption schedules for DSC and low-load purchase options be
maintained until the redemption schedule is completed, or discontinued at the
Transition Date?
33. Which transition option would you prefer? Why? Are there alternative transition options
that we should consider?
34. As discussed in Appendix B, the CSA did not retain the option of capping embedded
commissions, either as a stand-alone solution to the key issues discussed in Part 2 or as an
interim step toward an eventual discontinuation of embedded commissions. Should the CSA
further consider using a fee cap as a transition measure? Why?
Part 6
35. Please explain whether you think each of the initiatives discussed above will, either alone or
in combination:
address the three investor protection and market efficiency issues and their sub-issues
identified in Part 2; and
address or not address any additional harms or issues that you have identified.
36. Are there alternative options or measures, whether regulatory or market-led, that could
successfully address the three investor protection and market efficiency issues and their sub-
issues identified in Part 2. If so, please explain.