Embed Size (px)
Citation preview

IEEE TRANSACTIONS ON INDUSTRY APPLICATIONS, VOL. 49, NO. 6, NOVEMBER/DECEMBER 2013 2741
Optimum Sizing and Placement of Distributed andRenewable Energy Sources in Electric Power
Distribution SystemsBenjamin Kroposki, Senior Member, IEEE, Pankaj K. Sen, Fellow, IEEE, and
Keith Malmedal, Senior Member, IEEE
Abstract—Concerns with climate change, requirements for therenewable portfolio standards, government incentives, and lower-ing cost of renewable and distributed energy resources (DERs)are some of the driving forces for the steeper growth in DERinstallations. DERs are commonly connected near the load inelectric power distribution systems and include renewable energysources such as wind and solar, fossil-fuel-based generation suchas microturbines, and other distributed energy storage elements.A novel methodology is developed in this paper that optimizesthe sizing and placement of DER on electrical distribution feedersbased on both technical and economic considerations and testedon the IEEE 34-bus system.
Index Terms—Distributed energy resources (DERs), distributedgeneration, distribution system, optimization, storage.
I. INTRODUCTION
TODAY’S electric system is expected to bring high-qualityand reliable power to customer loads. More than a century
of development has led to a large interconnected system thatbrings power from central-station generators via transmissionand distribution to end-use customers. Although this systemcan provide relatively inexpensive power, issues remain suchas increasing fuel costs, reducing power plant emissions, andincreasing customer needs for higher reliability power. Onepotential solution to these issues is the use of distributed andrenewable energy sources at the distribution level.
Distributed energy resources (DERs) are sources of electricpower that are not commonly connected to a bulk power
Manuscript received June 1, 2009; accepted December 2, 2009. Date ofpublication May 13, 2013; date of current version November 18, 2013. Paper2009-ESC-107, presented at the 2009 Industry Applications Society AnnualMeeting, Houston, TX, USA, October 4–8, and approved for publication inthe IEEE TRANSACTIONS ON INDUSTRY APPLICATIONS by the EnergySystems Committee of the IEEE Industry Applications Society. This work wassupported in part by the (previously National Science Foundation) IndustryUniversity Cooperative Research Center and in part by the Power SystemsEngineering Research Center (PSerc.org) site at Colorado School of Mines,Golden, CO.
B. Kroposki is with the Distributed Energy Systems Integration Group,National Renewable Energy Laboratory, Golden, CO 80401 USA (e-mail:[email protected]).
P. K. Sen is with the Power Systems Engineering Research Center (PSerc),Colorado School of Mines, Golden, CO 80401 USA (e-mail: [email protected]).
K. Malmedal is with NEI Electric Power Engineering, Inc., Arvada, CO80001 USA, and also with the University of Colorado at Denver, Denver, CO80217 USA (e-mail: [email protected]).
Color versions of one or more of the figures in this paper are available onlineat http://ieeexplore.ieee.org.
Digital Object Identifier 10.1109/TIA.2013.2262661
transmission system but are instead interconnected near theload in the electric power distribution system. Typically, theindividual DER unit ratings are less than 10 MVA and includeboth fossil fuel and renewable generations, as well as energystorage technologies. Because DERs are sited at customer loadlocations, if applied properly, they can be more efficient thancentral-station generators because no transmission and distri-bution system losses occur.
The wide variety of DER, however, causes complexity wheninstalled and operated in electrical distribution systems. Tra-ditional radial distribution systems are not designed for two-way power flow. Adding additional sources into distributionsystems can affect important aspects of system performancesuch as operations, protection, and system costs. Currently,no industry standard exists to determine the amount and thecorresponding location of DER that can be installed on a feederwithout causing adverse effects.
In this paper, a novel two-part methodology was developedthat ranks utility feeders for the best candidates for DERsystems and then optimizes the placement and sizing of DER onelectrical distribution feeders based on technical and economicconsiderations. The full methodology quantifies the factors thatinfluence the performance and costs of the electrical distribu-tion system and the characteristics of the DER. This paper willbe specifically useful to electric power utilities and end-usecustomers wanting to site DER systems.
This paper, a sequel to paper [16], describes an analyticalmethodology to evaluate candidate feeders for implement-ing DER based on peak-load reduction, capacity improve-ment, load-generation correlation, and expected feeder loadgrowth.
II. BACKGROUND
Past researchers [1]–[5] have described numerous potentialbenefits of DER for the local utility and the customer. Theactual benefits of DER systems, however, vary based on site-specific resources for renewables, DER penetration level, dis-tribution system characteristics, load density, reliability, andpower quality. The benefits of variable nondispatchable sourcesare also influenced by whether there is any energy storagecapacity. Traditionally, the major benefits of DER to customersand utilities are energy production and capacity displacement,but there are additional nontraditional benefits.
0093-9994 © 2013 IEEE

2742 IEEE TRANSACTIONS ON INDUSTRY APPLICATIONS, VOL. 49, NO. 6, NOVEMBER/DECEMBER 2013
A number of recent references examine the technical eco-nomics of integrating DER into the electric power systemand methodologies to determine the benefits of these systems.El-Kattam et al. [6] proposed a new integrated model forsolving the distribution planning problem of load growth byimplementing DER as an attractive option in a distribution util-ity’s territory. Borges and Falcao [7] presented a methodologyfor optimal DER allocation and sizing in distribution systems tominimize electrical losses and guarantee reliability and voltageprofiles. Payyala and Green [8], [9] presented a technoeco-nomic feasibility assessment for distributed biomass plantsthat addresses DER optimization with economic and technicalconsiderations. Le et al. [10] provided a new methodology tooptimize the capacity and location of DER based on the levelof power loss reduction. Kuri et al. [11] presented a methodusing genetic algorithms that helps determine the optimal ratingand placement of DER.
This paper focused on optimizing size and locations andthe use of DER in the electric power distribution system. Inthe first paper [16], a methodology was developed that ranksutility feeders for the best candidates for DER systems. Thispaper addresses the size optimization and proper placement ofDER on distribution feeders based on technical and economicconsiderations. Once the utility has determined which feedersin its service territory are good candidates for implementingDER, a more detailed analysis must be conducted to identifyits optimal DER location and penetration level. Once the maxi-mum of DER for a feeder is established, an economic analysisdetermines a value equal to the benefits minus the costs forvarious DER scenarios.
To conduct the analysis and optimization, a variety of in-formation about the distribution feeder and DER is necessary.These data requirements are listed below.
Electrical System Data
• circuit configuration;• system voltages;• voltage limits (i.e., ANSI C84.1);• line conductor type and impedance values;• transformer configuration, capacity, winding connec-
tions, and impedance;• available fault current at substation transformer;• existing voltage regulation equipment [e.g., capaci-
tors, load tap changers, and voltage regulators (VRs)];• system protection equipment (e.g., fuses, breakers,
and reclosers) and settings;• feeder and customer load data (quantify hourly, daily,
and seasonal variability and uncertainty).
DER Data
• type (i.e., synchronous induction machines orinverter-based design), rating, characteristics, and set-tings, including ability to regulate voltage and reactivepower requirements;
• DER operational modes (e.g., dispatchable,nondispatchable, base-load, peak-shaving, backup, orcogeneration);
• IEEE Std. 1547 or utility interconnection requirements;
• potential locations on feeder;• for renewable DER systems, resource data (quan-
tify hourly, daily, and seasonal variability anduncertainty).
When a DER is modeled in terms of operations withthe electric power system, the actual device that inter-connects the DER with the utility is the most importantconcern. The interconnection system consists of the hard-ware and software that make up the physical link betweenthe DER and the utility. The interconnection system isthe means by which the DER electrically connects to theoutside electric power system, and it can also providemonitoring, control, metering, and dispatch of the DER.For all DER, there are only three ways that these devicesconnect to the utility: through a synchronous generator, aninduction generator, or a power electronics interface.
Synchronous generators are used when power produc-tion from the prime mover is relatively constant (e.g., forinternal combustion engines). Induction generators, on theother hand, are well suited for rotating systems, in whichprime mover power is not constant (e.g., wind turbines andsmall hydroelectric turbines). They can be also used withengines and combustion turbines.
Power electronic systems typically connect via invert-ers that convert dc power to grid-compatible ac power viaswitches as opposed to rotating induction or synchronousmachines. Inverters are based on three fundamental tech-nology areas, namely, power semiconductor devices, mi-croprocessor or digital signal processor technologies, andcontrol and communications algorithms. Generally, invert-ers are used with prime movers that provide dc electricity[such as photovoltaic (PV) or fuel cell units] and withmicroturbines, which are small, high-speed, and rotatingcombustion turbines directly coupled to a synchronous-type electric generator.
To effectively simulate the performance of all types ofDER, models must be developed for each type of intercon-nection technology. Both steady-state and transient modelsmust be developed for all types of interconnection systems.The steady-state models are used in power flow analysis,and the transient models are used in abnormal conditionmodeling such as short-circuit and stability analyses. Inthis paper, the models for the DER and the electric powersystem were simulated using the Distribution EngineeringWorkstation (DEW) software [12].
DEW was used to conduct conductor ampacity, powerflow, and short-circuit studies of system configurations.DEW has a variety of specialty applications that are usefulfor evaluating the effect of DER on a distribution system.For example, the multiphase power flow application cal-culates voltages and currents for all user-selected circuitsat a selected time point. DEW conducts true single-phaseanalysis of circuits as opposed to balanced three-phaseanalysis. This is extremely important for the evaluationof distribution circuits because most have single-phaseloads and some unbalance in the system. In all DEWcalculations, the voltage-dependent load model was used

KROPOSKI et al.: OPTIMUM SIZING AND PLACEMENT OF ENERGY SOURCES IN POWER DISTRIBUTION SYSTEMS 2743
Fig. 1. DER optimization flow diagram.
because it generates a more detailed analysis of realisticfield conditions (e.g., by evaluating the effects of voltagereduction on load).
To determine annual system costs, HOMER was used[13]. HOMER is a micropower optimization model de-veloped by the National Renewable Energy Laboratory to
assist in the design of micropower systems and facilitatethe comparison of various types of DER. To use HOMER,the user provides inputs that describe technology options,component costs, and resource availability. HOMER usesthese inputs to simulate different system configurations,or combinations of components, and generates results that
2744 IEEE TRANSACTIONS ON INDUSTRY APPLICATIONS, VOL. 49, NO. 6, NOVEMBER/DECEMBER 2013
one can view as a list of feasible configurations sorted bynet present cost.
III. DER PLACEMENT AND SIZE OPTIMIZATION
To optimize the DER applications in a power distributionsystem, a unified technoeconomic approach is created intoa single optimization routine. This methodology assesses theeffects and optimizes the capacity and location of DER on adistribution feeder and determines the maximum penetrationlevel for DER installations that will not cause changes tothe feeder. The optimization methodology consists of severalsteps that narrow down the possible capacities of the DER andlocations on the distribution system using technical constraints.The goal of the optimization methodology is to find the singlepoint (size and location) of DER operation that provides thelowest annual cost.
Fig. 1 is a simplified flow diagram of the optimizationmethodology. Software programs can help speed calculationsduring certain parts of the process. The blue boxes show whereeither DEW or HOMER was used for some calculations.
The step-by-step procedure for the optimization methodol-ogy is given below.Step 1: System and DER information
• Collect system and DER information.• Determine the possible capacities and the specific
locations on the feeder where the DER can be placed.Step 2: Power flow study at minimum and maximum loads
• Run a power flow for the distribution circuit un-der maximum and minimum load conditions withoutDER.
• Follow these technical constraints:• Pxfmr < Prated;• Iconductor < Irated;• Idevice < Irated;• Vrating-min < VDER < Vrating-max.
• Determine the conductor ampacity rating (lookup ta-ble or calculation).
• Determine other equipment’s ampacity rating.• Starting at the maximum DER level, put DER at
each possible location n, and run the power flow atminimum and maximum load conditions.
• Determine the maximum and minimum voltages andcurrents for each DER capacity and location.
• Determine the maximum DER capacity at each loca-tion based on voltage and current limits for currentlyinstalled conductors and equipment.
Step 3: Short-circuit study• Starting with the new maximum DER level at each
bus, run short-circuit studies at both full- and no-loadconditions.
• Check to see if ratings are exceeded or if coordinationneeds to be changed.
• If protective device ratings are exceeded or if coordi-nation needs to be changed, then reduce DER-1 andrerun Step 3.
• Identify the new maximum DER level M at each bus.
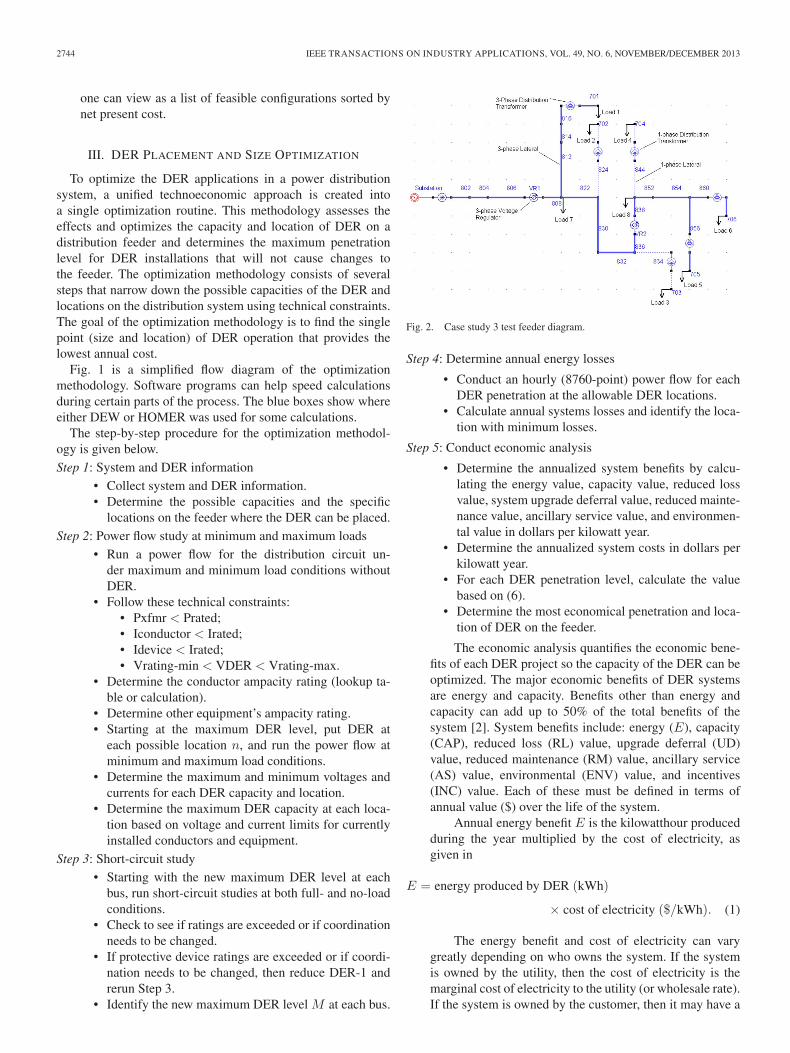
Fig. 2. Case study 3 test feeder diagram.
Step 4: Determine annual energy losses
• Conduct an hourly (8760-point) power flow for eachDER penetration at the allowable DER locations.
• Calculate annual systems losses and identify the loca-tion with minimum losses.
Step 5: Conduct economic analysis
• Determine the annualized system benefits by calcu-lating the energy value, capacity value, reduced lossvalue, system upgrade deferral value, reduced mainte-nance value, ancillary service value, and environmen-tal value in dollars per kilowatt year.
• Determine the annualized system costs in dollars perkilowatt year.
• For each DER penetration level, calculate the valuebased on (6).
• Determine the most economical penetration and loca-tion of DER on the feeder.
The economic analysis quantifies the economic bene-fits of each DER project so the capacity of the DER can beoptimized. The major economic benefits of DER systemsare energy and capacity. Benefits other than energy andcapacity can add up to 50% of the total benefits of thesystem [2]. System benefits include: energy (E), capacity(CAP), reduced loss (RL) value, upgrade deferral (UD)value, reduced maintenance (RM) value, ancillary service(AS) value, environmental (ENV) value, and incentives(INC) value. Each of these must be defined in terms ofannual value ($) over the life of the system.
Annual energy benefit E is the kilowatthour producedduring the year multiplied by the cost of electricity, asgiven in
E = energy produced by DER (kWh)
× cost of electricity ($/kWh). (1)
The energy benefit and cost of electricity can varygreatly depending on who owns the system. If the systemis owned by the utility, then the cost of electricity is themarginal cost of electricity to the utility (or wholesale rate).If the system is owned by the customer, then it may have a

KROPOSKI et al.: OPTIMUM SIZING AND PLACEMENT OF ENERGY SOURCES IN POWER DISTRIBUTION SYSTEMS 2745
TABLE IINFORMATION ABOUT EACH OF THE COMPONENTS OF THE FEEDER
net-metered system for which the cost of electricity is theretail rate.
Capacity value can be calculated using the effectiveload carrying capability (ELCC) method. To determine theELCC for a nondispatchable DER, the following processdescribed in [14] was used. Once the ELCC for the systemis determined, the capacity benefit is calculated by multi-plying the ELCC by the value of the capacity using
CAP = ELCC (kW)× value of capacity ($/kW). (2)
The other economic values can be determined throughan in-depth analysis of the local utility and feeder situation.DER avoids electrical system losses in two ways. First, theenergy provided by a DER to a load is not transmittedthrough the electric power system. Therefore, the DERsaves the transmission losses that would be accrued by theload. This benefit can be determined by the cost of trans-mitting the electricity to the load. Second, by providing realpower at the load location, a DER provides a reduction inloss on the specific feeder. This reduction in losses can bepriced at the cost of electricity to the load. The total benefitsof reduced losses are calculated using
RL =DER energy (kWh)
× cost of electricity transmission ($/kWh)
+ (feeder losses without DER
− feeder losses with DER)
× cost of electricity ($/kWh). (3)
Four of the possible system benefits are not used in thispaper because they are difficult to quantify for general use
or are utility/location specific. The upgrade deferral valueis location specific and depends on the growth plans of theutility. The upgrade deferral value is available only if theutility is planning an upgrade of the system (transformer orconductors) in the near future and there is a possibility todefer spending capital funding on such an upgrade. The re-duced maintenance value is used only if information aboutthe value of maintenance is obtainable from the utility.Ancillary service value is available only if the DER hasthe ability to provide ancillary services such as spinningreserve or reactive power. Allowing the DER to provideancillary services can increase power quality and allowthe utility to avoid installation of capacitors. In the casestudies conducted in this paper, the DER is typically smallcompared with overall utility needs. Therefore, this value isalso ignored in the case studies. The environmental value isthe value that a DER has in reducing greenhouse gasses orpollutants. This value is typically difficult to determine andapply to distribution system analysis. This is often com-puted by calculating the kilowatthours of energy producedby the system and comparing that with the emissions fromthe current mix of utility generation.
The incentive value is the annualized value of anyincentives offered. The federal government and severalstates offer incentives to install and use distributed andrenewable energy systems. Typically, this value is basedon a dollar amount per installed watt of the system or inthe form of a tax deduction.
The total annualized system benefit, which is the sumof all benefits on an annual basis, is then calculated using
annualized system benefit = E + CAP + RL + UD + RM
+AS + ENV + INC. (4)

2746 IEEE TRANSACTIONS ON INDUSTRY APPLICATIONS, VOL. 49, NO. 6, NOVEMBER/DECEMBER 2013
TABLE IIFEEDER CONDUCTOR INFORMATION
The total annualized cost for the DER system is thencalculated. This is the sum of the annualized costs of allsystem components, plus the other annualized costs.
The annualized cost of a component is equal to itsannual operating cost plus its capital and replacement costsannualized over the project lifetime. The annualized costof each component (annualized) is equal to the sum of its:capital cost Cacap, replacement cost Carep, O&M cost, andfuel cost (if applicable), as shown in
annualized system cost = Cacap + Carep + CO&M + CFuel.(5)
Once the annualized system benefits and costs havebeen determined, the total system value can be determinedusing (6) based on DER penetration and location. The
optimal penetration and location is the system with thehighest system value
system value = annualized system benefit
−annualized system cost. (6)
IV. CASE STUDY: IEEE 34-BUS
Once a utility has determined which feeders are optimalfor DER, a more detailed analysis must be conducted. Thissection focuses on validating the optimization methodology thatdetermines the amount and placement of DER on a modifiedIEEE 34-bus test feeder. This test feeder is based on theIEEE 34-bus test feeder [15]. The IEEE 34-bus test feederis a publicly available feeder with full descriptions of system

KROPOSKI et al.: OPTIMUM SIZING AND PLACEMENT OF ENERGY SOURCES IN POWER DISTRIBUTION SYSTEMS 2747
Fig. 3. Case study 3 voltage profile under full-load conditions.
Fig. 4. Case study 3 voltage profile under no-load conditions.
components. The feeder was developed by the IEEE PowerEngineering Society Distribution System Analysis Subcommit-tee so that people would have a common feeder for use inevaluating analysis techniques. Although based on the IEEE34-bus feeder, this test bus has some significant differences, asexplained in the next section.
Fig. 2 is the one-line diagram of the 34-bus test feeder. Thefeeder is a nominal 13.2-kV feeder with two VRs at locationsVR1 and VR2. The major differences between this 34-bus testfeeder and the IEEE 34-bus test feeder are that this feederis designed at 13.2 kV instead of 24.9 kV and secondary
distribution transformers are added at the load sites. The loadshave been also placed only at the specific sites labeled Load 1through Load 8 in the figure. The total load on this feeder is4000 kVA at 0.9 PF. This feeder contains a mix of three- andsingle-phase lines, and loads spread along a main feeder withsix laterals. The single-phase laterals are represented by dashedlines in the figure.
Table I provides information about each of the componentsof the feeder. This feeder is a long rural distribution circuit witha total circuit length of 155 200 ft. The longest section fromthe substation is approximately 30 mi. Table II provides the
2748 IEEE TRANSACTIONS ON INDUSTRY APPLICATIONS, VOL. 49, NO. 6, NOVEMBER/DECEMBER 2013
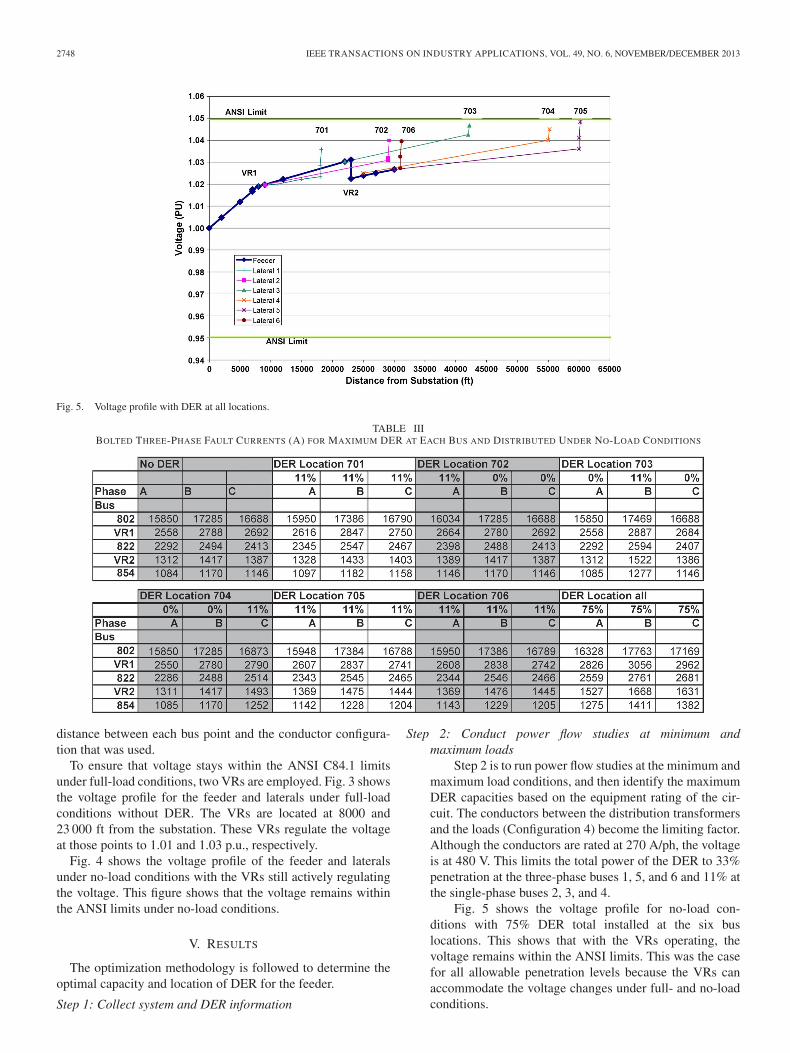
Fig. 5. Voltage profile with DER at all locations.
TABLE IIIBOLTED THREE-PHASE FAULT CURRENTS (A) FOR MAXIMUM DER AT EACH BUS AND DISTRIBUTED UNDER NO-LOAD CONDITIONS
distance between each bus point and the conductor configura-tion that was used.
To ensure that voltage stays within the ANSI C84.1 limitsunder full-load conditions, two VRs are employed. Fig. 3 showsthe voltage profile for the feeder and laterals under full-loadconditions without DER. The VRs are located at 8000 and23 000 ft from the substation. These VRs regulate the voltageat those points to 1.01 and 1.03 p.u., respectively.
Fig. 4 shows the voltage profile of the feeder and lateralsunder no-load conditions with the VRs still actively regulatingthe voltage. This figure shows that the voltage remains withinthe ANSI limits under no-load conditions.
V. RESULTS
The optimization methodology is followed to determine theoptimal capacity and location of DER for the feeder.
Step 1: Collect system and DER information
Step 2: Conduct power flow studies at minimum andmaximum loads
Step 2 is to run power flow studies at the minimum andmaximum load conditions, and then identify the maximumDER capacities based on the equipment rating of the cir-cuit. The conductors between the distribution transformersand the loads (Configuration 4) become the limiting factor.Although the conductors are rated at 270 A/ph, the voltageis at 480 V. This limits the total power of the DER to 33%penetration at the three-phase buses 1, 5, and 6 and 11% atthe single-phase buses 2, 3, and 4.
Fig. 5 shows the voltage profile for no-load con-ditions with 75% DER total installed at the six buslocations. This shows that with the VRs operating, thevoltage remains within the ANSI limits. This was the casefor all allowable penetration levels because the VRs canaccommodate the voltage changes under full- and no-loadconditions.
KROPOSKI et al.: OPTIMUM SIZING AND PLACEMENT OF ENERGY SOURCES IN POWER DISTRIBUTION SYSTEMS 2749
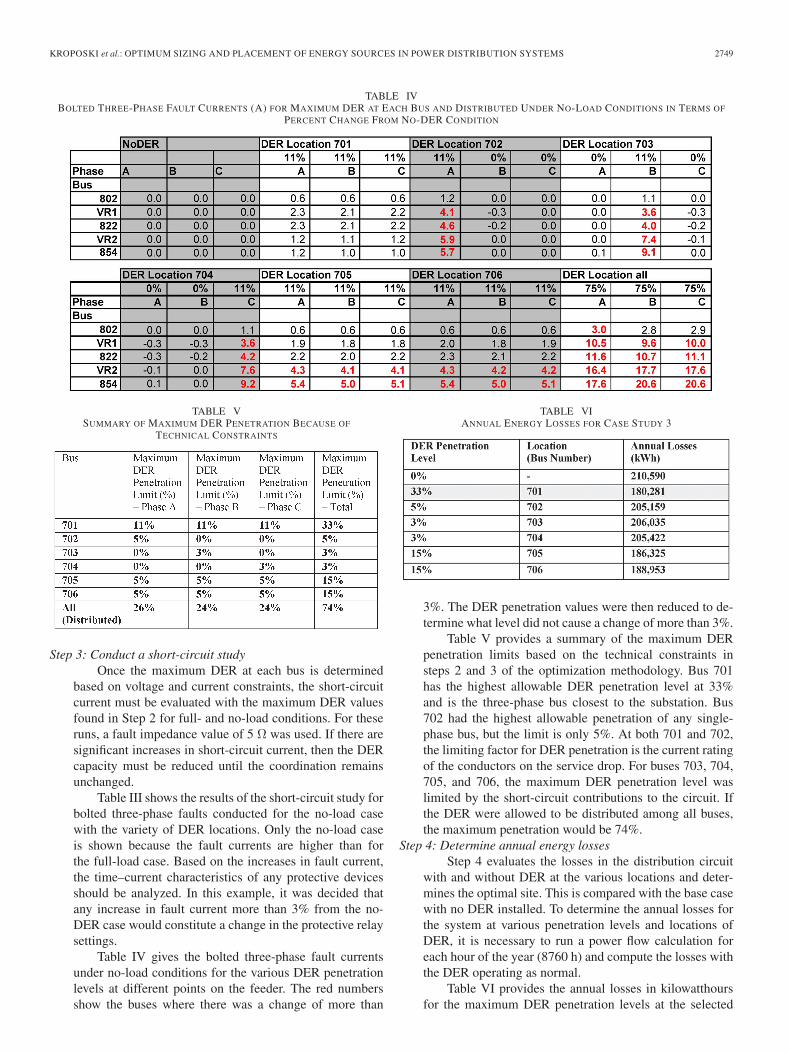
TABLE IVBOLTED THREE-PHASE FAULT CURRENTS (A) FOR MAXIMUM DER AT EACH BUS AND DISTRIBUTED UNDER NO-LOAD CONDITIONS IN TERMS OF
PERCENT CHANGE FROM NO-DER CONDITION
TABLE VSUMMARY OF MAXIMUM DER PENETRATION BECAUSE OF
TECHNICAL CONSTRAINTS
Step 3: Conduct a short-circuit studyOnce the maximum DER at each bus is determined
based on voltage and current constraints, the short-circuitcurrent must be evaluated with the maximum DER valuesfound in Step 2 for full- and no-load conditions. For theseruns, a fault impedance value of 5 Ω was used. If there aresignificant increases in short-circuit current, then the DERcapacity must be reduced until the coordination remainsunchanged.
Table III shows the results of the short-circuit study forbolted three-phase faults conducted for the no-load casewith the variety of DER locations. Only the no-load caseis shown because the fault currents are higher than forthe full-load case. Based on the increases in fault current,the time–current characteristics of any protective devicesshould be analyzed. In this example, it was decided thatany increase in fault current more than 3% from the no-DER case would constitute a change in the protective relaysettings.
Table IV gives the bolted three-phase fault currentsunder no-load conditions for the various DER penetrationlevels at different points on the feeder. The red numbersshow the buses where there was a change of more than
TABLE VIANNUAL ENERGY LOSSES FOR CASE STUDY 3
3%. The DER penetration values were then reduced to de-termine what level did not cause a change of more than 3%.
Table V provides a summary of the maximum DERpenetration limits based on the technical constraints insteps 2 and 3 of the optimization methodology. Bus 701has the highest allowable DER penetration level at 33%and is the three-phase bus closest to the substation. Bus702 had the highest allowable penetration of any single-phase bus, but the limit is only 5%. At both 701 and 702,the limiting factor for DER penetration is the current ratingof the conductors on the service drop. For buses 703, 704,705, and 706, the maximum DER penetration level waslimited by the short-circuit contributions to the circuit. Ifthe DER were allowed to be distributed among all buses,the maximum penetration would be 74%.
Step 4: Determine annual energy lossesStep 4 evaluates the losses in the distribution circuit
with and without DER at the various locations and deter-mines the optimal site. This is compared with the base casewith no DER installed. To determine the annual losses forthe system at various penetration levels and locations ofDER, it is necessary to run a power flow calculation foreach hour of the year (8760 h) and compute the losses withthe DER operating as normal.
Table VI provides the annual losses in kilowatthoursfor the maximum DER penetration levels at the selected
2750 IEEE TRANSACTIONS ON INDUSTRY APPLICATIONS, VOL. 49, NO. 6, NOVEMBER/DECEMBER 2013
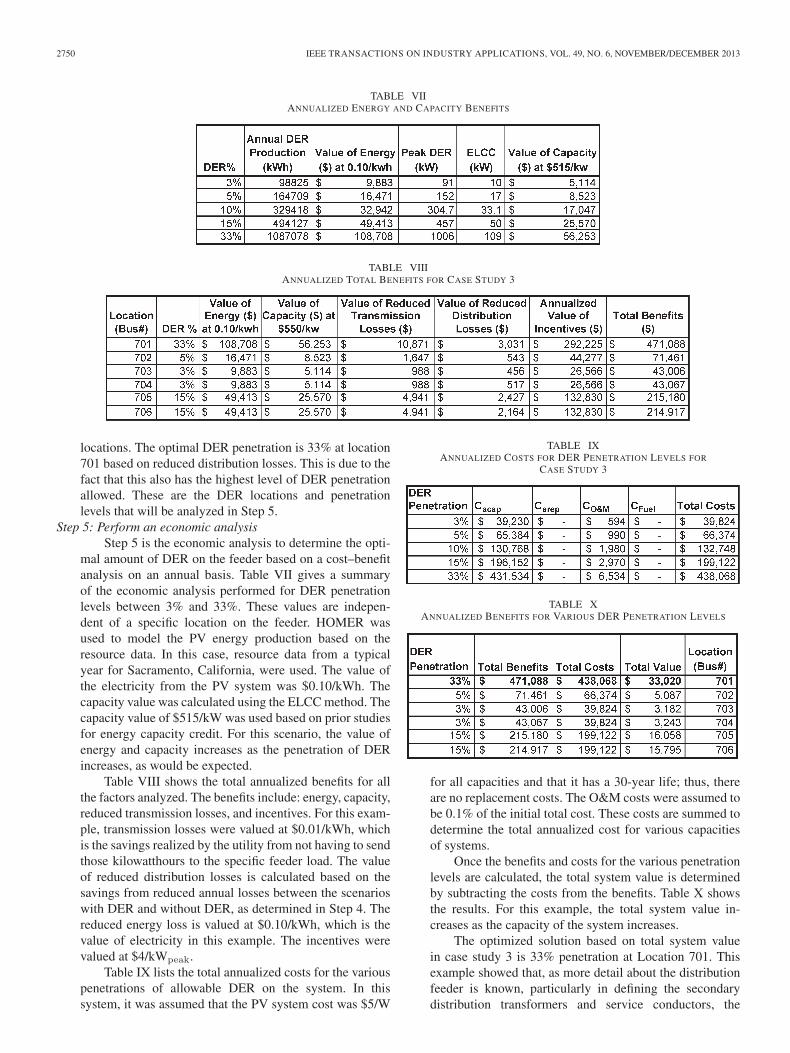
TABLE VIIANNUALIZED ENERGY AND CAPACITY BENEFITS
TABLE VIIIANNUALIZED TOTAL BENEFITS FOR CASE STUDY 3
locations. The optimal DER penetration is 33% at location701 based on reduced distribution losses. This is due to thefact that this also has the highest level of DER penetrationallowed. These are the DER locations and penetrationlevels that will be analyzed in Step 5.
Step 5: Perform an economic analysisStep 5 is the economic analysis to determine the opti-
mal amount of DER on the feeder based on a cost–benefitanalysis on an annual basis. Table VII gives a summaryof the economic analysis performed for DER penetrationlevels between 3% and 33%. These values are indepen-dent of a specific location on the feeder. HOMER wasused to model the PV energy production based on theresource data. In this case, resource data from a typicalyear for Sacramento, California, were used. The value ofthe electricity from the PV system was $0.10/kWh. Thecapacity value was calculated using the ELCC method. Thecapacity value of $515/kW was used based on prior studiesfor energy capacity credit. For this scenario, the value ofenergy and capacity increases as the penetration of DERincreases, as would be expected.
Table VIII shows the total annualized benefits for allthe factors analyzed. The benefits include: energy, capacity,reduced transmission losses, and incentives. For this exam-ple, transmission losses were valued at $0.01/kWh, whichis the savings realized by the utility from not having to sendthose kilowatthours to the specific feeder load. The valueof reduced distribution losses is calculated based on thesavings from reduced annual losses between the scenarioswith DER and without DER, as determined in Step 4. Thereduced energy loss is valued at $0.10/kWh, which is thevalue of electricity in this example. The incentives werevalued at $4/kWpeak.
Table IX lists the total annualized costs for the variouspenetrations of allowable DER on the system. In thissystem, it was assumed that the PV system cost was $5/W
TABLE IXANNUALIZED COSTS FOR DER PENETRATION LEVELS FOR
CASE STUDY 3
TABLE XANNUALIZED BENEFITS FOR VARIOUS DER PENETRATION LEVELS
for all capacities and that it has a 30-year life; thus, thereare no replacement costs. The O&M costs were assumed tobe 0.1% of the initial total cost. These costs are summed todetermine the total annualized cost for various capacitiesof systems.
Once the benefits and costs for the various penetrationlevels are calculated, the total system value is determinedby subtracting the costs from the benefits. Table X showsthe results. For this example, the total system value in-creases as the capacity of the system increases.
The optimized solution based on total system valuein case study 3 is 33% penetration at Location 701. Thisexample showed that, as more detail about the distributionfeeder is known, particularly in defining the secondarydistribution transformers and service conductors, the

KROPOSKI et al.: OPTIMUM SIZING AND PLACEMENT OF ENERGY SOURCES IN POWER DISTRIBUTION SYSTEMS 2751
allowable penetration of DER decreases. It also showedthat, although the site location was not ideal from theperspective of overall system loss, it allowed most DERsto be interconnected without changing system operationsand therefore had the optimal value.
VI. CONCLUSION
The optimization methodology described in this paper hasbeen evaluated using a realistic distribution feeder that wasconstructed based on the IEEE 34-bus test feeder. This examplerevealed that equipment ratings and short-circuit current valuescan reduce the DER penetration on a distribution feeder.
Based on the case study, several important rules of thumbcan be determined. The optimal placement of DER in terms ofloss reduction is to place a DER equal to the load at the loadlocation. This is not normally going to be economical becausethe installation of DER will be dependent on the availabilityof resources. This paper has focused on determining the singlebest location and capacity on a specific distribution feeder.When this criterion is applied, the DER should be locatedbetween two-thirds and the end of the line segment defined bya specific voltage regulation device for lowest line losses. Thetwo-thirds rule may not give the best economic results becauseplacing the DER closer to the substation provides lower short-circuit current ratings and thereby allows high DER penetrationlevels. The main limitations of the circuits that were examinedwere current limits on the low-voltage devices. Service dropequipment is sized to meet the loads and limit the amountof DER that can be backed into the circuit. The short-circuitcontributions from the DER can also limit the amount of DERinstalled on a feeder. This limitation becomes more pronouncedthe farther the DER is placed from the substation.
This paper, a sequel to [16], has described the developmentof a strategy to identify technical constraints for the systembased on power flow and short-circuit contribution to determinea maximum technical DER penetration level for the feeder.This paper has also discussed the development of an economicapproach to analyze the value of DERs to the utility andcustomer. This approach enables optimization of the electricalsystem at the highest value and creates a total system valuethat provides a better solution to sizing and siting DER in adistribution system.
The two-part methodology provides a framework for evalua-tion of DER in the electrical distribution system by integratingtechnical and economic factors. The methodology has beentested for a variety of feeder load profiles and designs to demon-strate the applicability for a variety of distribution circuits. Asa paradigm shift from central-station generation to distributedgeneration occurs, this paper addresses the future of electricpower delivery. The research covered in this paper is importantto electric utilities that are beginning to add significant amountsof renewable and DERs into their systems. It will help themidentify the areas of their service territory that will receive thehighest value from using DER. This paper is also useful andrelevant to policy and decision makers because it provides amethodology to determine the maximum penetration of DERon a distribution system without affecting operating costs or
requiring upgrades. This will also help the utility industry,system integrators, and customers of distributed energy systemsto identify the most promising locations for distributed energyapplications and size the systems to create the best overallsystem value.
VII. FUTURE WORK
Future work should include the development of a singlesoftware package that includes all the technical and economicfunctions described in the optimization methodology. This soft-ware would be extremely helpful to utilities and the planningengineers if it could be integrated with their geographical infor-mation systems that hold data on the system parameters. Quan-tifying additional system benefits, including DER-providedvoltage regulation and environmental benefits, when applicablecould be also expanded and included in the methodology.
In addition, the methodology could be easily expanded toinclude improvements in reliability with the use of DER to formmicrogrids within the distribution system. Another extensionof this paper would be to use the optimization methodology inan active sense and develop control strategies for distributionsystem operations.
It is expected that this paper can be used by utilities thatare evaluating the applications of DER in their system. Allutilities are interested in understanding the effects of highDER penetration levels on distribution systems in their serviceterritories, and this paper provides the background for thatevaluation process.
REFERENCES
[1] B. Chowdhury and A. Sawab, “Evaluating the value of distributed pho-tovoltaic generations in radial distribution systems,” IEEE Trans. EnergyConvers., vol. 11, no. 3, pp. 595–600, Sep. 1996.
[2] H. Wenger and T. Howard, “PVUSA: The value of photovoltaics inthe distribution system—The Kerman Grid-support project,” Pacific GasElectric Co., Davis, CA, USA, PG&E R&D Tech. Rep. 007.5-94.15.DOE/AL/82993-20, 1995.
[3] J. Iannucci, L. Cibulka, J. Eyer, and R. Pupp, “DER benefits analysisstudies: Final report,” Nat. Renewable Energy Lab., Golden, CO, USA,Rep. NREL/SR-620-34636, 2003.
[4] E. Gumerman, R. Bharvirkar, K. LaCommare, and C. Marnay, “Eval-uation framework and tools for distributed energy resources,” LBNL,Berkeley, CA, USA, Tech. Rep. LBNL-52079, 2003.
[5] J. L. Contreras, L. Frantzis, S. Blazewicz, D. Pinault, and H. Sawyer,“Renewable systems interconnection: Value analysis,” Nat. RenewableEnergy Lab., Golden, CO, USA, Tech. Rep. NREL/SR-581-42303, 2007.
[6] W. El-Kattam, Y. G. Hegazy, and M. M. A. Salama, “An integrated dis-tributed generation optimization model for distribution system planning,”IEEE Trans. Power Syst., vol. 20, no. 2, pp. 1158–1165, May 2005.
[7] C. T. Borges and D. M. Falcao, “Optimal distributed generation allocationfor reliability, losses, and voltage improvement,” Int. J. Elect. PowerEnergy Syst., vol. 28, no. 6, pp. 413–420, Jul. 2006.
[8] S. L. Payyala and T. C. Green, “Sizing of distributed generation plantthrough techno-economic feasibility assessment,” in Proc. IEEE PESConf., Montreal, QC, Canada, 2006, p. 8.
[9] S. L. Payyala and T. C. Green, “An estimation of economic benefit valuesof DG,” in Proc. IEEE Power Eng. Soc. Conf., Tampa, FL, USA, 2007,pp. 1–8.
[10] A. D. T. Le, M. A. Kashem, M. Negnevitsky, and G. Ledwich, “Optimaldistributed generation parameters for reducing losses with economic con-sideration,” in Proc. IEEE Power Eng. Soc. Conf., Tampa, FL, USA, 2007,pp. 1–8.
[11] B. Kuri, M. Redfern, and F. Li, “Optimization of rating and positioning ofdispersed generation with minimum network disruption,” in Proc. IEEEPower Eng. Soc. Gen. Meet., Denver, CO, USA, 2004, pp. 2074–2078.
2752 IEEE TRANSACTIONS ON INDUSTRY APPLICATIONS, VOL. 49, NO. 6, NOVEMBER/DECEMBER 2013
[12] R. Broadwater, Distribution Engineering Workstation (DEW), 2007.[13] P. Lilienthal, “The HOMER micropower optimization model,” presented
at the DOE Solar Energy Technologies Program Review Meeting, Denver,CO, USA, 2004, Paper NREL/CP-710-37606.
[14] T. Hoff, R. Perez, G. Braun, M. Kuhn, and B. Norris, “The value ofdistributed photovoltaics to Austin Energy and the City of Austin,” CleanPower Res., Napa, CA, USA, 2006.
[15] IEEE, “IEEE 34 Node Test Feeder,” IEEE Power Engineering SocietyDistribution System Analysis Subcommittee.
[16] B. Kroposki, P. K. Sen, and K. Malmedal, “Selection of distributionfeeders for implementing distributed and renewable energy applica-tions,” in Proc. IEEE REPC, Fort Collins, CO, USA, Apr. 26–29, 2009,pp. B1-1–B1-10.
Benjamin Kroposki (SM’00) received the B.S.E.E.and M.S.E.E. degrees from Virginia Polytechnic In-stitute and State University, Blacksburg, VA, USA,and the Ph.D. degree from the Colorado School ofMines, Golden, CO, USA.
He is currently the Director of Energy SystemsIntegration, National Renewable Energy Laboratory,Golden. His expertise is in the broad interrelatedareas of design, testing, and implementation of dis-tributed power systems and renewable energy appli-cations, and he has published more than 100 articles
in these areas.Dr. Kroposki is a Registered Professional Engineer in the State of Colorado.
Pankaj K. (PK) Sen (F’11) received the B.S.E.E.degree (with honors) from Jadavpur University,Calcutta, India, and the M.Eng. and Ph.D. degreesin electrical engineering from the Technical Univer-sity of Nova Scotia (now merged with DalhousieUniversity), Halifax, NS, Canada.
He is currently a Professor of engineering andthe Site Director of the Power Systems EngineeringResearch Center (PSerc), Colorado School of Mines,Golden, CO, USA. He has published more than140 articles in various archival journals and confer-
ence proceedings. His research interests include renewable energy and dis-tributed generation, application problems in electric machines, power systems,and power engineering education.
Dr. Sen is a Registered Professional Engineer in the State of Colorado.
Keith Malmedal (SM’12) received the B.S.E.E.T.degree from Metropolitan State College of Denver(currently Metropolitan State University of Denver),Denver, CO, USA, the M.S.E.E. degree (power) andthe M.S.C.E. degree (structures) from the Univer-sity of Colorado, Denver, and the Ph.D. degree inengineering systems (electrical) from the ColoradoSchool of Mines, Golden, CO, USA.
He has more than 17 years of experience inelectrical power design and is currently a PrincipalEngineer and the President of NEI Electric Power
Engineering, Inc., Arvada, CO, USA, a consulting firm specializing in allaspects of power system design. He is also an Adjunct Faculty Member atthe University of Colorado. His research interests include renewable energy,distributed generation, energy policy, and application problems in electricpower systems, and he has published numerous archival papers.
Dr. Malmedal is a Registered Professional Engineer in 24 U.S. States andProvinces of Canada.