Embed Size (px)
Citation preview
N A S A TECHNICAL NOTE N A S A T N D-6930
0 cr) m
OPTIMUM RUN WAY ORIENTATION RELATIVE TO CROSSWINDS
N A T I O N A L A E R O N A U T I C S A N D SPACE A D M I N I S T R A T I O N W A S H I N G T O N , D. C. SEPTEMBER 1972
https://ntrs.nasa.gov/search.jsp?R=19720022600 2020-05-14T12:02:46+00:00Z

TECHNICAL REPORT STANDARD TITLE PAGE 12. GOVERNMENT ACCESSION NO. 13. RECIP IENT 'S CATALOG NO. 1 . REPORT NO.
NASA TN D-6930 I 1. T I T L E AND SUBTITLE
Optimum Runway Orientation Relative to Crosswinds
7. AUTHOR(S)
L. W. Falls and S. C. Brown 3 . PERFORMING ORGANIZATION NAME AND ADDRESS
5. REPORT DATE September 1972
6. PERFORMING ORGANIZATION CODE
8. PERFORMING ORGANIZATION REPOR r #
10. WORK UNIT NO.
2. SPONSORING AGENCY NAME AND ADDRESS
National Aeronautics and Space Administration
11 . CONTRACT OR GRANT NO.
L (3 . TYPE OF REPORT & PERIOD COVEREC
1.1. SPONSORING AGENCY CODE
17. KEY WORDS
I
15. SUPPLEMENTARY NOTES
Prepared by Aero-Astrodynamics Laboratory, Science and Engineering
16. ABSTRACT
Specific magnitudes of crosswinds may exist that could be constraints to the success of an aircraft mission such as the landing of the proposed space shuttle. A method is required to determine the orientation or azimuth of the proposed runway which will minimize the proba- bility of certain critical crosswinds. orientation relative to minimizing a specified crosswind speed a re described and illustrated with examples. wind rose. elliptical distribution is appiied to a data sarnpie of cmnpmeEt winds. only the assumption that the wind components are bivariate normally distributed. This assumption seems to be reasonable. Studies are currently in progress for testing wind conipoiieiita for bivariate n=rma!it;. fer various stations - The close agreement between the theoretical and empirical results for the example chosen substantiates the bivariate normal aeeumnption.
m o procedures for obtaining the optimum runway
The empirical procedure requires only hand calculations on an ordinary The theoretical method utilizes wind statistics computed after the bivariate normal
This rr-ethoc! requires
18. DISTRIBUTION STATEMENT
2 1 . NO. OF PAGES 19 . SECURITY CLASSIF . (d thia rep&) 20. SECURITY CLASSIF. (Of t h h PWe)
Unclassified Unclassified 19
MSFc - Form 3292 (May 19
* For sale by the National Technical Information Service, Springfield, Vlrginla 22151
22. PRICE
$ 3 . 0 0

TABLE OF CONTENTS
Page
INTRODUCTION ..................................... 1
EMPIRICAL METHOD . . . . . . . . . . . ._. . . . . . . . . . . . . . . . . . . . . 1
THEORETICAL METHOD . . . . . . . . . . . . . . . . . . . . . . . . . . . . . . 6
CONCLUSIONS ...................................... 9
REFERENCES ...................................... 11
BIBLIOGRAPHY ..................................... 11
APPENDIX. COMPUTER PROGRAM FOR OPTIMUM RUNWAY ORIENTATION RELATIVE TO CROSSWINDS . . . . . . . . . 12
ACKNOWLEDGMENT
The authors wish to acknowledge the assistance of Mr. Raymond Smith of tne Computation Lzborzt~ry, ?ilSFC, fer his mrk on the Univac 1108 Computer Program.
iii
TECHNICAL NOTE D-
O P T I M U M RUNWAY ORIENTATION RELATIVE TO CROSSWINDS
I NTROD UCT I O N
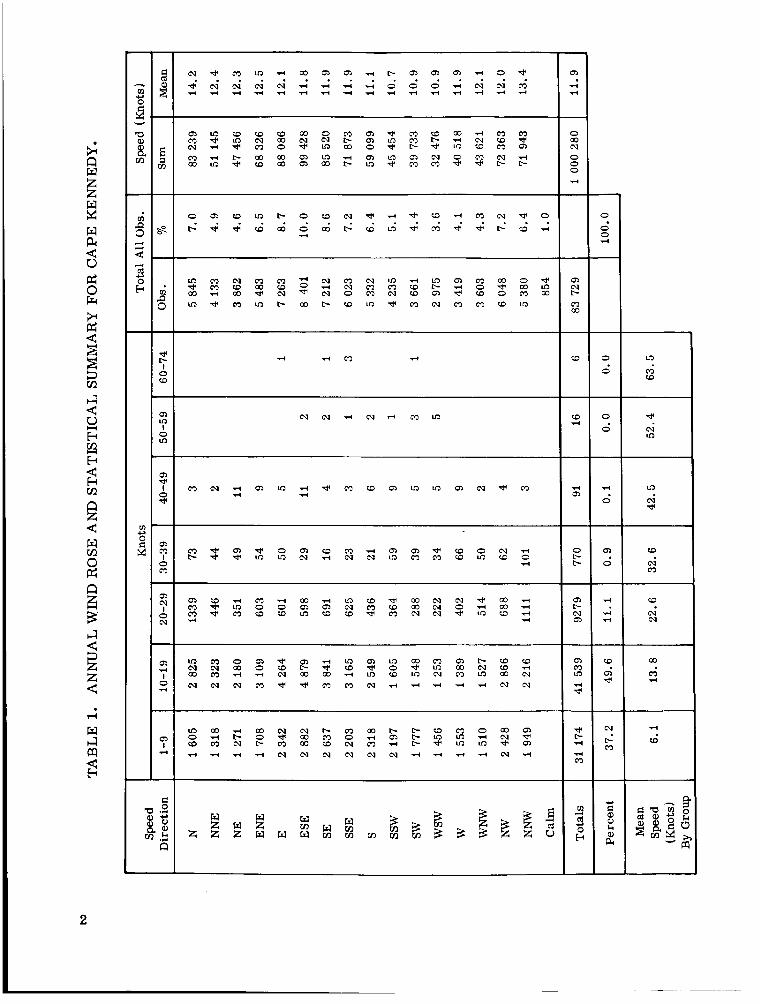
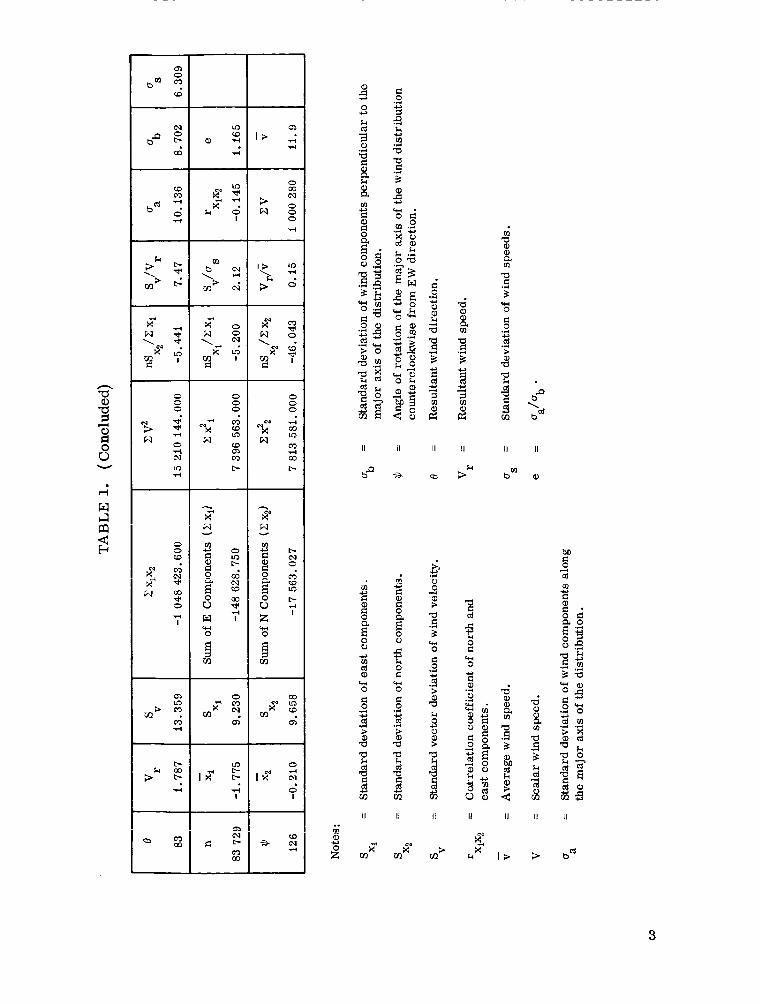
Runway orientation is undoubtedly influenced by a number of factors - perhaps winds, terrain features, population interfere-nce, etc. In some cases, the frequency of occurrence of crosswind components of some signi- ficant speed may have received insufficient consideration. If, for example, a runway for the space shuttle vehicles is being planned, it may be prudent to consider the optimum runway orientation to minimize crosswind com- ponents of, for example, 20 knots. Aligning the runway with the prevailing wind will not ensure that crosswinds of th i s magnitude will be minimized. In fact, two common synoptic situations (one producing light easterly winds, and the other causing strong northerly winds) might exist in such a relation- ship that a runway oriented with the prevailing wind might be the least use- ful to an aircraft constrained by crosswind components I 20 knots. Two methods (one empirical, the other theoretical) of determining the optimum runway orientation to minimize critical crosswind component speeds a re described below. Both methods gave identical results for the Cape Kennedy, Florida, winds shown in Table I.
E M P I R I C A L METHOD
The following paragraphs outline a short procedure (one requiring only a desk calculator and a wind rose) for determining the best runway orientation relative to some specified crosswind component.
From the ordinary wind rose (Table I), the percentage frequency of a number of wind speeds and directions can be obtained. For this pro- cedure, the percentage frequency or number of cases in each class interval or %ox" is assumed to be located at the class mark.
It. is a.ppa.rent that, if two of the reported wind directions (opposites) are chosen as a runway orientation, the crosswind component contributed by each box can be obtained from the product of the wind speed and the sine
d l - l m l-l Ka
m (0
* cv In
Ka
cv *
W
cv m
W
cv cv
W
m l-l
2
m 0
bm 1 W
e4 0
bQ m
(0
rl bcd 6
m
*
0 0 0
- 4 z 2
0 7-l N In d
v)
I x " *
m
c c ' m
e4
m
m I ?
d
0 00
k N w 8 0 d
0 0 0
d % g W m
rl 03 c-
m In
m mx" w
0
Ix" F; 0
W 3 - e 4 rl
II
s
m Y d
Q g 2
a
0
0 d
W 0 E: 0
cd .rl Y .rl
% -0 a k cd a c 2 II
x" (I)
II
m
5;
8
.!3 5
Y .- M
a
W 0
.d c, ld ? .rl
a"
$
9
k 0 0 Y
3 tj
II
m'
m a a, a m a d
r r l
B W 0
g
a" E .
.rl Y cd > .*
m
3
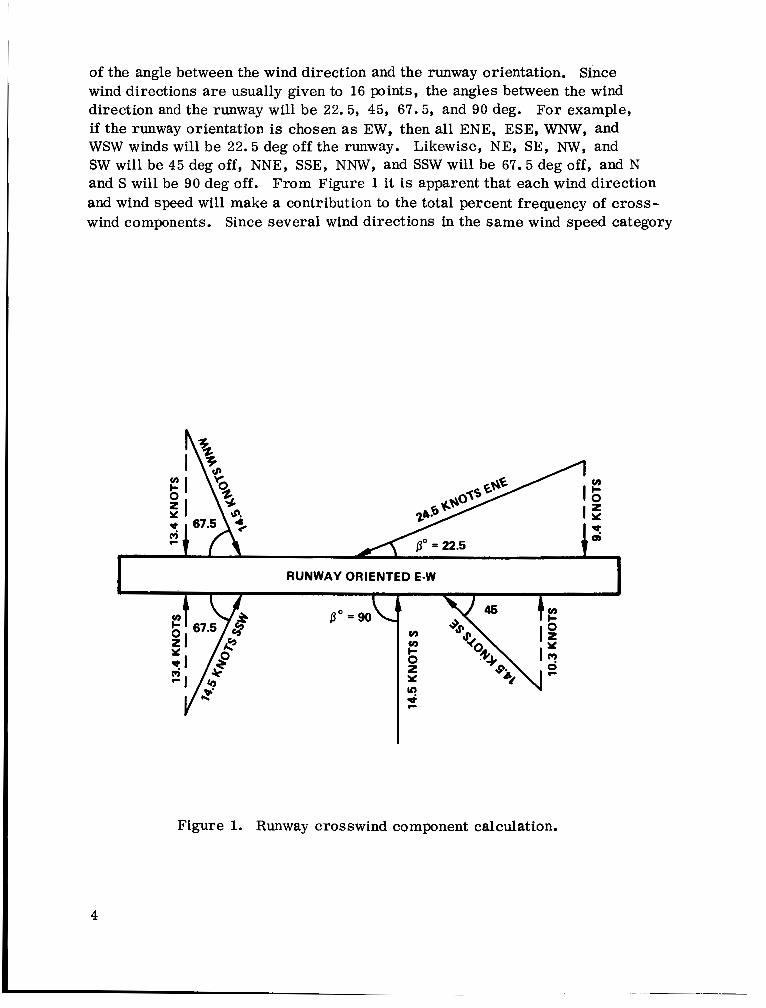
of the angle between the wind direction and the runway orientation. Since wind directions are usually given to 16 points, the angles between the wind direction and the runway will be 22.5, 45, 67.5, and 90 deg. if the runway orientation is chosen as EW, then all ENE, ESE, WNW, and WSW winds will be 22.5 deg off the runway. Likewise, NE, SE, NW, and SW will be 45 deg off, NNE, SSE, NNW, and SSW will be 67.5 deg off, and N and S will be 90 deg off. From Figure 1 it is apparent that each wind direction and wind speed will make a contribution to the total percent frequency of cross- wind components. Since several wind directions in the same wind speed category
For example,
RUNWAY ORIENTED E-W
r
Figure 1. Runway crosswind component calculation.
4

will produce the same crosswind component, these boxes should be summed. For example, under the 10-19 category, sum NE, SE, NW, and SW (2180 + 3841 + 2866 + 1548 = 10 435) to obtain the frequency of crosswind components of 10.3 knots ( 14.5 sin 45 deg = 10 .3 ) . This process should be continued until all boxes except E-W have been used to compute a crosswind component.
In summary, the crosswind component computation procedure consists of the following steps:
1. Compute all possible crosswind components -the product of each wind speed and the sine of 22.5, 45, 67 .5 , and 90 deg.
2. Sum all boxes that contribute the same crosswind component for a specified runway orientation. Compute the frequency and percent frequency for each crosswind speed.
3. Order the crosswind component speeds from the largest to the smallest and tabulate the percent frequency of occurrence opposite each cross- wind component.
4. Form the cumulative percentage frequency ( C P F ) from the values tabulated in step 3. , starting with the highest wind speed. This C P F gives a description of the crosswind components for a single runway.
5. Interpolate the C P F for the desired wind speed. This interpolated value gives the probability in percent of equaling o r exceeding the specified crosswind component for that runway orientation. From the few cases examined, it appears that the interpolation should be made assuming a normal distribution.
Of course, the procedure must be repeated for each pair of opposite wind directions (runway orientations) to determine the optimum runway orientation relative to a critical crosswind component.
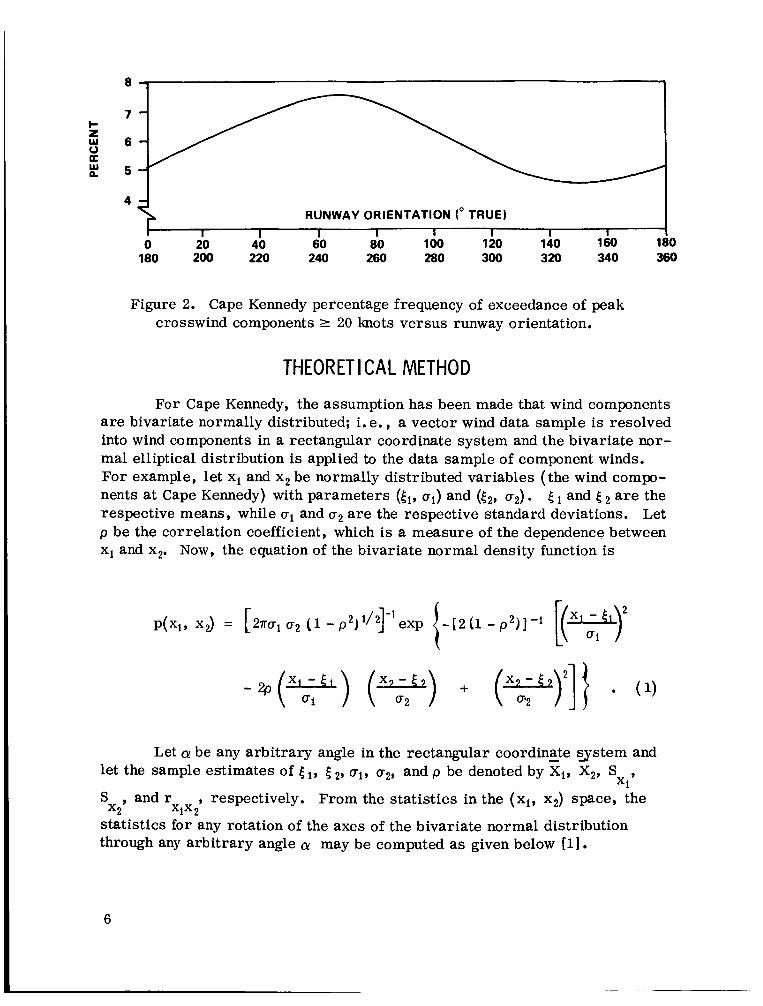
This procedure was applied to the Cape Kennedy annual wind rose shown in Table 1, except that hurricane associated winds 2 50 knots were removed on the premise that landing operations would not be conducted during such periods. (Table 1 was prepared from hourly peak wind measurements made from September 1958 through June 1969.) Results of the analysis (Fig. 2 ) , for which 20 knots was selected as the critical crosswind speed, illciiczte that the hest runway oriefitzitio:: relative to speeds of this magnitude is about 150 to 330 deg true.
5
8
7 -
5 6 - k
0 K
L 5 -
4 - RUNWAY ORIENTATION (" TRUE)
I I I I I I I I 0 20 40 60 80 100 120 140 160 180
180 200 220 240 260 280 300 320 340 360
Figure 2. Cape Kennedy percentage frequency of exceedance of peak crosswind components L 20 knots versus runway orientation.
THEORETICAL METHOD
For Cape Kennedy, the assumption has been made that wind components a re bivariate normally distributed; i. e., a vector wind data sample is resolved into wind components in a rectangular coordinate system and the bivariate nor- mal elliptical distribution is applied to the data sample of component winds. For example, let xi and x2 be normally distributed variables (the wind compo- nents a t Cape Kennedy) with parameters (ti, ai) and (t2, a2). ( and ( are the respective means, while ai and g2 a re the respective standard deviations. Let p be the correlation coefficient, which is a measure of the dependence between xi and x2. Now, the equation of the bivariate normal density function is
Let a! be any arbitrary angle in the rectangular coordinate - system and let the sample estimates of t i , 5 2 , ai, a2, and p be denoted by Xi, X2, S ,
X i S , and r , respectively. From the statistics in the (xi, x2) space, the
statistics for any rotation of the axes of the bivariate normal distribution through any arbitrary angle a! may be computed as given below [11 . x2 xix2
6
Let (yl, y21 be the new space after rotation with orthogonal axes yl and y2. Let PI, Y2, S , S , and r be the means, standard deviations,
Y Y 1 2
and correlation coefficient in the (y , y ) space. From Reference 1, 1 2
Y Y 1 2
- - y1 = X, cos a + k2 sin a - - Y2 = X2 cos CY - X, sin a!
Y2 . cos2a+ s2 sin'% - 2s cos a s i n 0
Y 2 XI XIX2
- = , S r -
Y 1Y 2 SYISY
where S2 , S2 , and S a re the variances and covariance in the (xi, XJ XI x2 XlX2
space and S is the covariance in the (yl, y2) space. Y92
In equations (21, all statistics on the right side a re available for Cape Kennedy o r may be computed from existing data (Table 1).
Equations (2) give the statistics in the (yl, y2) space (this is the space after rotation through any angle CY) that defines the bivariate probability den- sity function (1).
The existing wind statistics for Cape Kennedy (Table 1) a r e for the reference angle CY = 90 deg; i.e., the (xi, x2) space is for CY = 90 deg.
Let A 0 denote the desired increments for which runway orientation accuracy is required; e. g., one may wish to minimize the probability of cross- winds with a runway orientation accuracy down to ACY = 10 deg. This means we must rotate the bivariate normal axes through every 10 deg beginning at a - Ju uGs LLllG (xl, xz) s p ~ c e ] it. i s oriy necessary t~ r&&e the bivariate normal surface through 180 deg, since the distribution is symmetric in the
- nn A--. r+h,
7
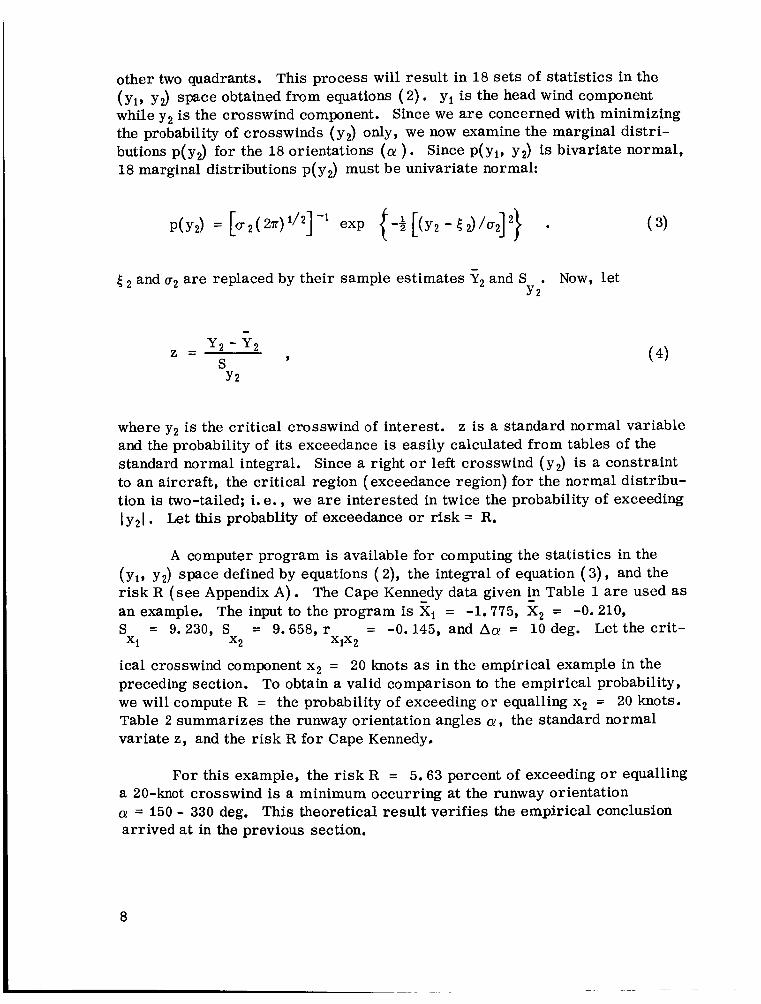
other two quadrants. This process will result in 18 sets of statistics in the (yi, yz) space obtained from equations ( 2 ) . yi is the head wind component while y2 is the crosswind component. Since we a re concerned with minimizing the probability of crosswinds (yz) only, we now examine the marginal distri- butions p( y2) for the 18 orientations ((I! ) . Since p( yi, y2) is bivariate normal, 18 marginal distributions p( yz) must be univariate normal:
5 and u2 are replaced by their sample estimates Tz and S . Now, let Yz
- y2 - yz
Y2
z = S 9
where y2 is the critical crosswind of interest. z is a standard normal variable and the probability of its exceedance is easily calculated from tables of the standard normal integral. Since a right o r left crosswind (y2) is a constraint to an aircraft, the critical region (exceedance region) for the normal distribu- tion is two-tailed; i. e., we are interested in twice the probability of exceeding I y2 I . Let this probablity of exceedance o r risk = R.
A computer program is available for computing the statistics in the (yi, y2) space defined by equations ( 2), the integral of equation ( 3), and the r i s k R (see Appendix A ) . The Cape Kennedy data given in - Table 1 a re used a s an example. The input to the program is xi = -1.775, X2 = -0.210, S = 9.230, S = 9.658, r = -0.145, and A(I! = 10 deg. Let the crit-
X i x2 xix2
ical crosswind component x2 = 20 knots as in the empirical example in the preceding section. To obtain a valid comparison to the empirical probability, we will compute R = the probability of exceeding o r equalling x2 = 20 knots. Table 2 summarizes the runway orientation angles 01, the standard normal variate z , and the risk R for Cape Kennedy.
For this example, the r isk R = 5.63 percent of exceeding o r equalling a 20-knot crosswind i s a minimum occurring at the runway orientation cy = 150 - 330 deg. This theoretical result verifies the empirical conclusion arrived at in the previous section.
8
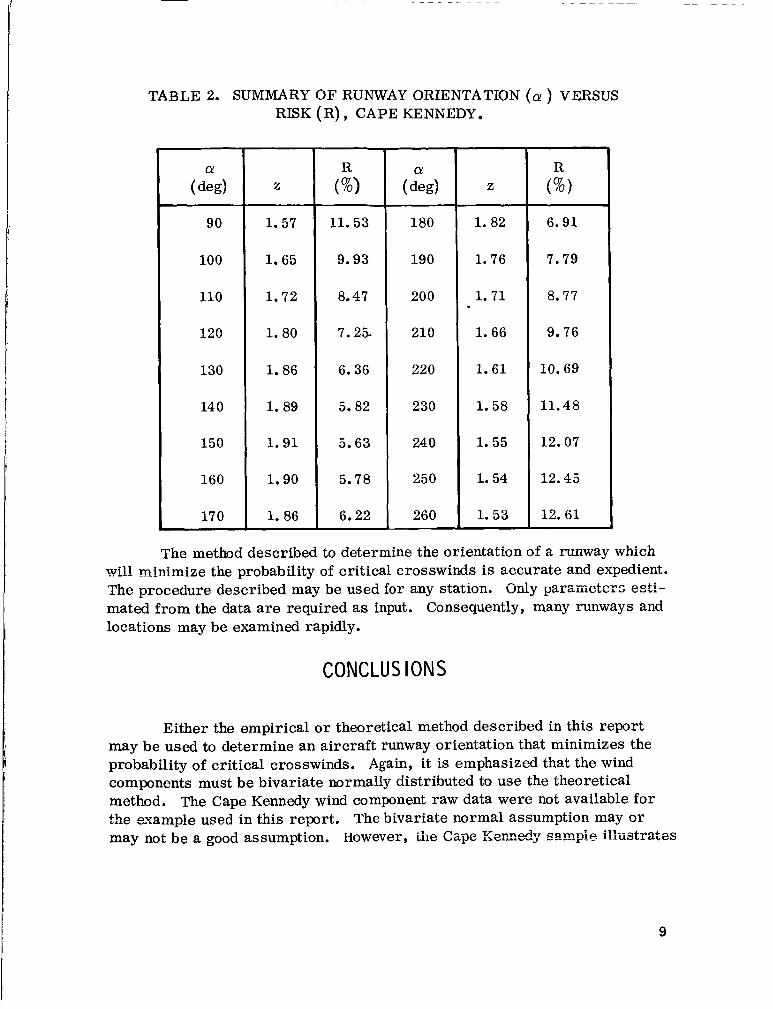
TABLE 2. SUMMARY O F RUNWAY ORIENTATION (cy ) VERSUS RISK (R) , CAPE KENNEDY.
90
100
110
120
130
14 0
150
160
170
z
1.57
1.65
1.72
1.80
1.86
1. 89
1 .91
1.90
1. 86
-
11.53
9.93
8.47
7 . 2 5
6.36
5.82
5.63
5.78
6.22
~~
180
190
200
210
220
230
24 0
250
260
z
1. 82
1. 76
1 .71
1.66
1.61
1 .58
1.55
1.54
1 .53
6.91
7.79
8.77
9.76
10.69
11.48
12.07
12.45
12.61
The method described to determine the orientation of a runway which will m-inimize the probability of critical crosswinds is accurate and expedient. The procedure described may be used for any station. Only parai?ietzrs esti- mated from the data a re required a s input. Consequently, many runways and locations may be examined rapidly.
CONCLUSIONS
Either the empirical o r theoretical method described in this report may be used to determine an aircraft runway orientation that minimizes the probability of critical crosswinds. Again, it is emphasized that the wind components must be bivariate normally distributed to use the theoretical method, The Cape Kennedy wind component raw data were not available for the example used in this report. The bivariate normal assumption may or may not be a good assumption. However, ~iie L ~ Y G ssG.lulvuJ ------r--.
"- - me-- V-nnn4-r camnjp illiistrates
9
the method. The agreement between the theoretical and empirical methods is very good. A s shown by Figure 2 and Table 2, the minimum and maximum probabilities occur a t the same azimuths for both methods. The minimum risk of 5 .63 percent for the theoretical method occurs at 150 deg. The mini- mum risk for the empirical approach also occurs at 150 deg as shown by Figure 2. The empirical r isk is approximately 4.7 percent. The maximum risks for the two methods also occur at approximately the same orientation. The maximum theoretiFal risk of 12.61 percent occurs at 260 deg, while the maximum empirical r isk of about 7 . 6 percent occurs at 250 deg. One may view the differences in the theoretical and empirical probabilities as a measure of the departure of the data from normality.
In practical applications, the following steps a re suggested:
1. Test the component wind samples for bivariate normality if these samples a re available. See Reference 2 for bivariate normal goodness-of-fit tests. 1
2. If the component winds a r e available and cannot be rejected as bivariate normal using the bivariate normal goodness-of-fit test, use the theoretical method since it is more expedient and easily programmed.
3. If the component wind data samples a re not available and there is doubt concerning the assumption of bivariate normality of the wind components, use the empirical method.
1. H. L. Crutcher and L. W. Falls: Multivariate Normality. 1971 (to be published).
10

REFERENCES
1. Falls, L. W., and Crutcher, H. L.: Determination of Statistics for any Rotation of Axes of a Bivariate Normal Elliptical Distribution. NASA TM X-64595, May 1971.
2. Hald, A. : Statistical Theory with Engineering Applications. John Wiley and Sons, Inc., New York, N. Y., 1962.
B I BL IOGRAPHY
Cross-Wind Components for Selected Navy Runways. Prepared by the Office of Navy Representative, National Weather Records Center, Asheville, N. C., September 1958.
Crutcher, H. L.: Project Crosswinds. U. S. Department of Commerce, NOAA, National Climatic Center, Asheville, N. C. (Unpublished).
I
Minimum Cross-Winds to the Station Runway Complex. Prepared by the Office of Navy Representative, National Weather Records Center, Asheville, N. C., June 1959.
11

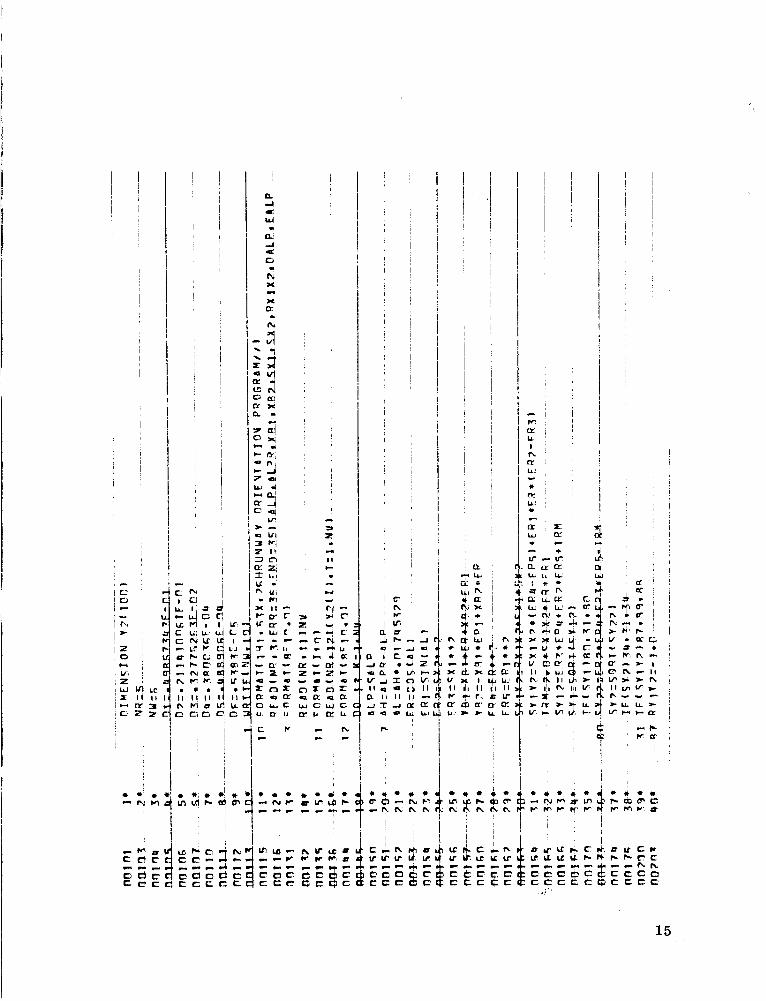
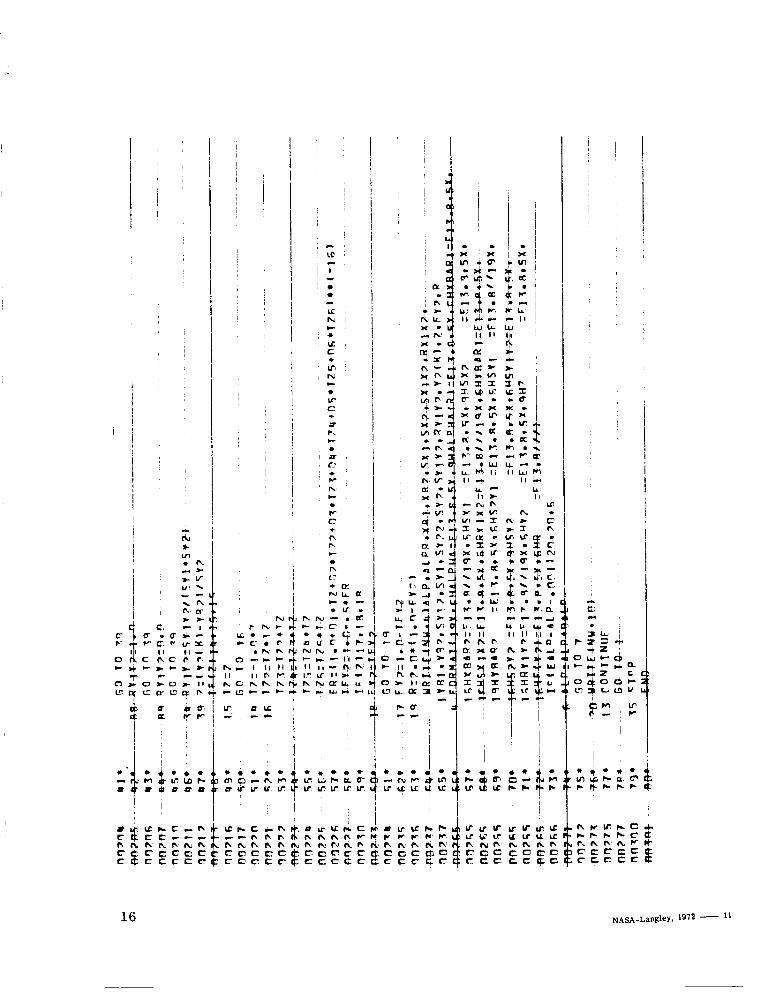
APPENDIX. COMPUTER PROGRAM FOR O P T I M U M RUNWAY ORIENTATION RELATIVE TO CROSSWINDS
Legend
Runway orientation
Orientation o r angle a t which the wind component statistics a re computed from the data sample
Mean of the head-tail winds at orientation a (R)
Mean of the crosswinds at orientation a (R)
Standard deviation of head-tail winds at a (R)
Standard deviation of crosswinds at a (R)
Covariance at a (R)
Correlation coefficient at a (R)
Mean of the head-tail winds at orientation a
Mean of the crosswinds at orientation a
Variance of the head-tail winds at a
Standard deviation of the head-tail winds at a
Variance of the crosswinds at a
Standard deviation of the crosswinds at a
Covariance at orientation
12
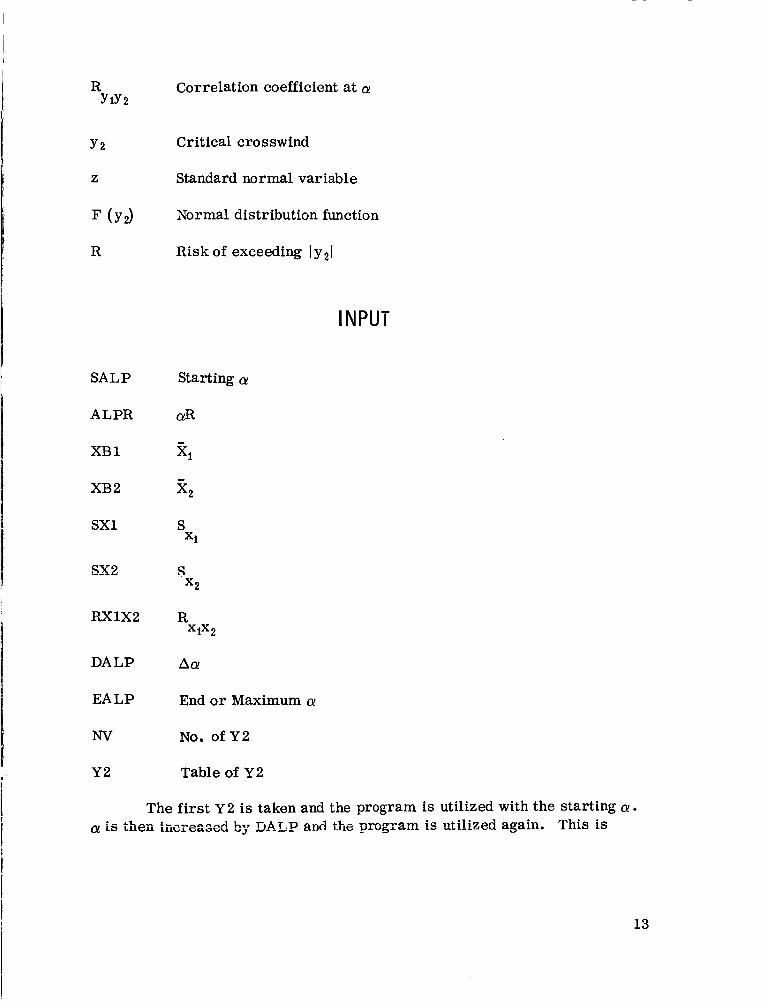
R Correlation coefficient at a! YiY2
Y 2 Critical crosswind
Z Standard normal variable
F (Y2) Normal distribution function
R Risk of exceeding lyzl
SALP
ALPR
XB 1
XB2
sx1
sx2
RxlX2
DALP
EALP
Nv
Y2
Starting
CYR
Xi -
s x2
R xix2
ACY
End or Maximum (Y
No. of Y2
Table of Y2
13
repeated until EALP (maximum a) is reached. The next Y2 is taken and the process is repeated. This is continued until all of the Y2's have been used. A transfer is then made to STATEMENT to see if more data a r e to be read in. If not, the program terminates. Usually Y2 is the only data that vary.
Note: The STATEMENT following STATEMENT 10 is an end-of-file check. If there are no more data the program terminates. This end-of-file
test may not be compatible with other computers.
George C. Marshall Space Flight Center National Aeronautics and Space Administration
Marshall Space Flight Center, Alabama 35812, June 23, 1972
14
' I , I ' i
I
I ,
. I' . - N M
i l l I I ' i
C r h M u $ U A C A h r r r r v r f v uv.u:yu
15
! I i ' 1 I I i I
, - 1c '
I - w
I o (I
U hi1 e *
c I
v: c + m N r-
I i !
I !
I
i M * i U. i
I
16 1972 - 11
NATIONAL AERONAUTICS AND SPACE ADMISTRATION WASHINGTON, D.C. 20546
OFFICIAL BUSINESS P E N A L T Y FOR P R I V A T E USE $300
FIRST CLASS MAIL
P O S T A G E A N D FEES P A I D
N A T I O N A L A E R O N A U T I C S A N D SPACE A D M I N I S T R A T I O N
USMAIL - U
NASA 451
It Undeliverable (Section 158 Poscal Manual ) Do Not Return
‘ T h e aeronaurical and space activities of the United States shall be conducted so as to contribute . . . to the expansion of human knowl- edge of phenoiiiena in the atniosphere and space. The Administration shall provide for the widest practicable and appropriate dissemination of information concerning its actitdies and the restilts thereof.”
-NATIONAL AERONAUTICS AND SPACE ACT OF 1958
NASA SCIENTIFIC AND TECHNICAL PUBLICATIONS
TECHNICAL REPORTS: Scientific and
complete, and a lasting contribution to existing knowledge.
TECHNICAL NOTES: Information4ess broad in scope but nevertheless of importance as a contribution to existing knowledge.
TECHNICAL MEMORANDUMS: Information receiving limited distribution because of preliminary data, security classifica- tion, or other reasons.
t ~ i ~ i i i ~ d iiifoiiiiiition ~ ~ n ~ i d ~ r e c ! ~EPCCWC,
TECHNICAL TRANSLATIONS: Information published in a foreign language considered to merit NASA distribution in English.
SPECIAL PUBLICATIONS: Information derived from or of value to NASA activities. Publications include conference proceedings, monographs, data compilations, handbooks, sourcebooks, and special bibliographies.
TECHNOLOGY UTILIZATION PUBLICATIONS: Information on technology used by NASA that may be of particular interest in commercial and other non-aerospace applications. Pubiications include Tech Briefs, Technology Utilization Reports and Technology Surveys.
CONTRACTOR REPORTS: Scientific and technical information generated under a NASA contract or grant and considered an important ronrri’niirinn r o existing kijay,-k&e.
Details on the availability of these publications may be obtained from:
SCIENTIFIC AND TECHNICAL INFORMATION OFFICE
NATIONAL AERONAUTICS AND SPACE ADMINISTRATION Woshington, D.C. PO546