Embed Size (px)
Citation preview

Journal of Crystallization Process and Technology, 2012, 2, 81-95 http://dx.doi.org/10.4236/jcpt.2012.23011 Published Online July 2012 (http://www.SciRP.org/journal/jcpt)
81
Optimum Kinetic Parameters of Mefenamic Acid Crystallization by PBM
Serap Cesur*, Cihan Yaylaci
Engineering Faculty, Chemical Engineering Department, Ege University, Bornova, Turkey. Email: *[email protected], *cesur.serap, [email protected] Received February 9th, 2012; revised March 10th, 2012; accepted March 21th, 2012
ABSTRACT
Mefenamic acid (MA) is a high-dose, anti-inflammatory, analgesic agent that is widely prescribed for pain related to menstrual disorders. It has some negative properties, such as a high hydrophobicity with a propensity to stick to sur-faces, and possess great problems during granulation and tableting. Crystallization kinetics was investigated for me-fenamic acid. Availability of data on the kinetics of crystal growth is very important for the development and operation of industrial crystallisation processes. The experiments for the measurement of crystal growth kinetics were carried out using the desupersaturation curve technique based on the measurement of the solution concentration versus time in a seeded isothermal batch experiment. To predict the optimum parameters (b, kb, g, kg) for the nucleation and growth ki-netics from the desupersaturation curve obtained, the Population Balance Modelling was used and solved by the method of moments. The initial values for the optimisation problem were estimated by using the approach developed by Gar-side et al. (1982) [1]. Keywords: Industrial Crystallization; Recrystallization; Mefenamic Acid; Crystal Growth from Solutions;
Crystallization in Solutions of Macromolecules; Computer Modeling; Simulation
1. Introduction
Mefenamic acid [N-(2,3-xyly) anthranilic acid] is a po- tent prostaglandin synthetase inhibitor that is widely used as a non-steroidal anti-inflammatory and analgesic-anti- pyretic drug. Mefenamic acid (MA) is used for the relief of postoperative traumatic inflammation and swelling, antiphlogistic analgesic treatment of rheumatoid arthritis, for antipyresis in acute respiratory tract infection and arthritis. Mefenamic acid is available in the form of tab- lets, capsules, and a pediatric suspension. Mefenamic acid is a problematic drug in granulation, tableting, and dis- solution due to its poor solubility, hydrophobicity, and tendency to stick to surfaces.
It has a prevalent usage in drug formulation. It is a poorly soluble drug in an aqueous media, sticking to any type of surface, and is not easily handled in the granula- tion and tableting processes. As is the case for many poorly soluble drugs, dissolution of mefenamic acid is a problem. To facilitate tableting, enhance dissolution rates, and develop a stable and reproducible dosage form, in- vestigation of the physicochemical properties of me- fenamic acid is necessary.
Pharmaceutical drugs are commonly crystalline mate-
rials and are therefore subject to polymorphism. As a result of different arrangement and or conformation, the polymorphic solids have different unit cells and hence exhibit different physical properties, including intermo- lecular interaction, crystalline disorder, a change in free energy, thermodynamic activity, solubility, dissolution rate, stability, and bioavailability.
Many of these properties, in particular stability and solubility, have an impact on the development potential of a drug molecule and it is for this reason that an under- standing of the solid-state of a drug molecule, including the identification of all possible forms and thorough characterization of the observed forms, is of prime im- portance within the pharmaceutical industry. Establishing the polymorphic behaviour of a drug molecule early in development minimizes the number of unsuitable candi- dates progressed and reduces the risk of encountering issues later which may have major financial and time impact. Several studies can be found in literature for the characterization of mefenamic acid in different solvents and polymorphic forms obtained [2-8]. Studies are not available for the crystallisation kinetics and the determi- nation of kinetic parameters of mefenamic acid [9], but the approach used for other chemicals can be used as a base. *Corresponding author.
Copyright © 2012 SciRes. JCPT

Optimum Kinetic Parameters of Mefenamic Acid Crystallization by PBM 82
Cooling batch crystallisation with seeding is used in- tensively to find crystallisation kinetics. These studies are interested mainly in two subjects; one is the parame- ter estimation of crystallisation parameters under a cer- tain specified experimental conditions [10,11] and the other is finding the optimal cooling strategies and its ef- fect on the final particle size distribution (PSD) of the product [12,13].
Qui and Rasmuson (1991a) used concentration and fi- nal product CSD data to determine kinetic parameters for an aqueous succinic acid system [14]. They simplified the population balance equation (PBE) to a first-order quasilinear equation system by assuming that the crystal growth rate could be expressed as a product of a function of supersaturation and a function of crystal size. They showed that by applying evaluated kinetics in process simulation allowed for a reasonably accurate prediction of the product weight mean size.
Qui and Rasmuson (1991b) evaluated the kinetics from isothermal desupersaturation experiments by com- paring polynomial fitting, initial derivatives and a non- linear parameter estimation method [15]. In particular, this study referred to separating the volume diffusion re- sistance from the surface integration resistance.
Bohlin and Rasmuson (1992) investigated the influ- ence of growth rate dispersion on the product size distri- bution of batch cooling crystallisation by computer simu- lations [16]. The study includes three different growth rate activity distributions. For unseeded and seeded proc- esses, the influence of the corresponding coefficient of variation was analyzed. They showed that the effect of growth rate dispersion on the crystal size distribution was significant at moderate dispersion. At high dispersion, even the actual shape of the growth rate activity distribu-tion was important.
Doki et al. (1999) studied the effect of seeding on batch crystallisation using a natural cooling mode [17]. They showed that a critical seed concentration can be found to improve the product mean size by the ideal growth of seed crystals and reducing the secondary nu-cleation.
Mohameed et al. (2002) investigated three different cooling rate effects on the crystallisation kinetics pa- rameters and on the final mean particle size of potassium chloride [18]. They used the gravimetric method to meas- ure the concentration of potassium chloride in the liquid phase as a function of time. A non-linear optimisation method was applied to estimate the growth and nuclea- tion rate parameters from the unseeded batch cooling crystallisation experiments. Their study suggested that unseeded batch crystallisation can produce reasonable mean particle sizes if an appropriate cooling rate is cho- sen.
Rohani et al. (2002) determined nucleation and growth
kinetics of ammonium sulphate by using a laboratory type cooling batch seeded crystallizer, a rigorous mathe- matical model of the process, and a nonlinear optimisa-tion program [19]. Supersaturation and crystal size dis-tribution were employed as the major outputs of the mod- el in the optimisation objective function. The sizeinde-pendent growth kinetic was shown to lack the necessary parameters to accurately fit the experimental data.
Mohameed et al. (2003) developed a model-based op- timisation strategy for the optimal cooling profile of batch crystallisation [20]. They used the numerical meth- od of lines to solve the batch crystallizer model by dis-cretization of population density function over the size length.
Hu et al. (2004) proposed a new optimisation-based identification approach for general batch cooling seeded crystallisation of ammonium sulphate to overcome insuf- ficient information on the CSD based on simplified po- pulation balance models such as the moment equations [21]. The final-time CSD was directly used for identifi- cation. Consequently, size-dependent growth rates can be considered.
The determination of the two-step crystal growth rate parameters by isothermal desupersaturation experiments relies upon the adequate use of experiment data. The growth rate vs supersaturation relation is always almost linear on a log-log diagram over a reasonable range of supersaturation, regardless of the mechanism involved. Only within the slight curvature of the graph, the infor- mation available can be found to separate the volume diffusion resistance from the surface integration resis- tance. Although using a different polynomial to correlate the desupersaturation data actually destroys essential in- formation and due to significant end affects, the range over which reliable growth rates may be obtained is re- duced. Direct estimation of growth rate parameters by fitting the supersaturation balance equation to the super- saturation measurements circumvents these deficiencies.
Simple, one-dimensional crystallization models that neglect crystal agglomeration and breakage are common in the literature and provide insight into the inner work- ings of crystallization processes in terms of growth and nucleation kinetics. These models allow for the calcula- tion of crystal size distribution outcomes and are often used in process optimization routines to determine an optimum trajectory (temperature, anti-solvent, super- saturation) that will result in a predefined crystal size distribution [22].
Liu et al. (2004) chose ciprofloxacin hydrochloride crystallisation and developed a mathematical model for the calculation of the linear crystal growth rate in solu- tion crystallisation [23]. They used transient CSD data, the solution concentration curve, and the suspension den- sity of a batch crystallisation process without taking into
Copyright © 2012 SciRes. JCPT

Optimum Kinetic Parameters of Mefenamic Acid Crystallization by PBM 83
consideration the secondary processes. An advantage of this method was that crystal shape factors did not effect the linear crystal growth rate.
Hu et al. (2005) used the final product CSD, the reac-tor temperature profile, and the solute concentration pro-file for the estimation of the kinetic parameters of crystal nucleation and growth [24]. They solved the PBE di-rectly instead of reducing it to a set of ordinary differen-tial equations (ODEs) or by changing the PBE to simple forms under some assumptions, so it could be applied to cases with a size-dependent growth rate and the determi-nation of optimal temperature profiles for the batch crys-tallizer was discussed.
Mohameed et al. (2007), presented a methodological frame-work for the optimisation of the para-xylene crys- tallisation process using a developed rigorous model and model parameters estimation [25]. The kinetic model parameters were estimated by reconciling the experi- mental data of the para-xylene concentration and total mass of para-xylene suspended crystals with model pre- dictions using a nonlinear optimisation technique. For this purpose, the numerical method of lines (MOL) was used to solve the model’s mathematical equations. The effect of cooling strategy on the estimated parameters was studied. To find the optimum cooling profile, a new objective function was proposed and also, a nonlinear optimisation technique was applied. The new proposed objective function maximizes the yield of crystals which have a certain required average size or greater. This ob- jective function requires the calculation of mass crystals along the size range. In the study, the homogenous well- mixed cooling batch crystallizer was used for the para- xylene crystallisation in order to investigate its advan- tages. They stated that, the batch crystallizer is the suit- able equipment for the study of nucleation and growth rates.
In the present study, the experiments for the measure-ment of crystal growth kinetics were carried out by the desupersaturation curve principle based on the measure-ment of the solution concentration versus time in a seeded isothermal batch experiment. To estimate the growth kinetics from the desupersaturation curve ob- tained, the Population Balance Modelling method was used and solved by the method of moments. The simple model developed by Garside et al. (1982) was applied for obtaining the initial values [1].
1.1. Crystallisation Kinetics
Crystallisation is a two step process of nucleation and crystal growth requiring a change of free energy (Gibbs). Both nucleation and growth of crystals depend on the degree of supersaturation, but usually to different “or- ders”, with nucleation exhibiting the stronger dependence and higher free energy requirement. Crystals can subse-
quently be disrupted or can agglomerate, thereby further changing both their particle size and numbers.
Nuclei are the first formed embryos, possibly only a few nanometers in size, which subsequently grow to produce tangible crystals. Nucleation is thus the first formation of the solid phase. It occurs due to clustering and aggregation of molecules or ions in a supersaturated melt, solution or vapour to a size at which such entities become viable i.e. they will grow rather than redissolve. Crystal growth is a diffusion and integration process, modified by the effect of the solid surfaces on which it occurs. Solute molecules/ions reach the growing faces of a crystal by diffusion through the liquid phase. At the surface, they must become organized into the space lat- tice through an adsorbed layer. Neither the diffusion step nor interfacial step, however, will proceed unless the solution is supersaturated. The rate of crystal growth can be expressed as the rate of displacement of a given crys- tal surface in the direction perpendicular to the face. Dif- ferent crystallographic faces of a crystal, however, usu- ally have different linear growth rates. Variations occur in the shape of crystals when individual faces grow at different rates, the overall crystal habit being determined by the slowest growing face [26]. The crystal growth rate can also be determined by the overall growth of the crys- tal. In this case, the usual method to be used is to deter- mine the change of the crystal mass per unit time [27]. The theories are classified into two groups, that is, based on either thermodynamic or kinetics properties.
1.2. Crystallisation Kinetics Correlations
Formation of new crystals may result from any one or a combination of different mechanisms (primary homoge- neous or heterogeneous and secondary nucleation) or by attrition. In an industrial crystallisation practice secon- dary nucleation usually has a predominant influence [28]. Secondary nucleation is a complex phenomenon and is not well understood as a general theory for the prediction of nucleation rates does not exist. Several correlations based on the power law model have been found to ex- plain most of the experimental data satisfactorily. The power law (from the Becker-Doering relationship) is given in Equation (1).
j bb kB k C (1)
The nucleation rate constant kb may be a function of many other variables, in particular temperature, hydro- dynamics, presence of impurities and perhaps some crys- tal properties, and the effect of these might be incorporated in the rate equation using suitable functional forms. The power law term j
kµ represents the kth moment of the crystal size distribution present in the crystallizer.
The kinetics for the secondary nucleation can be meas- ured either by measuring the width of the metastable
Copyright © 2012 SciRes. JCPT
Optimum Kinetic Parameters of Mefenamic Acid Crystallization by PBM
Copyright © 2012 SciRes. JCPT
84
zone, the induction time or by counting the number of nuclei formed. One of the methods for the determination of nucleation rates is by measuring the maximum possi- ble supercooling rate that can be obtained in a saturated solution when it is cooled at different rates [29].
growth rate instead of mass deposition as given in Equa- tion (2) as
d
dg
g
LG k
tC (3)
The constants in Equations (2) and (3) can be related to each other through the expression The rate of nucleation can also be determined by ob-
serving the time elapsed between the creation of super- saturation and the formation of a new phase. This time interval is defined as the induction time and is a function of the solution temperature and supersaturation. The for- mation of a new phase can be detected in several dif- ferent ways, for example, by the appearance of crystals or by changes in the properties (turbidity, refractive in- dex) of the solution [30].
3g gK k
(4)
In general, the overall rate constants Kg and kg depend on temperature, crystal size, hydrodynamic situation and presence of impurities and are usually fit to the Arrhenius equation to obtain a general expression for growth rate as a function of temperature.
The development and operation of the industrial crys- tallisation processes can be made significantly easier if some data on the kinetics of crystal growth were avail- able. This information can be incorporated in process models, can be used in process and crystallizer design, and can shed light on the observed behaviour of the sys- tem.
1.3. Determination of Crystallisation Kinetics
The kinetic parameters can be highly sensitive to small concentrations of contaminating chemicals, which can result in kinetic parameters that vary over time. Also, many crystals are sufficiently fragile that the crystals break after formation, or the crystals can agglomerate or have erosion or other surface effects that are difficult to characterize. Another significant source of uncertainty in industrial crystallizers is associated with mixing. Al- though crystallisation models usually assume perfect mixing, this assumption is rarely true for an Industrial- scale crystallizer.
The crystal growth theories provide a theoretical basis for the correlation of experimental crystal growth data and the determination of kinetic parameters from the data to be used in models of industrial crystallisation proc- esses. For engineering purposes in crystallizer design and assessment, the simple empirical power law relationship expressing the rate of mass deposition is given in Equa- tion (2).
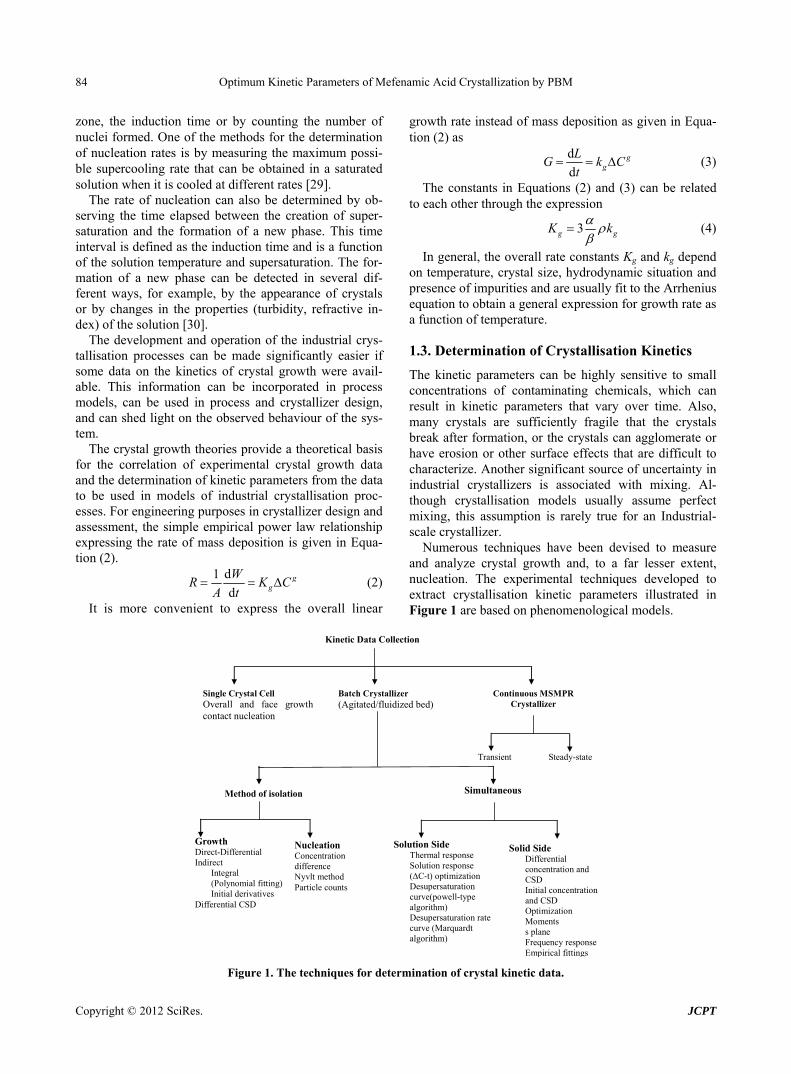
Numerous techniques have been devised to measure and analyze crystal growth and, to a far lesser extent, nucleation. The experimental techniques developed to extract crystallisation kinetic parameters illustrated in Figure 1 are based on phenomenological models.
1 d
dg
g
WR K C
A t (2)
It is more convenient to express the overall linear
Kinetic Data Collection
Single Crystal Cell Overall and face growth contact nucleation
Batch Crystallizer (Agitated/fluidized bed)
Continuous MSMPR Crystallizer
Transient Steady-state
Method of isolation Simultaneous
Growth Direct-Differential Indirect Integral
(Polynomial fitting) Initial derivatives Differential CSD
Nucleation Concentration difference Nyvlt method Particle counts
Solution Side Thermal response Solution response (∆C-t) optimization Desupersaturation curve(powell-type algorithm) Desupersaturation rate curve (Marquardt algorithm)
Solid Side Differential concentration and CSD Initial concentration and CSD Optimization Moments s plane Frequency response Empirical fittings
Figure 1. The techniques for determination of crystal kinetic data.

Optimum Kinetic Parameters of Mefenamic Acid Crystallization by PBM 85
The classical approach to establish crystallisation ki-
netics is to isolate the growth and nucleation processes and determine their kinetics separately by direct and or indirect methods under different hydrodynamic condi- tions. Direct methods to characterize crystal growth in- clude single crystal studies; measurement of weight gain or movement of a distribution of seeds suspended in a supersaturated solution. In an indirect method, super- saturation depletion is measured.
Since all of the direct measurement techniques are time consuming and require a significant number of ex- periments to obtain sufficient data to obtain kinetics pa- rameters, the indirect methods is more reasonable for estimation to both growth and nucleation kinetics. Most of the indirect methods are based on the measurement of the solution concentration versus time in a seeded iso- thermal batch experiment. This is often called the desu- persaturation curve since the concentration and solubility can be used to calculate the supersaturation of the system versus time.
The growth rate kinetics can be estimated by a number of methods from the desupersaturation curve obtained during batch-seeded isothermal experiments. The sim- plest of these methods was developed by Garside et al. (1982) and involves using the first two derivatives of a second order polynomial fitting of an initial portion of a desupersaturation curve at time zero [1]. It is assumed in the method that the concentration change is due only to crystal growth with no nucleation occurring. Using this analysis, the power g and constant kg of the crystal growth rate equation of Equation (2) can be obtained from the Equations of (5) and (6).
..
0 0.
0 200
2
3 T
F C C Cg
L AC
0 (5)
0
.
0
0T
g g
CK
A C
(6)
where ΔC0 is the supersaturation at time zero, and ..
0 are the first and second derivatives of the desu-persaturation curve at time zero, respectively. F is the
.
0CC
shape factor ratio and equals β/α. represents the 0L
average size of the seeds, AT0 denotes the surface area of the seeds at time zero. The derivatives
.
0 and ..
0 are usually obtained by fitting the desupersaturation curve to the 2nd order polynomial form of Equation (7)
C C
20 1 2C a a t a t
. ..
(7)
So that , , and . 0 0 0 1 0 2
However simple, results obtained from this method are quite sensitive to measurement errors since the method relies on derivatives. More sophisticated techniques for
the estimation of growth kinetics involve the use of the entire desupersaturation curve with parameter estimation techniques [14,15].
C a C a 2C a
1.4. The Population Balance Equation (PBE) Modeling Approach
The population balance provides the mathematical frame- work incorporating expressions for the various crystal formation, aggregation and disruption mechanisms to predict the final particle size distribution.
The estimation technique is based on a model for seeded and batch cooling crystallisation and optimisation method which minimizes the difference between experi- mental data and those predicted by the model. The mathematical model comprises a population balance equation for crystal size distribution and a mass balance equation which relates the total mass of crystal size dis- tribution and a mass balance equation which relates the total mass of crystals to the concentration change of the solution.
For a perfectly mixed batch crystallizer of constant volume, in which crystal breakage, agglomeration and crystal growth rate dispersion are assumed to be negligi- ble, PBE for size independent growth rate is expressed as:
( , ) ( , )0
n L t n L tG
t L
(8)
Subject to the boundary and initial conditions:
00
(0, )B
n t nG
(9)
( ,0) sn L n (10)
where ns denotes the population density distribution of the seeds, which are added at t = 0, and G0 is the growth rate of nuclei.
The mass balance models the solute concentration in the continuous phase. Since the solute concentration is one of the few parameters of crystallisation that may be measured experimentally, mass balance provides a con- nection between the model and experiment that may be used to identify kinetic model parameters for a specific system.
The mass balance is
2
0
d3
d c v n
Cdg k h G L L
t
(11)
where C is the mass of solute per mass of solvent, c is the crystal density, kv is the volume shape factor convert- ing L3 to actual crystal volume, and h is a constant factor converting solvent mass to slurry volume.
The simplified form of the energy balance for the batch crystallizer is
Copyright © 2012 SciRes. JCPT

Optimum Kinetic Parameters of Mefenamic Acid Crystallization by PBM 86
2
0
d3 d
d
( ( ))
p c c v
f
TVC H k V GnL L
t
UA T T t
(12)
where Cp is the specific heat of the slurry, ∆Hc is the heat of crystallisation, U is the overall heat transfer coefficient, V is the volume of crystallizer, A is the surface area available for heat transfer, and Tf(t) is the time dependent temperature of coolant in the jacket. Energy balance was not considered because the system is isothermal and no temperature change was observed.
The other constitutive equations required are the nu- cleation rate and the growth rate given as Equations (13) and (14):
bbB k C (13)
ggG k C (14)
with these equations the model is completely defined. The parameters kb, b, kg, g are inferred from experimental data.
The PBE 8 is solved using the method of moments. The ith moment of the PBE is defined as
0
( , ) dii n L t L L
(15)
The first four moments are required for the general batch crystallizer model.
0d
dB
t
(16)
10
d
dG
t
(17)
21
d2
dG
t
(18)
32
d3
dG
t
(19)
The initial conditions are
(0) 0i for i = 0, 1, 2, 3 (20)
C(0) = C0 (21)
T(0) = T0 (22)
The Equations (11), (16), (17), (18) and (19) can be solved using an ordinary differential solver. The source of stiffness in this system comes from the large differ-ence between the kinetic parameters. The identified pa-rameters (g, kg, b and kb) will be optimized using an op-timisation algorithm.
2. Experimental
Mefenamic acid obtained from the Aldrich Chemical Co. with purities > 99% was used in the present study. For
the estimation of the crystal growth kinetic parameters of MA recrystallized in ethyl acetate (EA), the desuper- saturation curve was obtained. The solubility data re- quired is given in Table 1.
The desupersaturation technique involves the prepara- tion of a saturated solution of known concentration in a batch crystallizer or other vessel where the temperature can be controlled and the vessel should be equipped with a stirrer. With the stirrer on, the temperature of the solu- tion is lowered (5˚C) to obtain the supersaturated solu- tion.
The solution must remain clear with no crystals pre- sent at the lower temperature. Seed crystals of the solute of known mass and size or size distribution are added to the solution. Since the solution is supersaturated, these crystals will grow, causing a decline in the concentration of the solution that is measured as a function of time. This is done by taking samples and using one of a num- ber of concentration measurement techniques. The den- sity meter was the concentration measurement method that we used.
Figure 2 shows the apparatus to measure the desuper- saturation curve online. The solution is continuously pumped from the crystallizer to a ceramic cross flow filter. Clear solution is obtained in a small side stream that returned to the crystallizer [30]. The direct meas- urement of the crystal weight change enables the overall growth rate to be determined as in Equation (2) at a par- ticular temperature, crystal size and supersaturation level. This may be correlated in terms of the operating vari- ables.
A 250 ml saturated MA-EA solution was prepared at 30˚C in a batch vessel equipped with a jacket to control the temperature and the vessel was also equipped with a stirrer. By stirring, a clear solution was obtained. After that, the temperature of the solution was lowered to 25˚C to make the solution supersaturated. The solution re- mained clear with no crystals present at the lower tem-perature and a supersaturated solution was obtained. Size distribution of the seed crystals were measured by Lasentec FBRM for calculations and added to the solu- tion. 1% seed means that 0.0034 g of seed crystal was used. Since the solution was supersaturated, crystals grew. So, a decline in the concentration of the solution was measured as a function of time. Table 1. Solubility of mefenamic acid in ethyl acetate [31].
Form I Form II
Temp (˚C) Solubility (w%) Temp (˚C) Solubility (w%)
26.17 1.04 33.26 1.97 37.93 1.59 39.66 2.50
43.45 2.13 44.95 2.91
50.62 2.74 52.20 3.59
57.74 3.46 58.06 4.18
Copyright © 2012 SciRes. JCPT

Optimum Kinetic Parameters of Mefenamic Acid Crystallization by PBM
Copyright © 2012 SciRes. JCPT
87
Figure 2. Apparatus to measure the concentration profile on line.
Samples of 2 ml were taken every minute throughout the experiment. These samples were filtered and the concentration change of the solution was measured by a densitometer. It was very difficult to measure the density because of the manual feeding of the samples into the machine. Air bubble occurrence had a negative affect on the measured density values, so the sample should be introduced without any air bubbles and intensive care was taken for achieving this result.
The density determination was based on measuring the period of oscillation of the vibrating U-shaped sample tube, which was filled with the sample liquid. The meas- uring principle of the instrument was based on the change of the natural frequency of a hollow oscillator when filled with different liquids or gases. For the de- termination of the densitometer constant, k, in Equation (23), two calibration measurements of samples of know density were necessary. Equation (23) represents the dif-ference of densities of the two samples as follow:
21 2 1 2k TP TP 2 (23)
For estimation of density of an unknown sample Equa-tion (23) is arranged as Equation (24).
2 2water waterx xk TP TP (24)
To determine the densitometer constant, k, measure- ments were done at 30˚C with air and distilled water. After a sufficient time for the proper temperature equi- librium, the period TP was read for the sample tube filled with air. Double distilled water was now introduced by
means of a syringe into the lower entrance part of the sample tube. The filling of the sample tube can be ob- served when the illumination for the sample tube is turn on. Temperature equilibrium could be conveniently fol- lowed over several read out cycles; the TP-value be- comes constant ±1, indicating complete temperature equilibrium.
TP values obtained for air and water and by using Equation (23), the k value was calculated. The calcula- tions are given below.
During the concentration measurements, some unrea- sonable results were obtained. This may be caused by the failure in introduction of the sample or the evaporation of the solvent. The solvent evaporation affects the results significantly, but it was assumed that no solvent evapora- tion occurred. Therefore, the measurements were re- peated until the results were satisfactory.
For the density meter measurements, firstly, calibre- tion should be accomplished. For this reason, the three best measurements used for the calibration curve are given in Table 2. The calculations are given below. Ta- ble 3 includes the data required for calculations. This table also shows the literature data for further calculation for the determination of crystallisation kinetics of me- fenamic acid. Table 4 has the measured and calculated values for drawing the calibration curve. The results of densities calculated are given in Table 5. Figure 3(b) represents the calibration curve of the densitometer.
To calculate the densitometer constant, k, the follow- ing calculations were done.

Optimum Kinetic Parameters of Mefenamic Acid Crystallization by PBM 88
Table 2. Concentration values of MA and EA solution to obtain calibration curve.
Weight of MA WMA
Weight of (EA) WEA
Concentration (WMA/WEA)
0.18 17 0.010588
0.16 17 0.009412
0.14 17 0.008235
Table 3. Literature data for calculations of densitometer constant and kinetics.
MWMA, kg/kmol 241.29
MWEA, kg/kmol 88.1
ρEA@ 25˚C, g/cm3 0.902
ρair@ 30˚C, g/cm3 0.00117
ρwater@ 30˚C, g/cm3 0.99565
F 4.2
ρmefenamic acid, g/cm3 1.1743
L0, µm 65.53
kv 10
h 1.2
Table 4. Measured values for the calibration curve.
TPair 1.834085
TPwater 2.550513 2
airTP 3.363868
2waterTP 6.505117
Table 5. Measured period values and calculated density values for the MA-EA solution for the calibration curve.
TPsolution 2
solutionTP ρsolution
2.487065 6.185492 0.894461 2.486788 6.184115 0.894024 2.486363 6.182001 0.893355
2 2air water air waterk TP TP
0.00117 0.99565 3.363868 6.505117 0.316589k k
After obtaining the constant, k, for the calibration curve, three sample solutions were prepared with the designated amounts given in Table 2 and by using Equa- tion (24) the solution densities were calculated as fol- lows.
2 2solution solution water waterk TP TP
solution
3solution
0.316589 6.185492 6.505117
0.99565
0.894461 g/cm
By using the density values in Table 5, to convert the density to the concentration, the calibration curve was drawn as Figure 3(b).
At the end of the experiment, a concentration vs. time curve was drawn and labled as the desupersaturation curve. Figure 3(a) shows the desupersaturation curve of MA crystals recrystallized from EA and the data is given in Table 6.
3. Results and Discussion
3.1. Garside Solution
As mentioned previously, the simple Garside Method can be used for the rough estimations of the crystallisation growth kinetic parameters, the crystal growth rate con- stant and power of the mefenamic acid crystallisation process. The effect of the growth rate power on the crys- tallisation growth rates can also be observed. By using the calibration curve (see Figure 3(b)), the decreasing concentrations of MA-EA solution were calculated and given in Table 6 previously. The desupersaturation curve was drawn and a second order polynomial equation was fitted to the experimental data as illustrated in Figure 3(a). Table 6. Concentrations of MA-EA sample solutions for the desupersaturation curve.
Time (min)
TPsample 2
sampleTP ρsample (g/cm3) Concentration
(gsol/gsolv)
0 2.491867 6.209401 0.9020 0.07622
1 2.491638 6.208260 0.9017 0.07058
2 2.491460 6.207373 0.9014 0.06634
3 2.491172 6.205938 0.9009 0.05978
4 2.491017 6.205166 0.9007 0.05640
5 2.490841 6.204289 0.9004 0.05268
9 2.490474 6.202461 0.8998 0.04534
10 2.490450 6.202341 0.8998 0.04488
11 2.490748 6.203826 0.9003 0.05076
12 2.490667 6.203422 0.9001 0.04912
13 2.490585 6.203014 0.9000 0.04750
15 2.490106 6.200628 0.8993 0.03855
16 2.489917 6.199687 0.8990 0.03529
17 2.489867 6.199438 0.8989 0.03445
18 2.489846 6.199333 0.8988 0.03410
19 2.489837 6.199288 0.8988 0.03395
20 2.489506 6.197640 0.8983 0.02872
21 2.489501 6.197615 0.8983 0.02864
22 2.489464 6.197431 0.8982 0.02808
23 2.489262 6.196425 0.8979 0.02515
24 2.489288 6.196555 0.8980 0.02552
26 2.489528 6.197750 0.8983 0.02905
29 2.489023 6.195235 0.8975 0.02190
30 2.488998 6.195111 0.8975 0.02158
31 2.489054 6.195390 0.8976 0.02231
32 2.489097 6.195604 0.8977 0.02288
34 2.488711 6.193682 0.8971 0.01803
35 2.488730 6.193777 0.8971 0.01825
Copyright © 2012 SciRes. JCPT

Optimum Kinetic Parameters of Mefenamic Acid Crystallization by PBM 89
(a)
(b)
Figure 3. Experimental Results. (a) Desupersaturation curve for MA-EA solution at 25˚C; (b) Calibration curve. For the Garside solution, the crystal growth rate power, g, was assumed as 1, 2, 2.5, 3, and 3.5 and all calculations were repeated using MathCAD. Firstly, the experimental concentration (see Table 6) values were introduced to the program. A second order line equation as a function of time was defined as Equation (25) and for the best fitting equation, an optimisation problem was solved by using MathCAD. This function was expressed as Equa- tion (26) and this objective function was minimized.
2exp 0 1 2 0 1 exp 2 exp, , ,C t a a a a a t a t (25)
2
0 1 2 exp exp 0 1 2min , , , , ,SSE a a a C C t a a a
0
(26)
Initial guess for parameters,
0 1 2
0 1 2
0, 0, 0
( , , ) 0
a a a
SSE a a a
(27)
And a0, a1, and a2 values were calculated by using MathCAD.
22 1C a t a t a
5 2 33.46 10 2.677 10 0.071C t t
2R 0.982
Now, the supersaturation at time zero and the first and
second derivatives at time zero can be calculated:
0 0 0 0.071 sol solvC a C g g
.. ..5
0 2 0
5
2 2 3.46 10
6.92 10 sol solv
C a C
g g
After that the 0TA values were calculated by assuming different g values. For each assumption, the calculated values of 0TA , the growth rate constants, Kg and kg are given in Table 7. In the following sample calculations, the growth rate constants Kg and kg calculations for g equal to 1 can be seen.
..
0 0 0.
0 200
0
5
3 2
2 50
2
3
2 4.2 0.0711
3 1.1743 65.53
0.071 6.92 10
( 2.677 10 )
25.735 cm 6.92 10
T
T
T solv
F C C Cg
L A C
A
A g
.
0
0
3
3 2
( 2.677 10 )
25.735 0.071
1.468 10 g cm min
g gTO
g
sol solv
CK
A C
K
g g
3
33
4.2 1.468 10
3 1.1743
gg g g
FKK k k
3 22.055 10 g cm ming sol solvk g g
The effect of g on linear and mass growth rates of me- fenamic acid crystals are illustrated in Figures 4(a) and (b), respectively. For linear growth rate, while the g value was increasing, there was a decrease in the linear growth rate. Also during crystallisation time, the linear growth rate was decreasing because of the decrease in the concentration difference. Table 7. The calculated crystal growth rate constants for different g values.
g 0TA (cm2/gsolv)
Kg [g/cm2 min (gsol/gsolv)]
kg [cm/min (gsol/gsolv)]
1 25.735 1.468 × 10⁻³ 2.055 × 10⁻³
2 12.879 0.041 0.029
2.5 10.305 0.194 0.109
3 8.589 0.876 0.409
3.5 7.363 3.839 1.536
Copyright © 2012 SciRes. JCPT

Optimum Kinetic Parameters of Mefenamic Acid Crystallization by PBM 90
(a)
(b)
Figure 4. Effect of g on growth rate profiles. (a) Linear growth rate; (b) The mass growth rate.
In the mass growth rate, in 5 min. intervals, while the g value was increasing, the mass growth rate is also in- creasing but after 5 min., the behaviour changed oppo- sitely. It means that when the g value is increased, a de- crease can be seen in the mass growth rate.
3.2. The Pbe Modelling Approach for Seeded and Unseeded Crystallisation
Population balance equations (PBEs) are encountered in several scientific and engineering disciplines, which mod- el complex processes where the accurate prediction of the dispersed phase play a major role for the overall be- haviour of the system. Some examples of these types of processes can be found in systems such as precipitation, crystallisation, aerosol, bubbly, droplet flows, and so on. The population balance provides the mathematical frame- work incorporating expressions for the various crystal formation, aggregation and disruption mechanisms to predict the final particle size distribution.
The estimation technique is based on a model for seeded and batch cooling crystallisation and optimisation method which minimizes the difference between experi- mental data and those predicted by the model. The PBE can be solved by different methods; in this study, the
method of moments was applied. For simulations, MathCAD and MATLAB packages were used.
The mass balance equation (Equation (11)) was de- fined as Equation (28) and the moments of equation of PBE (Equations (16)-(19)) were introduced in MathCAD and MATLAB as Equations (29)-(32). Since the experi- ment was carried out in an isothermal batch vessel, in model identification the energy balance equation was not considered in the solution. Equations (33) and (34) rep- resent the initial and boundary conditions.
* *2
d3
dg
c v gC t k h k C t C C t C tt
(28)
*0
d
d
b
bt k C t Ct (29)
*1 0
d
d
g
gt k C t C tt (30)
*2 1
d2
d
g
gt k C t Ct t (31)
*3 2
d( ) 3
d
g
gt k C t C tt (32)
In this study, the PBE modelling approach was applied for seeded and unseeded crystallisation. The zero mo- ment of the PBE reflects the nucleation rate. For seeded crystallisation, the nucleation was not considered. The zero moment was set to a high value for representing the nucleation (e.g. for g = 1, μ0 = 2.05 × 10⁵). The initial and boundary conditions for seeded crystallisation is,
0 0 for 1, 2,i i 3 (33)
0 0.07622 sol solvC g g (34)
and the initial and boundary conditions for unseeded crystallisation, as,
0 0 for 0,1, 2,i i 3 (35)
with the saturation concentration at 25˚C as 0.009888gsol/ gsolv.
The objective function of the optimisation problem was defined in Equation (36):
m odel, exp,2exp, m odel,
1 1 exp,
1( )
N Ni i
i ii i i
C CC C
N C
(36)
For the MATLAB 7.0 simulations, several initial value problem solvers were used for the ODE model and these solvers are given in Table 8. For the selection of the best algorithm, a search was carried out and the effect of time step chosen and the error calculated between the model and the experimental data (Equation (36)) can be found in Table 9 Ode23s which is Rosenbrock method was se- lected for the further calculations that give the minimum
Copyright © 2012 SciRes. JCPT

Optimum Kinetic Parameters of Mefenamic Acid Crystallization by PBM 91
Table 8. Initial value problem solvers in MatLab.
Solver Problems Applied Method
Ode45 Nonstiff differential equations Runge-Kutta
Ode23 Nonstiff differential equations Runge-Kutta
Ode113 Nonstiff differential equations Adams
Ode15s Stiff differential equations and DAEs NDFs (BDFs)
Ode23s Stiff differential equations Rosenbrock
Ode23t Moderately stiff differential equations and DAEs
Trapezoidal rule
Ode23tb Stiff differential equations TR-BDF2
Ode15i Fully implicit differential equations BDFs
Table 9. Error results for the selected solvers and ∆t.
Solver ∆t:0.001 ∆t:0.01 ∆t:0.1 ∆t:1
ode113 0.2203 0.2209 0.2643 0.2895
ode15s 0.2205 0.2211 0.2642 0.2896
ode45 0.2202 0.2209 0.2643 0.2894
ode23 0.2195 0.2201 0.2643 0.2888
ode23s 0.2192 0.2198 0.2638 0.2884
ode23t 0.2210 0.2217 0.2649 0.2903
ode23tb 0.2210 0.2215 0.2647 0.2901
errors calculated. As in the Garside solution, the growth rate power, g, was assumed as 1, 2, 2.5, 3 and 3.5 and the same growth rate constants were used. For seeded crys-tallisation, the nucleation was eliminated and the best agreement was predicted for the zero moment of the PBE. But for unseeded crystallisation, the nucleation was con- sidered and by changing the nucleation rate constant kb and power b, the best prediction was searched. The cal- culated kinetic parameters for mefenamic acid by MathCAD and the same results achieved by MATLAB are given in Table 10 for seeded and unseeded crystalli- sation of mefenamic acid. The first four moments of the PBE of mefenamic acid crystallisation calculated for unseeded crystallisation can be observed in Figure 5 graphically.
The experimental data was obtained for the seeded crystallisation. From the behaviour of the zero moment curve, the time elapsed between the unseeded and seeded crystallisation was observed as 5 minutes and this nu- cleation time was added to the model as seen in Equation (37).
Model exp 5i i
C C T (37)
As seen in Figure 6, for g = 2.5, a good agreement between the modelling predictions of Garside and PBE
and the experimental data can be observed. It can be concluded that, using the rough estimations of the growth kinetic parameters (g and kg), all kinetic parameters can be calculated more precisely by PBE modelling. Table 10. The crystallization kinetic parameters of MA obtained from two methods.
Garside Method Population Balance Modelling
Seeded Unseeded Seeded g
Kg kg b kb o
1 0.00147 0.00206 4.46 5.86E09 0.21 2.0E05 0.14
2 0.041 0.029 4.52 3.6E10 0.13 8.8E05 0.07
2.5 0.194 0.109 4.8 2.3E11 0.07 4.35E06 0.09
3 0.876 0.409 5.6 5.0E12 0.07 9.6E06 0.06
3.5 3.839 1.536 6.3 6.2E13 0.11 7.4E06 0.09
0.00
0.10
0.20
0.30
0.40
0.50
0.60
0.70
0.80
0.90
1.00
0 5 10 15 20 25 30 35
t (min)
ith m
omen
t of P
BE
5x10-20 0
4x10³ 3
8x10⁻⁴ 2
2x10-12 1
Figure 5. The first four moments of PBE of MA crystals for unseeded crystallization.
0
0.01
0.02
0.03
0.04
0.05
0.06
0.07
0.08
0 5 10 15 20 25 30 35
t (min)
conc
entra
tion,
gso
l / g s
olv
Model UnseededModel SeededGarsideExperimental
Figure 6. The agreements of the Garside and the PBE mod-eling approach to the experimental data.
Copyright © 2012 SciRes. JCPT

Optimum Kinetic Parameters of Mefenamic Acid Crystallization by PBM
Copyright © 2012 SciRes. JCPT
92
3.3. Optimum Kinetic Parameters Table 11. Optimum Kinetic Parameters obtained by the solution of optimization problem.
The modelling data predicted by both methods and the experience gained can now serve as good initial values for the prediction of the optimal kinetic parameters. The Fminsearch algorithm was used in MATLAB 7.0 for the solution of the optimisation problem and predicted re- sults are given in Table 11. The agreements can be seen in Figures 7(a) and (b) for seeded and unseeded crystal- lisation of mefenamic acid in EA respectively.
Kinetic Parameter Seeded Unseeded
0 7.20 × 10⁵ 0
b 9.220 8.160
kb 7.20 × 10⁵ 5.71 × 10¹²
g 1.752 2.029
kg 0.016 0.198
0.0662 0.0708
(a)
(b)
Figure 7. Optimum kinetic parameters’ model-experimental data fit for (a) seeded crystallization; (b) unseeded crystalliza-tion.

Optimum Kinetic Parameters of Mefenamic Acid Crystallization by PBM 93
4. Conclusions
The development and operation of industrial crystallisa- tion processes can be made significantly easier if some data on the kinetics of crystal growth are available. This information can be incorporated in process models, can be used in process and crystallizer design, and can shed light on the observed behaviour of the system. The estimation of the crystallisation kinetics parameters is very important for controlling crystallisation and obtaining desired products with suitable size, shape and polymorphic form. To determine the kinetic parameters, two methods were chosen, the desupersaturation curve technique (Garside model) and the PBE modelling approach. Because both methods require the desupersaturation curve, a concen- tration versus time profile during crystallisation and the experiments to obtain the concentration profile were car- ried out.
Mefenamic acid is crystallized in ethyl acetate solvent in an isothermal batch crystallizer with seed crystals. The density of the sample taken every minute is measured by the densitometer. For the densitometer, the device con- stant was firstly calculated by calibration of the machine with air and distilled water as 0.316589. By using the calibration curve obtained, the concentration values are calculated from the density measurements and a profile as a function of time is drawn. Firstly, the desupersatura- tion curve technique with the solution of the Garside method for the estimation of the growth kinetics can be used for quick estimation of kinetic parameters to design the process and modelling purposes, because the experi- ments are fast and the data is easy to obtain, but they do not supply very accurate kinetics data. Also it is very sensitive to experimental conditions and errors. In the Garside solution, g values are assumed as 1, 2, 2.5, 3 and 3.5 and 0TA values and the mass growth rate constants, Kg are calculated. These values are a set of good initial estimates for the PBE modelling approach. The second method is the PBE modelling approach for seeded and unseeded crystallisation of mefenamic acid. The pa-rameters of the nucleation and growth rates have been successfully estimated for Mefenamic Acid using non-lin- ear optimisation. MathCAD and MATLAB packages were used for the simulations and several algorithms, explicit methods and implicit methods, were applied for the solu-tion of the ODE set but not a significant difference ob-served. Both the Garside and the PBE modelling ap-proach were compared and it can be concluded that both methods are in good agreement with the experimental data as desired. The parameters estimated from both methods, then, serve initial values for the optimisation problem and the optimum kinetic parameters for un-seeded and seeded mefenamic acid crystallization in a batch crystallizer are obtained. The effect of agglomera-
tion and breakage on the PBE model will be researched as the next step.
5. Acknowledgements
The experimental work of this research was carried out by my master student Sevilay Gökbel at the Illinois In- stitute of Technology, Laboratory of Crystallisation, un- der the supervision of Prof. Dr. Allan S. Myerson. I am very grateful to Sevilay Gökbel and Prof. Dr. Allan S. Myerson.
REFERENCES [1] J. Garside, “Evaluation of Crystal Growth Kinetics from a
Desupersaturation Curve Using Initial Derivatives,” Chemi- cal Engineering Science, Vol. 37, No. 11, 1982, pp. 1625- 1628. doi:10.1016/0009-2509(82)80031-6
[2] S. Cesur and S. Gokbel, “Crystallization of Mefenamic Acid and Polymorphs,” Crystal Research and Technology, Vol. 43, No. 7, 2008, pp. 720-728. doi:10.1002/crat.200711119
[3] S. Gokbel, “Crystallisation Kinetics of Mefenamic Acid and Polymorphisim,” Master’s Thesis, Ege University Bornova, 2006.
[4] S. Gokbel and S. Cesur, “1024-Crystallization Kinetics of Mefenamic Acid and Polymorphism,” CHISA-2006, 17th International Congress of Chemical and Process Engi-neering, Praha, 27-31 August 2006, pp. 1-20.
[5] S. Bhadra, M. Kumar, S. Jain, S. Agrawal and G. P. Agrawal, “Spherical Crystallisation of Mefenamic Acid,” Pharmaceutical Technology, 2004, pp. 66-76.
[6] R. Panchagnula, P. Sundaramurthy, O. Pillai, S. Agrawal and Y. A. Raj, “Solid State Characterization of Mefenamic Acid,” Journal of Pharmaceutical Sciences, Vol. 93, No. 4, 2004, pp. 1019-1029. doi:10.1002/jps.20008
[7] A. Adam, L. Schrimpl and P. C. Schmidt, “Some Phys- icochemical Properties of Mefenamic Acid,” Drug De-velopment and Industrial Pharmacy, Vol. 26, No. 5, 2000, pp. 477-487.
[8] S. Romero, B. Escalera and P. Bustamante, “Solubility Behavior of Polymorphs I and II of Mefenamic Acid in Solvent Mixtures,” International Journal of Pharmaceu- tics, Vol. 178, No. 2, 1999, pp. 193-202. doi:10.1016/S0378-5173(98)00375-5
[9] S. Cesur, S. Gokbel and C. Yaylaci, “Optimum Crystalli- zation Kinetic Parameters of Mefenamic Acid,” 18th In- ternational Symposium on Industrial Crystallization, Zu-rich, 12-17 September 2011, pp. 1-4. http://www.aidic.it/isic18/webpapers/221Cesur.pdf
[10] O. Monnier, G. Fevotte, C. Hoff and J. P. Klein, “Model Identification of Batch Cooling Crystallisations through Calorimetry and Image Analysis,” Chemical Engineering Science, Vol. 52, No. 7, 1997, pp. 1125-1139. doi:10.1016/S0009-2509(96)00482-4
[11] Y. Qiu and A. C. Rasmuson, “Estimation of Crystallisa- tion Kinetics from Batch Cooling Experiments,” AIChE Journal, Vol. 40, No. 5, 1994, pp. 799-812.
Copyright © 2012 SciRes. JCPT
Optimum Kinetic Parameters of Mefenamic Acid Crystallization by PBM 94
doi:10.1002/aic.690400507
[12] A. G. Jones, J. Budz and J. W. Mullin, “Batch Crystalli- sation and Solid-Liquid Separation of Potassium Sulphate,” Chemical Engineering Science, Vol. 42, No. 4, 1987, pp. 619-629. doi:10.1016/0009-2509(87)80023-4
[13] S. M. Miller and J. W. Rawlings, “Model Identification and Control Strategies for Batch Cooling Crystallizers,” AIChE Journal, Vol. 40, No. 8, 1994, pp. 1312-1327. doi:10.1002/aic.690400805
[14] Y. Qui and A. C. Rasmuson, “Nucleation and Growth of Succinic Acid in a Batch Cooling Crystallizer,” AIChE Journal, Vol. 37, No. 9, 1991, pp. 1293-1304. doi:10.1002/aic.690370903
[15] Y. Qui and A. C. Rasmuson, “Crystal Growth Rate Pa- rameters from Isothermal Desupersaturation Experiments,” Chemical Engineering Science, Vol. 46, No. 7, 1991, pp. 1659-1667. doi:10.1016/0009-2509(91)87013-3
[16] M. Bohlin and A. C. Rasmuson, “Modeling of Growth Rate Dispersion in Batch Cooling Crystallisation,” AIChE Journal, Vol. 38, No. 12, 1992, pp. 1853-1863. doi:10.1002/aic.690381202
[17] N. Doki, N. Kubota, A. Sato, M. Yokota, O. Hamada and F. Masumi, “Scale up Experiments on Seeded Batch Cooling Crystallisation of Potassium Alum,” AIChE Jour- nal, Vol. 45, No. 12, 1999, pp. 2527-2533. doi:10.1002/aic.690451208
[18] H. A. Mohameed, B. Abu-Jdayil and M. Al Khateeb, Effect of Cooling Rate on Unseeded Batch Crystallisation of KCl,” Chemical Engineering and Processing, Vol. 41, No. 4, 2002, pp. 297-302. doi:10.1016/S0255-2701(01)00145-3
[19] S. Rohani, A. Tadayon and M. K. Bennett, “Estimation of Nucleation and Growth Kinetics of Ammonium Sulfate from Transients of a Cooling Batch Seeded Crystallizer,” Industrial and Engineering Chemistry Research, Vol. 41, No. 24, 2002, pp. 6181-6193. doi:10.1021/ie020163r
[20] H. A. Mohameed, N. Abdel-Jabbar, K. Takrouri and A. Nasr, “Model-Based Optimal Cooling Strategy for Batch Crystallisation Processes,” Chemical Engineering Research and Design, Vol. 81, No. 5, 2003, pp. 578-584.
doi:10.1205/026387603765444528
[21] Q. Hu, S. Rohani, D. X. Wang and A. Jutan, “Nonlinear Kinetic Parameter Estimation for Batch Cooling Seeded Crystallisation,” AIChE Journal, Vol. 50, No. 8, 2004, pp. 1786-1794. doi:10.1002/aic.10163
[22] Q. Hu, S. Rohani, and A. Jutan, “Modelling and Optimi- zation of Seeded Batch Crystallizers,” Computers and Chemical Engineering, Vol. 29, No. 4, 2005, pp. 911- 918. doi:10.1016/j.compchemeng.2004.09.011
[23] Y. Liu, J. K. Wan and H. Y. Wei, “Determination of Crystallisation Kinetics in Solution,” Journal of Crystal Growth, Vol. 271, No. 1-2, 2004, pp. 238-244. doi:10.1016/j.jcrysgro.2004.07.037
[24] Q. Hu, S. Rohani and A. Jutan, “Modelling and Optimisa- tion of Seeded Batch Crystallizers,” Computers and Chemi- cal Engineering, Vol. 29, No. 4, 2005, pp. 911-918. doi:10.1016/j.compchemeng.2004.09.011
[25] H. A. Mohameed, B. Abu Jdayil and K. Takrouri, “Sepa- ration of Para-Xylene from Xylene Mixture via Crystalli- sation,” Chemical Engineering and Processing, Vol. 46, No. 1, 2007, pp. 25-36. doi:10.1016/j.cep.2006.04.002
[26] J. W. Mullin, “Crystallization,” 4th Edition, Butterworth Heinemann, Oxford, 2001.
[27] J. Nývlt, O. Sohnel, M. Matuchova and M. Broul, “The Kinetics of Industrial Crystallisation,” Elsevier, Amster-dam, 1985.
[28] N. S. Tavare, “Batch Crystallizers: Review,” Chemical Engineering Communications, Vol. 61, No. 1-6, 1987, pp. 259-318. doi:10.1080/00986448708912042
[29] J. Nývlt, “Kinetics of Crystallisation in Solution,” Jour- nal of Crystal Growth, Vol. 3-4, 1968, pp. 377-383. doi:10.1016/0022-0248(68)90179-6
[30] A. S. Myerson and R. Ginde, “Crystals, Crystal Growth and Nucleation,” In: A. S. Myerson, Ed., Handbook of In- dustrial Crystallisation, 2nd Edition, Butterworth Heine- mann, London, 2002, pp. 33-63.
[31] K. Park, J. M. B. Evans and A. S. Myerson, “Determina- tion of Solubility of Polymorphs Using Differential Scan- ning Calorimetry,” Crystal Growth and Design, Vol. 3, No. 6, 2003, pp. 991-995. doi:10.1021/cg0340502
Copyright © 2012 SciRes. JCPT

Optimum Kinetic Parameters of Mefenamic Acid Crystallization by PBM 95
Nomenclature
Symbol Description Unit
A = Surface area of the crystals [cm2]
AT = Surface area of the seeds [cm2/gsolv]
a = Mean distance between growth units in the crystal
[µm]
B = Nucleation rate [no./m3s]
Bs = Nucleation rate [gsol/gsolv sec]
C = Concentration [g/L]
∆C = Concentration driving force [gsol/gsolv] .
C
and ..
C
= First and second derivatives of the desupersaturation curve
[gsol/gsolv]
ceq = Equilibrium concentration of a saturated solution
[particle/ml]
Cp = The specific heat of the slurry [kJ/kg ˚C]
d = The average distance between adsorbed species in the boundary layer
[µm]
D = Diffusion coefficient [cm2/sec]
E = Activation energy of growth process
[kJ/mol]
F = Shape factor ratio [gsol/gsolv]
G = Linear growth rate [length/time]
h = Step height [µm]
hi = The distance of the ith plane from the centre of the crystal
[µm]
H = Enthalpy [kJ/kg]
kv = Volume shape factor [-]
ka = Surface shape factor [-]
kb Nucleation rate constant
k = Boltzmann constant [erg/particle K]
kg = Linear growth rate constant [cm/min(gsol/gsolv)]
Kg = Mass growth rate constant [g/min(gsol/gsolv)]
L = Size of cluster [µm]
0L
= Average size of the seeds [µm]
l = Linear rate of face growth perpendicular to the surface
[µm/sec]
MW = Molecular weight [g/mol]
MT = Suspension density [gcrystal/gsolv]
n = Population density
n* = The solute particle numbers
R = Overall growth rate [g/cm2sec]
r = Radius of cluster [µm]
r* = Critical radius of a solute [µm]
Rg = Universal gas constant kJ/mol K
s = Number of cooperating spirals on the surface
[-]
T = Temperature K, ˚C
t = Time [min]
U = Overall heat transfer coefficient [kJ/m2 s]
V = Volume of the crystallizer [m3]
Vm = Molecular volume [µm3]
W = Weight of crystals [g/gsolv]
σ =
=
The specific energy of ith plane
Supersaturation (ΔC-1)
[erg/particle]
[-]
γ = Interfacial free energy [erg/particle]
μk = kth moment of the crystal size distribution
[no cmk/(gsolv)]
δ = Thickness of the diffusion layer n the crystal surface
[µm]
Ω = Volume of the growth particle in the crystal
[ml]
t = time [sec]
u = Step velocity [length/time]
ρ = Density [g/cm3]
g = Growth power [-]
b = Nucleation power [-]
Symbols
0 = Time zero
Δ = Difference
c = Crystal
j = Number of moment
β = Area shape factor
s = Seed
α = Volume shape factor
Copyright © 2012 SciRes. JCPT