Embed Size (px)
Citation preview

Scientia Iranica E (2017) 24(6), 3394{3408
Sharif University of TechnologyScientia Iranica
Transactions E: Industrial Engineeringwww.scientiairanica.com
Optimizing reliability and cost of system for aggregateproduction planning in a supply chain
M. Ramyara, E. Mehdizadehb;� and S.M. Hadji Molanaa
a. Department of Industrial Engineering, College of Engineering, Tehran Science and Research Branch, Islamic Azad University,Tehran, Iran.
b. Faculty of Industrial and Mechanical Engineering, Qazvin Branch, Islamic Azad University, Qazvin, Iran.
Received 25 January 2016; received in revised form 9 September 2016; accepted 3 October 2016
KEYWORDSAggregate productionplanning;Supply chainmanagement;Reliability;Multi-objectiveharmony;NSGA-II & NRGA.
Abstract. In this paper, the researchers present a multi-objective model for multi-product, multi-site aggregate production planning model in a supply chain. The goals are tominimize the total cost of the supply chain, including inventory costs, manufacturing costs,work force costs, hiring and �ring costs, and also to maximize the minimum of suppliers'reliability by considering probabilistic lead times to simultaneously improve the systemperformance. Since the problem is NP-Hard, a Pareto-based multi-objective harmonysearch algorithm is proposed. To demonstrate the performance of the presented algorithm,a Non-dominated Sorting Genetic Algorithm (NSGA-II) and a Non-dominated RankingGenetic Algorithm (NRGA) are applied. The results demonstrate the robustness of theproposed algorithm to probe the Pareto solutions.
© 2017 Sharif University of Technology. All rights reserved.
1. Introduction
A supply chain is a set of di�erent parties, includingsuppliers, manufacturers, people, distribution centers,transportation channels, etc. in which each �rm hasa speci�c role in transforming raw materials to endproducts with regard to costumers' demand. In re-cent years, improvement in globalization, competition,integration, etc. has channelized �rms to concentrateon the entire members involved in the supply chain,in addition to their individual production plans. Con-necting all members of a supply chain together and pro-viding production planning based on the relationships
*. Corresponding author. Tel/Fax: +98 28 33670051E-mail addresses: [email protected] (M. Ramyar);[email protected] (E. Mehdizadeh); [email protected](S.M. Hadji Molana)
doi: 10.24200/sci.2017.4398
between the �rms is one of the most important issueswhich can be conducted by Supply Chain Management(SCM). In other words, SCM should be able to planall the activities involved in producing a product fromsuppliers to costumers in a supply chain. Inappropriatemanagement of a supply chain leads to the bankruptcyof the members and failure in global competitions.One of the medium-range planning in the SCM, whichincludes a time horizon from 3 to 18 months, is Aggre-gate Production Planning (APP) in which aggregatedproducts are considered instead of individual products.APP, as a technical level planning, attempts to de-termine the optimal quantity of production, inventorylevel, workforce, etc. in each period with regard tosome constraints to satisfy the uncertain demand ofall products [1]. The result of APP can be used asa base for other plans such as Capacity RequirementsPlanning (CRP), Master Production Schedule (MPS),and Material Requirements Planning (MRP) [2]. Ina systematic view of APP, one can introduce capacity

M. Ramyar et al./Scientia Iranica, Transactions E: Industrial Engineering 24 (2017) 3394{3408 3395
Figure 1. Inputs and outputs of APP process.
constraints, demands, and �rm's policies and strategiesas inputs of APP and determine the production levels,inventory levels, workforce levels, subcontracting, etc.as outputs of the system depicted in Figure 1.
Based on a number of the objective function, con-sidered in the models, the APP models can be classi�edinto two following categories: single-objective functionproblems and multi-objective function problems. Acommon objective function in the APP models is tominimize the total cost of the system. In addition,maximization of service level, minimization of changingof work force level, and minimization of the risk areother objective functions which can be considered.
Over the last decades, numerous single-objectiveAPP models have been studied in the research studies.Various models have been developed to solve the APPproblem since Holt et al. [3] presented HMMS (Holt,Modigliani, Muth and Simon) rule. Bergstrom andSmith [4] generalized the HMMS approach for multi-product system. Oh and Karimi [5] developed a multi-product supply chain planning model with a drawback.Guillen et al. [6] discussed a mixed-integer linearprogramming model for tactical planning of multi-product supply chains.
All the above mentioned research studies dis-cussed a single-objective APP model which tried tominimize the total cost, while the other objective func-tions can be considered in APP models. In other words,in the practical APP model, con icting objectivefunctions can be considered [7]. Wang and Liang [8]proposed a multi-objective APP model including mini-mizing the total costs, carrying and backordering costs,and changing workforce level in a fuzzy environment.Leung and Chan [9] proposed a multi-objective APPmodel which attempted to maximize pro�t, minimizerepairing costs, and maximize machine utilization re-garding di�erent operational constraints. Baykasogluand Gocken [10] used a direct solution method basedon ranking methods of fuzzy numbers and Tabu searchto solve fuzzy multi-objective aggregate productionplanning problem. Mirzapour Al-e-Hashem et al. [1]proposed a multi-objective mixed integer nonlinear
programming model to deal with APP considering twocon icting objectives simultaneously as well as theuncertain nature of the supply chain. Mirzapour Al-e-Hashem et al. [11] introduced a multi-objective model,including minimizing the total cost, maximizing theservice level, and maximizing workers' productivity,to deal with a multi-period, multi-product and multi-site aggregate production planning problem under un-certainty. Sadeghi et al. [12] considered minimizingthe total costs, carrying and backordering costs, andrate of changes in workforce level simultaneously by amulti-objective model for aggregate planning and useda goal programming approach to solve the proposedmodel. Rodger [13] used real-world data to determinethe structure of a Bayesian network. In this research,stochastic simulation based on Markov blankets wasused to determine the distribution of backorders andcustomer wait time in supply chains. Fuzzy logic wasemployed to produce a funnel diagram, demonstratingthat the Acquisition Advice Code, Acquisition MethodSu�x Code, Acquisition Method Code, and ControlledInventory Item Code backorder performance metric ofa trigger group dimension might change dramaticallywith variations in ALT, PLT, unit price, quantityordered, and stock. Rodger et al. [14] reported onthe results of fuzzy induced linguistic ordered weightedaveraging for group decision support evaluation ofbackorder risk triggers to ensure that equipment isavailable and fully operational when needed. Riskfactors were identi�ed, the impact importance andprobability metric performance ratings were deter-mined via induced linguistic ordered weighted averag-ing, and a risk mitigation strategy was used to identifyand predict Supply Chain Backorder Risk Triggers(SCBORT). Finally, they presented supply chain riskas a probability/impact matrix. Ramanathan [15]studied several supply chain management initiativessuch as vendor-managed inventory, continuous replen-ishment, and Collaborative Planning Forecasting andReplenishment (CPFR) that had been previously pro-posed in the literature to improve the performance ofsupply chains. In this research, collaborative perfor-mance measurement acts as a testing tool to identifya helping environment to collaborate by pinpointingareas requiring improvements before initializing col-laboration. Gholamian et al. [16] proposed a fuzzymulti-objective mixed-integer nonlinear programming(FMOMINLP) to address a comprehensive multi-site,multi-period and multi-product Aggregate ProductionPlanning (APP) problem under uncertainty. Theydeveloped a fuzzy programming method to solve thepresented model. Finally, the e�ciency of the modelwas investigated by a real industry SC case study.Pasandideh et al. [17] proposed a bi-objective opti-mization of a multi-product, multi-period three-echelonsupply-chain-network problem. To bring the problem

3396 M. Ramyar et al./Scientia Iranica, Transactions E: Industrial Engineering 24 (2017) 3394{3408
closer to reality, the majority of the parameters in thisnetwork were considered stochastic. The problem was�rst formulated into the framework of a single-objectivestochastic mixed integer linear programming model.Then, it was reformulated into a bi-objective deter-ministic mixed-integer nonlinear programming model.To solve the complicated problem, a Non-dominatedSorting Genetic Algorithm (NSGA-II) was utilized andNon-dominated Ranking Genetic Algorithm (NRGA)was used to validate the results obtained. Pasandidehet al. [18] investigated a bi-objective optimization of amulti-product multi-period three-echelon supply chainnetwork consisting of manufacturing plants, Distribu-tion Centers (DCs) with uncertain services for each oneand customer nodes. The two objectives were the min-imization of the total cost, while minimization of theaverage number of products dispatched to customerswas followed by considering reliability indices assumedfor the distribution centers. Rooeinfar et al. [19]proposed a new Supply Chain Network, and two novelhybrid algorithms were developed to solve the model.Each hybrid algorithm integrates the simulation tech-nique with two metaheuristic algorithms, including theGenetic Algorithm (GA) and the Simulated AnnealingAlgorithm (SAA), namely HSIM-META. Computa-tional results show that the proposed HSIM-METAhas suitable accuracy and speed for use in real-worldapplications. Entezaminia et al. [20] proposed a multi-objective, multi-period, multi-product and multi-siteAggregate Production Planning (APP) model in agreen supply chain considering a Reverse Logistic (RL)network. In this model, minimizing the total lossesand maximizing total environmental scores of productswere the objective functions. They demonstrated thetrade-o� between the con icting objective functions bya set of Pareto-optimal solutions as generated by theLP-metrics method.
It is obvious that in a chain with various suppliers,producing the raw material for manufacturers can bedone in di�erent ways. But, delivery time of the suppli-ers is not precise, and it is possible that delays occur inshipment of materials from suppliers to manufacturers.Hence, considering probabilistic lead time is morerealistic. This lead time can be a measure for de�ningthe reliability of suppliers, and consideration of theirreliability can in uence manufacturers' production. Inother words, the selection of suppliers that maximizesthe reliability of the whole system can be considered asanother objective function in this paper.
Based on the complexity of the APP problems andthe proposed problem associated with non-linear mixedinteger programming models, using the exact or hard-computing methods will be time-consuming, especiallywhen the problem size increases [21]. This is proof ofwhy we propose a meta-heuristic algorithm method tosolve the proposed problem. Among multi-objective
algorithms, a widely used Pareto-based algorithm isan extended version of a Genetic Algorithm (GA)for multi-objective problems, called Non-dominatedSorting Genetic Algorithm (NSGA-II) proposed byDeb et al. [22]. This algorithm can be used in di�erentscopes of operational management. Harmony SearchAlgorithm (HSA), as a music-inspired algorithm, issimple in concept and has just a few parameters. Itis easy to be implemented and has been successfullyapplied to di�erent problems including the mechanicalstructure design [23], pipe network optimization [24],and inventory models [25].
In this paper, a multi-objective model consideringa multi-period, multi-product, and multi-site aggregateproduction planning problem is developed. The �rstobjective function is minimizing the sum of the totalcost in the supply chain, and the second one, consideredas a contribution, includes improving the performanceof the system through maximizing the minimum sup-pliers' reliability by considering probabilistic lead timesnot discussed in the literature of multi-objective APPmodels. With regard to the complexity of the proposedAPP model, we present a Multi-Objective HarmonySearch Algorithm (MOHSA) and compare its resultswith those of the Non-dominated Sorting Genetic Algo-rithm (NSGA-II) and Non-dominated Ranking GeneticAlgorithm (NRGA) as the best-developed Pareto-basedapproaches in the literature.
The rest of this paper is organized as follows:A mathematical formulation of the proposed multi-objective APP problem is presented in Section 2. Thesolution procedure and parameter tuning are proposedin Sections 3 and 4, respectively. Section 5 provides theresult analysis and comparisons. Finally, conclusionand suggestion for future research are presented inSection 6.
2. Problem formulation
The proposed APP problem in a supply chain canbe described as follows: there are S suppliers, Jmanufacturers, and C customers, as shown in Fig-ure 2. Each supplier can produce several items withregard to its capacity constraint and transport themto the manufacturers. Each manufacturer is able toproduce several products according to the needed rawmaterials provided by suppliers and subcontracting isallowed for the manufacturer. There is a restrictedavailable time for manufacturing. For each supplierand manufacturer, the production cost of each item canbe di�erent. The warehouse capacity of manufacturersfor raw materials and end products is limited. Theproduced end products are transported to costumers'zones regarding their demands. Based on geographicaldistribution of supply chain's members, including sup-pliers, manufacturers, and costumers in an area, the

M. Ramyar et al./Scientia Iranica, Transactions E: Industrial Engineering 24 (2017) 3394{3408 3397
Figure 2. Supply chain con�guration.
transportation time between them can vary. Shortagecan occur for each product. The probabilistic leadtime for transporting raw materials from suppliersto manufacturers is considered, and the reliability ofsuppliers in delivering materials can be computed basedon this de�nition. In other words, a supplier is reliableif he can transport the needed raw materials to amanufacturer in a prede�ned duration time.
This paper models the APP problem as a bi-objective programming with the following objectivefunctions:
1. Minimizing the total cost of supply chain;
2. Maximizing performance level by maximizing relia-bility in supplier selection process.
2.1. NotationsThe parameters in this model are as follows:
Dict : Demand of product i (1; 2; :::; I) indemand point c (1; 2; :::; C) in period t(1; 2; :::; T )
Cqj : Production cost per hour in regulartime (q = 1), overtime (q = 2), andsubcontracting (q = 3) at factory j(1; 2; :::; J)
Ljt : Manpower cost of labors at factory jin period t
aij : Production time of product i at factoryj
Fjt : Firing cost of workers at factory j inperiod t
Hjt : Hiring cost of workers at factory j inperiod t
I1mjt : Inventory holding cost for raw materialm (1; 2; :::;M) at factory j in period t
I2ijt : Inventory holding cost for �nishedproduct i at factory j in period t
I3ict : Inventory holding cost for �nishedproduct i in costumer's zone c inperiod t
T1sjt : Transportation cost for supplier s(1; 2; :::; S) to factory j in period t
T2ict : Transportation cost from factory j todemand point c in period t
Crsmt : Cost of raw material m provided bysupplier s in period t
im : Number of units of raw material mrequired for each unit of product i
�t : Fraction of the workforce variationallowed in period t
� : Productivity of labors (0 � � � 1)
TIqjt : Available regular time (q = 1),overtime (q = 2), and capacity ofsubcontracting (q = 3) in terms of timeunit at factory j in period t
P1j : Raw material storage capacity atfactory j
P2j : End product storage capacity atfactory j
P3c : End product storage capacity incustomer's zone c
P4smt : Maximum number of raw material msupplier s could be provided in periodt
3398 M. Ramyar et al./Scientia Iranica, Transactions E: Industrial Engineering 24 (2017) 3394{3408
LTsj : Probabilistic lead time for shippingraw material from supplier s to factoryj
'LT : Maximum acceptable lead time ofsupplier for being reliable
LTjc : Lead time required for shipping endproducts from factory j to demandpoint c
�ict : Shortage cost of product i in customer'szone c in period t
TC : Total Cost of supply chairsj = P (LTsj < 'LT ): Reliability of supplier s forproviding required raw materials of factory j
Decision variables
Xijqt Number of product i produced atfactory j using method q in period t
XLjt Number of workers at factory j inperiod t
XFjt Number of workers at factory j �red inperiod t
XHjt Number of workers at factory j hiredin period t
XMmjt Inventory level of raw material m atfactory j at the end of period t
XPijt Inventory level of end product i atfactory j in period t
XIict Inventory level of end product i incustomer's zone c in period t
XSsmjt Number of units of raw material mshipped from supplier s to factory j
Y Sijct Number of units of end product iprovided by factory j for demand pointc in period t
zsjt One if supplier s provides at least oneof the raw materials for factory j inperiod t; 0 otherwise
Bict Shortage of product i in demand pointc in period t
O One if the total cost of the supplychain is violated from a pre-speci�edvalue (); 0 otherwise.
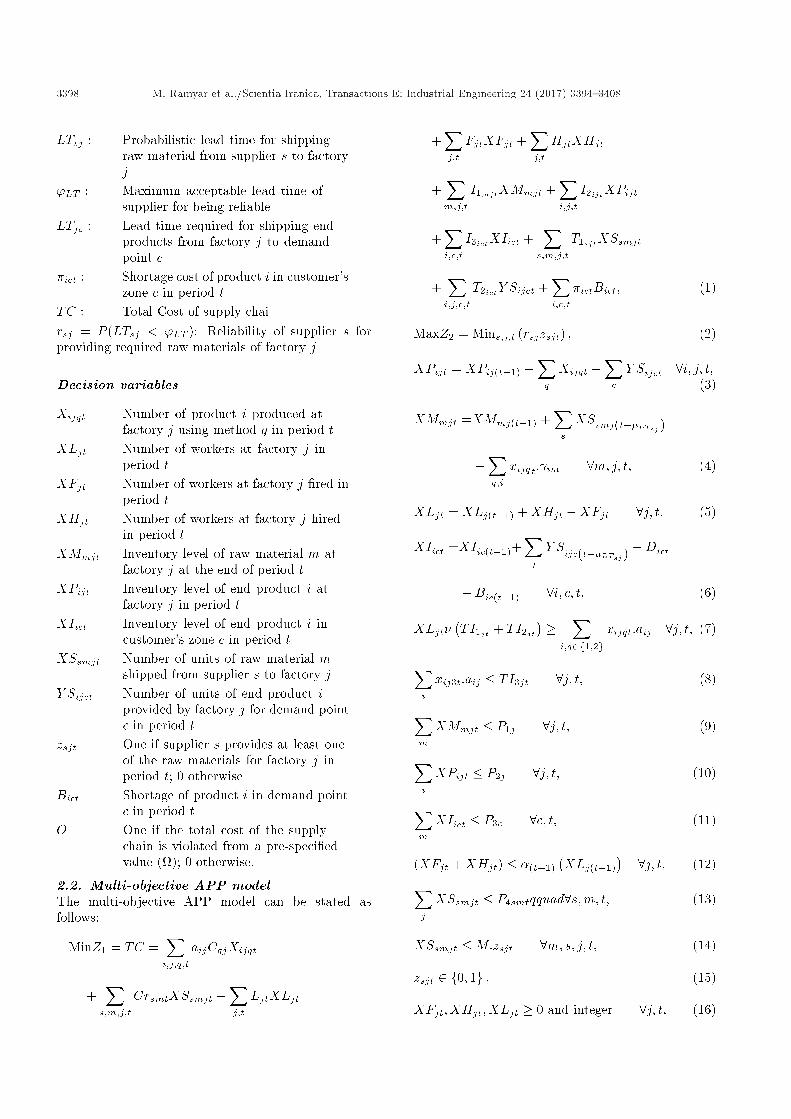
2.2. Multi-objective APP modelThe multi-objective APP model can be stated asfollows:
MinZ1 = TC =Xi;j;q;t
aijCqjXijqt
+Xs;m;j;t
CrsmtXSsmjt +Xj;t
LjtXLjt
+Xj;t
FjtXFjt +Xj;t
HjtXHjt
+Xm;j;t
I1mjtXMmjt +Xi;j;t
I2ijtXPijt
+Xi;c;t
I3ictXIict +Xs;m;j;t
T1sjtXSsmjt
+Xi;j;c;t
T2ictY Sijct +Xi;c;t
�ictBict; (1)
MaxZ2 = Mins;j;t (rsjzsjt) ; (2)
XPijt = XPij(t�1) +Xq
Xijqt �Xc
Y Sijct 8i; j; t;(3)
XMmjt =XMmj(t�1) +Xs
XSsmj(t��LTsj )
�Xq;i
xijqt: im 8m; j; t; (4)
XLjt = XLj(t�1) +XHjt �XFjt 8j; t; (5)
XIict =XIic(t�1)+Xj
Y Sijc(t��LTsj ) �Dict
�Bic(t�1) 8i; c; t; (6)
XLjt��TI1jt + TI2jt
� � Xi;q2f1;2g
xijqt:aij 8j; t; (7)
Xi
xij3t:aij � TI3jt 8j; t; (8)
Xm
XMmjt � P1j 8j; t; (9)
Xi
XPijt � P2j 8j; t; (10)
Xm
XIict � P3c 8c; t; (11)
(XFjt +XHjt) � �(t�1)�XLj(t�1)
� 8j; t; (12)Xj
XSsmjt � P4smtqquad8s;m; t; (13)
XSsmjt �M:zsjt 8m; s; j; t; (14)
zsjt 2 f0; 1g ; (15)
XFjt; XHjt; XLjt � 0 and integer 8j; t; (16)

M. Ramyar et al./Scientia Iranica, Transactions E: Industrial Engineering 24 (2017) 3394{3408 3399
Xijqt;XSjsmt; XMmjt; XPijt; Y Sijct; Bict; XFjt;
XHjt; XLjt � 0 8i; j; c; s;m; t: (17)
In this model, Eq. (1) denotes the �rst objectivefunction aiming to minimize the total cost of the supplychain including production cost of manufacturers andsuppliers, workforce hiring and �ring costs, inventorycosts, transportation costs, and shortage costs. Thesecond objective function (Eq. (2)) attempts to improveperformance level through maximizing the minimumof suppliers' reliability. In this function, it should beconsidered that the minimization operator is de�ned forfs; jjzsjt = 1g. By this consideration, the system triesto con�rm a balance in supplier selection problems.Eqs. (3) and (4) are balance constraints for inventoryof end product and raw material, respectively. Eq. (5)ensures the workforce level balance. An inventorybalance equation of demand point c is considered inEq. (6). Eq. (7) guarantees that for each manu-facturer, the sum of regular time and overtime withregard to productivity of workforce limits the availableproduction time. Eq. (8) is a subcontracting constraint.Eqs. (9) to (11) limit the raw material, end product in-ventory levels of manufacturers, and costumer zones' totheir related inventory storage capacities, respectively.Eq. (12) limits the change in workforce level by theproportion of workers in the previous period. Eq. (13)restricts the amount of shipments from supplier s bythe supplier capacity. Eq. (14) ensures that if suppliers provides at least one of the raw materials for factoryj in period t, its related binary variable (zsjt) must beone. Eqs. (15)-(17) denote variable types.
3. The solution procedures
Pareto-based approaches have been widely used inresearch studies, especially in order to solve compli-cated models. Based on NP-hardness of aggregateproduction planning, we present a multi-objectivePareto-based meta-heuristic algorithm called MOHSAand compare it with two based-developed ones in theliterature, NSGA-II and NRGA, which are describedin this section.
A multi-objective problem consists of some con- icting objectives f(~x) = [f1(~x); :::; fm(~x)] with regardto some constraints gi(~x) � 0, i = 1; 2; :::; c, ~x 2 Xwhere ~x denotes n-dimensional vectors and X is thefeasible region. For a minimization model, we say thatsolution ~a dominates solution ~b(~a;~b 2 X) if:
1. fi(~a) � fi(~b); 8i = 1; 2; :::;m and;
2. 9 i 2 f1; 2; :::;mg : fi(~a) < fi(~b).
There are some solutions that cannot dominate eachother. The set of these solutions is called Paretosolutions set or Pareto front. Pareto-based algorithms
try to �nd the optimal front during the evolutionprocess, which is achieved in the last iteration ofalgorithm. This front is expected to have the mostconvergence and the highest diversity [22].
3.1. The MOHSAIn HSA, the objective function is interpreted as har-mony, and aesthetic estimation of the player helpshim/her to �nd good state of the harmony. Indeed, inthis algorithm, the qualitative improvisation process isturned into quantitative optimization process. There-fore, in this paper, multi-objective version of HSAis developed and presented to the literature of APP.The details of MOHSA are described in the followingsubsections.
3.1.1. Solution representationTo code the solutions, we presented a bi-part solutionrepresentation structure. A 1� S random vector spec-i�es the priority of suppliers for transporting materialsinto the manufacturer, and a 1 � J random vectorspeci�es the priority of manufacturers for producingthe products. Figure 3 schematically represents anexample of this structure. In this structure, each geneof vectors is a random number between zero and one.Besides, customers' demands will never exceed the ca-pacity limitations throughout the supply chain. In this�gure, S = 4; so, the random numbers are generated as1 � 4 vector; their positions are kept, and then sortedin an ascending order. Based on our capacity, two ofthe �rst genes are selected. The positions of thesenumbers are selected as suppliers (suppliers numbers3 and 1 are selected based on the correspondingcapacity). Moreover, the continuous decision vari-ables, including Xijqt; XSjsmt; XMmjt; XPijt; Y Sijct;Bict; XFjt; XHjt; and XLjt, are encoded based onupper bounds and are randomly generated betweenzero and its upper bound.
To prevent violation of constraints, a penaltyfunction approach method is applied to penalizethem [26]. Penalty values are considered for all of thetwo-objective functions through an additive function.
3.1.2. Improvising processIn an improvisation of the process of a musician, whena musician improvises with an instrument, he or shefaces three possible options of:
(I) Playing from his/her memory (with probabilityPHMCR);
Figure 3. An instance of DCs encoding.
3400 M. Ramyar et al./Scientia Iranica, Transactions E: Industrial Engineering 24 (2017) 3394{3408
(II) Adjusting the pitches slightly (with probabilityPpa);
(III) Composing randomly (with probability Prand).
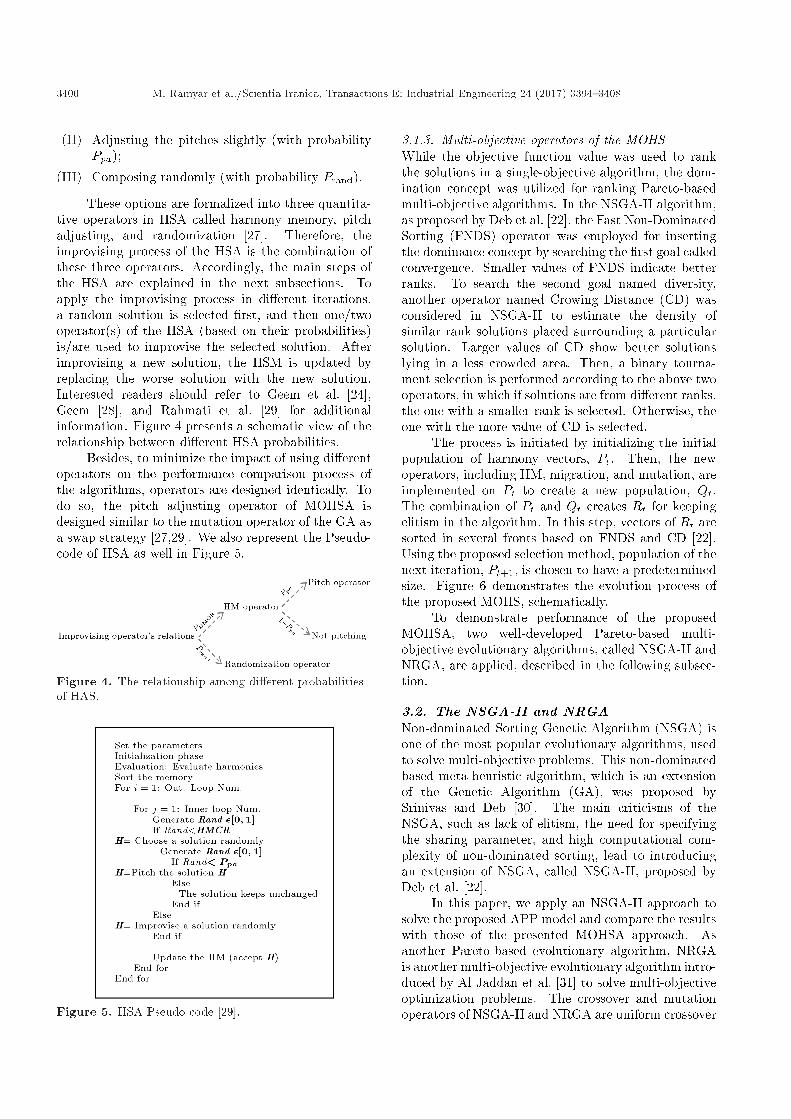
These options are formalized into three quantita-tive operators in HSA called harmony memory, pitchadjusting, and randomization [27]. Therefore, theimprovising process of the HSA is the combination ofthese three operators. Accordingly, the main steps ofthe HSA are explained in the next subsections. Toapply the improvising process in di�erent iterations,a random solution is selected �rst, and then one/twooperator(s) of the HSA (based on their probabilities)is/are used to improvise the selected solution. Afterimprovising a new solution, the HSM is updated byreplacing the worse solution with the new solution.Interested readers should refer to Geem et al. [24],Geem [28], and Rahmati et al. [29] for additionalinformation. Figure 4 presents a schematic view of therelationship between di�erent HSA probabilities.
Besides, to minimize the impact of using di�erentoperators on the performance comparison process ofthe algorithms, operators are designed identically. Todo so, the pitch adjusting operator of MOHSA isdesigned similar to the mutation operator of the GA asa swap strategy [27,29]. We also represent the Pseudo-code of HSA as well in Figure 5.
Figure 4. The relationship among di�erent probabilitiesof HAS.
Figure 5. HSA Pseudo-code [29].
3.1.3. Multi-objective operators of the MOHSWhile the objective function value was used to rankthe solutions in a single-objective algorithm, the dom-ination concept was utilized for ranking Pareto-basedmulti-objective algorithms. In the NSGA-II algorithm,as proposed by Deb et al. [22], the Fast Non-DominatedSorting (FNDS) operator was employed for insertingthe dominance concept by searching the �rst goal calledconvergence. Smaller values of FNDS indicate betterranks. To search the second goal named diversity,another operator named Crowing Distance (CD) wasconsidered in NSGA-II to estimate the density ofsimilar rank solutions placed surrounding a particularsolution. Larger values of CD show better solutionslying in a less crowded area. Then, a binary tourna-ment selection is performed according to the above twooperators, in which if solutions are from di�erent ranks,the one with a smaller rank is selected. Otherwise, theone with the more value of CD is selected.
The process is initiated by initializing the initialpopulation of harmony vectors, Pt. Then, the newoperators, including HM, migration, and mutation, areimplemented on Pt to create a new population, Qt.The combination of Pt and Qt creates Rt for keepingelitism in the algorithm. In this step, vectors of Rt aresorted in several fronts based on FNDS and CD [22].Using the proposed selection method, population of thenext iteration, Pt+1, is chosen to have a predeterminedsize. Figure 6 demonstrates the evolution process ofthe proposed MOHS, schematically.
To demonstrate performance of the proposedMOHSA, two well-developed Pareto-based multi-objective evolutionary algorithms, called NSGA-II andNRGA, are applied, described in the following subsec-tion.
3.2. The NSGA-II and NRGANon-dominated Sorting Genetic Algorithm (NSGA) isone of the most popular evolutionary algorithms, usedto solve multi-objective problems. This non-dominatedbased meta-heuristic algorithm, which is an extensionof the Genetic Algorithm (GA), was proposed bySrinivas and Deb [30]. The main criticisms of theNSGA, such as lack of elitism, the need for specifyingthe sharing parameter, and high computational com-plexity of non-dominated sorting, lead to introducingan extension of NSGA, called NSGA-II, proposed byDeb et al. [22].
In this paper, we apply an NSGA-II approach tosolve the proposed APP model and compare the resultswith those of the presented MOHSA approach. Asanother Pareto-based evolutionary algorithm, NRGAis another multi-objective evolutionary algorithm intro-duced by Al Jaddan et al. [31] to solve multi-objectiveoptimization problems. The crossover and mutationoperators of NSGA-II and NRGA are uniform crossover

M. Ramyar et al./Scientia Iranica, Transactions E: Industrial Engineering 24 (2017) 3394{3408 3401
Figure 6. MOHSA evolution process.
Figure 7. NSGA-II and NRGA owcharts.
and swap operators, respectively [32]. Further, bi-nary tournament selection and roulette wheel selectionstrategies methods are applied in NSGA-II and NRGA,respectively. The owcharts of NSGA-II and NRGAare plotted in Figure 7.
4. Parameter tuning
Since the quality of meta-heuristic algorithms largely
depends on the parameters and operators, Experimentsdesigns are used to set the parameters. Experimentsdesigns is an organized method to determine therelationship between input and output processes. Inthis section, parameters and operators of MOHSA aredetermined. Due to the large number of parametersin HSA, �nding a suitable composition of parametersthat improves the performance of algorithms is favor-able. Since there are many parameters, using complete
3402 M. Ramyar et al./Scientia Iranica, Transactions E: Industrial Engineering 24 (2017) 3394{3408
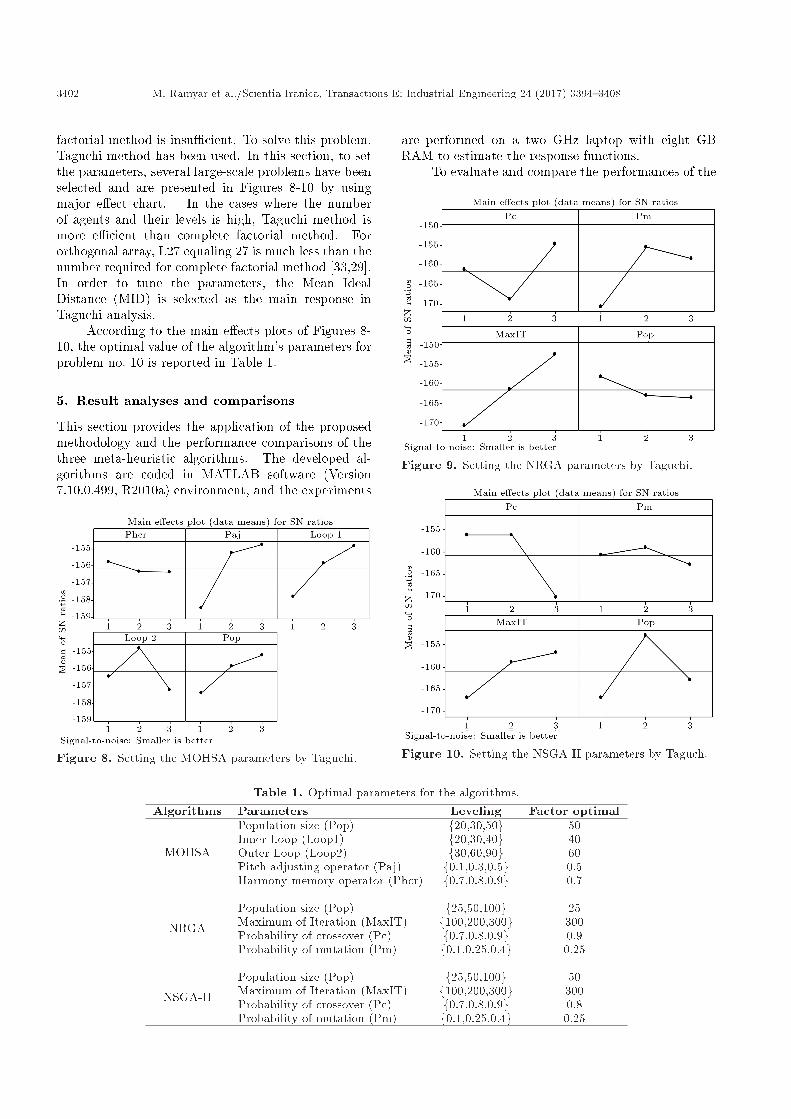
factorial method is insu�cient. To solve this problem,Taguchi method has been used. In this section, to setthe parameters, several large-scale problems have beenselected and are presented in Figures 8-10 by usingmajor e�ect chart. In the cases where the numberof agents and their levels is high, Taguchi method ismore e�cient than complete factorial method. Fororthogonal array, L27 equaling 27 is much less than thenumber required for complete factorial method [33,29].In order to tune the parameters, the Mean IdealDistance (MID) is selected as the main response inTaguchi analysis.
According to the main e�ects plots of Figures 8-10, the optimal value of the algorithm's parameters forproblem no. 10 is reported in Table 1.
5. Result analyses and comparisons
This section provides the application of the proposedmethodology and the performance comparisons of thethree meta-heuristic algorithms. The developed al-gorithms are coded in MATLAB software (Version7.10.0.499, R2010a) environment, and the experiments
Figure 8. Setting the MOHSA parameters by Taguchi.
are performed on a two GHz laptop with eight GBRAM to estimate the response functions.
To evaluate and compare the performances of the
Figure 9. Setting the NRGA parameters by Taguchi.
Figure 10. Setting the NSGA-II parameters by Taguch.
Table 1. Optimal parameters for the algorithms.Algorithms Parameters Leveling Factor optimal
MOHSA
Population size (Pop) f20,30,50g 50Inner Loop (Loop1) f20,30,40g 40Outer Loop (Loop2) f30,60,90g 60Pitch adjusting operator (Paj) f0.1,0.3,0.5g 0.5Harmony memory operator (Phcr) f0.7,0.8,0.9g 0.7
NRGA
Population size (Pop) f25,50,100g 25Maximum of Iteration (MaxIT) f100,200,300g 300Probability of crossover (Pc) f0.7,0.8,0.9g 0.9Probability of mutation (Pm) f0.1,0.25,0.4g 0.25
NSGA-II
Population size (Pop) f25,50,100g 50Maximum of Iteration (MaxIT) f100,200,300g 300Probability of crossover (Pc) f0.7,0.8,0.9g 0.8Probability of mutation (Pm) f0.1,0.25,0.4g 0.25
M. Ramyar et al./Scientia Iranica, Transactions E: Industrial Engineering 24 (2017) 3394{3408 3403
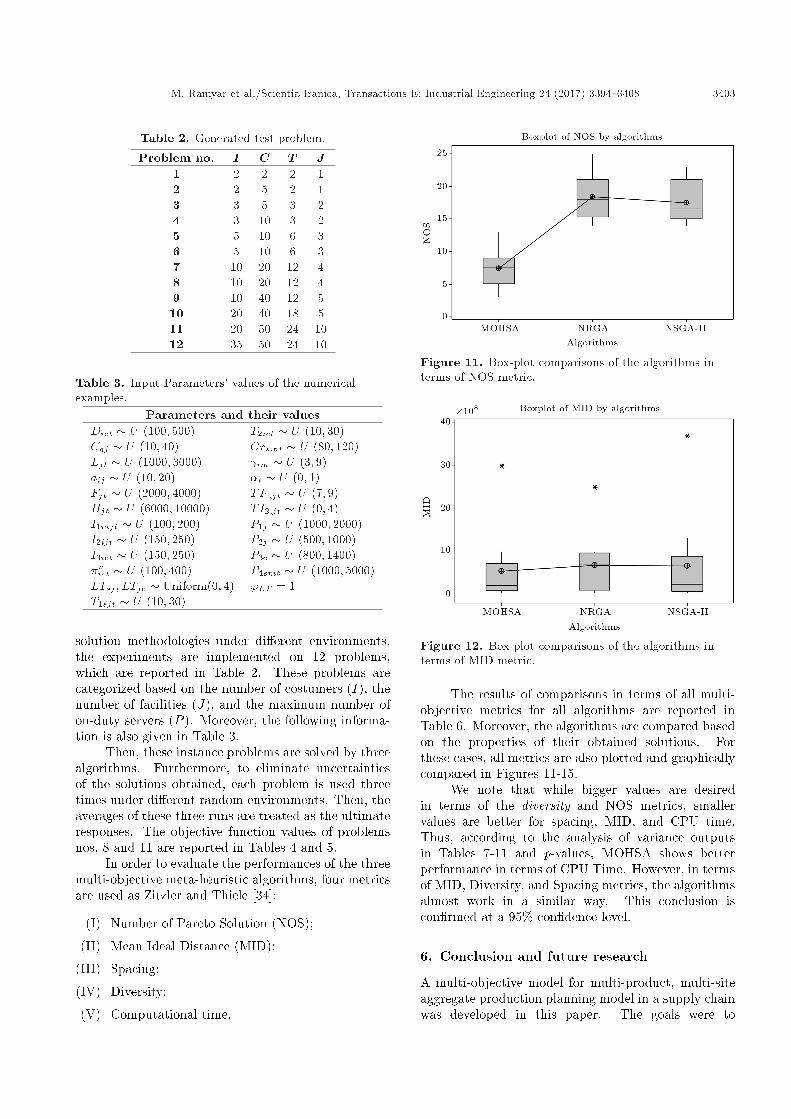
Table 2. Generated test problem.
Problem no. I C T J1 2 2 2 12 2 5 2 13 3 5 3 24 3 10 3 25 5 10 6 36 5 10 6 37 10 20 12 48 10 20 12 49 10 40 12 510 20 40 18 511 20 50 24 1012 35 50 24 10
Table 3. Input Parameters' values of the numericalexamples.
Parameters and their valuesDict � U (100; 500) T2ict � U (10; 30)Cqj � U (10; 40) Crsmt � U (80; 120)Ljt � U (1000; 3000) im � U (3; 9)aij � U (10; 20) �t � U (0; 1)Fjt � U (2000; 4000) TI1;jt � U (7; 9)Hjt � U (6000; 10000) TI2;jt � U (0; 4)I1mjt � U (100; 200) P1j � U (1000; 2000)I2ijt � U (150; 250) P2j � U (500; 1000)I3ict � U (150; 250) P3c � U (800; 1400)�nict � U (100; 400) P4smt � U (1000; 5000)LTsj ; LTjc � Uniform(0; 4) 'LT = 1T1sjt � U (10; 30)
solution methodologies under di�erent environments,the experiments are implemented on 12 problems,which are reported in Table 2. These problems arecategorized based on the number of costumers (I), thenumber of facilities (J), and the maximum number ofon-duty servers (P ). Moreover, the following informa-tion is also given in Table 3.
Then, these instance problems are solved by threealgorithms. Furthermore, to eliminate uncertaintiesof the solutions obtained, each problem is used threetimes under di�erent random environments. Then, theaverages of these three runs are treated as the ultimateresponses. The objective function values of problemsnos. 8 and 11 are reported in Tables 4 and 5.
In order to evaluate the performances of the threemulti-objective meta-heuristic algorithms, four metricsare used as Zitzler and Thiele [34]:
(I) Number of Pareto Solution (NOS);
(II) Mean Ideal Distance (MID);
(III) Spacing;
(IV) Diversity;
(V) Computational time.
Figure 11. Box-plot comparisons of the algorithms interms of NOS metric.
Figure 12. Box-plot comparisons of the algorithms interms of MID metric.
The results of comparisons in terms of all multi-objective metrics for all algorithms are reported inTable 6. Moreover, the algorithms are compared basedon the properties of their obtained solutions. Forthese cases, all metrics are also plotted and graphicallycompared in Figures 11-15.
We note that while bigger values are desiredin terms of the diversity and NOS metrics, smallervalues are better for spacing, MID, and CPU time.Thus, according to the analysis of variance outputsin Tables 7-11 and p-values, MOHSA shows betterperformance in terms of CPU Time. However, in termsof MID, Diversity, and Spacing metrics, the algorithmsalmost work in a similar way. This conclusion iscon�rmed at a 95% con�dence level.
6. Conclusion and future research
A multi-objective model for multi-product, multi-siteaggregate production planning model in a supply chainwas developed in this paper. The goals were to

3404 M. Ramyar et al./Scientia Iranica, Transactions E: Industrial Engineering 24 (2017) 3394{3408
Table 4. Pareto solutions of problem no. 8.
Pareto solutionnumber
NSGA-II NRGA Proposed MOHSA
Objective 1 Objective 2 Objective 1 Objective 2 Objective 1 Objective 2
1 6.53E+07 0.5086 5.09E+07 0.3450 1.39E+07 0.3501
2 8.01E+07 0.6715 4.59E+07 0.2567 5.27E+07 0.6990
3 3.50E+07 0.1481 4.39E+07 0.2244 9.19E+07 0.9344
4 7.61E+07 0.6324 9.54E+07 0.8702 8.02E+07 0.8890
5 9.84E+07 0.8344 7.47E+07 0.6397 6.65E+07 0.8082
6 5.60E+07 0.4225 8.79E+07 0.7854 6.01E+07 0.7516
7 9.35E+07 0.8043 6.88E+07 0.5773 | |
8 4.92E+07 0.3671 7.78E+07 0.6733 | |
9 8.88E+07 0.7673 5.61E+07 0.4467 | |
10 4.00E+07 0.2109 9.16E+07 0.8267 | |
11 8.43E+07 0.7230 3.91E+07 0.1284 | |
12 7.23E+07 0.5756 6.34E+07 0.5210 | |
13 1.13E+08 0.8911 8.44E+07 0.7461 { |
14 5.89E+07 0.4494 1.12E+08 0.8988 | |
15 4.45E+07 0.3033 5.84E+07 0.4702 | |
16 | | 7.17E+07 0.6077 | |
Table 5. Pareto solutions of problem no. 11.
Pareto solutionnumber
NSGA-II NRGA Proposed MOHSA
Objective 1 Objective 2 Objective 1 Objective 2 Objective 1 Objective 2
1 5.96E+10 0.5760 9.05E+10 0.8402 3.67E+10 0.3831
2 9.05E+10 0.8280 7.66E+10 0.7583 6.90E+10 0.5640
3 3.33E+10 0.3466 3.06E+10 0.4313 1.17E+11 0.8558
4 1.01E+11 0.9133 7.05E+10 0.7204 1.30E+11 0.9302
5 9.83E+10 0.8903 1.11E+11 0.9140 6.21E+10 0.5189
6 2.23E+10 0.1907 3.01E+10 0.4023 1.35E+11 0.9473
7 3.62E+10 0.3727 5.97E+10 0.6502 2.59E+10 0.2774
8 7.66E+10 0.7161 8.33E+10 0.7982 8.52E+10 0.6664
9 5.49E+10 0.5357 6.48E+10 0.6844 9.47E+10 0.7243
10 7.05E+10 0.6660 5.05E+10 0.5868 | |
11 1.21E+11 0.9394 1.15E+11 0.9177 | |
12 4.27E+10 0.4309 3.93E+10 0.5031 | |
13 1.82E+10 0.1398 2.17E+10 0.3496 | |
14 5.05E+10 0.4982 1.33E+10 0.2540 | |
15 3.06E+10 0.3223 3.62E+10 0.4779 | |
16 8.32E+10 0.7700 4.64E+10 0.5574 | |
17 | | 9.84E+10 0.8845 | |

M. Ramyar et al./Scientia Iranica, Transactions E: Industrial Engineering 24 (2017) 3394{3408 3405
Table 6. Computational results of multi-objective metrics comparisons for three algorithms.Problem
no.Proposed MOHSA NSGA-II NRGA
NOS MID Spacing Diversity Time NOS MID Spacing Diversity Time NOS MID Spacing Diversity Time
1 9 6E+06 7690 82465023 11.52 23 7E+06 7633 836454875 21.66 21 6E+07 7655 648729584 21.99
2 9 6E+06 8766 876348278 15.44 21 9E+06 8655 847638748 38.91 19 1E+07 6544 772354726 22.73
3 11 8E+07 7434 82736292 16.81 16 7E+07 5688 834768378 45.88 18 9E+07 9853 827368742 29.91
4 13 8E+07 4584 73492284 21.53 17 8E+07 8721 483784734 76.10 15 1E+08 9790 67485282 49.21
5 8 1E+08 18712 873684277 22.73 21 6E+07 87654 84384783 91.62 22 1E+08 87341 3642347 82.61
6 5 2E+08 87645 784268392 26.72 21 2E+08 77611 684348384 110.81 21 6E+08 98652 46234827 121.81
7 7 2E+08 89966 374920923 41.94 15 3E+08 54388 483784783 119.85 25 9E+08 67390 6348232 129.82
8 6 4E+08 123560 374928902 49.66 15 5E+08 876691 83847384 159.75 16 1E+09 897443 47835404 148.73
9 5 5E+08 6588799 374928980 61.87 17 8E+08 8544975 84384783 178.83 18 8E+08 8756532 65354504 171.91
10 9 8E+08 78767221 238476899 77.99 16 9E+08 87655501 87589979 233.70 17 8E+08 87996209 67374363 201.74
11 4 1E+09 984989893 562437223 121.10 14 1E+09 698212180 23720645 298.61 15 2E+09 678524489 87373583 278.53
12 3 3E+09 6798567589 647289022 189.81 14 4E+09 8974461871 837843878 412.87 14 1E+09 732434588 54353783 362.74
Figure 13. Box-plotcomparisons of the algorithms interms of Spacing metric.
Figure 14. Box-plot comparisons of the algorithms interms of Diversity metric.
minimize the total cost of supply chain, includinginventory costs, manufacturing costs, work force costs,hiring, and �ring costs, and to maximize the minimumof suppliers' reliability by considering probabilistic lead
Figure 15. Box-plot comparisons of the algorithms interms of Time metric.
Table 7. Statistical outputs of NOS metric.
Algorithm DF SS MS F P -value
Algorithms 2 894.6 447.3 45.14 0.000
Error 33 326.83 9.90
Total 35 1220.89
times to simultaneously improve performance of thesystem. Since the problem is NP-Hard, a Pareto-basedmulti-objective harmony search algorithm is proposed.To demonstrate the performance of the presented algo-rithm, NSGA-II and NRGA are applied. The resultsshow that MOHSA has better performance in termsof CPU Time. However, in terms of MID, Diversity,and Spacing metrics, our proposed MOHSA has thesame capability as the best-developed algorithms inthe literature. As for future research, one can developthe model by formulating the problem in competitivesupply chains.

3406 M. Ramyar et al./Scientia Iranica, Transactions E: Industrial Engineering 24 (2017) 3394{3408
Table 8. Statistical outputs of MID metric.
Algorithm DF SS MS F P -value
Algorithms 2 1.43865E+17 7.19323E+16 0.09 0.910
Error 33 2.49970E+19 7.57484E+17
Total 35 2.51408E+19
Table 9. Statistical outputs of Spacing metric.
Algorithm DF SS MS F P -value
Algorithms 2 3.11980E+18 1.55990E+18 0.44 0.645
Error 33 1.15933E+20 3.51313E+18
Total 35 1.19053E+20
Table 10. Statistical outputs of Diversity metric.
Algorithm DF SS MS F P -value
Algorithms 2 3.94541E+17 1.97270E+17 1.86 0.172
Error 33 3.50060E+18 1.06079E+17
Total 35 3.89514E+18
Table 11. Statistical outputs of CPU Time metric.
Algorithm DF SS MS F P -value
Algorithms 2 62182 31091 3.35 0.047
Error 33 306463 9287
Total 35 368644
References
1. MirzapourAl-e-Hashem, S.M.J., Malekly, H. andAryanezhad, M.B. \A multi-objective robust optimiza-tion model for multi-product multi-site aggregate pro-duction planning in a supply chain under uncertainty",In. J. Production Economics, 134, pp. 28-42 (2011).
2. Ozdamar, L., Bozyel, M.A. and Birbil S. \LA hierar-chical decision support system for production planning(with case study)", European Journal of OperationalResearch, 104, pp. 403-422 (1998).
3. Holt, C., Modigliani, F. and Simon, H. \A linear deci-sion rule for production and employment scheduling",Management Science, 2(1), pp. 1-30 (1955).
4. Bergstrom, G. and Smith, B. \Multi-item productionplanning-an extension of the HMMS rules", Manage-ment Science, 16(10), pp. 614-629 (1970).
5. Oh, H.C. and Karimi, I.A. \Global multiproduct pro-duction distribution planning with duty drawbacks",AIChE. J., 50, pp. 963-989 (2004).
6. Guillen, G., Bagajewicz, M., Sequeira, S.E., Espuna,A. and Puigjaner, L. \Management of pricing policies
and �nancial risk as a key element for short termscheduling optimization", Ind. Eng. Chem. Res., 44,pp. 557-575 (2005).
7. Wang, R.C. and Liang T.F. \Application of fuzzymulti-objective linear programming to aggregate pro-duction planning", Computers & Industrial Engineer-ing, 46(1), pp. 17-41 (2004).
8. Wang, R.C. and Liang, T.T. \Aggregate productionplanning with multiple fuzzy goals", InternationalJournal of Advance Manufacturing Technology, 25, pp.589-597 (2005).
9. Leung, S.C.H. and Chan, S.S.W. \A goal programmingmodel for aggregate production planning with resourceutilization constraint", Computers & Industrial Engi-neering, 56, pp. 1053-1064 (2009).
10. Baykasoglu, A. and Gocken, T. \Multi-objective ag-gregate production planning with fuzzy parameters",Advances in Engineering Software, 41, pp. 1124-1131(2010).
11. MirzapourAl-e-hashem, S.M.J., Aryanezhad, M.B. andSadjadi S.J. \An e�cient algorithm to solve a multi-objective robust aggregate production planning inan uncertain environment", International Journal ofAdvance Manufacturing Technology, 58, pp. 765-782(2012).
12. Sadeghi, M., Hajiagha, S.H.R. and Hashemi S.S. \Afuzzy grey goal programming approach for aggregateproduction planning", International Journal of Ad-
M. Ramyar et al./Scientia Iranica, Transactions E: Industrial Engineering 24 (2017) 3394{3408 3407
vance Manufacturing Technology, 64, pp. 1715-1727(2013).
13. Rodger, J.A. \Application of a fuzzy feasibilityBayesian probabilistic estimation of supply chain back-orderaging, un�lled backorders, and customer waittime using stochastic simulation with Markov blan-kets", Expert Systems with Applications, 41, pp. 7005-7022 (2014).
14. Rodger, J.A., Pankaj, P. and Gonzalez, S.P. \Deci-sion making using a fuzzy induced linguistic orderedweighted averaging approach for evaluating risk in asupply chain", International Journal Advanced Manu-facturing Technology, 70, pp. 711-723 (2014).
15. Ramanathan, U. \Performance of supply chain collab-oration - A simulation study", Expert Systems withApplications, 41, pp. 210-220 (2014).
16. Gholamian, N., Mahdavi, I., Tavakkoli-Moghaddam,R. and Nezam Mahdavi-Amiri, N. \Comprehensivefuzzy multi-objective multi-product multi-site aggre-gate production planning decisions in a supply chainunder uncertainty", Applied Soft Computing, 37, pp.585-607 (2015).
17. Pasandideh, S.H.R., Akhavan Niaki, S.T. and Asadi,K. \Bi-objective optimization of a multi-productmulti-period three-echelon supply chain problem underuncertain environments NSGA-II and NRG", Informa-tion Sciences, 292, pp. 57-74 (2015).
18. Pasandideh, S.H.R., Akhavan Niaki, S.T. and Asadi,K. \Optimizing a bi-objective multi-period three ech-elon supply chain network with warehouse reliability",Expert Systems with Applications, 42, pp. 2615-2623(2015).
19. Rooeinfar, R., Azimi, P. and Pourvaziri, H. \Multi-echelon supply chain network modelling and optimiza-tion via simulation and metaheuristic algorithms",Scientia Iranica E, 23(1), pp. 330-347 (2016).
20. Entezaminia, A., Heydari, M. and Rahmani, D. \Amulti-objective model for multi-product multi-site ag-gregate production planning in a green supply chain:Considering collection and recycling centers", Journalof Manufacturing Systems, 40(1), pp. 63-75 (2016).
21. Partovi, F. and Seifbarghy, M. \Service centers lo-cation problem considering service diversity withinqueuing framework", Scientia Iranica E, 22(3), pp.1103-1116 (2015).
22. Deb, K., Pratap, A., Agarwal, S. and Meyarivan, T.\A fast and elitist multiobjective genetic algorithm:NSGA-II", IEEE Transactions on Evolutionary Com-putation, 6, pp. 182-197 (2002).
23. Lee, K.S. and Geem, Z.W. \A new structural optimiza-tion method based on the harmony search algorithm",Computers and Structures, 82, pp. 781-798 (2004).
24. Geem, Z.W., Kim, J.H. and Loganathan, G.V. \Har-mony search optimization: application to pipe network
design", International Journal of Modeling and Simu-lation, 22, pp. 125-133 (2002).
25. Taleizadeh, A.A., Niaki, S.T.A. and Barzinpour, F.\Multiple-buyer multiple-vendor multi-product multi-constraint supply chain problem with stochastic de-mand and variable lead-time: A harmony searchalgorithm", Applied Mathematics and Computation,217, pp. 9234-9253 (2011).
26. Yeniay, O. and Ankare, B. \Penalty function methodsfor constrained optimization with genetic algorithms",Mathematical and Computational Application, 10, pp.45-56 (2005).
27. Geem, Z.W., Kim, J.-H. and Loganathan, G.V. \A newheuristic optimization algorithm: harmony search",Simulation, 76(2), pp. 60-68 (2001).
28. Geem, Z.W. \Harmony search algorithm for solvingSudoku", In Knowledge-Based Intelligent Informationand Engineering Systems, B. Apolloni, R.J. Howlettand L. Jain, Eds., KES 2007, Part I. LNCS (LNAI),4692, pp. 371-378, Springer, Heidelberg (2007).
29. Rahmati, S.H.A., Hajipour, V. and Niaki, S.T.A. \Asoft-computing Pareto-based meta-heuristic algorithmfor a multi-objective multi-server facility location prob-lem", Applied Soft Computing, 13(4), pp. 1728-1740(2013).
30. Srinivas, N. and Deb, K. \Multi-objective functionoptimization using non-dominated sorting genetic al-gorithms", E Vol. Comput, 2(3), pp. 221-248 (1995).
31. Al Jaddan, O., Rajamani, L. and Rao, C.R. \No domi-nated ranked genetic algorithm for solving constrainedmulti-objective optimization problems", Journal ofTheoretical and Applied Information Technology, 5,pp. 640-651 (2009).
32. Haupt, R.L. and Haupt, S.E., Practical Genetic Algo-rithms, 2nd Ed., John Wiley & Sons (2004).
33. Chambari, A., Rahmati, S.H.R., Naja�, A.A. andKarimi, A. \A bi-objective model to optimize relia-bility and cost of system with a choice of redundancystrategies", Computers & Industrial Engineering, 63,pp. 109-119 (2012).
34. Zitzler, E. and Thiele, L. \Multi-objective optimiza-tion using evolutionary algorithms: A comparativecase study", In A.E. Eiben, T. Back, M. Schoenauerand H.P. Schwefel, Eds., Fifth International Confer-ence on Parallel Problem Solving from Nature (PPSN-V), PP. 292-301, Berlin, Germany (1998).
Biographies
Mohammad Ramyar is currently a PhD student atCollege of Industrial Engineering, Iran University ofScience and research in Tehran. He obtained his MScdegree in Industrial Engineering from the AdvancedInstitute of Education & Research in Mangement &Planning in Iran (2005) and his BSc degree in AppliedMathematics from the University Shiraz in Iran (2000).

3408 M. Ramyar et al./Scientia Iranica, Transactions E: Industrial Engineering 24 (2017) 3394{3408
His research interests include risk analysis and reliabil-ity in supply chain management, aggregate productionplanning and fuzzy sets.
Esmaeil Mehdizadeh is currently an Associate Pro-fessor at the Department of Industrial engineering,Islamic Azad University, Qazvin Branch, Iran. Hereceived his PhD degree from Islamic Azad University,Science and Research Branch, Tehran in 2009, MScdegree from Islamic Azad University, South TehranBranch in 1999, and BSc degree from Islamic AzadUniversity, Qazvin Branch in 1996 all in IndustrialEngineering. His research interests are in the areasof operation research, such as production planning,
production scheduling, fuzzy sets, and meta-heuristicalgorithms. He has several papers in journals andconference proceedings. Also, he is a Managing Editorof International Journal of Optimization in IndustrialEngineering.
Seyyed Mohammad Hadji Molana graduated withBSC from Sharif University of Technology and withMSC and PhD from AmirKabir University of Technol-ogy in Iran. He is the Head of Industrial EngineeringDepartment at Science and Research Branch of IslamicAzad University. His research interests are in supplychain management, advanced inventory control andproduction planning.