Embed Size (px)
Citation preview

Optimizing Cost and Optimizing Cost and Performance for Performance for
MultihomingMultihoming
ACM SIGCOMM 2004ACM SIGCOMM 2004
Lili QiuLili QiuMicrosoft ResearchMicrosoft [email protected]@microsoft.com
Joint Work withJoint Work withD. K. Goldenberg, H. Xie, Y. R. Yang, Yale D. K. Goldenberg, H. Xie, Y. R. Yang, Yale
University University Y. Zhang, AT&T Labs – ResearchY. Zhang, AT&T Labs – Research

2
Multihoming & Smart RoutingMultihoming & Smart Routing
Multihoming– A popular way of
connecting to Internet
Smart routing– Intelligently distribute
traffic among multiple external links
User
ISP 1
ISP K
InternetISP 2

3
Potential BenefitsPotential Benefits• Improve performance
– Potential improvement: 25+% [Akella03]– Similar to overlay routing [Akella04]
• Improve reliability– Two orders of magnitude improvement in
fault tolerance of end-to-end paths [Akella04]
• Reduce cost
Q: How to realize the potential benefits?

4
Our GoalsOur Goals• Goal
– Design effective smart routing algorithms to realize the potential benefits of multihoming
• Questions– How to assign traffic to multiple ISPs to
optimize cost? – How to assign traffic to multiple ISPs to
optimize both cost and performance?– What are the global effects of smart
routing?

5
Related WorkRelated WorkTechniques for implementing multihoming
– BGP peering, DNS-based, NAT-based (e.g., [RFC2260, Cisco, GCLC04, Radware, F5])
– Complementary to our workPerformance evaluation [Akella03,Akella04]
– Quantify the potential benefits of multihoming– Unaddressed challenge: how to achieve this in
practiceSmart routing
– Commercial products (e.g., [RouteScience, Internap, Proficient, …])
– Technical details are unavailableHash-based load balancing [Cao01, Guo04]
– Optimizes neither performance nor cost
6
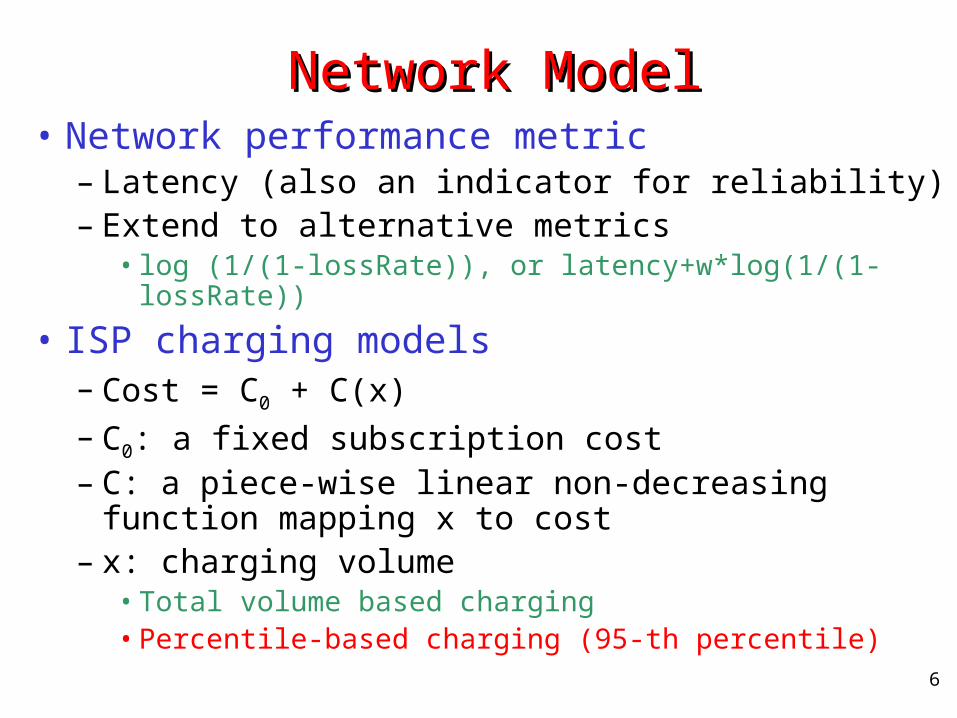
Network ModelNetwork Model• Network performance metric
– Latency (also an indicator for reliability)– Extend to alternative metrics
• log (1/(1-lossRate)), or latency+w*log(1/(1-lossRate))
• ISP charging models– Cost = C0 + C(x)– C0: a fixed subscription cost– C: a piece-wise linear non-decreasing function
mapping x to cost – x: charging volume
• Total volume based charging• Percentile-based charging (95-th percentile)

7
Percentile Based ChargingPercentile Based Charging
Interval
Sorted volume
N95%*N
Charging volume: traffic in the (95%*N)-th sorted interval

8
Why cost optimization?Why cost optimization?• A simple example:
– A user subscribes to 4 ISPs, whose latency is uniformly distributed
– In every interval, the user generates one unit of traffic
• To optimize performance– ISP 1: 1, 0, 0, 0, …– ISP 2: 0, 1, 0, 0, …– ISP 3: 0, 0, 1, 0, …– ISP 4: 0, 0, 0, 1, …– 95th-percentile = 1 for all 4 ISPs– 95th-percentile = 1 using one ISP
• Cost(4 ISPs) = 4 * cost(1 ISP)
Optimizing performance alone could result in high cost!

9
Cost Optimization: Cost Optimization: Problem Specification (2 ISPs)Problem Specification (2 ISPs)
Time
Volume
N1 2

10
Cost Optimization: Cost Optimization: Problem Specification (2 ISPs)Problem Specification (2 ISPs)
Time
Volume
P1
P2
Goal: minimize total cost = C1(P1)+C2(P2)
Sorted volume
Sorted volume

11
Issues & InsightsIssues & Insights• Challenge: traditional optimization techniques
do not work with percentiles
• Key: determine each ISP’s charging volume
• Results– Let V0 denote the sum of all ISPs’ charging volume – Theorem 1: Minimize cost Minimize V0
– Theorem 2: V0 ≥ 1- k=1..N(1-qk) quantile of original traffic, where qk is ISP k’s charging percentile

12
Cost Optimization: Cost Optimization: Problem Specification (2 ISPs)Problem Specification (2 ISPs)
Time
Volume
P1
P2P1 + P2 90-th percentile of original traffic
Sorted volume
Sorted volume

13
Intuition for 2-ISP CaseIntuition for 2-ISP Case• ISP 1 has 5% intervals whose traffic exceeds
P1• ISP 2 has 5% intervals whose traffic exceeds
P2
• The original traffic (ISP 1 + ISP 2 traffic) has 10% intervals whose traffic exceeds P1+P2
• P1+P2 90-th percentile of original traffic

14
Sketch of Our AlgorithmSketch of Our Algorithm1. Determine charging volume for each ISP
– Compute V0
– Find pk that minimize ∑k ck(pk) subject to ∑kpk=V0 using dynamic programming
2. Assign traffic given charging volumes– Non-peak assignment: ISP k is assigned pk
– Peak assignment: • First let every ISP k serve its charging volume pk
• Dump all the remaining traffic to an ISP k that has bursted for fewer than (1-qk)*N intervals

15
Additional IssuesAdditional Issues• Deal with capacity constraints
• Perform integral assignment– Similar to bin packing (greedy heuristic)
• Make it online– Traffic prediction
• Exponential weighted moving average (EWMA)– Accommodate prediction errors
• Update V0 conservatively• Add margins when computing charging
volumes

16
Optimizing Cost + PerformanceOptimizing Cost + Performance• One possible approach: design a metric
that is a weighted sum of cost and performance– How to determine relative weights?
• Our approach: optimize performance under cost constraints– Use cost optimization to derive upper
bounds of traffic that can be assigned to each ISP
– Assign traffic to optimize performance subject to the upper bounds

17
Evaluation MethodologyEvaluation Methodology• Traffic traces (Oct. 2003 – Jan. 2004)
– Abilene traces (NetFlow data on Internet2)• RedHat, NASA/GSFC, NOAA Silver Springs Lab,
NSF, National Library of Medicine• Univ. of Wisconsin, Univ. of Oregon, UCLA, MIT
– MSNBC Web access logs
• Realistic cost functions [Feb. 2002 Blind RFP]
• Delay traces– NLANR traces: 3 months’ RTT measurements
between pairs of 140 universities– Map delay traces to hosts in traffic traces

18
Baseline AlgorithmsBaseline Algorithms1. Round robin
– In each interval, assign traffic to a single ISP– Rotate in a round robin fashion
2. Equal split– In each interval, split traffic equally among ISPs– Similar to hash-based load balancing
3. Offline local fractional– Minimize the total cost for each interval
independently
4. Dedicated links– Flat rate and independent of usage

19
Cost Comparison for Different TracesCost Comparison for Different Traces
0
0.2
0.4
0.6
0.8
1
1.2
1.4
1.6
Red Hat MIT UCLA Wisconsin Web Server
No
rmal
ized
co
st t
offline cost online cost round robin equal LFA offline
Our algorithms significantly out-perform the alternatives.

20
Cost Comparison for Varying # Links Cost Comparison for Varying # Links
For all # ISPs, our cost optimization performs well.
0
1
2
3
4
5
6
7
8
0 5 10 15
# external links
No
rmalize
d c
ostl
offline cost online cost round robin
equal LFA offline

21
Cost + Performance EvaluationCost + Performance Evaluation
Optimizing performance alone often doubles the cost.
0
0.5
1
1.5
2
2.5
3
Co
st n
orm
aliz
ed b
y o
ffli
ne
cost
offline cost offline cost+perf online cost
online cost+perf offline perf

22
Cost + Performance Evaluation Cost + Performance Evaluation (Cont.)(Cont.)
Our dual metric optimization achieves low cost and latency.
0
10
20
30
40
50
60
70
Avera
ge L
ate
ncy (
ms)
offline cost offline cost+perf online cost online cost+perf offline perf

23
Global Effects of Smart RoutingGlobal Effects of Smart Routing• Selfish nature of smart routing
– Each user optimizes its own cost & performance without considering its impact on other traffic
– Need to understand its global effects
• Questions– How well does smart routing perform when traffic
assignment affects link latency?– How well do different smart routing users co-exist?– How well do smart routing users co-exist with
single-homed users?

24
Evaluation MethodologyEvaluation Methodology• Abilene traffic traces• Rocketfuel inter-domain topology
– 170 nodes, 600 edges– With propagation delay and OSPF weights – M/M/1 queuing model
• Routing– A user selects best performing ISP subject to
cost constraints– Inter-domain: shortest AS hop count– Intra-domain: OSPF
• Compute traffic equilibria as in [QYZS03]

25
Global Effects: SummaryGlobal Effects: Summary• Impact of self interference is small
• Smart routing users co-exist well with each other
• Smart routing users co-exist well with single-homed users

26
ConclusionsConclusionsContributions
– First paper on jointly optimizing cost and performance for multihoming
– Propose a series of novel smart routing algorithms that achieve both low cost and good performance
– Under traffic equilibria, smart routing improves performance without hurting other traffic
Future work– Further evaluation through Internet experiments– Dynamics of interactions among different users– Design better charging models

27
Thank you!