Embed Size (px)
Citation preview

Optimization Review Baird & McGuire Superfund Site
Town of Holbrook, Norfolk County, Massachusetts
www.epa.gov/superfund/remedytech | www.clu-in.org/optimization | www.epa.gov/superfund/cleanup/postconstruction
EPA 542-R-13-003
May 2013
Office of Solid Waste and Emergency Response
Office of Superfund Remediation and
Technology Innovation

OPTIMIZATION REVIEW
BAIRD & MCGUIRE SUPERFUND SITE
TOWN OF HOLBROOK, NORFOLK COUNTY, MASSACHUSETTS
Report of the Optimization Review
Site Visit Conducted at the Baird & McGuire Superfund Site on
February 28, 2012
May 17, 2013

i
EXECUTIVE SUMMARY
Optimization Background
The U.S. Environmental Protection Agency (EPA) defines optimization as the following:
“Efforts at any phase of the removal or remedial response to identify and implement specific
actions that improve the effectiveness and cost-efficiency of that phase. Such actions may also
improve the remedy’s protectiveness and long-term implementation which may facilitate
progress towards site completion. To identify these opportunities, regions may use a
systematic site review by a team of independent technical experts, apply techniques or
principles from Green Remediation or Triad, or apply other approaches to identify
opportunities for greater efficiency and effectiveness. Contractors, states, tribes, the public,
and PRPs are also encouraged to put forth opportunities for the Agency to consider.” (1)
An optimization review considers the goals of the remedy, available site data, conceptual site model
(CSM), remedy performance, protectiveness, cost-effectiveness, and closure strategy. A strong interest in
sustainability has also developed in the private sector and within Federal, State, and Municipal
governments. Consistent with this interest, optimization now routinely considers green remediation and
environmental footprint reduction during optimization reviews.
An optimization review includes reviewing site documents, interviewing site stakeholders, potentially
visiting the site for one day, and compiling a report that includes recommendations in the following
categories:
Protectiveness
Cost-effectiveness
Technical improvement
Site closure
Environmental footprint reduction
The recommendations are intended to help the site team identify opportunities for improvements in these
areas. In many cases, further analysis of a recommendation, beyond that provided in this report, may be
needed prior to implementation of the recommendation. Note that the recommendations are based on an
independent review, and represent the opinions of the optimization review team. These recommendations
do not constitute requirements for future action, but rather are provided for consideration by the relevant
State and EPA Region and other site stakeholders. Also note that while the recommendations may
provide some details to consider during implementation, the recommendations are not meant to replace
other, more comprehensive, planning documents such as work plans, sampling plans, and quality
assurance project plans (QAPP).
1 U.S. Environmental Protection Agency (EPA). 2012. Memorandum: Transmittal of the National Strategy to Expand Superfund
Optimization Practices from Site Assessment to Site Completion. From: James. E. Woolford, Director Office of Superfund
Remediation and Technology Innovation. To: Superfund National Policy Managers (Regions 1 – 10). Office of Solid Waste and
Emergency Response (OSWER) 9200.3-75. September 28.

ii
Site-Specific Background
The Baird & McGuire Superfund Site is located at 775 South Street in Holbrook, Norfolk County,
Massachusetts, approximately 18 miles south of Boston. The site consists of an approximately 32.5-acre
parcel at the former Baird & McGuire Company, Inc. property. The property is bordered by the Cochato
River to the east and by woodland areas to the north and south. The site-related contamination has
included various volatile and semi-volatile organic compounds (VOCs and SVOCs), pesticides, and
arsenic. The site remedial activities are currently managed and funded by the Massachusetts Department
of Environmental Protection (MassDEP). The site was nominated for an optimization review by
MassDEP as part of a group of optimization evaluations for three long-term remedies in Massachusetts.
EPA issued three Records of Decision (ROD) for the Site, defining four operable units (OU) and
describing selected remedial alternatives, as follows:
The first ROD, issued in September 1986, specified groundwater extraction and treatment at an
onsite treatment plant (OU-1) and soil excavation with treatment of the soil at an onsite
incinerator and disposal of the resulting ash on-site (OU-2).
The second ROD, issued in September 1989, addressed contamination in sediments of the
Cochato River (OU-3).
The final ROD, issued by EPA in 1990, called for reopening the Donna Road well field to replace
the lost water supply resulting from contamination of the South Street well field (OU-4). An
Explanation of Significant Difference (ESD) was issued in August 2003 for OU-4 stating that the
reactivation of the Donna Road well field was not necessary and no further action would be taken
for OU-4.
The current pump and treat (P&T) system consists of eight extraction wells (EW-2, EW-3, EW-4A, and
EW-5 through EW-9), a groundwater treatment facility and four recharge basins to return treated
groundwater to the aquifer. In 1996, light non-aqueous phase (LNAPL) was discovered in subsurface soil
and groundwater in the central portion of the site. LNAPL recovery began in 1999 and nearly 11,000
gallons of LNAPL were recovered as of April 2004. Subsequently, LNAPL recovery via this system has
diminished to increasingly negligible amounts. Due to a lack of LNAPL recovery, the LNAPL recovery
system was inactivated in March 2009. Although LNAPL has subsequently been detected within the wells
associated with the LNAPL system, the specific gravity of the LNAPL appears to be close to that of water
indicating that all LNAPL may not be present as a distinct LNAPL layer within the well and LNAPL
volumes may be higher than indicated by the LNAPL thickness in a well.
Summary of Conceptual Site Model
Operations from a chemical mixing and batching facility over a 70-year history resulted in contaminant
releases to soil and groundwater from leaking above-ground and below-ground tanks, waste disposal to
the land surface, and other sources. Releases of site-related contamination to the Cochato River included
direct discharges from pipes, contaminated surface water runoff, contact of flood waters with waste
disposal areas and discharge from groundwater to surface water. Contaminants included (but were not
limited to) VOCs, SVOCs, pesticides and arsenic.
Site conditions have improved significantly due to a combination of factors that include the following:

iii
discontinuation of site operations by 1983
removal actions performed by EPA
soil excavation
sediment excavation
P&T operation
The remaining contamination at the site that drives current remediation efforts is the LNAPL
contamination and the dissolved arsenic plume. During the site visit, the site team described the
remaining LNAPL as having a specific gravity near 1.0 and as emulsified in groundwater, making
LNAPL measurement and LNAPL recovery by extraction and separation difficult. Residual (immobile
and unrecoverable) LNAPL is also likely still present beneath the water table through much of the area
where LNAPL was identified in the 1997 investigation. The known extent of LNAPL contamination at
the time of the investigation is shown in Figure B-4 in Attachment B, however, it is unclear if LNAPL
was present outside of this area. The current extent of residual LNAPL is not well understood. The
optimization review team speculates that LNAPL (which contains arsenic) continues to provide an
ongoing source of dissolved groundwater contamination for VOCs, SVOCs and arsenic.
While concentrations of naphthalene, other SVOCs and VOCs have declined substantially throughout the
site as the result of remedial activities, the dissolved arsenic plume continues to exhibit high
concentrations throughout the plume. Arsenic concentrations have decreased mildly at some locations
over time, but not nearly as much as the organic contaminants. The dissolved arsenic plume extends from
the principal source area in the vicinity of EW-8 to the Cochato River. The optimization review team
speculates that the remaining organic contamination (for example, VOCs, SVOCs, and potentially other
petroleum hydrocarbons) serves as electron donor for microbes in groundwater and decreases the
oxidation-reduction potential (ORP) in much of the aquifer. The optimization review team further
speculates that the lower ORP contributes to mobilization of arsenic from native soils and or soil remedy
ash, potentially resulting in an additional ongoing source of arsenic. To the extent these speculations are
correct, as long as sufficient dissolved organic carbon is present in groundwater, widespread continuing
sources of arsenic will persist.
The goal of the groundwater remedy is to return the aquifer to drinking water standards. However, much
of the site is within the 100-year flood plain and or is wetlands, which limits future use of the land or
underlying water resource. The Cochato River is the only media at the site that provides a current
potentially complete exposure pathway to human or ecological receptors.
Summary of Findings
The following findings are either apparent in the optimization review team’s interpretation of the CSM or
are explicitly stated in the findings section:
The soil remedy has significantly reduced VOC and SVOC groundwater contamination and only
a few locations remain above applicable standards.
The optimization review team speculates that residual LNAPL present throughout much of the
site may continue to serve as a source of arsenic. The extent of residual LNAPL has not been
fully delineated.
The optimization review team speculates that residual LNAPL throughout much of the site may
continue to serve as a source of dissolved organic carbon, resulting in low ORP.

iv
The optimization review team speculates that low ORP is contributing to mobilization of arsenic
from native soils and soil remedy ash. Arsenic concentrations in groundwater remain elevated
significantly above applicable standards.
Significant arsenic impacts between EW-7 and EW-9 have recently been identified but
contamination in this area of the site has not been definitively linked to a specific source area.
Unlike other areas of elevated arsenic contamination, there are no data in that area of the site for
LNAPL, VOCs, SVOCs or ORP.
The arsenic plume may be captured in the area of EW-7, but other portions of the plume are
likely not captured by the extraction system (such as near EW-9 or between EW-7 and EW-9).
No sampling has been conducted on sediments or fish tissue in the Cochato River since 2002,
thus current contaminant concentrations in river sediments and fish tissue are unknown. The
effect contaminated groundwater may potentially have on river sediments and or fish tissue under
pumping or non-pumping conditions is unknown.
The groundwater extraction system is in poor and deteriorating condition. The extraction rate in
2001 was approximately 127 gallons per minute (gpm) but has decreased over time to a current
extraction rate under 60 gpm, in part due to underperforming or deteriorating extraction wells.
The site team notes that the construction of the monitoring wells includes dissimilar metals and
the associated corrosion is causing the screen to separate from the casing. EW-5 was recently shut
down due to this type of problem. EW-9 never provided the anticipated flow and typically
operated at an average extraction rate of less than 1 gpm.
The groundwater treatment system is also in deteriorating condition and has several
underperforming components, although the system routinely meets regulatory discharge
requirements.
The current annual operation & maintenance (O&M) cost is approximately $900,000 per year.
Summary of Recommendations
Recommendations are provided to improve remedy effectiveness, reduce cost, provide technical
improvement and assist with accelerating site closure. The recommendations in these areas are
summarized below. A flowchart summarizing potential remediation scenarios associated with some of the
recommendations is included in this report (Figure 6-1).
Improving effectiveness – Recommendations include the following:
Resume fish tissue sampling (current conditions and then every five years). Specific fish types
and quantities are suggested. Also, the optimization review team recommends that data quality
objectives for analyzing fish tissue moving forward be clearly documented.
Sample the Cochato River sediments under current conditions, and then annually, using the
incremental sampling methodology (ISM) at each of the five stations on a move forward basis.
This approach is being recommended to provide data that will allow comparison of conditions
over time.

v
Conduct speciation analysis for arsenic in groundwater samples from select monitoring wells to
better understand arsenic mobility.
Add laboratory analysis for total petroleum hydrocarbons (TPH) and total organic carbon (TOC)
to the routine groundwater monitoring program to better correlate residual organic contamination
with low ORP and high arsenic concentrations.
Perform leaching tests on ash to better understand if ash is a continuing source of arsenic.
Reducing cost – Recommendations include the following:
Reduce groundwater treatment plant reporting because developing both daily and weekly reports
provides limited benefit to managing the site but require additional labor.
If the existing treatment plant is going to operate for five years or less, optimize the metals
removal system by adjusting the ORP and pH set points, modifying the type of oxidant used and
modifying the plumbing to the clarifier. If the treatment plant is going to operate for longer,
redesigning and replacing the metals removal system and other treatment components would
likely be more cost effective.
Discontinue aeration in the activated sludge units and use those units for solids settling only,
because the aeration is providing little benefit to overall water treatment but is likely contributing
to biofouling of the granular activated carbon (GAC) units.
Potential long-term cost savings from remediation scenarios “A” through “D” on Figure 6-1 are
also discussed. The optimization team believes the approach that likely has the greatest potential
to reduce long-term (such as, life-cycle) costs is to pursue more aggressive source area
remediation, because the goal of such efforts would be to ultimately eliminate the need for long-
term containment which currently costs on the order of $900,000 per year for an indefinite period.
A modified P&T system in the future, for example, might cost on the order of $500,000 per year.
The payoff period would depend on the ultimate up-front cost of the active remediation, whether
or not it is successful at eliminating the need for long-term P&T, and the avoided costs per year
for long-term P&T after it is decommissioned. Note that an ultimate decision regarding a path
forward (such as, the most appropriate remediation scenario) will depend on evaluation of future
data collection and testing that is recommended in this optimization review report.
Technical improvement – Record and report ORP results with groundwater monitoring data so that ORP
measurements can be correlated with the arsenic concentrations.
Site closure – Recommendations include the following:
Determine if the primary focus of the response to this site going forward will be additional soil
and groundwater source remediation or continue to operate and improve the existing containment
remedy.
o If the primary focus is to continue with the containment remedy, the optimization review
team believes that significant up-front modifications to the current P&T system in the
short term will be required, due to the expectation of long-term P&T operation for a
containment-focused remedy. In addition, definition of a target capture zone, a capture
zone evaluation and several improvements to the extraction system will be needed.

vi
o If the primary focus is additional aggressive source area remediation (to avoid the need
for long-term migration control), the primary objective would be to address the organic
contamination, including residual LNAPL that the optimization review team speculates is
1) serving as a continuous source of arsenic and 2) is causing low ORP that allows
arsenic to remain mobile and may mobilize arsenic from site soils. Based on current
information, the optimization review team believes in situ chemical oxidation (ISCO)
may be an appropriate technology for the source area due to the relatively low upfront
costs (as compared to other technologies) and the ability to adjust the level of effort and
costs based on remedy performance.
If additional aggressive source area remediation is to be pursued, pilot testing and LNAPL
characterization is suggested to evaluate the feasibility and cost of full-scale source area
remediation. Also, considerations are provided regarding migration control during the period of
aggressive source area remediation (for example, no P&T, limited P&T extraction, expanded
P&T extraction).
Green Remediation – No green remediation recommendations are provided. Recommendations are
focused on remedial effectiveness and remedial strategy. Green remediation practices can be considered
once the site team has decided on the optimal remedial approach.
.

vii
NOTICE
Work described herein was performed by Tetra Tech for the U.S. Environmental Protection Agency
(EPA). Work conducted by Tetra Tech, including preparation of this report, was performed under Work
Assignment 2-58 of EPA contract EP-W-07-078 with Tetra Tech EM, Inc., Chicago, Illinois. Mention of
trade names or commercial products does not constitute endorsement or recommendation for use.

viii
PREFACE
This report was prepared as part of a national strategy to expand Superfund optimization from remedial
investigation to site completion implemented by the United States Environmental Protection Agency
(EPA) Office of Superfund Remediation and Technology Innovation (OSRTI) (2)
. The project contacts are
as follows:
Organization Key Contact Contact Information
EPA Office of Superfund
Remediation and Technology
Innovation
(OSRTI)
Kirby Biggs EPA
Technology Innovation and Field Services
Division
1200 Pennsylvania Ave., NW (5203P)
Washington, DC 20460
phone: 703-823-3081
Tetra Tech, Inc.
(Contractor to EPA)
Jody Edwards, P.G. Tetra Tech
1881 Campus Commons Drive, Suite 200
Reston, VA 20191
phone: 802-288-9485
Doug Sutton, PhD,
P.E.
Tetra Tech
2 Paragon Way
Freehold, NJ 07728
phone: 732-409-0344
2 U.S. Environmental Protection Agency (EPA). 2012. Memorandum: Transmittal of the National Strategy to Expand Superfund
Optimization Practices from Site Assessment to Site Completion. From: James. E. Woolford, Director Office of Superfund
Remediation and Technology Innovation. To: Superfund National Policy Managers (Regions 1 – 10). Office of Solid Waste and
Emergency Response (OSWER) 9200.3-75. September 28.

ix
LIST OF ACRONYMS
µg/L micrograms per liter
µg/m3 micrograms per cubic meter
Amsl above mean sea level
ARARs applicable or relevant and appropriate requirements
AS/SVE air sparging / soil vapor extraction
bgs below ground surface
BMP best management practice
CERCLA Comprehensive Environmental Response, Compensation, and Liability Act
cfm cubic feet per minute
CHES Clean Harbors Environmental Services
COC chemical of concern
CSIA compound specific isotope analysis
CSM conceptual site model
DDT dichlorodiphenyltrichloroethane
DEQE Department of Environmental Quality Engineering
DU decision unit
EDR Environmental Data Resources Inc.
EPA United States Environmental Protection Agency
ERT Environmental Response Team
ESD Explanation of Significant Difference
FIFRA Federal Insecticide, Fungicide and Rodenticide Act of 1947
FS feasibility study
ft feet
ft2
feet squared
ft3
cubic feet
FYR Five Year Review
GAC granular activated carbon
gpm gallons per minute
GWTF groundwater treatment facility
HHRA human health risk assessment
HI hazard index
HP horsepower
IC institutional controls
ISCO in situ chemical oxidation
ISM incremental sampling methodology
ISTT in situ thermal treatment
ITRC Interstate Technology Regulatory Council
K hydraulic conductivity
LNAPL light non-aqueous phase liquid

x
LTM long term monitoring
LTRA Long-Term Response Action
MassDEP Massachusetts Department of Environmental Protection
MCL maximum contaminant limit
MCP Massachusetts Contingency Plan
MGD millions of gallons per day
mg/kg milligrams per kilogram
MSL mean sea level
MTCA Model Toxics Control Act
MTL materials testing laboratory
MW monitoring well
NPL National Priorities List
O&M Operation & Maintenance
ORP oxidation reduction potential
OSRTI Office of Superfund Remediation and Technology Innovation
OU operable unit
P&T pump and treat
PAH polycyclic aromatic hydrocarbon
PCE tetrachloroethylene (perchloroethylene)
PLC programmable logic controller
PRP potentially responsible party
PVC polyvinyl chloride
QA quality assurance
QAPP Quality Assurance Project Plan
RA Remedial Action
RAO remedial action objective
RG remediation goal
RI remedial investigation
ROD Record of Decision
RSE remedial system evaluation
SDWA Safe Drinking Water Act
SIM selected ion monitoring
SPLP synthetic precipitation leaching procedure
SU sampling unit
SVE soil vapor extraction
SVOC semi-volatile organic compound
TAB Technical Assistance to Brownfields
TCE trichloroethylene
TCLP toxicity characteristic leaching procedure
TIFSD Technology Innovation and Field Services Division
UST underground storage tank
VI vapor intrusion
VOC volatile organic compound

xi
TABLE OF CONTENTS
EXECUTIVE SUMMARY ............................................................................................................. i
NOTICE ........................................................................................................................................ vii
PREFACE .................................................................................................................................... viii
LIST OF ACRONYMS ................................................................................................................. ix
TABLE OF CONTENTS ............................................................................................................... xi
1.0 INTRODUCTION ................................................................................................................. 1
1.1 PURPOSE ............................................................................................................................ 1 1.2 TEAM COMPOSITION .......................................................................................................... 2
1.3 DOCUMENTS REVIEWED .................................................................................................... 3 1.4 QUALITY ASSURANCE ....................................................................................................... 5 1.5 PERSONS CONTACTED ....................................................................................................... 5
2.0 SITE BACKGROUND .......................................................................................................... 7
2.1 LOCATION ......................................................................................................................... 7
2.2 SITE HISTORY .................................................................................................................... 7 2.2.1 HISTORIC LAND USE AND OPERATIONS ...............................................................7
2.2.2 CHRONOLOGY OF ENFORCEMENT AND REMEDIAL ACTIVITIES ............................7 2.3 POTENTIAL HUMAN AND ECOLOGICAL RECEPTORS .......................................................... 9
2.4 EXISTING DATA AND INFORMATION ................................................................................ 10 2.4.1 SOURCES OF CONTAMINATION ...........................................................................10 2.4.2 GEOLOGY SETTING AND HYDROGEOLOGY .........................................................10
2.4.3 GROUNDWATER CONTAMINATION .....................................................................11 2.4.4 COCHATO RIVER SEDIMENT/SOIL AND SURFACE WATER CONTAMINATION ......11
3.0 DESCRIPTION OF PLANNED OR EXISTING REMEDIES ........................................... 13
3.1 REMEDY AND REMEDY COMPONENTS ............................................................................. 13 3.1.1 SOIL REMEDIATION ............................................................................................13
3.1.2 SEDIMENT EXCAVATION ....................................................................................14 3.1.3 EXTRACTION SYSTEM ........................................................................................14 3.1.4 GROUNDWATER TREATMENT SYSTEM ...............................................................15
3.1.5 LNAPL RECOVERY SYSTEM ..............................................................................16 3.2 REMEDIAL ACTION OBJECTIVES AND STANDARDS .......................................................... 16
3.2.1 GROUNDWATER .................................................................................................16 3.2.2 SEDIMENTS ........................................................................................................17
3.3 PERFORMANCE MONITORING PROGRAMS ........................................................................ 18
3.3.1 GROUNDWATER .................................................................................................18 3.3.2 SEDIMENT AND FISH TISSUE SAMPLING .............................................................19
4.0 CONCEPTUAL SITE MODEL .......................................................................................... 20
4.1 CSM OVERVIEW ............................................................................................................. 20

xii
4.2 CSM DETAILS AND EXPLANATION .................................................................................. 22 4.2.1 GROUNDWATER .................................................................................................22 4.2.2 COCHATO RIVER SEDIMENTS .............................................................................25
4.3 DATA GAPS ..................................................................................................................... 25
4.4 IMPLICATIONS FOR REMEDIAL STRATEGY ....................................................................... 26
5.0 FINDINGS ........................................................................................................................... 27
5.1 SOURCES ......................................................................................................................... 27 5.1.1 THE SOIL REMEDY HAS SIGNIFICANTLY REDUCED VOC AND SVOC
GROUNDWATER CONTAMINATION .....................................................................27
5.1.2 RESIDUAL LNAPL THROUGHOUT MUCH OF THE SITE MAY CONTINUE TO
SERVE AS A SOURCE OF LNAPL AND DISSOLVED ORGANIC CARBON ...............27
5.1.3 LOW ORP (POTENTIALLY CAUSED BY RESIDUAL DISSOLVED ORGANIC
CARBON) MAY BE MOBILIZING ARSENIC FROM SITE SOILS AND SOIL REMEDY
ASH AND IS ALLOWING ARSENIC IN GROUNDWATER TO REMAIN MOBILE ........27 5.2 GROUNDWATER ............................................................................................................... 27
5.2.1 LNAPL DELINEATION .......................................................................................27 5.2.2 PLUME DELINEATION .........................................................................................27
5.2.3 PLUME CAPTURE ................................................................................................28 5.2.4 GROUNDWATER CONTAMINANT CONCENTRATIONS ..........................................28
5.3 SEDIMENT ........................................................................................................................ 28
5.4 TREATMENT SYSTEM COMPONENT PERFORMANCE ......................................................... 29
5.4.1 EXTRACTION SYSTEM ........................................................................................29 5.4.2 TREATMENT SYSTEM .........................................................................................29
5.5 REGULATORY COMPLIANCE ............................................................................................ 30
5.6 COMPONENTS OR PROCESSES THAT ACCOUNT FOR MAJORITY OF ANNUAL COSTS ........ 30 5.7 APPROXIMATE ENVIRONMENTAL FOOTPRINTS ASSOCIATED WITH REMEDY ................... 31
5.8 SAFETY RECORD ............................................................................................................. 33
6.0 RECOMMENDATIONS ..................................................................................................... 34
6.1 RECOMMENDATIONS TO IMPROVE EFFECTIVENESS ......................................................... 36
6.1.1 RESUME FISH SAMPLING ....................................................................................36
6.1.2 SAMPLE THE COCHATO RIVER SEDIMENTS USING THE INCREMENTAL
SAMPLING METHODOLOGY ................................................................................36 6.1.3 CONDUCT SPECIATION ANALYSIS FOR ARSENIC IN SELECT MONITORING
WELLS ...............................................................................................................37 6.1.4 ADD TOTAL PETROLEUM HYDROCARBONS AND TOTAL ORGANIC CARBON TO
LABORATORY ANALYSES FOR ROUTINE GROUNDWATER MONITORING ............38 6.1.5 PERFORM LEACHING TESTS ON SITE SOILS TO BETTER UNDERSTAND IF SITE
SOILS ARE A CONTINUING SOURCE OF ARSENIC ................................................38 6.2 RECOMMENDATIONS TO REDUCE COSTS ......................................................................... 38
6.2.1 REDUCE TREATMENT PLANT REPORTING ..........................................................38
6.2.2 OPTIMIZE METALS REMOVAL SYSTEM ..............................................................39 6.2.3 DISCONTINUE AERATION IN ACTIVATED SLUDGE UNITS ...................................40
6.2.4 POTENTIAL LONG-TERM COST SAVINGS FROM REMEDIATION SCENARIOS .......40 6.3 RECOMMENDATIONS FOR TECHNICAL IMPROVEMENT ..................................................... 41

xiii
6.3.1 RECORD AND REPORT ORP RESULTS WITH GROUNDWATER MONITORING
DATA .................................................................................................................41 6.4 CONSIDERATIONS FOR GAINING SITE CLOSE OUT ........................................................... 41
6.4.1 DETERMINE IF PRIMARY FOCUS WILL BE SOURCE REMEDIATION OR
CONTAINMENT ...................................................................................................41 6.4.2 PILOT TESTING AND LNAPL CHARACTERIZATION IN CONJUNCTION WITH
MORE AGGRESSIVE SOURCE REMEDIATION .......................................................46 6.4.3 CONSIDERATIONS FOR IMPROVING MIGRATION CONTROL IN CONJUNCTION
WITH MORE AGGRESSIVE SOURCE REMEDIATION ..............................................46
6.5 RECOMMENDATIONS RELATED TO GREEN REMEDIATION ............................................... 47
6.6 SUGGESTED APPROACH TO IMPLEMENTING RECOMMENDATIONS ................................... 48
List of Tables
Table 1-1 Optimization Team Members
Table 1-2 Site Visit Attendees
Table 3-1 Extraction Well Rates and Influent Concentrations from December 2011
Table 3-2 GW-1 Standards for Key Site Contaminants
Table 3-3 ROD-Specified Human Health Target Levels for Sediment Contaminants of Concern
Action Limits for Sediments Reported in Site Documents
Table 3-4 Action Limits for Sediments Reported in the 2009 FYR
Table 5-1 Summary of Current Annual O&M Costs
Table 5-2 Estimated Environmental Footprint
Table 6-1 Cost Summary Table
Table 6-2 Cost Summary Matrix for Site Closeout Considerations
List of Figures
Figure 6-1 Flowchart Summarizing Potential Remediation Scenarios
Attachments
Attachment A: Figures from Existing Site Reports
Attachment B: Figures Prepared by Optimization Team
Figure B-1 Summary of July 2011 Sampling Results for SVOCs
Figure B-2 Summary of 2011 Sampling Results for Arsenic
Figure B-3 Summary of July 2011 Sampling Results for Pesticides
Figure B-4 Approximate Historical Extent of LNAPL (with July 2011Arsenic Sampling
Results)
Figure B-5 Figure B-5. pH/eH diagram for MW97-21
Figure B-6 Figure B-5. pH/eH diagram for MW97-17
Figure B-7 Figure B-5. pH/eH diagram for MW97-12
Figure B-8 Figure B-5. pH/eH diagram for MW97-20
Figure B-9 ORP vs. Arsenic for July 2011 Sampling Event
Attachment C: Historic VOC and SVOC Trends at Selected Wells

1
1.0 INTRODUCTION
1.1 PURPOSE During fiscal years 2000 and 2001 independent site optimization reviews called Remediation System
Evaluations (RSEs) were conducted at 20 operating Fund-lead pump and treat (P&T) sites (i.e., those sites
with P&T systems funded and managed by Superfund and various States). Due to the opportunities for
system optimization that arose from those RSEs, U.S. Environmental Protection Agency (EPA) Office of
Superfund Remediation and Technology Innovation (OSRTI) has incorporated RSEs into a larger post-
construction complete strategy for Fund-lead remedies as documented in OSWER Directive No. 9283.1-
25, Action Plan for Ground Water Remedy Optimization. Concurrently, EPA developed and applied the
Triad Approach to optimize site characterization and development of a conceptual site model (CSM).
EPA has since expanded the definition of optimization to encompass investigation stage optimization
using Triad Approach best management practices (BMP), optimization during design, RSEs and long-
term monitoring optimization (LTMO). EPA defines optimization as the following:
“Efforts at any phase of the removal or remedial response to identify and implement specific
actions that improve the effectiveness and cost-efficiency of that phase. Such actions may also
improve the remedy’s protectiveness and long-term implementation which may facilitate
progress towards site completion. To identify these opportunities, regions may use a
systematic site review by a team of independent technical experts, apply techniques or
principles from Green Remediation or Triad, or apply other approaches to identify
opportunities for greater efficiency and effectiveness. Contractors, states, tribes, the public,
and PRPs are also encouraged to put forth opportunities for the Agency to consider.” (3)
As stated in the definition, optimization refers to a “systematic site review,” indicating that the site as a
whole is often considered in the review. Optimization can also be applied to a specific aspect of the
remedy (for example, focus on LTMO or focus on one particular operable unit [OU]), but other site or
remedy components are typically considered to the degree that they affect the focus of the optimization.
An optimization review typically considers the goals of the remedy, available site data, CSM, remedy
performance, protectiveness, cost-effectiveness and closure strategy.
A strong interest in sustainability has also developed in the private sector and within Federal, State, and
Municipal governments. Consistent with this interest, OSRTI has developed a Methodology for
Understanding and Reducing a Project's Environmental Footprint and supporting Spreadsheets for
Environmental Footprint Analysis (SEFA) to assist the conduct of environmental footprint analyses for
site cleanup (www.cluin.org/greenremediation), and now routinely considers green remediation and
environmental footprint reduction during optimization reviews.
The optimization review includes reviewing site documents, potentially visiting the site for one day, and
compiling a report that includes recommendations in the following categories:
Protectiveness
3 U.S. Environmental Protection Agency (EPA). 2012. Memorandum: Transmittal of the National Strategy to Expand Superfund
Optimization Practices from Site Assessment to Site Completion. From: James. E. Woolford, Director Office of Superfund
Remediation and Technology Innovation. To: Superfund National Policy Managers (Regions 1 – 10). Office of Solid Waste and
Emergency Response (OSWER) 9200.3-75. September 28.

2
Cost-effectiveness
Technical improvement
Site closure
Environmental footprint reduction
The recommendations are intended to help the site team identify opportunities for improvements in these
areas. In many cases, further analysis of a recommendation, beyond that provided in this report, may be
needed prior to implementation of the recommendation. Note that the recommendations are based on an
independent evaluation, and represent the opinions of the optimization review team. These
recommendations do not constitute requirements for future action, but rather are provided for
consideration by the State of Massachusetts, the Region, and other site stakeholders. Also note that while
the recommendations may provide some details to consider during implementation, the recommendations
are not meant to replace other, more comprehensive, planning documents such as work plans, sampling
plans, and quality assurance project plans (QAPP).
The national optimization strategy includes a system for tracking consideration and implementation of the
optimization review recommendations and includes a provision for follow-up technical assistance from
the optimization review team as mutually agreed upon by the site management team and EPA OSRTI.
The Baird & McGuire Superfund Site is located at 775 South Street in Holbrook, Norfolk County,
Massachusetts, which is approximately 18 miles south of Boston. Figure 1 of the 4th Quarter 2011
Quarterly Extraction Well Report (see Attachment A) indicates the general site location. The site consists
of an approximately 32.5-acre parcel at the former Baird & McGuire Company, Inc. property. The
property is bordered by the Cochato River to the east and by woodland areas to the north and south. The
site-related contamination has included various volatile and semi-volatile organic compounds (VOCs and
SVOCs), pesticides, and arsenic. The site remedial activities are currently managed and funded by the
Massachusetts Department of Environmental Protection (MassDEP). The site was nominated for an
optimization review by MassDEP as part of a group of optimization evaluations for three long-term
remedies in Massachusetts.
1.2 TEAM COMPOSITION The optimization review team consisted of the following individuals:
Table 1-1. Optimization Review Team Members
Name Affiliation Phone Email
Rob Greenwald Tetra Tech GEO 732-409-0344 [email protected]
Peter Rich Tetra Tech GEO 410-990-4607 [email protected]
John Schaffer Tetra Tech GEO 973-630-8530 [email protected]
Doug Sutton Tetra Tech GEO 732-409-0344 [email protected]
The following individuals from the EPA OSRTI also participated in the optimization site visit:
Kathy Yager
Ed Gilbert
Gary Newhart

3
1.3 DOCUMENTS REVIEWED The following site documents were reviewed. The reader is directed to these documents for additional site
information not provided in this report.
Remedial Investigation Report, Baird & McGuire Site, Holbrook, MA; Volume I (GHR
Engineering Associates, Inc. – May 22, 1985)
Remedial Investigation Report, Baird & McGuire Site, Holbrook, MA; Volume II (GHR
Engineering Associates, Inc. – May 22, 1985)
Remedial Investigation Report, Baird & McGuire Site, Holbrook, MA; Volume III (GHR
Engineering Associates, Inc. – May 22, 1985)
Draft Addendum Report, Remedial Investigation Phase II Baird & McGuire Site (GHR
Engineering Associates, Inc. – April 4, 1986)
Draft Feasibility Study Report, Baird & McGuire Site (GHR Engineering Associates, Inc. – April
4, 1986)
Record of Decision, Remedial Alternative Selection (EPA Region 1 – September 29, 1986)
Record of Decision Summary, Baird & McGuire Site/Sediment Study Area (EPA Regions 1 –
September 14, 1989)
Site Maintenance Plan for the Baird & McGuire Groundwater Treatment Plant
Extraction/Recharge System (Metcalf & Eddy, Inc. – February 25, 1989)
Final Focused Feasibility Study, Baird & McGuire Site, Cochato River Sediment (EPA – June
1989)
Evaluation of Extraction System Performance at the Baird & McGuire Superfund Site (Metcalf &
Eddy, Inc. – July 1995)
Baird & McGuire Superfund Site Operating Unit #3 Monitoring Results (Environmental
Engineering and Hydraulics Branch Water Control Division Engineering Directorate, Department
of the Army – September 1996)
Light Non-Aqueous Phase Liquid Field Investigation Summary Report (McCulley, Frick &
Gilman, Inc. – January 30, 1998)
Evaluation of Potential Future Reuse Opportunities for the Baird & McGuire Site (Metcalf &
Eddy, Inc. – June 5, 1998)
Potential for Advection of Volatile Organic Compounds in Ground Water to the Cochato River,
Baird & McGuire Superfund Site, Holbrook, Massachusetts, March and April 1998 (Jennifer G.
Savoie, Forest P. Lyford, USGS and Scott Clifford, EPA – 1999)
Results of Third Year of Long-Term Monitoring of Sediments and Soils at Baird & McGuire
(Department of the Army, New England District, Corps of Engineers – January 1999)
Fish Ingestion Risk Assessment, Baird and McGuire (Office of Research and Standards, DEP –
January 7, 1999)
Draft Interim Interpretive Report for Cochato River Sampling and Analysis, Holbrook, MA
(Battelle – May 31, 2000)

4
Data Evaluation Report for Cochato River Sampling in November 2001 (Metcalf & Eddy – July
2002)
Data Evaluation Report for Cochato River Sampling in November 2001, Appendices (Metcalf &
Eddy – July 2002)
Site Maintenance Plan (August 28, 2003)
Evaluation of Groundwater Remediation Progress at the Baird and McGuire Superfund Site
(Metcalf & Eddy, Inc. – September 2003)
Data Evaluation Report for Cochato River Sampling in September/October 2002 (Metcalf &
Eddy, Inc. – November 2003)
Data Evaluation Report for Cochato River Sampling in September/October 2002; Appendices
(Metcalf & Eddy, Inc. – November 2003)
Trend Evaluation Report for the Baird and McGuire Superfund Site, Holbrook, Massachusetts
(Metcalf & Eddy, Inc. – September 2004)
Evaluation of Groundwater Remediation Progress at the Baird & McGuire Superfund Site
(Metcalf & Eddy, Inc. – October 2004)
Explanation of Significant Difference, Baird & McGuire Superfund Site, Holbrook, MA,
Operable Units 1 and 2, Groundwater and Source Control Remedies (EPA – April 6, 2005)
Baseline Report for Operable Unit-1 at the Baird & McGuire Superfund Site, Final Draft (SAIC
Engineering, Inc. – December 2005)
November 02, 2007 LNAPL Analysis (GeoLabs, Inc.)
Third Five-Year Review Report (EPA Region 1 – September 29, 2009)
Quarterly Extraction Well Report, 1st
Quarter 2011 (Clean Harbors Environmental Services, Inc.
– Draft April, 2011)
Quarterly Extraction Well Report, 4th Quarter 2010 (Clean Harbors Environmental Services, Inc.
– May 9, 2011)
Arsenic Summary Investigation Report – Part II/IIA, Baird & McGuire Superfund Site (Clean
Harbors Environmental Services, Inc. – Draft August 2011)
Limited Subsurface Investigation, Baird and McGuire, Holbrook, MA (Pine & Swallow
Environmental – August 3, 2011)
Monitoring Well Analytical Results July 2010 (Clean Harbors Environmental Services – August
23, 2011)
Quarterly Extraction Well Report, 2nd
Quarter 2011 (Clean Harbors Environmental Services, Inc.
– Draft September, 2011)
Quarterly Extraction Well Report, 3rd
Quarter 2011 (Clean Harbors Environmental Services, Inc.
– Draft October 12, 2011)
November 11, 2011 LNAPL Analysis (GeoLabs, Inc.)
December 5, 2011 LNAPL Analysis (Columbia Analytical Services, Inc.)
Monitoring Well Analytical Results July 2011 (Clean Harbors Environmental Services – January
15, 2012)

5
Evaluation of Groundwater Remediation Progress, Annual Report – Operable Unit-1, October 1,
2009 through September 30, 2010 (Clean Harbors Environmental Services, Inc. – February 28,
2012)
Quarterly Extraction Well Report, 4th Quarter 2011 (Clean Harbors Environmental Services, Inc.
– March 21, 2012)
1.4 QUALITY ASSURANCE This optimization review utilized existing environmental data to interpret the CSM, evaluate remedy
performance and make recommendations to improve the remedy. The quality of the existing data is
evaluated by the optimization review team prior to using the data for these purposes. The evaluation for
data quality included a brief review of how the data were collected and managed (where practical, the site
QAPP was considered), the consistency of the data with other site data, and the use of the data in the
optimization review. Data that were of suspect quality were either not used as part of the optimization
review or were used with the quality concerns noted. Where appropriate, this report provides
recommendations made to improve data quality.
1.5 PERSONS CONTACTED A site visit was conducted on February 28, 2012. In addition to the optimization review team, the
following persons were present for the site visit:
Table 1-2. Site Visit Attendees
Name Affiliation Email Address
Dorothy Allen MassDEP (DEP RPM) [email protected]
Kimberly White EPA Region 1 ( EPA RPM) [email protected]
Jay Naparstek MassDEP
Steve Mahoney MassDEP
Paul Craffey MassDEP
Maggie
DeLegorete
Clean Harbors Environmental
Services (CHES)
Lisa Irwin CHES
John Irwin CHES
Derrick Golden EPA Region 1 (Regional
Optimization Liaison)
Margaret
McDonough EPA Region 1
Kathy Yager EPA TIFSD
Ed Gilbert EPA TAB
Gary Newhart EPA ERT
Email contact information is provided for the site managers only. Communication with other participants
can be coordinated through the site managers.

6
CHES operates the current treatment plant under contract to MassDEP. CHES also performs
long-term groundwater monitoring under contract to MassDEP. Ed Gilbert and Gary Newhart
from EPA were present as observers.

7
2.0 SITE BACKGROUND
2.1 LOCATION
The Baird & McGuire Superfund Site is located at 775 South Street in Holbrook, Norfolk County,
Massachusetts, approximately 18 miles south of Boston. Figure 1 of the 4th Quarter 2011 Quarterly
Extraction Well Report (see Attachment A) indicates the general site location. Figure 2 of the same report
(see Attachment A) provides a site plan with well locations. The site consists of an approximately 32.5-
acre parcel at the former Baird & McGuire Company, Inc. property. The property is bordered by the
Cochato River to the east and by woodland areas to the north and south. The west side of the site is
adjacent to South Street, which contains both residential and commercial properties. For the purpose of
increased security and access control measures during remedial actions, additional fencing was
constructed in some areas beyond the site boundary (for example, around the groundwater treatment
plant, recharge basins and beyond the southern site boundary).
Ground elevations range from approximately 170 feet (ft) above mean sea level (MSL) on the southwest
corner of the site to approximately 130 ft above MSL to the northeast and in the central portions of the
site. From the west central portion of the site, the topography slopes down to approximately 119 ft above
MSL on the east side of the site at the Cochato River. Wetlands are present in portions of the site. An
unnamed brook, flowing from west to east across the northern portion of the site, drains into the wetland
area in the central portion of the site. The wetlands and unnamed brook discharge into the Cochato River.
Based on a wetland boundary delineation conducted during the remedial investigation (RI), wetlands
occupied approximately 44 percent of the site, and 66 percent of the site was determined to be within the
100-year floodplain.
2.2 SITE HISTORY
2.2.1 HISTORIC LAND USE AND OPERATIONS
Baird & McGuire Inc. operated a chemical mixing and batching facility from 1912 to 1983. Manufactured
products included herbicides, pesticides, disinfectants, soaps, floor waxes and solvents. Waste disposal
methods at the site included direct discharge into the soil, a nearby brook and wetlands and a former
gravel pit in the eastern portion of the site. Underground disposal systems were also used.
2.2.2 CHRONOLOGY OF ENFORCEMENT AND REMEDIAL ACTIVITIES
The third Five-Year Review states:
“The state became involved between 1954 and 1977 and fined the company at least thirty-five
times for violations of the Federal Insecticide, Fungicide and Rodenticide Act of 1947
(FIFRA). In 1981 and 1982 the Massachusetts Department of Environmental Quality
Engineering (DEQE) documented a number of questionable disposal practices. Baird &
McGuire Inc. performed voluntary remedial actions from February to April of 1982. In May
1982, the Board of Selectmen of Holbrook revoked Baird & McGuire's permit to store
chemicals at the site and ordered that existing storage facilities be dismantled. As a result,

8
operations were terminated. Operations at the site resulted in contamination of
groundwater, surface water, soil, and river sediments by organic and inorganic compounds,
pesticides, and herbicides.”
A hydrological study was completed by EPA which initiated some removal actions in 1983. These actions
included the removal of 1,020 cubic yards of contaminated soil, 1 ton of waste creosote, 25 gallons of
waste coal tar, 155 pounds of solid hazardous waste and 47 drums of flammable liquids and solids and 2
drums of corrosives. EPA also oversaw construction of a clay cap, installation of a groundwater
interception-recirculation system, and erection of fencing. The site was added to the National Priority List
(NPL) on September 8, 1983. EPA constructed a security fence in July 1985 to enclose the site.
A Remedial Investigation/Feasibility Study (RI/FS) (I985/1986a, GHR) identified and described the
presence of a groundwater contamination plume originating from the Baird & McGuire property and
extending beyond the Cochato River. EPA issued three Records of Decision (ROD) for the site, defining
four operable units (OU) and describing selected remedial alternatives, as follows:
The first ROD, issued in September 1986, specified groundwater extraction and treatment at an
onsite treatment plant (OU-1) and soil excavation with treatment of the soil at an on-site
incinerator, and disposal of the resulting ash on-site (OU-2).
The second ROD, issued in September 1989, addressed contamination in the sediments of the
Cochato River (OU-3).
The final ROD, issued by EPA in 1990, called for reopening the Donna Road well field to replace
the lost supply resulting from contamination of the South Street well field (OU-4).
The following are brief summaries describing the remedies for each OU:
OU-1: Groundwater. The site remediation program for impacted groundwater at OU-1 has been
in continuous operation since January 1994 and is ongoing. The current system consists of eight
extraction wells (EW-2, EW-3, EW-4A and EW-5 through EW-9), a groundwater treatment
facility and four recharge basins to return treated groundwater to the aquifer. In 1996, light non-
aqueous phase liquid (LNAPL) was discovered in subsurface soil and groundwater in the central
portion of the site. LNAPL recovery began in 1999 and nearly 11,000 gallons of LNAPL were
recovered as of April 2004. Subsequently, LNAPL recovery via this system has diminished to
increasingly negligible amounts. Due to a lack of LNAPL recovery, the LNAPL recovery system
was inactivated in March 2009. Although some LNAPL has subsequently been detected within
the wells associated with the LNAPL system, the specific gravity of the LNAPL appears to be
close to that of water indicating that all LNAPL may not be present as a distinct LNAPL layer
within the well and LNAPL volumes may be higher than indicated by the LNAPL thickness in a
well.
OU-2: Soil. The source control remedy (removal and treatment of contaminated soils)
commenced in June 1995 and was completed in July 1997. Source removal involved the
excavation and onsite thermal incineration of approximately 248,000 tons of contaminated soil
and sediment. The thermally-processed soil from the thermal incineration process was emplaced
onsite by backfilling an excavation area of approximately 12.5 acres within the central portion of
the Site (M&E 1995). All soils excavation and treatment facilities have been decommissioned and
removed and remediation of onsite soil is considered complete.

9
OU-3: Sediments in Cochato River. The remedy for OU-3 involved removal of contaminated
sediments from the Cochato River. This remedy commenced in May 1994 and was completed in
June 1995. Sediments were dredged to a minimum depth of 6 inches and a maximum depth of 24
inches along a 2,100-foot reach of the Cochato River. A total of 4,712 cubic yards of sediments
were removed. A small portion of the riverbed where contaminated groundwater was suspected to
discharge to the river was backfilled with clean organic fill (approximately 438 cubic yards). The
ROD also required erosion control, wetlands restoration, placement of organic fill in the
excavated areas of the river in the vicinity of the groundwater plume and long-term monitoring of
downstream portions of the river where sediments were not excavated. To minimize the
disruption of wetlands, sediments were not to be removed from areas of the river where
contaminant concentrations were low, calculated risks were low and no impacts were observed.
Remediation of Cochato River sediment is considered complete. In accordance with the ROD for
OU-3, long-term monitoring is to be conducted to evaluate remaining contaminant levels and
their behavior over time (EPA, 1989).
OU-4: Replace Water Supply Due to Closing of South Street Municipal Well Field. The remedy
for OU-4 called for reopening the Donna Road well field to replace the lost supply resulting from
contamination of the South Street municipal well field. On August 21, 2003, an Explanation of
Significant Differences (ESD) document was issued for the groundwater remedy (OU-1)
specified in the 1986 ROD. The ROD was changed to include excavation of approximately
400,000 cubic yards of soil from the Upper Reservoir/Great Pond located in Braintree and
Randolph to provide additional storage capacity, resulting in an estimated additional supply of
0.31 million gallons per day (MGD) to be used in the interim to supplement the community's
drinking water until the groundwater remedial action was complete. An ESD was also issued in
August 2003 for OU-4 stating that, due to expansion of the water capacity in the Upper
Reservoir/Great Pond, the reactivation of the Donna Road well field was not necessary, and no
further action would be taken for OU-4.
Thus, the only OU with continuing active remediation is OU-1 (with ongoing monitoring anticipated for
OU-3). Until June 2004, EPA was responsible for the long-term response action (LTRA) at OU-1,
including the P&T system, monitoring (groundwater, surface water, sediment, fish and wetlands),
evaluation of long-term protectiveness of the remedies and the need for institutional controls (ICs). In
June 2004, after the 10 year LTRA period, MassDEP assumed responsibility for operations and
maintenance (O&M) of the OU-1 remedy. In 2005, EPA issued an ESD to incorporate comprehensive ICs
into the OU-1 and OU-2 remedies.
2.3 POTENTIAL HUMAN AND ECOLOGICAL RECEPTORS
Site documents indicate that exposure to contaminated groundwater, soil, sediments and fish tissue are the
primary potential pathways for human exposure to site-related contamination. The third Five-Year
Review indicates that exposure to contamination from the vapor intrusion (VI) pathway could be a
concern if contamination remains in place and the site is developed, but also notes that site development
may be discouraged because much of the site is within the 100-year flood plain and or is wetlands. Based
on previous site documents, human risks associated with exposure to surface water were determined to be
sufficiently low to be protective of human health and the environment either due to low levels of
contamination or incomplete exposure pathways.

10
2.4 EXISTING DATA AND INFORMATION The information provided in this section is intended to represent data already available from existing site
documents. Interpretations included in this section are generally interpretations from the documents from
which the information was obtained. The optimization review team’s interpretation of this data is
discussed in Sections 4.0 and 5.0.
2.4.1 SOURCES OF CONTAMINATION
Baird & McGuire, Inc. was a chemical mixing and batching company that operated from 1912 to 1983.
The most prominent site-related contaminants currently observed in groundwater are arsenic, SVOCs
(primarily naphthalene), and pesticides. VOCs are present but are below cleanup standards in most
sampling locations. Contamination stems from plant operations as well as disposal components and
practices that included:
laboratory sinks that drained indirectly to a nearby surface water
storage tanks overflowed and leaked
an uncovered “beehive” cesspool
an unlined and undiked tank farm,
breach of a creosote collection lagoon
Although these aboveground sources have been addressed by historic remedial activities, ongoing sources
of groundwater contamination likely remain in the subsurface. LNAPL, in the form of free and or residual
product, and contaminated saturated soil beneath the soil excavation remedy likely serve as potential
continuing sources for SVOCs, pesticides and arsenic (that is, the LNAPL contains SVOCs, pesticides
and arsenic). In addition, buried soil and ash from previous site excavation and incineration have elevated
arsenic concentrations (incineration did not removed or destroy the arsenic) and may serve as a
continuing source of arsenic to groundwater under certain conditions.
2.4.2 GEOLOGY SETTING AND HYDROGEOLOGY
Prior to site excavation, the subsurface at the Baird & McGuire site was mainly glacial outwash
overburden which extended from the surface to fractured bedrock at an elevation of approximately 129 ft
above MSL to the west and approximately 20 ft above MSL to the east. Maps of bedrock elevation are
provided in Figures 7 and 7a of a 1985 geophysical investigation (GHR, 1985/1986a), and geologic cross-
sections are presented in Figures 4-1, 4-2, and 4-3 of the RI (see Attachment A). The majority of the
glacial outwash is fine to coarse sand underlain by glacial till. Fine sands and silt underlay the river. In the
wetland and topographically low areas of the site, the glacial deposits are overlain by organic soils. In the
eastern portion of the site, near the Cochato River, the total thickness of overburden material is
approximately 50 ft (GHR 1986).
Based on information in the FS (GHR, 1985/1986a), average values of hydraulic conductivity of the
principal overburden units at the site are 1 × 10⁻³
centimeters per second (cm/sec) for silty sands, sand and
silt; 1.6 × 10⁻²
cm/sec for fine to medium and fine to coarse grained sands; and 3.5 × 10⁻³
cm/sec for
glacial till. The RI reported that hydraulic conductivity of bedrock fractures from packer testing ranged
from 3.3 × 10⁻³
cm/sec to 7.0 × 10⁻¹
cm/sec, indicating variability in bedrock competence. The vertical
extent of fractured bedrock is also variable, ranging from a few ft in many areas to significantly deeper in
other areas. The ash from excavation and onsite incineration was re-deposited onsite to reshape the
landscape similar to its prior geomorphology. During the optimization review site visit, it was stated that

11
the ash is highly heterogeneous, and no tests to date have been performed on the permeability of the
backfilled ash. It was also stated that the “ash” primarily consists of native soil particles and materials that
were not combusted and, thus may give a false impression that the material is very fine clay-like material.
Groundwater elevations at the site range from approximately 130 ft above MSL in the west to
approximately 120 ft above MSL in the east, with flow toward the Cochato River. Depth to groundwater
in the area of OU-1 ranges from the ground surface (adjacent to the river and in the wetlands) to
approximately 50 ft below ground surface (bgs) near EW-8. The P&T system is intended to capture
impacted groundwater prior to discharge to the Cochato River, but no detailed capture zone evaluation
(including full plume delineation) is available to adequately determine the extent of hydraulic capture that
is currently achieved. Potentiometric surface maps prepared by CHES for overburden and bedrock under
pumping are presented in Figures 3 and 4 from the 4th Quarter 2011 Quarterly Extraction Well Report
(see Attachment A).
Site hydrogeology is described further in Sections 4.0 and 5.0.
2.4.3 GROUNDWATER CONTAMINATION
Recent sampling, including the July 2011 sampling event, indicates that naphthalene is the predominant
SVOC remaining in groundwater. Figure B-1 in Attachment B illustrates the extent of SVOCs sampling
in July 2011. Figure B-2 in Attachment B illustrates the extent of arsenic contamination in groundwater in
July 2011. Figure B-3 in Attachment B illustrates the extent of pesticides in groundwater in July 2011.
Each of these figures also indicates the monitoring wells that had observable LNAPL in 2009 or 2010.
VOCs were detected in several site monitoring wells at concentrations less than an order of magnitude
above their respective cleanup standards.
LNAPL extent and thickness was investigated in 1997 (see Figure B-4 in Attachment B). Direct-push
borings, temporary piezometers and monitoring wells were used in addition to visual observation,
photoionization detectors, Sudan dye, and ultraviolet (UV) fluorescence. Focus was placed on evaluating
the extent of measurable LNAPL in the interval from 6 ft above to 4 ft below the water table. Significant
LNAPL collection has occurred since this time. Although the extent of measureable, mobile LNAPL is
limited based on current gaging events (for example, Figure B-4 in Attachment B also indicates the
limited observations of LNAPL between October 2009 and September 2010), there may still be
significant extent of residual LNAPL.
2.4.4 COCHATO RIVER SEDIMENT/SOIL AND SURFACE WATER CONTAMINATION
Based on site reports, sediment/soil and surface water sampling events have included:
Sediments sampled in 1996, 1997, and 1998 by the U.S. Army Corps of Engineers (USACE).
Sediments and fish sampled in 1999 by Battelle under contract to USACE.
Sediment, surface water and fish sampling was taken over by M&E under contract to EPA in
2000.
Sediment, surface water and fish sampling performed by M&E in 2001 and 2002.
Three surface water samples (RS-1 through RS-3) were collected from the Cochato River in
conjunction with the annual sampling event that began on July 26, 2010. Sample RS-1 was

12
collected upstream of the site’s property line as a background sample for arsenic analysis; sample
RS-2 was collected approximately 25 ft downstream from monitoring well MW97-10 for arsenic
analysis; and sample RS-3 was collected from the river at a location approximately even with
monitoring well BM-31B and analyzed for pesticides. The samples were collected using a
peristaltic pump and dedicated tubing for each sample location. No detectable concentrations
above the respective detection levels were reported, and the detection limits were all below the
Maximum Contaminant Level (MCL) or GW-1 Standard.
Contaminants of concern detected in Cochato River sediments within the project area include VOCs,
polynuclear aromatic hydrocarbons (PAHs) (which are a subset of SVOCs), pesticides (including
dichlorodiphenyltrichloroethane [DDT] and chlordane), and arsenic. Sediments and fish tissue sampling
in the Cochato River have not occurred since 2002. However, sediment and surface water sampling was
conducted in 2011 for arsenic in the unnamed brook at the site that discharges to the Cochato River.
The Third Five-Year Review states:
“The second five-year review concluded that there was likely negligible risk to human
recreational receptors exposed to surface water impacted by the site, based on sampling data
collected in 2000. No further surface water sampling was recommended based on this conclusion.
Surface water data from 2000 are compared…to 2009 tap water risk-based screening levels
(EPA, 2009), adjusted upward by a factor of 40 to account for differential ingestion of tap water
and surface water while swimming (2 liters per day for tap water vs. 0.05 liters per swimming
event). This comparison confirms that there is negligible risk associated with surface water
exposure and corroborates the 2004 conclusion that no further surface water sampling is
required.”
Sediment sampling results are discussed further in Sections 4.0 and 5.0.

13
3.0 DESCRIPTION OF PLANNED OR EXISTING REMEDIES
The information provided in this section is intended to represent information already available from
existing site documents. Interpretation included in this section is generally interpretation from the
document from which the information is obtained. The optimization review team’s interpretation of this
information and evaluation of remedy components are discussed in Sections 4.0 and 5.0 of this report.
3.1 REMEDY AND REMEDY COMPONENTS
3.1.1 SOIL REMEDIATION
The Third Five-Year Review describes the implemented soil remedy (OU-2 remedy) as follows:
The source control remedy (removal and treatment of contaminated soils) commenced in June 1995
and was completed in July 1997. All soils excavation and treatment facilities have been
decommissioned and removed. To summarize, the OU-2 remedial activities consisted of the
following:
Approximately 248,000 tons of soil and sediment were excavated and treated by on-site
incineration. Soils were excavated to approximately one foot below the seasonal low water
table within the excavation limits, with excavation depths ranging from approximately 3 to 33
ft bgs;
Approximately 250,000 tons of the treated soil (ash) was backfilled into the 12.5-acre
excavation area (shown in Figure 1 of the Evaluation of Potential Future Reuse Opportunities
for the Baird & McGuire Site, see Attachment A of this report);
Toxicity Characteristic Leachate Potential (TCLP) tests were performed on the ash, and
approximately 320 tons of ash which failed the leaching criteria were stabilized with cement
prior to backfilling to reduce the potential for leaching of contaminants;
The incinerator building and equipment were demobilized and removed from the site and the
incinerator building foundation was crushed and buried on-site; and
Approximately 7.4 acres of forested and scrub/shrub floodplain wetlands underwent onsite
restoration, including a small peat bog and 1,000 linear ft of the unnamed brook.
EPA and M&E concluded from the site visit conducted for the First Five-Year Review that, although
the wetland was not restored with the organic soils recommended in the Final Restoration Plan, the
mitigative measures required by EPA and USACE were met. Initially, the wetland was monitored
annually in order to assess the success of the wetland restoration effort. It was reported that during a
site visit on June 23, 2009, it appeared that the restored wetland was well established and in good
condition.

14
3.1.2 SEDIMENT EXCAVATION
The Third Five-Year Review describes the implemented sediment remedy (OU-3 remedy) as follows:
The remedy for OU-3 involved removal of contaminated sediments from the Cochato River.
This remedy commenced in May 1994 and was completed in June 1995. Major components of
the sediment remedy were site preparation, sediment dredging, placement of organic fill and
monitoring.
In preparation for river excavation, the river banks were cleared and grubbed. A detention
basin was built in the river just downstream of the Union Street bridge to trap suspended
sediments during dredging and then subsequently removed. Temporary haul roads were
constructed and then removed after testing showed no residual contamination. Sediments
were dredged from a 2,100-foot reach of river extending from the Baird & McGuire Site to
the Union Street bridge. Sediments were dredged to a minimum depth of six inches and a
maximum depth of 24 inches in some areas. Dredged material was placed in sealable
containers and transported to the Baird & McGuire exclusion zone where it was stored for
subsequent incineration. A total of 4,712 cubic yards of material were removed from the
river. Dredged material was transported to the incineration facility, incinerated, and placed
as backfill within the OU-2 soil excavation area. Wetlands adversely impacted by the
dredging and the installation of haul roads were restored under the OU-2 Final Restoration
Plan.
The portion of the river where contaminated groundwater underlies the riverbed was
backfilled with approximately 438 cubic yards of clean organic fill. This organic fill was
intended to act as a filter to attenuate concentrations in contaminated groundwater that
might discharge into the river.
Following completion of the remedy, EPA implemented a long-term monitoring plan for the
Cochato River downstream of the dredged area, including analyses of sediment and fish. The
plan included collection and analysis of sediment samples annually for the first five years and
fish samples every 5 years, followed by a review of the data and trends. Sediment and fish
tissue samples were last collected from the Cochato River in 2002.
3.1.3 EXTRACTION SYSTEM
The groundwater treatment and extraction systems were installed in 1993, and with the exception of the
discontinued use of two extraction wells and several treatment train components, have been in use since
1993. During the onsite soils remedy (1993-1997) the treatment plant was primarily used to treat the
discharge from the onsite incinerator and the dewatering water from deep excavations.
The original extraction system included six groundwater extraction wells (EW-1 to EW-6). EW-1 was
decommissioned due to low well yield and minimal contaminant removal. In 1998, EW-7 was installed
and continues to be in operation. EW-8 was added in 1999 in an area of pooled LNAPL. EW-4 was
replaced with EW-4A in 2004 based on groundwater model simulations that suggested EW-4A would
provide improved contaminant recovery. EW-9 was also added in 2004 to extract high levels of
contamination in the northern portion of the site, but EW-9 extracts very little water relative to the
expected extraction rate of 10 gpm. Operation of EW-2 was discontinued in 2006 and operation of EW-5
was discontinued in 2011. Discontinuation of these wells was due to problems with the wells rather than a
decrease in mass removal. The wells pump the groundwater via separate pipes to an extraction well

15
control building, located south of the extraction system, where the water converges to a single header pipe
that conveys the water to the groundwater treatment facility (GWTF). All extraction system controls (for
example, valves, flow meters, electrical switches) are housed within the extraction system control
building. The wells are operated remotely through use of a programmable logic controller (PLC) located
at the GWTF. Each pump motor has a variable frequency drive.
The extraction well locations are shown in Figure 2, 7 and 7a provided in Attachment A. The following
table provides the extraction rates and contaminant concentrations for the operating extraction wells in
December 2011, as reported in the 4th Quarter 2011 Quarterly Extraction Well Report.
Table 3-1. Extraction Well Rates and Influent Concentrations from December 2011
Well
Typical Flow
Rate (gpm)
Arsenic
Concentration
(µg/L)
Naphthalene
(µg/L)
Total Pesticides
(µg/L)
MCP Method 1 GW-1 Standard* 10 140 -
EW-3 3.5 517 385 < GW-1
EW-4 18.1 469 531 < GW-1
EW-6 2.1 200** 258 4.69
EW-7 26.4 305 < GW-1 < GW-1
EW-8 8.3 326 4,830 2.284
EW-9 0.63 4,460 < GW-1 < GW-1*** *Cleanup standards have not been formally established for the site, but the Massachusetts Contingency Plan (MCP)
Method 1 GW-1 Standards are likely candidates for the cleanup standards and are currently used in site documents.
**Average of original and field duplicate samples.
“<GW-1” indicates concentrations are below the MCP Method 1 GW-1 Standard.
*** Pesticides were detected above GW-1 in 5 of 14 sampling events since 2007.
µg/L = micrograms per liter
3.1.4 GROUNDWATER TREATMENT SYSTEM
The original plant design included:
two activated sludge biotreatment units
a fume incinerator
a two-stage metals removal system that used lime for pH adjustment, ferric chloride, and a
polymer
pressure filters
granular activated carbon (GAC).
Due to an insufficient supply of organics in the plant influent to support biological growth in the activated
sludge, the biotreatment units were decommissioned and are now used as air strippers. In addition, two
Value Engineering Proposals resulted in the replacement of the fume incinerator with vapor phase carbon
in 1997 and the use of potassium permanganate for metals removal in 2000.
The current treatment train consists of the following processes:
equalization tank
potassium permanganate addition
rapid mix tank for metals removal
clarifying tanks

16
pH neutralization tanks (no longer required as pH adjustment is no longer needed for metals
removal)
air strippers converted from activated sludge or biological clarifier units
pressure filter feed tank
pressure filters
liquid phase GAC units for removal of organic contaminants from process water
vapor phase GAC units for removal of organic contaminants from air stripper and process tank
off-gas
effluent tank
Water from the pressure filter feed tank is sent in semi-batch mode through the pressure filters and
carbon. The treated water is discharged to one of four infiltration basins (on a rotating basis) at
approximately 150 gpm.
A conceptual schematic of the treatment process is presented in Figure 2A of the 2009/2010 Annual
Report (see Attachment A). Individual treatment processes and the typical pathway of water through the
system are also shown; however, pumps, system controls and pathways for recycling of process water are
not shown.
3.1.5 LNAPL RECOVERY SYSTEM
As an enhancement to the groundwater extraction and treatment systems, a system to recover LNAPL was
installed in 1999. The system was designed to pump directly from three wells (EW-8, MW-97-1 and
MW-98-1) through an oil-water separator to a collection tank. Recovered LNAPL is disposed off-site.
Until June 2004, the LNAPL was mixed with an absorbent (crushed corncobs) prior to off-site disposal.
Starting in June 2004, the State shipped the LNAPL off-site in liquid form. Due to the difficulty in
separating emulsified LNAPL from water, the LNAPL system has not been operated in its original form
for the past few years. LNAPL is occasionally removed with absorbent material on an intermittent basis.
3.2 REMEDIAL ACTION OBJECTIVES AND STANDARDS
3.2.1 GROUNDWATER
The remedial action objectives (RAO) for OU-1 groundwater are:
Remediate the contaminated aquifer within a reasonable time period to prevent present or future
impacts to groundwater drinking supplies;
Protect surface waters from future contaminant migration; and
Minimize long-term damage and or maintenance requirements.
The goal of the extraction and treatment system as documented in the ROD (dated September 30, 1986) is
to contain and remediate the groundwater “within a reasonable time” and to protect groundwater and
surface water. Specific cleanup levels were not specified in the ROD, but the ROD specifies that the
aquifer is a possible source of drinking water. The GWTF was designed to treat groundwater to meet Safe
Drinking Water Act (SDWA) MCLs, which are intended to protect public health and the environment.
Initially, after five years of operation, the EPA was to determine if the restoration target levels are

17
achievable and if they are adequate to protect public health and the environment. EPA has been using
MCLs as target cleanup levels. Currently, plant effluent discharge standards must be below the MCLs, or
when no MCL is given, the applicable standard is based on the MCP Method 1 GW-1 Risk Standards
(GW-1 Standards). For contaminants that have an MCL, the GW-1 Standard equals the MCL. Therefore,
it is appropriate to refer to the GW-1 Standards for the purpose of this report. Table 3-2 provides the GW-
1 Standards for contaminants of concern:
Table 3-2. GW-1 Standards for Contaminants of Concern
* MCL equals GW-1 Standard
** No MCL
3.2.2 SEDIMENTS
The remedial action objectives for site sediments include:
Reduce human exposure to arsenic, DDT, PAHs, and chlordane in sediment by excavating to an
average depth of six (6) inches and by achieving the following levels of contaminants, which
correspond to a 1 x 10⁻⁵
to 1 x 10⁻⁶
excess cancer risk level;
Table 3-3. ROD-Specified Human Health Target Levels for Sediment Contaminants of Concern
Compound Target level (10-5
risk) (mg/kg)
Target level (10-6
risk)
(mg/kg)
Arsenic 2,500 250
Total DDT 190 19
Total Chlordane 50 5
Total PAHs 22 2.2
Reduce environmental exposure to the same 4 contaminants of concern to concentrations
corresponding to the mean sediment quality criteria (SQC) in the river bed, and to the upper
bound SQC in the wetland area north of ice pond.
The ROD anticipated that natural degradative, depositional, and dispersal processes will gradually reduce
contaminant concentrations in the sediment and that sampling in the areas of excavation, in conjunction
with long-term monitoring of downstream portions of the Cochato River that were not excavated, would
confirm the remaining contaminant levels and their behavior over time.
The 2009 Five Year Review evaluated the current risk based on updated risk assessment data. Due to
changes in the risk assessment methods and assumptions that occurred since 1986, including new toxicity
information and the requirement to evaluate compounds with mutagenic modes of action, the potential
Contaminant
GW-1 Standards
(µg/L) Contaminant
GW-1 Standards
(µg/L)
Metals VOCs
Arsenic 10* Benzene 5*
Pesticides SVOCs
4-4 DDD 0.2** 2-Methylnaphthalene 10**
Chlordane 2* Acenaphthene 20**
Dieldrin 0.1** Naphthalene 140**
Pentachlorophenol 1*

18
risks associated with the 1989 cleanup goals were evaluated. The risks associated with the sediment
cleanup goals using this updated information, as reported in the FYR, were as follows:
Table 3-4. 2009 Revised Risk Estimates Associated with 1989 Sediment Cleanup Goals
1989 OU-3 ROD
Cleanup Goals (mg/kg)
2009 Third Five-Year Review
Risk Associated with 1989 Cleanup
Goal
(mg/kg)
Arsenic 250 6 x 10⁻⁵
Total DDT 19 1 x 10⁻⁶
(See note 1)
Total Chlordane 5 Less than 1 x 10⁻⁶
(See note 2)
Total PAHs 22 1 x 10⁻⁴
(See note 3) Notes
1. The 2009 Third Five-Year Review shows that the concentration associated with 1 x 10⁻⁶ is 20 mg/kg, or approximately
the same as the 1989 cleanup goal.
2. The 2009 Third Five-Year Review shows that the concentration associated with 1x 10⁻⁶ is 19 mg/kg which is greater
than the 1989 cleanup goal of 5 mg/kg. Therefore the risk associated with the 5 mg/kg goal is less than 1 x 10⁻⁶.
3. The risk estimate for PAHs is overly conservative because it is based on the assumption that all PAHs present are the
most toxic compound (benzo[a]pyrene). PAHs of lesser toxic potency are likely to be most prevalent.
The optimization review team notes that specific limits to be used for evaluating fish tissue sampling
results moving forward are not clear with respect to values, or with respect the specific source, basis and
or methodology for calculation of the limits. However, the site team indicated that the intent is to evaluate
site-specific risks relative to an acceptable excess cancer risk in the range of 1×10⁻⁴
to 1×10⁻⁶
.
3.3 PERFORMANCE MONITORING PROGRAMS
3.3.1 GROUNDWATER
The monitoring network consists of 66 monitoring wells screened in the glacial overburden, 13
monitoring wells screened in the underlying bedrock and the operating extraction wells. Water levels are
measured quarterly from the monitoring wells, and the measurements are used to develop separate
potentiometric surface maps for the overburden and bedrock.
The 2009-2010 Annual Report indicates that seven extraction wells are sampled on a quarterly basis and
21 monitoring wells are sampled on an annual basis with low-flow sampling. All samples are analyzed for
field parameters (pH, conductivity, temperature, dissolved oxygen, ORP, and turbidity). All operating
extraction wells are sampled for SVOCs, pesticides and arsenic. The suite of analyses conducted on the
monitoring well samples vary from well to well but typically include one or more of the following
analyses: VOCs, SVOCs, pesticides, arsenic and mercury. In 2011, the site team conducted a more
comprehensive sampling event. Samples were collected from all operating extraction wells (5 wells in
2011) and from approximately 60 monitoring wells. All samples were analyzed for metals (including
arsenic and mercury), pesticides, SVOCs and VOCs. The scope of the monitoring program on a move-
forward basis is uncertain at this time.
19
3.3.2 SEDIMENT AND FISH TISSUE SAMPLING
Long-term monitoring of sediments in the Cochato River was performed on an annual basis from 1996 to
2002. The OU-3 ROD called for long-term monitoring of sediments in portions of the Cochato River
downstream of the portion of the river where sediments were excavated as part of the remedy. Long-term
monitoring has also included analysis of fish tissue in order to monitor the impact of the sediments on the
fish population. Fish tissue sampling was conducted in 1992, 1996 and annually from 1999 through 2002.
Surface water samples were collected from the Cochato River in 2000 to establish baseline surface water
quality for the project.
Based on data trends identified from samples collected between 2000 and 2002, a sediment and fish tissue
sampling frequency of every five years was recommended. No further surface water sampling was
recommended in the Second Five-Year Review. No additional sediment or fish samples from the Cochato
River have been collected since 2002.
The Third Five-Year Review recommended that additional sediment samples be collected to determine if
long-term cleanup goals are being attained. In addition, fish tissue sampling was also recommended in
order to determine concentration trends and confirm concentrations due not cause an unacceptable risk. In
the interim, warning signs installed along the river cautioning recreational users about the potential
dangers associated with the ingestion of fish caught from the river are expected to be maintained to
comply with the Department of Public Health advisory for pesticides

20
4.0 CONCEPTUAL SITE MODEL
This section discusses the optimization review team’s interpretation of existing characterization and
remedy operation data and site visit observations to explain how historic events and site characteristics
have led to current conditions. This CSM may differ from that described in other site documents. CSM
elements discussed are based on data obtained from the site team and discussed in the preceding sections
of this report, and in some cases is based on speculation of the optimization review team. This section is
intended to include interpretation of the CSM only. It is not intended to provide findings related to
remedy performance or recommendations for improvement. The findings and recommendations are
provided in Sections 5.0 and 6.0, respectively.
4.1 CSM OVERVIEW
Operations from a chemical mixing and batching facility over a 70-year history resulted in releases to soil
and groundwater from leaking above-ground and below-ground tanks, waste disposal to the land surface,
and other sources. Releases of site-related contamination to the Cochato River included direct discharges
from pipes, contaminated surface water runoff, contact of flood waters with waste disposal areas and
discharge from groundwater to surface water. Contaminants included (but were not limited to) VOCs,
SVOCs, pesticides, and arsenic.
Site conditions have improved significantly due to a combination of factors that include the following:
Discontinuation of site operations by 1983
Removal actions performed by EPA
Soil excavation
Sediment excavation
P&T operation
Soil contaminated with organic compounds (VOCs, SVOCs, pesticides) is no longer present in
unsaturated soil and there does not appear to be a continuing source of groundwater contamination from
unsaturated soil for these specific contaminants. Contaminated river sediments as of the last sampling
event in 2002 were orders of magnitude lower than concentrations detected during the investigation stage.
With only a few exceptions, the VOC groundwater plume (excluding naphthalene, which is also analyzed
as an SVOC) has been remediated below applicable standards. Similarly, concentrations of SVOCs
(predominantly acenaphthene, naphthalene and 2-methylnaphthalene) are generally more than 10 times
above standards within 200 ft of EW-8 (see Figure B-1 in Attachment B), and pesticides are generally
only above standards within 200 ft of EW-8 (see Figure B-3 in Attachment B). Therefore, the remaining
contamination at the site that drives current remediation efforts is the LNAPL and the dissolved arsenic
plume (see Figure B-2 in Attachment B).
It is unclear if the historic extent of measureable LNAPL (see Figure B-4 in Attachment B) was due to
overland transport followed by infiltration, subsurface migration as a separate phase product, or a
combination of both. LNAPL recovery by extraction and oil-water separation was conducted up through
approximately 2009 with decreasing yield. During the site visit, the site team described the remaining
LNAPL as having a specific gravity near 1.0 and as emulsified in groundwater, making LNAPL

21
measurement and LNAPL recovery by extraction and separation difficult. Residual (immobile and
unrecoverable) LNAPL is also likely still present beneath the water table through much of the area where
LNAPL was identified in the 1997 investigation. Laboratory analysis of an LNAPL sample from EW-6 in
2011 indicated that the sample was comprised of approximately 1% pesticides, 1% PAHs, 0.1% VOCs,
and 0.01% arsenic by mass. The remaining mass is likely water and total petroleum hydrocarbons (TPH).
LNAPL observed in different portions of the site may have different compositions if it originated from
different source areas. For example, LNAPL near EW-6 contains pesticides and PAHs based on the 2011
analyses, and these contaminants are detected in groundwater samples from nearby monitoring wells. By
contrast, LNAPL was historically identified in the vicinity of wells MW-97-12, MW-97-21 and MW-97-
22 (GP-3, GP-3A, GP-3C, and GP-6.5 from the 1997 study), and pesticides are not detected in these
wells. PAH concentrations and VOC concentrations are also low in these monitoring wells suggesting
that degradation has occurred over time, but the ORP is still very low (around -100 millivolts [mV]) and
dissolved iron is very high, indicating the presence of substantial degradable organic compounds in this
area. The degradable organic compounds could be residual petroleum hydrocarbons associated with
previously observed LNAPL or could be from the nearby wetlands. The 1997 investigation focused on
LNAPL thickness and the potential for LNAPL recovery. The known extent of LNAPL contamination at
the time of the investigation is shown in Figure B-4 in Attachment B, but it is unclear if LNAPL was
present outside of this area. The current extent of residual LNAPL and dissolved organic compounds
throughout the site are not well understood.
While concentrations of naphthalene, other PAHs and VOCs have declined substantially throughout the
site, the dissolved arsenic plume continues to exhibit high concentrations throughout the plume. Arsenic
concentrations have decreased mildly at some locations over time, though not nearly as much as the
organic contaminants. The dissolved arsenic plume extends from the principal source area in the vicinity
of EW-8 to the Cochato River. Therefore, the mechanisms responsible for the substantial PAH and VOC
remediation (for example, the soil remedy, LNAPL collection, P&T and biodegradation) have had a less
substantial effect on arsenic contamination. Potential sources of observed arsenic groundwater
contamination include remaining LNAPL (free and or residual product), contaminated soils beneath the
excavation remedy, native soils and potentially ash deposited on-site after the soil remedy. Arsenic is
tightly bound to iron hydroxides in the subsurface, but reducing conditions (low ORP) can mobilize iron
(as evidenced by high dissolved iron concentrations in groundwater) and the arsenic previously adsorbed
to it.
The optimization review team speculates that the remaining organic contamination (VOCs, SVOCs, and
potentially other petroleum hydrocarbons) serves as electron donor for microbes in groundwater and
decreases the ORP in much of the aquifer. The optimization review team further speculates that the lower
ORP mobilizes iron within the soil, effectively mobilizing arsenic that was adsorbed to that iron in native
soils and or soil remedy ash. To the extent these speculations are correct, as long as sufficient dissolved
organic carbon is present in groundwater, widespread continuing sources of arsenic will persist. The
wetlands may also contribute to reducing conditions. The relative contributions of arsenic from native
soils, contaminated saturated soil not fully addressed by the excavation, soil remedy ash and LNAPL
cannot be readily determined. Based on data from the 2009-2011 Arsenic Investigation (Clean Harbors
Environmental Services, Inc., 2011), the soil remedy ash generally has a higher arsenic concentration than
native soils; however, arsenic mobilization from native soils is likely sufficient to cause arsenic
concentrations in groundwater above applicable standards. For example, TCLP testing of an arsenic soil
sample from ASB-22 yielded a concentration of 0.534 milligram per liter (mg/L) of arsenic, and the low
ORP of the site groundwater is also likely effective at mobilizing arsenic. The arsenic plume is not fully
delineated, and arsenic contaminated groundwater appears to have been discharging to the river for more
than a decade, particularly in the area of EW-9 and potentially between EW-9 and EW-7.

22
The goal of the groundwater remedy is to return the aquifer to drinking water standards. Much of the site
is within the 100-year flood plain and or is wetlands, which limits future use of the land or underlying
water resource. The Cochato River is the only current potential exposure pathway to human or ecological
receptors.
4.2 CSM DETAILS AND EXPLANATION
4.2.1 GROUNDWATER
Role of ORP in Arsenic Groundwater Contamination
The VOC and SVOC trends at several wells provided in the 2004 Evaluation of Groundwater
Remediation Progress (see Attachment C) provide an indication of the success of various remedy
components, as follows:
VOC concentrations at EW-2, EW-4 and EW-5 decreased by two orders of magnitude between
1995 and 1997, presumably as a result of the soil remedy and associated groundwater extraction.
VOC concentrations at EW-3 and EW-6 started a gradual decline since the wells became
operational in 1994.
VOC concentrations at EW-7 and EW-8 have also significantly declined.
VOC concentrations at downgradient wells MW-97-11 and MW-97-12 also declined significantly
following the soil remedy.
Similar trends have been observed for SVOCs, with the exception that SVOCs generally remain
elevated closer to the source area (EW-3, EW-4a, EW-6 and EW-8) and the immediately
surrounding monitoring wells.
By contrast, arsenic concentrations have remained elevated well above the arsenic cleanup standard of 10
µg/L in many locations, including areas where naphthalene concentrations have declined to well below
the naphthalene cleanup standard of 140 µg/L. In some locations the arsenic concentrations have
remained stable and at other locations the arsenic concentrations have decreased but remain significantly
above applicable standards. Two examples are provided:
MW-97-21 (located close to the Cochato River, just upgradient from EW-7) - Arsenic
concentrations at MW-97-21 have remained above 1 mg/L. The arsenic concentrations in
groundwater have declined (from 2,200 µg/L in April 2002 and 1,310 µg/L in April 2004 to
1,150 µg/L in July 2010 and 989 µg/L in July 2011) but remain well above the arsenic cleanup
standard of 10 µg/L, whereas the naphthalene concentrations in groundwater declined more
substantially over the same period (from 1,200 µg/L in April 2002 and 560 µg/L in April 2004 to
55 µg/L in July 2010) and are well below the naphthalene cleanup standard of 140 µg/L. Data
from the 2011 Draft Arsenic Summary Investigation Report – Part II/IIA (Clean Harbors
Environmental Services, Inc., 2011) indicate that groundwater at ASB-12 (in the vicinity of MW-
97-21) is in contact with soil remedy ash that has an arsenic concentration of 29.6 milligrams per
kilogram (mg/kg). The ORP at MW-97-21 was -100.4 mV in July 2010 and -111 mV in July
2011. The iron in groundwater at MW-97-21 is also elevated (16 mg/L), indicating that iron, that
might otherwise adsorb arsenic, has been mobilized. The combined VOC and SVOC
concentration (VOC + SVOC) is approximately 200 ug/L. This relatively small degree of VOC +
SVOC contamination is not likely the sole driver of the low ORP. Potential contributors to the
reducing conditions may include VOC or SVOC tentatively identified compounds (TICs) that are

23
not reported by the laboratory, TPHs (which are not analyzed for) or organic matter from the
wetlands.
MW-97-17 (located near the predominant source area, just east of EW-8) - The arsenic
concentration in 1998 at MW-97-17 (further upgradient from MW-97-21) remain have remained
stable (from 470 µg/L in April 2002 and 390 µg/L in April 2004 to 425 µg/L in June 2010) well
above the arsenic cleanup standard of 10 µg/L, whereas the naphthalene concentrations in
groundwater declined substantially over the same period (from 420 µg/L in April 2002 and 200
µg/L in April 2004 to 6 µg/L in June 2010) and are well below the naphthalene cleanup standard
of 140 µg/L. Samples of soil ash are not available for this location. The ORP at MW-97-17 was -
105 mV in July 2010 and -54.7 mV in July 2011. The VOC and SVOC concentrations at this
location are even lower than those at MW-97-21, and the monitoring point is not co-located with
wetlands. VOC, SVOC or TICs that are not reported by the laboratory or TPHs (which are not
analyzed for) are likely the cause of the low ORP.
Figures B-5 through B-8 (See Appendix A) illustrate the relationship between ORP and arsenic and iron
mobilization in the vicinity of these two wells and several other wells. One of the other wells is MW-97-
20, for which the ORP is higher and the arsenic and iron concentrations are significantly lower. Figure B-
9 plots the ORP vs. arsenic concentration for the July 2011 sampling data. The following observations
and interpretations are noteworthy:
For samples collected from unconsolidated material within the former excavation, low ORP (for
example, less than -50 mV) correlates to high arsenic concentrations.
Samples with ORP above -50 mV have low arsenic concentrations and samples with ORP above
0 mV have generally undetectable arsenic.
Samples of bedrock groundwater have very low ORP and no arsenic. These results confirm that
arsenic is not present in the bedrock groundwater. The low ORP of the bedrock is likely due to
the geologically old groundwater that has low dissolved oxygen and a low ORP resulting from
interactions with various mineral species rather than microbial metabolism of organic
contaminants.
The strong correlation between arsenic and ORP shows a relationship, but does not necessarily demonstrate
that the low ORP is the cause of the high arsenic. For example, it is possible that the LNAPL is the cause of
the high arsenic and also provides organic compounds that foster microbial activity and lower the ORP.
However, the documented effect that low ORP has on mobilizing iron and arsenic suggests that there likely
is a causal relationship. The low ORP might be a potential mechanism for releasing adsorbed arsenic and is
also likely a cause for inhibiting dissolved arsenic from adsorbing to soils.
Although the 2011 arsenic investigation included Synthetic Precipitation Leaching Procedure (SPLP)
testing of the ash from various locations, the SPLP test considers reduced pH but does not consider a
lower ORP. Therefore, the SPLP testing may not have accurately represented the potential for arsenic
mobility at this site. One TCLP test (on ash from ASB#22), which uses a lower pH than the SPLP test but
also does not consider a low ORP, resulted in leaching 0.5 mg/L of arsenic from site soils, suggesting the
potential for some arsenic to be mobilized from some site soils.
Distribution of Arsenic
Figure B-2 provides a general plan view of horizontal arsenic distribution. Until the recent arsenic
investigation, the arsenic plume maps did not portray arsenic in the vicinity of soil borings ASB-9, ASB-

24
10, ASB-16, and ASB-22 (“ASB-22 area”). Rather, arsenic was depicted primarily along the area of
known LNAPL extent and as an isolated hot spot near the location of current well EW-9. The
identification of this new area of high-level (greater than 1 mg/L) arsenic groundwater contamination
raises the question as to the source of this arsenic. The following are potential considerations when
evaluating potential sources of this arsenic:
This area was not known to have LNAPL; however, this historic interpretation may be due to the
general lack of data in the area.
Site soils (both replaced incinerated soil and saturated soil) have high levels of arsenic in this area
as evidenced by samples from ASB-22. Furthermore, TCLP testing of incinerated soil from ASB-
22 shows that soil in this area is capable of releasing significant levels of arsenic to groundwater
under certain conditions. Note that SPLP testing also showed arsenic leaching, but to a much
lesser extent and below GW-1 Standards.
This area lies directly between the river and the known source area of arsenic near EW-6 and
EW-4A, suggesting the potential that arsenic contaminated groundwater could be migrating into
this area on its way from the source area to the river. Arsenic concentrations over 1 mg/L and low
ORP (below -100 mV) were observed in samples from MW-97-28 and MW-04-01 during the
July 2011 groundwater sampling event. These two wells are installed in a location that could be
considered upgradient of the ASB-22 area.
The observed LNAPL in the area of known LNAPL extent (to the southeast of the ASB-22 area)
might have migrated by overland flow and subsequent infiltration rather than, or in addition to,
subsurface migration. If this is the case, the contamination in the area of known LNAPL extent
could be due primarily to overland flow, and the contamination in the ASB-22 area could be due
to the principal direction of groundwater flow coupled with contaminated soils in contact with
groundwater.
The arsenic investigation also clarifies the vertical distribution of arsenic in groundwater. The highest
arsenic concentrations (over 1 mg/L) were detected between the shallowest sampling intervals and 20 ft
bgs. All detected arsenic concentrations below 20 ft bgs were below 0.2 mg/L and most were below 0.1
mg/L, suggesting a significant attenuation of arsenic contamination with depth. The arsenic
concentrations in groundwater at the soil boring ASB-22 location are presented below.
Sample Interval
(ft bgs)
Sample Depth Below
Water Table (ft)
Arsenic
Concentration (mg/L)
3-5 At water table 0.697
8-10 5-7 0.791
11-13 8-10 NA
13-15 10-12 2.07
15-18 12-15 NA
18-20 15-17 2.92
20-23 17-20 NA
23-25 20-22 0.701
25-28 22-25 NA
28-30 25-27 0.0254
30-40 27-37 NA

25
A plume core appears to be present from as shallow as 8 ft below the water table to as deep as 20 ft below
the water table. Elevated concentrations (above 0.7 mg/L) are present above and below this plume core.
The data support the potential for contribution of arsenic from the unsaturated zone, from upgradient, and
or shallow saturated soils.
4.2.2 COCHATO RIVER SEDIMENTS
The Cochato River is the only current potential exposure pathway for human or ecological receptors to
site-related contamination. Some of the contamination may remain in sediments following the sediment
remedy (OU-3 remedy), and some arsenic contamination may continue to discharge to the river from
groundwater. Due to the absence of consistent sediment sampling, it is difficult to determine if the
discharge of arsenic to the river from groundwater is sufficient to increase impacts to sediment or fish
tissue over time. Conceptually, arsenic that precipitates after discharging to the river could add to
sediment impacts over time near the site and or downstream from the site. In contrast, arsenic generally is
not expected to bioconcentrate in fin fish. It is also difficult to determine if a discontinuation in pumping
would result in a noticeable difference in sediment arsenic concentrations over time. Due to the
effectiveness of the soil and groundwater remedies, little or no PAH or pesticide contamination appears to
be discharging to the river from groundwater. Sediment sampling results are discussed further in Section
5.0.
4.3 DATA GAPS There are several data gaps associated with the CSM, including the following:
The extent of residual LNAPL, horizontally and vertically and above and below the water table,
is unknown.
The extent of arsenic contaminated soil, horizontally and vertically below the water table, is
unknown.
The extent of the arsenic plume and pathways for arsenic migration are not fully understood,
including a potential link between the area of wells EW-4A, EW-6 and EW-8 and the area of soil
borings ASB-4, ASB-9, ASB-10 and ASB-16.
The extent and magnitude of the dissolved organic carbon plume and the primary compounds
comprising this plume are unknown.
The relative contribution of the wetlands to the reducing conditions that may be mobilizing
arsenic is not known.
It is not known if sufficient iron is available in native soils to adsorb all of the arsenic if the ORP
is increased.
Current contaminant concentrations in river sediments and fish tissue are unknown.
The effect contaminated groundwater has on river sediments and or fish tissue under pumping or
non-pumping conditions is unknown.

26
4.4 IMPLICATIONS FOR REMEDIAL STRATEGY
Although water quality data suggest that arsenic groundwater contamination drives the remedy, the
optimization review team speculates that the groundwater remedy may actually be driven by low ORP
conditions that either mobilizes arsenic from site soils or allows arsenic from other sources (for example,
the LNAPL) to remain mobile. The optimization review team further speculates that the low ORP
conditions contributing to arsenic mobility are likely the result of residual organic contamination. If these
speculations are correct, timely remediation would require focusing on reducing residual organic
contamination and increasing the ORP in groundwater. If the site team chooses to improve the existing
migration control remedy, a target capture zone needs to be determined. In addition, if the site team
chooses to continue to operate and or upgrade the containment remedy, the contaminant transport
pathways and areas of continuing sources need to be better identified so that extraction wells can be
properly located to provide long-term migration control.

27
5.0 FINDINGS
The observations below are the interpretations of the optimization review team offered as constructive
information in the best interest of the EPA and the public. They are not intended to imply a deficiency in
the work of the system designers, system operators or site managers. These observations have the benefit
of being formulated based upon operational data unavailable to the original designers. Furthermore, it is
likely that site conditions and general knowledge of groundwater remediation have changed over time.
5.1 SOURCES
5.1.1 THE SOIL REMEDY HAS SIGNIFICANTLY REDUCED VOC AND SVOC
GROUNDWATER CONTAMINATION
See Section 4.0 for details.
5.1.2 RESIDUAL LNAPL THROUGHOUT MUCH OF THE SITE MAY CONTINUE TO SERVE
AS A SOURCE OF LNAPL AND DISSOLVED ORGANIC CARBON
See Section 4.0 for details.
5.1.3 LOW ORP (POTENTIALLY CAUSED BY RESIDUAL DISSOLVED ORGANIC CARBON)
MAY BE MOBILIZING ARSENIC FROM SITE SOILS AND SOIL REMEDY ASH AND IS
ALLOWING ARSENIC IN GROUNDWATER TO REMAIN MOBILE
See Section 4.0 for details.
5.2 GROUNDWATER
5.2.1 LNAPL DELINEATION
The extent of residual LNAPL has not been delineated. See Section 4.0 for more information.
5.2.2 PLUME DELINEATION
The arsenic plume and migration pathways are not clearly understood because significant arsenic impacts
between EW-7 and EW-9 have recently been identified but this area of contamination has not been
definitively linked to a specific source area. Unlike other areas of elevated arsenic contamination, there
are no data in that area for LNAPL, VOCs, SVOCs or ORP. The optimization review team believes a
reasonable explanation for arsenic in this area is migration from the source area in the vicinity of wells
EW-4A, EW-6 and EW-8.

28
5.2.3 PLUME CAPTURE
The arsenic plume may be captured in the area of EW-7, but the optimization review team speculates that
other portions of the plume are likely not captured. Contamination from the 2009-2011 Arsenic
Investigation (Clean Harbor Environmental Services, Inc., 2011) identified arsenic between wells EW-7
and EW-9. Monitoring well BM-31B is one of the few monitoring wells in this area, and in 2007 and
2008, this well had some of the highest arsenic and pesticide concentrations detected in site monitoring
wells. It is unclear if these detections are indicative of a core area of plume migration or if the detections
of total arsenic and pesticides are a manifestation of the sampling procedure (for example, a turbid
sample). The well is indicated as damaged, and no distinct migration pathway between the principal
source area and this well has been delineated. No extraction wells are located in the area between EW-7
and EW-9. EW-4A may have been installed to intercept contamination along this migration pathway, but
insufficient data are available to evaluate the effectiveness of EW-4A to capture the plume in this area. In
addition, the plume is likely not captured in the vicinity of EW-9 due to the underperformance of EW-9
due to the actual flow rate being significantly lower than the expected flow rate from previous
groundwater modeling. The design extraction rate for EW-9 was 10 gpm; however, the well yields less
than 1 gpm on average. The width of the arsenic plume in the vicinity of EW-9 is also not well-defined.
5.2.4 GROUNDWATER CONTAMINANT CONCENTRATIONS
VOC and SVOC concentrations in groundwater have declined significantly and only a few locations
remain above applicable standards. Arsenic concentrations remain elevated significantly above applicable
standards over a much larger extent, particularly near the Cochato River in the vicinity of EW-7 where
naphthalene concentrations have decreased below standards.
5.3 SEDIMENT
Table 3 of the report “Operating Unit 3 Monitoring Results” (USACE, September 1996) provides results
of samples from sediments remaining after the sediment excavation was performed. The Third Five-Year
Review discusses sampling results from the latest event in 2002. Sediment-related observations provided
by the optimization review team include the following:
For arsenic, the samples for sediments left in place were all below the 1989 250 mg/kg cleanup
goal. The maximum concentration of arsenic in sediment from the 1989 sampling was 154 mg/kg,
and the maximum arsenic concentration from the latest sampling in 2002 was 110 mg/kg. The
risk associated with potential exposure to these concentrations of arsenic, using updated toxicity
values are within the acceptable risk range.
For total PAHs, the samples for sediments left in place were mostly below the 1989 22 mg/kg
cleanup level (seven of 46 were above 22 mg/kg, with three above 100 mg/kg. The maximum
concentration from the most recent sampling in 2002 is 11 mg/kg.
For pesticides, the samples of sediments left in place were all below the 1989 cleanup goals.
The risks associated with the concentrations in sediment were evaluated as part of the Third Five-Year
Review using updated toxicity information. The risks are within the EP acceptable risk range. The 2004
Trend Evaluation Report (Metcalf & Eddy, Inc., 2004) presents trends in sediment concentrations from
1996 through 2002 collected from five stations as depicted in Figure 3 of the same report (see Attachment
A). The optimization review team provides the following observations:

29
The DDT and chlordane concentrations in sediments remained relatively stable over the sampling
period.
The PAH concentrations showed significantly more variation over the sampling period as
compared to pesticides. Increases in PAH concentrations were noted in two stations in the 2000 to
2001 time period, followed by decreases. One of the stations with a substantial increase was
Station E, which is adjacent to the site.
The arsenic concentrations were relatively consistent over the sampling period, with the largest
variability found in Stations C and D which are located more than 3,000 ft downstream from the
site. The arsenic concentrations in the stations near and upgradient of the site were generally close
to the 6.1 mg/kg criteria established in the 2009 Five-Year Review. The samples downgradient of
the site were generally higher than the 6.1 mg/kg criteria but within the acceptable range for
excess risk of 1×10⁻⁴
to 1×10⁻⁶
.
The number of samples collected relative to the area of interest, the frequency of data collection
(specifically, no samples since 2002), potential changes in sampling methodologies and fluctuating nature
of the results, make it difficult to determine the effect of the soil and groundwater remedy on contaminant
concentrations in sediment.
5.4 TREATMENT SYSTEM COMPONENT PERFORMANCE
5.4.1 EXTRACTION SYSTEM
The extraction system is in poor and deteriorating condition. The extraction rate in 2001 was
approximately 127 gpm but has decreased over time to a current extraction rate under 60 gpm, in part due
to underperforming or deteriorating extraction wells. The site team notes that the construction of the
monitoring wells includes dissimilar metals and the associated corrosion is causing the screen to separate
from the casing. EW-5 was recently shut down due to this type of problem. EW-9 never provided the
anticipated flow and typically operated at an average extraction rate of less than 1 gpm.
5.4.2 TREATMENT SYSTEM
The treatment system is also in deteriorating condition and has several underperforming components.
Some of the components of the original design are no longer appropriate. The optimization review team
notes some of these issues:
The site team reports that multiple tanks are showing signs of corrosion and some tanks have
required patching to replace leaks caused by corrosion.
Solids removal is apparently problematic causing relatively frequent GAC change outs
(approximately 4 per year) relative to the frequency expected due to chemical loading. Poor
solids removal appears to be caused by undersized metals removal system clarifiers, inadequate
oxidation, and or other aspects with the metals removal system and filtration system. The site
team reports less frequent GAC change outs recently, but this is due to the lower extraction rate.
The site team’s experience with attempting to bypass the former activated sludge (biological
clarifiers) and the ongoing need to remove solids from these units suggests carryover of solids
from the metals removal system clarifiers that are settling in the aeration basins, filtered by the

30
pressure filters, and or passing through the pressure filters. Turbidity readings entering and
leaving the pressure filters meet the design criteria, but the optimization review team has seen
cases where turbidity readings were not adequate for evaluating solids removal.
The system has a two-stage metals removal system. Each stage has a reaction tank and clarifier. A
treatment plant with one appropriately designed and operated metals removal system should be
adequate.
The system relies on former activate sludge or biological clarifier units as air strippers and solids
settling capacity. The units were originally intended to be used as bioreactors to treat influent
with high organic contaminant concentrations. However, the organic contaminant concentrations
have been lower than expected since system operation began, and the systems (which have
concentric circular compartments for aeration and settling) have been used as inefficient air
strippers and clarifiers.
5.5 REGULATORY COMPLIANCE The system routinely meets discharge requirements.
5.6 COMPONENTS OR PROCESSES THAT ACCOUNT FOR MAJORITY OF ANNUAL
COSTS Table 5-1 provides a breakdown of the approximately $900,000 annual routine costs for the current
remedy in 2011 based on information provided by the site team. The total extraction rate during this time
period was generally under 70 gpm. GAC, permanganate and polymer usage, and waste generation,
reflect this relatively low extraction rate. The other categories are relatively insensitive to flow rate.

31
Table 5-1. Summary of Current Annual O&M Costs
Category 2011
Cost Comments
Project Management $ 52,000
These are contractor costs and includes monthly lump sum
$2,716 for plant operation as well as monitoring well sampling
and analytical results reporting
Operations Labor $ 573,000 This includes operators as well as mechanic's time
Materials $ 44,000
GAC, polymer and permanganate. Includes the following:
two GAC change outs at $8,080 per change out
approximately 6,000 pounds of potassium
permanganate at $4 per pound*
approximately 500 pounds of polymer at approximately
$10 per pound*
Waste Disposal $ 11,000 For approximately 30 tons of non-hazardous waste*
Utilities – Electric $ 79,000 $0.126/ kilowatt-hour (kWh)
Utilities – Gas $ 15,000 $1.082/therm (100,000 British thermal units)
Groundwater sampling $ 86,000 Includes the annual sampling of wells which includes analytical
and yearly report
Laboratory analytical $ 21,000 Operations and field samples includes quarterly samples (but
not annual sampling event)
Other routine costs $ 44,000 Includes replacement parts and supplies
Total $ 889,000 Approximate total for routine O&M costs in 2011
* Estimated by the optimization review team
In 2011 there were also non-routine costs of approximately $30,000 pertaining to the Five-Year Review
activities and arsenic studies.
5.7 APPROXIMATE ENVIRONMENTAL FOOTPRINTS ASSOCIATED WITH
REMEDY The following table presents the approximate environmental footprint on an annual basis for operation of
the existing P&T system operating at approximately 60 to 70 gpm. The footprint is calculated in general
accordance with the EPA’s Methodology for Understanding and Reducing a Project’s Environmental
Footprint (EPA, February 2012).

32
Table 5-2. Estimated Environmental Footprint for Annual P&T Operation
Core
Element Metric
Unit of
Measure
Metric
Value*
Materials
& Waste
M&W-1 Refined materials used on-site tons 20
M&W-2 Percent of refined materials from recycled or waste
material percent None
M&W-3 Unrefined materials used onsite tons None
M&W-4 Percent of unrefined materials from recycled or
waste material percent None
M&W-5 Onsite hazardous waste generated tons None
M&W-6 Onsite non-hazardous waste generated tons 30
M&W-7 Percent of total potential on-site waste that is
recycled or reused percent None
Water
Onsite water use (by source)
W-1 - Potable water: chemical blending, injected to
aquifer
millions of
gals Limited
W-2 - Groundwater: treatment, reinjected to aquifer
millions of
gals 34
W-3 - Source: use, fate combination #3
millions of
gals None
W-4 - Source: use, fate combination #4
millions of
gals None
Energy
E-1 Total energy use MMBtu 10,250
E-2 Total energy voluntarily derived from renewable
resources
E-2A - Onsite generation or use and biodiesel use MMBtu None
E-2B - Voluntary purchase of renewable electricity MWh None
E-2C - Voluntary purchase of Renewable Energy
Certificates (REC) MWh None
Air
A-1 On-site NOx, SOx and PM10 emissions Lbs None
A-2 On-site HAP emissions Lbs None
A-3 Total NOx, SOx and PM10 emissions Lbs 10,546
A-4 Total HAP emissions Lbs 139
A-5 Total GHG emissions tons CO2e 751
Land &
Ecosystems No significant effect on land and ecosystems.
* Estimated metric value for one year of operation
NOx = nitrogen oxide
SOx = sulphur oxide
PM10 = Particulate Matter
HAP = hazardous air pollutants
GHG = greenhouse gas
gals = gallons
MMBtu = 1 million British Thermal Units
MWh = megawatt-hour
lbs = pounds
CO2e = carbon dioxide equivalent
The primary contributor to the materials metric is the virgin GAC that is used for treatment. The primary
contributors to the energy use are the electricity use (more than 70 percent of the total energy use) and
natural gas use (more than 15 percent of the total energy use). These contributors are also among the

33
largest contributors to the air emissions footprints. The GAC contributes almost 20 percent of the GHG
emissions.
5.8 SAFETY RECORD The site team did not report any safety concerns or incidents.
34
6.0 RECOMMENDATIONS
Several recommendations are provided in this section related to remedy effectiveness, cost control,
technical improvement and site closure strategy. Note that while the recommendations provide some
details to consider during implementation, the recommendations are not meant to replace other, more
comprehensive, planning documents such as work plans, sampling plans, and QAPPs.
Cost estimates provided herein have levels of certainty comparable to those done for Comprehensive
Environmental Response, Compensation, and Liability Act (CERCLA) FSs (-30%/+50%), and these cost
estimates have been prepared in a manner generally consistent with EPA 540-R-00-002, A Guide to
Developing and Documenting Cost Estimates During the Feasibility Study, July, 2000. The costs
presented do not include potential costs associated with community or public relations activities that may
be conducted prior to field activities. The cost impacts of these recommendations are summarized in
Tables 6-1 and 6-2.
Figure 6-1 presents a flowchart that summarizes potential remediation scenarios (identified as “A”
through “D” on Figure 6-1), and some of the decisions that will determine which scenario ultimately
occurs. Figure 6-1 is referenced in the discussion of some of the recommendations provided below.
{This Space Intentionally Left Blank}

35
Figure 6-1. Flowchart Summarizing Potential Remediation Scenarios

36
6.1 RECOMMENDATIONS TO IMPROVE EFFECTIVENESS
6.1.1 RESUME FISH SAMPLING
As indicated on the flowchart presented on Figure 6-1 (see Appendix A), the optimization review team
recommends that fish tissue sampling be performed under existing conditions, and then periodically at the
frequency recommended in the Third Five-Year Review (every five years) to monitor future
concentrations. Also, the optimization team recommends that data quality objectives for analyzing fish
tissue moving forward be clearly documented. At the request of site stakeholders, the optimization
provides specific recommendations below for collecting fish tissue samples, and suggests that the site
team use this as a starting point to finalize a sampling approach with respect to fish tissue that will be
acceptable to all site stakeholders for evaluating protectiveness.
The optimization review team does not recommend sampling different stations (upstream, adjacent and
downstream). Rather, the optimization review team recommends that fish sampling be performed in the
location closest to the site (adjacent to or downstream from the site) where fishing might reasonably occur
by the general public for purposes of consumption. It is recommended that the sampling focus on the
following fish:
Abundant fish (for example, sunfish species such as bluegill and or pumpkinseed) – these are
expected to be relatively abundant, and therefore are good species to target for long-term trends
Predatory fish (for example, largemouth bass and or brown bullhead) – these represent large
fish that are desirable for consumption. The largemouth bass may be more plentiful.
Although American eel has been collected in previous studies, they are migratory (less desirable) and also
more difficult to collect and handle and may not be present in sufficient numbers to collect a
representative sample as individual replicate samples. It is recommended that three individual fish from
one of the selected sunfish species, and three individual fish from one of the selected predatory species,
be collected per event. For abundant fish, filets can be sampled for fish longer than 6 inches, and whole-
body analysis can be performed for fish less than 6 inches. For predatory fish, all fish collected for
sampling should be larger than 6 inches.
The preliminary costs for preparing an updated sampling plan for fish tissue sampling is estimated to be
$9,000. The estimated cost to conduct the fish tissue sampling is estimated to be approximately $25,000.
The costs for clarifying and documenting the criteria have not been estimated.
6.1.2 SAMPLE THE COCHATO RIVER SEDIMENTS USING THE INCREMENTAL SAMPLING
METHODOLOGY
Sediment sampling provides two benefits for the remedy. First, it helps track the quality of the river over
time subsequent to remedial activities to date. Second, it helps evaluate the effectiveness of continuing
remedial activities in protecting river sediments from further contamination. The sampling data to date are
subject to significant variability that makes data interpretation difficult. Sampling has previously been
conducted at five stations. Four stations (A through D) were divided into nine intervals, and three
intervals at each station were selected at random to be sampled in each event. Stations A, B and D are
approximately 450-foot stretches of river (9 intervals of 50 ft each), and Station C is a 900-foot stretch of
river (9 intervals of 100 ft each). Only one sample was collected from Station E. The samples from the
three intervals per station (except Station E) were therefore used to represent sediment concentrations for

37
each 450-foot or 900-foot station. The ranges of the sampling results for a given year were sometimes
higher than the year to year variability, making it difficult to evaluate changes in river condition over
time. One potential way of collecting more representative samples from each interval is to use the
incremental sampling methodology (ISM) as described in the Interstate Technology Regulatory Council
(ITRC) web-based ISM document (www.itrcweb.org/Team/Public?teamID=11). ISM has the benefit of
submitting fewer samples for laboratory analysis and providing more representative results for each
station.
Because sediment sampling is suggested to be performed to evaluate conditions over time, rather than to
delineate specific target areas for remediation, the optimization review team recommends considering the
use of ISM for sediment sampling for future samplings at each of the five stations. The optimization
review team recognizes that there has not been widespread use of ISM for sediments to date, but given the
intended use of the data, the use of ISM for sediment sampling at this site seems appropriate. The specific
details of an ISM work plan are too detailed to provide in this report, but a general description with site-
specific context is provided.
Using the ISM terminology, the site team could consider each existing station both a “decision unit (DU)”
and a “sampling unit (SU)”. Each DU/SU (station) would be sampled over time and used to determine if
sediment concentrations are generally increasing or decreasing over time in that DU/SU. Each DU/SU
would be divided into a sub-network of perhaps 45 equally-sized grid areas. Sediments are collected as
sample increments from each of the 45 grid areas in a single DU/SU and combined into a single
“incremental sample” for laboratory analysis. The result for each sampling station is a single laboratory
sample that averages the contaminant concentrations from 45 locations, rather than the previous approach
where three discrete laboratory samples are analyzed and then averaged. Although additional
“incremental samples” could be collected for each station, the optimization review team does not believe
that additional benefit from these samples merits the additional cost given the intended use of the data.
The applicability of using an ISM approach over a more traditional grid or transect approach can be
assessed, if desired, by also collecting a limited number of discrete samples.
Repeated ISM sampling on an annual basis will provide increased confidence in the results with each
event that is conducted and hopefully provide a meaningful data set for evaluating trends over time. The
optimization review team estimates that up to $15,000 will be required for developing an ISM sampling
plan. The optimization review team also estimates that the sampling could be conducted within five days
per event with a two-person crew. Six samples (including one QA/QC sample) would be submitted to a
laboratory for analysis for SVOCs, pesticides and arsenic. Results can be reported in the annual report.
The estimated cost for each annual event, including sampling, laboratory analysis, data management and
reporting should be approximately $15,000.
6.1.3 CONDUCT SPECIATION ANALYSIS FOR ARSENIC IN SELECT MONITORING WELLS
Arsenic can be present in the subsurface as arsenate (oxidized and potential to be immobilized), arsenite
(reduced and mobile), and organic (methylated) arsenic (mobile). Eliminating the organic contamination
(for example, VOCs, SVOCs and TPH) and increasing the ORP can convert the arsenite to arsenate and
allow the arsenate to adsorb to the soil matrix; however, this change in ORP will not address organic
arsenic. The relationship between ORP and arsenic is fairly well established for the areas near EW-7 and
EW-8; however, insufficient data are available for evaluating the ORP/arsenic relationship in the area of
ASB-9 and ASB-16. The optimization review team recommends conducting one round of arsenic
speciation analysis (including methylated arsenic) on wells MW-97-12, MW-97-28 and MW-04-02. In
addition, during the next mobilization of a direct-push rig to the site, one or more groundwater samples
from the vicinity of ASB-9 and ASB-16 should be analyzed for VOCs, SVOCs, TPH, ORP and speciated

38
arsenic samples. The additional cost of this recommendation, if coordinated with other direct-push
sampling, should be under $5,000.
6.1.4 ADD TOTAL PETROLEUM HYDROCARBONS AND TOTAL ORGANIC CARBON TO
LABORATORY ANALYSES FOR ROUTINE GROUNDWATER MONITORING
The CSM discussed in Section 4.0 incorporates speculation by the optimization review team that ongoing
arsenic contamination and continued arsenic mobility in groundwater could be linked to low ORP that
might be caused by microbial degradation of organic contaminants. The VOCs and SVOCs are only a part
of the organic compounds contributing to the low ORP. TPHs are also a potential source. To better
evaluate a potential correlation between residual organic contamination versus low ORP (see
recommendation in Section 6.3.1) and high arsenic concentrations, the optimization review team
recommends adding TPH and total organic carbon (TOC) to the analyte list for the groundwater
monitoring program. Assuming 30 wells monitoring wells are sampled on an annual basis, including
these additional analytes in the monitoring program would add an additional $3,000 per year in laboratory
costs.
6.1.5 PERFORM LEACHING TESTS ON SITE SOILS TO BETTER UNDERSTAND IF SITE
SOILS ARE A CONTINUING SOURCE OF ARSENIC
To further address the speculation by the optimization review team that ongoing arsenic contamination
could be linked to low ORP that might be caused by microbial degradation of organic contaminants, it is
recommended that some controlled tests be designed and performed to assess the leaching of arsenic from
the site soils (saturated soils and incinerated soil/ash) under varying conditions of ORP. It is suggested
that tests be performed using site soils from several key locations where high arsenic concentrations have
been identified and source material might be suspected, and that different tests be performed using site
water versus “lab water”. The “lab water” would represent variants of TCLP tests with water adjusted for
both ORP and pH. The use of site water has the advantage of representing actual site water chemistry.
However, since the site water is already in contact with the soil and already has elevated arsenic
concentrations, interpretation of results from site water may be complicated. Designing the specific
details of such a test is beyond the scope of this optimization review, but the optimization review team
estimates the cost to design and implement such tests to be on the order of $25,000.
6.2 RECOMMENDATIONS TO REDUCE COSTS
6.2.1 REDUCE TREATMENT PLANT REPORTING
Daily, weekly, monthly, quarterly and annual reports are prepared. The daily reports and weekly reports
provide limited benefit to managing the site but require additional labor. The optimization review team,
therefore, suggests eliminating the daily and weekly reports and maintaining the same level of
information in the monthly reports. This recommendation along with other labor reducing
recommendations may result in a meaningful reduction in operator and or reporting labor (such as,
reduction in treatment plant staffing), but specific cost savings due to this specific recommendation have
not been quantified.

39
6.2.2 OPTIMIZE METALS REMOVAL SYSTEM
If the existing treatment plant is expected to operate for more than five years, the optimization review
team suggests replacing it with a new treatment system to streamline operations. However, if the existing
treatment plant is going to operate for five years or less, the optimization review team recommends
considering optimizing the existing metals removal system as described below. Modifications to chemical
use and clarification may also be appropriate as discussed below.
Potassium permanganate has proven to be effective at oxidizing the arsenic at the head of the treatment
plant. However, potassium permanganate requires manual chemical blending and daily maintenance of
the system. Hydrogen peroxide is also an effective oxidant for arsenic removal and is used, for example,
at the Vineland Chemical Superfund Site in New Jersey for an arsenic removal system. Hydrogen
peroxide can be transported to the site as a 50 percent aqueous solution and added to the process stream
with a feed pump. No manual batching would be required, and maintenance would be negligible.
The Vineland Chemical Superfund Site is also able to remove arsenic with a significantly lower ORP (for
example, approximately 350 mV) than the target ORP at Baird and McGuire of approximately 700 mV.
The set point of 700 mV is comparable to the set point used for treating pathogens and may be higher than
necessary for arsenic oxidation. Although historic tests may have been performed to determine the
optimal ORP set point for the site, the water quality has changed significantly over time, and the required
ORP may now be lower. The ORP/Eh vs. pH plots shown in Figures B-5 through B-8, indicate that an Eh
(typical ORP measurement + 200 mV to correct for the offset associated with the reference electrode) of
150 mV should be adequate at a pH between 6.5 and 7 to co-precipitate arsenic with iron. A higher ORP
is likely needed to provide the response time needed in a treatment plant. Typically, the optimization
review team sees a higher ORP setting of approximately 350 mV, which is higher than 150 mV but
significantly lower than the currently used 700 mV. The optimization review team recommends revisiting
the ORP set point to see if adequate arsenic removal at this site can be accomplished with a lower ORP. A
lower ORP set point would translate to lower chemical usage regardless of the oxidant used.
The site team could test hydrogen peroxide as a potential oxidant (as is done at the Groveland Wells Site
in Region 1) and determine if using hydrogen peroxide would be more cost-effective than potassium
permanganate. Part of the cost savings associated with using hydrogen peroxide would be from reduced
labor if the labor reductions associated with a switch to hydrogen peroxide can be combined with other
labor reducing recommendations to eliminate an operator or mechanic position. Testing lower ORP set
points and testing hydrogen peroxide could be done on a trial basis with the treatment plant. The
optimization review team estimates that $10,000 would be sufficient for planning the test, implementing
the test, and conducting the additional arsenic analyses to support the test.
Iron and arsenic removal with iron co-precipitation is sensitive to the pH because the charge on the iron
hydroxide floc changes with pH. Arsenic in the oxidized state (for example, arsenate, H2AsO4-) has a
negative charge. The iron floc, therefore, should have a positive charge to attract the negative arsenate
ion, and anionic polymer (negative charge) should be used for coagulation of the positive iron/arsenic
floc. An optimal pH set point for this overall chemistry is likely 6.5. The pH of the influent to the
treatment plant ranges from approximately 6.7 to 7 with no pH adjustment. Decreasing the pH to 6.5 may
improve flocculation, coagulation and settling. The polymer used and or the polymer dosing might also be
modified based on the pH, ORP set point and oxidant used. The site team might consider working with a
polymer vendor to conduct bench scale studies to identify the optimal pH, ORP, oxidant and polymer to
improve settling within the metals removal system clarifiers. Testing within the plant can also be
conducted and might be accomplished for under $10,000.

40
The metals removal system clarification step might also be improved by increasing the capacity of the
clarification step. Little benefit is achieved from the second stage of the metals removals system. To
improve settling, the site team might consider replumbing the plant to arrange the two metals removal
clarifiers in parallel. This would decrease the flow rate in each clarifier and should improve settling. To
evaluate the potential effectiveness of this change, the site team should compare turbidity after the first
stage metals removal from periods when the flow rate was over 100 gpm, to the turbidity after the first
stage metals removal from periods when the flow rate was approximately 60 gpm. If there is a noticeable
difference in the two turbidity measurements, then arranging the two clarifiers in parallel should improve
settling and reduce the solids loading on the pressure filters. Arranging flow through the metals removal
clarifiers in parallel would likely cost under $10,000.
Savings from implementing the above recommendations is difficult to quantify. Savings might be realized
in reduced labor, chemical usage and GAC usage that could potentially result in cost savings of $10,000
per year or more.
6.2.3 DISCONTINUE AERATION IN ACTIVATED SLUDGE UNITS
The activated sludge units that are currently used as air strippers are providing little benefit to overall
water treatment, and the aeration is likely contributing to biofouling of the GAC units. Although the
aeration removes some mass, the GAC units are changed out prematurely due to fouling rather than due to
chemical loading. Therefore, the mass removal from aeration is not translating to a reduction in GAC use.
The optimization review team recognizes that the clarifier compartments of these activated sludge units
are critical to current treatment plant operation given the underperformance of the existing metals removal
clarifiers. The optimization review team recommends discontinuing operation of the aeration blowers and
using the units for solids settling only. Discontinuing blower operation would reduce electrical costs by
approximately $9,000 per year and may reduce the biofouling of the GAC, which could potentially
decrease the number of GAC changeouts.
6.2.4 POTENTIAL LONG-TERM COST SAVINGS FROM REMEDIATION SCENARIOS
Figure 6-1 presents a flowchart that summarizes potential remediation scenarios for this site (identified as
“A” through “D” on Figure 6-1). The long-term costs for this site, and potential cost-savings versus the
status quo, will be highly dependent on which scenario ultimately occurs. That will depend on several key
decisions and outcomes moving forward, including the following:
Will the primary focus moving forward be on source area remediation (scenarios “B”, “C” or
“D”), or will the focus be on containment of impacted groundwater prior to discharge to the
Cochato River (scenario “A”)?
If the focus is on additional source area remediation, will it be successful enough to eliminate
P&T in the long-term, and will that success be fast enough to eliminate the need for a new
treatment plant in the short-term (scenarios “B” or “C”) or will a new treatment plant be required
anyway (scenario “D”)?
If the focus is on additional source area remediation, will the results of the sediment sampling
(current baseline and comparison to previous results) indicate that containment of impacted
groundwater near the Cochato River is not required during source area remediation so that P&T
can be eliminated during the source area remediation (scenario “B”), or perhaps containment will
only needed in the vicinity of EW-7 (options for scenarios “C” and “D”)?

41
If the focus is on additional source area remediation, how much up-front-cost will ultimately be
required for successful implementation of aggressive source area remediation based on the extent
of LNAPL that is not yet fully characterized?
These items are discussed in detail in Section 6.4, along with initial cost estimates for some of the
scenarios. The approach that likely has the greatest potential to reduce life-cycle costs is to pursue more
aggressive source area remediation, because the goal of such efforts would be to ultimately eliminate the
need for long-term containment, which currently costs on the order of $900,000 per year for an indefinite
period. A modified P&T system in the future potentially might cost on the order of $500,000 per year.
The payoff period would depend on the ultimate up-front cost of the active remediation, whether or not it
is successful at eliminating the need for long-term P&T, and the avoided costs per year for long-term
P&T after it is decommissioned. Note that an ultimate decision regarding a path forward (such as, the
most appropriate remediation scenario) will depend on evaluation of future data collection and testing that
is recommended in this optimization review report.
6.3 RECOMMENDATIONS FOR TECHNICAL IMPROVEMENT
6.3.1 RECORD AND REPORT ORP RESULTS WITH GROUNDWATER MONITORING DATA
The CSM discussed in Section 4.0 incorporates speculation by the optimization review team that ongoing
arsenic contamination could be linked to low ORP that might be caused by microbial degradation of
organic contaminants. The optimization review team recommends reporting the ORP results in the
monitoring reports and correlating the ORP measurements with the arsenic concentrations as well as TPH
and TOC (see Section 6.1.4). Implementing this recommendation should not require any significant
additional cost.
6.4 CONSIDERATIONS FOR GAINING SITE CLOSE OUT The discussion of considerations for gaining site closeout in the following sections references Figure 6-1,
which presents a flowchart that summarizes potential remediation scenarios for this site (identified as “A”
through “D” on Figure 6-1).
6.4.1 DETERMINE IF PRIMARY FOCUS WILL BE SOURCE REMEDIATION OR
CONTAINMENT
A significant decision moving forward is if the primary focus will be on source area remediation, or if the
primary focus will be on containment of impacted groundwater prior to discharge to the Cochato River.
Four potential “scenarios” moving forward are illustrated on Figure 6-1 and in Table 6-2. Scenario “A”
focuses on containment, whereas Scenarios B to D focus on source area remediation. The optimization
review team believes additional information and testing will be required to determine the primary future
focus of the remediation, and initial steps are suggested in Sections 6.1.1 to 6.1.4 of this optimization
review report to develop the information required to make that decision. O&M of the current system
should continue as the suggested data are acquired and evaluated by MassDEP and EPA Region 1.
Depending on the outcome, MassDEP and EPA Region 1 will also need to determine the need (if any) for
updates to decision documents and or programmatic classification of the remedy.

42
Detailed discussion of four potential “scenarios” illustrated on Figure 6-1 is provided below.
Scenario “A” – Future Focus on Containment. If the future focus of remediation will be on
containment (scenario “A”), significant up-front modifications to the current P&T system will be
required, due to the expectation of long-term P&T operation for a containment-focused remedy.
As an aside, the optimization review team believes a long-term in situ barrier using air sparging,
as an alternative to P&T, would likely suffer from excessive fouling due to the continuous
loading of dissolved iron into the sparge area. Modifications would be made to the extraction
system to improve containment, and modifications to the treatment plant would be made to
improve performance and streamline operation. LNAPL would be collected from the subsurface
to the extent feasible.
o Extraction system modifications would include installation of new extraction wells (for
example, replace EW-9 and add one or more extraction well between EW-7 and EW-9),
addition of piping and controls for the new extraction well locations, and substantial
upgrades to the current treatment plant. Installation of the extraction wells, piping the
wells to the treatment plant, conducting pumping tests and conducting a capture zone
evaluation to determine appropriate extraction rates, which will include development of a
“target capture zone” and will likely incorporate groundwater modeling, will likely cost
on the order of $250,000.
o Modifications to the treatment system would involve removing all of the existing
equipment, installing new equipment and commissioning the new equipment. These
substantial changes are suggested because the current system requires a substantial
amount of labor due to the deteriorating condition of the existing equipment and because
a large number of treatment components in the process stream do not provide a beneficial
function (for example, second stage of metals removal) or are inefficient (for example,
use of activated sludge units for aeration and settling). The current system requires
approximately 200 hours of staffing per week, whereas a new system should require only
40 to 80 hours of staffing per week. The optimization review team estimates that the
suggested changes would require as much as $200,000 to remove the existing equipment,
approximately $1 million to furnish and install new equipment and approximately
$300,000 to commission the system for a total of $1.5 million. A lower cost option may
be available if the metals removal and solids handling equipment with appropriate
specifications from another site’s treatment plant are available for use at the Baird and
McGuire site. For example, the metals removal and solids handling equipment at the
Groveland Wells treatment plant was designed to handle approximately 150 gpm and
would likely be appropriate for the Baird and McGuire, site if available. The costs for
moving equipment, installing the equipment and commissioning the new plant would
likely be under $1 million.
This scenario (focus on containment) will make it highly probable that there will be long-term
O&M costs on the order of $500,000 per year or more for an indefinite period (such as, many
decades), since the sources of organics that cause the reducing conditions (and resulting high
dissolved arsenic concentrations in groundwater) will not be addressed and long-term
containment will likely be required due to the “additive nature” of long-term arsenic discharge to
sediments of the Cochato River under this scenario. However, the significant up-front costs
associated with aggressive source area remediation will be avoided under this scenario.
Scenarios “B” to “D” – Future Focus on Source Area Remediation If the future focus is on
source area remediation (scenarios “B”, “C” or “D”), more significant up-front costs will be

43
required to implement additional active source remediation such as ISCO (a summary of potential
technologies is described below). However, the goal of such efforts would be to ultimately
eliminate the need for long-term P&T, which currently costs on the order of $900,000 per year. A
modified P&T system in the future potentially might cost on the order of $500,000 per year. As
indicated on Figure 6-1, it is also possible that short-term addition of new extraction wells and
extensive treatment plant upgrades (for example, a new treatment plant) could be avoided with
this approach, and require only minor short-term modifications (on the order of $100,000) to the
existing treatment system (see Section 6.4.2). The payoff period for the source area remediation
would depend on the ultimate up-front cost of the source area remediation, whether or not it is
successful at eliminating the need for long-term P&T, and the avoided costs per year for long-
term P&T that are ultimately eliminated.
The optimization review team suggests the following three primary technology options for source area
remediation:
Air sparging and soil vapor extraction (AS/SVE)
In situ chemical oxidation (ISCO)
In situ thermal remediation (ISTT)
The primary objective of these technologies would be to address the organic contamination (including
residual LNAPL) that is speculated by the optimization review team to be causing exceedances of some
VOC and SVOC compounds and causing the low ORP that is either mobilizing the arsenic or allowing it
to remain mobile. Pesticide contamination may not be directly addressed but in the absence of residual
LNAPL the remaining pesticides are expected to adsorb to soils and not be detected above GW-1
Standards in groundwater samples. Each of the technologies is discussed below assuming a target
remediation area of 150,000 square ft, corresponding to a remediation volume of approximately 60,000
cubic yards if a 10-foot thickness of impacts is assumed. The conceptual remediation area of 150,000
square ft generally corresponds to the approximate area of the LNAPL extent indicated on Figure B-4 in
Attachment B and assumes that the contamination between EW-7 and EW-9 would attenuate once the
upgradient source is removed. This is a key assumption that would need to be evaluated after additional
characterization has been conducted (See Section 6.1.5 and Section 6.4.2) because conducting source area
remediation in this area would significantly increase the costs provided in this section. The conceptual
target volume for remediation would be refined with additional characterization prior to remediation,
potentially resulting in increases or decreases to the target volume. The potential technologies are
summarized below.
AS/SVE – This approach would involve injecting air into the saturated zone with the intent of
volatilizing some of the VOCs, SVOCs and TPH and adding oxygen to the subsurface to enhance
microbial degradation of organic contamination. The technology would also include SVE wells to
remove off-gas from the sparging and to address residual contamination above the water table.
For conceptual purposes the radius of influence for sparging wells (for volatilization and oxygen
delivery) is assumed to be approximately 10ft, and the radius of influence for SVE wells is
assumed to be approximately 20 ft. Also for conceptual purposes, the average depth for sparge
wells is assumed to be 30 ft and the average depth for SVE wells is assumed to be 15 ft. Based on
these assumptions, approximately 2,000 sparge wells and 500 SVE wells would be required.
Assuming the system is operated on a pulsed/rotating basis to reduce the compressor and blower
capacity, construction costs would be close to $10 million and operating costs would be
approximately $600,000 per year. Assuming the system requires approximately 4 years of
operation, the total cost for this system would be on the order of $12.4 million. The following are
advantages and disadvantages of using this technology approach:

44
AS/SVE Advantages and Disadvantages
Advantages Disadvantages
Directly addresses issue of low ORP by
removing organics and adding oxygen to
source area
Operating costs decrease if portions of the
system can be shut down
Whole system or part of system can continue
to operate for additional years with relatively
low overall cost
Addresses vadose zone contamination
Relatively high capital costs
Does not directly remove or destroy
pesticides
Potential for fouling from biological
activity or iron precipitation
Does not address organic arsenic, if
present
Results in large amount of
infrastructure in ground
Key Unknowns
Actual extent of treatment zone
Actual system performance
Duration of operation
Presence or absence of organic arsenic
Degree of fouling and effect of fouling on remedy performance
ISCO – This approach would involve injecting chemical oxidants into the saturated zone with the
intent of directly destroying VOCs, SVOCs, TPH, and some pesticides. Due to the required
oxidant strength for this site, Fenton’s reagent or activated persulfate would be appropriate
oxidants. For conceptual purposes the radius of influence for the injection wells is assumed to be
approximately 15 ft. The treatment volume assumed for the AS/SVE remedy is used and would
translate to approximately 850 injection locations. Given this large number of injection locations,
the preference to inject at multiple intervals to improve reagent distribution, and the need to
conduct multiple injection events, it may be preferable to purchase two direct-push rigs,
supporting injection equipment, and full-time operators rather than install permanent injection
points or contract the injection from a chemical injection vendor. The direct-push rigs and
supporting equipment would likely cost approximately $500,000. Two full-time injection crews
of two individuals each would cost approximately $600,000 per year. An additional $100,000 per
year could be allocated for performance sampling with the same crews, and $150,000 per year
could be allocated for project management, engineering support and reporting. The two crews
should be able to conduct injections at 10 locations per day allowing for more than two injection
events per year. The cost for reagents for a full-scale application would be approximately
$1,500,000 per event. Assuming four full-scale events can be conducted in two years, the total
cost of the ISCO remedy would be approximately $8.2 million. If recoverable LNAPL is
identified in any of the direct-push points, the crews could install temporary piezometers to
recover the LNAPL prior to injection.

45
ISCO Advantages and Disadvantages
Advantages Disadvantages
Remedy is applied in a relatively short time frame
Directly address issue of low ORP by destroying
organics and adding oxidants to source area
Low capital cost
Injection costs decrease as injection points are
eliminated
Strong oxidants should address some pesticides
Strong oxidants will convert organic arsenic into
arsenate
Leaves little or no infrastructure in place
Large quantities of costly
reagents are required
Requires purchase and
maintenance of direct-push rigs
and injection hardware
May be difficult to address
contamination present in vadose
zone
Key Unknowns
Actual extent of treatment zone
Oxidant demand
Number of injection events required
ISTT – This approach would involve heating the subsurface to volatilize and potentially destroy
organic contaminants, and then extracting the volatilized contaminants. Steam-enhanced
extraction or thermal conduction would likely be used for this setting and contaminant types.
Assuming the same treatment volume as the AS/SVE and ISCO options, the cost for thermal
remediation would likely be approximately $15 million. For reference, the conceptual treatment
volume discussed here is approximately three times larger than the treatment volume that was
thermally treated at the Groveland Wells site, which cost approximately $6 million for ISTT. Two
factors that could increase the cost at this site compared to the Groveland Wells site are target
temperature and the distribution of the treatment volume. The Baird and McGuire remedy would
require higher heating temperatures due to the contaminant types and the treatment volume being
spread over a much larger area. Although some cost efficiencies would be recognized with a
larger project, these two items would tend to increase the unit cost for treatment.
ISTT Advantages and Disadvantages
Advantages Disadvantages
Remedy is applied in a relatively short time frame
High heating temps should address pesticides
Heating helps address residual contamination
locked in relatively impermeable zones
Residual heat after active heating assists with
microbial degradation
High capital costs
A different technology may be
needed if additional polishing is
needed
Existing PVC monitoring wells in
the heating area would be
destroyed during heating
Key Unknowns
Actual extent of treatment zone
Actual cost of remedy
Site conditions following heating application
Based on the above preliminary conceptual analysis, the optimization review team believes that the ISCO
option appears to be most appropriate of the source remediation approaches due to the relatively low up-
front costs (relative to the other technologies) and the ability to adjust the level of effort and costs based
on remedy performance. The results from source area characterization and pilot testing, as discussed
below, may result in changes to the above preliminary analysis.

46
6.4.2 PILOT TESTING AND LNAPL CHARACTERIZATION IN CONJUNCTION WITH MORE
AGGRESSIVE SOURCE REMEDIATION
Pilot testing and additional characterization are highly recommended before proceeding with a full-scale
remedy. If the site team decides to address the source area, then the optimization review team
recommends high-resolution site characterization (HRSC) of the source area and ISCO pilot testing.
Given the presence of LNAPL with PAHs, laser-induced fluorescence (LIF) would be an appropriate tool
for real-time measurements applied using a HRSC strategy. However, if much of the organic mass is in
alkanes (straight chains) rather than aromatics (hydrocarbon rings like naphthalene), then LIF may not be
appropriate. The optimization review team recommends selecting a target area at the upgradient edge of
the known historic LNAPL extent to demonstrate the applicability of LIF. The demonstration would
involve using LIF with a cone-penetrometer (CPT) to collect real-time fluorescence (for example, from
PAH) and lithology data. It would also involve use of a direct-push rig to collect soil grab samples for
SVOCs and TPH. The two target areas could be each be 50-ft by 50-ft. The LIF/CPT testing could likely
log more than 250 ft per day, providing continuous vertical information to 40 ft at 6 or more locations. A
direct-push rig could likely grab 5 to 10 discrete soil samples during a day. The demonstration area could
be thoroughly investigated in two days. The discrete samples would be qualitatively compared to the
LIF/CPT results to determine if the LIF/CPT provides a reasonable signal given the contamination
observed from the soil samples. The cost for the demonstration would likely be approximately $60,000,
including a work plan, field work, analysis and reporting.
ISCO can then be pilot-tested in the characterized demonstration area. Pilot testing is not recommended in
the downgradient areas because recontamination of the downgradient areas is likely if upgradient sources
are still present. Pilot testing should be conducted using a direct-push rig to inject Fenton’s reagent into
the impacted intervals delineated during the characterization. Up to five events should be conducted with
performance sampling conducted in between each event. The objectives of the pilot would be to evaluate
the amount of reagent used, the radius of influence of the injections, resulting reductions in all types of
organic contamination (including pesticides), and immobilization of arsenic. Based on the results, the site
team can revisit the cost analysis to see if the remedy would be practical at full scale, recognizing that the
pilot test plot may require significantly more oxidant than other portions of the plume. The optimization
review team estimates that the cost for the pilot testing, including work plans, four rounds of injections,
four rounds of direct-push sampling to evaluate performance and reporting would be under $300,000.
If the pilot test is successful in removing organic contamination, increasing the ORP, and immobilizing
arsenic, then the site team could move forward with full-scale source characterization of LNAPL,
including the area between EW-7 and EW-9 where high arsenic has been identified but limited
information is available about organic contamination. The approach to characterization will be dependent
on the outcome of the LIF/CPT demonstration. If LIF/CPT can be used with limited collaborative data
from direct-push sampling, then full-scale characterization might be cost approximately $400,000,
including a dynamic work plan, approximately 30 days of field work with a LIF/CPT rig and a separate
direct-push rig, supporting analytical work and reporting.
6.4.3 CONSIDERATIONS FOR IMPROVING MIGRATION CONTROL IN CONJUNCTION WITH
MORE AGGRESSIVE SOURCE REMEDIATION
As indicated on Figure 6-1, if more aggressive source area remediation is pursued there are several
potential approaches regarding groundwater migration control during that several-year period, as follows:

47
No P&T during aggressive source area remediation (scenario “B”)
P&T to provide containment during aggressive source area remediation (scenarios “C” and “D”)
o Using the existing treatment plant with some minor modifications (scenario “C)
o Using a newly-installed treatment plant (scenario “D”)
If P&T can be avoided during the source area remediation (scenario “B”), there would be savings for
O&M of the P&T system (currently on the order of $900,000 per year) as well as savings for any short-
term modifications to the extraction and treatment system. These savings could be applied towards the
cost of the aggressive remediation. The optimization review team notes that there has likely been
incomplete containment for many years of previous system operation (for example, near EW-9 and
between EW-7 and EW-9), so the only major difference from those conditions if P&T was eliminated
would be near EW-7. If the suggested sediment sampling (See Section 6.1.2) indicates there are similar
sediment concentrations adjacent to EW-7 and further downstream (particularly for arsenic), and that the
sediment concentrations are not much higher than previous sampling events from 2002 and earlier, it
would suggest that discharges to groundwater for a few years during aggressive source remediation will
likely not cause significant degradation of the Cochato River, and site stakeholders may find it acceptable
to eliminate P&T while the aggressive source remediation proceeds.
If scenario “B” (no P&T during aggressive source remediation) is not acceptable, the next least costly
option regarding migration control during aggressive source remediation would be scenario “C” (P&T
using the existing treatment system with some modifications). This should be feasible for a period of
aggressive source remediation that lasts several years. One option would be to only pump at EW-7 during
this period (generally consistent with capture near the Cochato River provided by the current system). A
more costly option would be to add additional extraction wells to the north (such as a replacement for
EW-9, and one or more extraction wells between EW-7 and EW-9). Deciding between these options may
depend on the results of the suggested sediment sampling (See Section 6.1.2). If the sediment results are
not elevated under current conditions near EW-9, or between EW-7 and EW-9, then several additional
years of discharge to surface water similar to current conditions may be acceptable to site stakeholders
while the aggressive source remediation is performed. This would eliminate the need for new extraction
wells and associated equipment and or piping.
Scenario “D” would be the most costly option regarding migration control during additional, aggressive
source remediation because it would include design, capital purchase and installation of a new treatment
plant. The optimization review team does not favor this scenario, because it believes that additional,
aggressive source remediation should only be attempted if it is believed it will be successful in ultimately
eliminating the long-term need for migration control, therefore, it is not desirable to invest in a new
treatment plant in conjunction with additional aggressive source area remediation.
6.5 RECOMMENDATIONS RELATED TO GREEN REMEDIATION No green remediation recommendations are provided. Recommendations are focused on remedial
effectiveness and remedial strategy. Green remediation practices can be considered once the site team has
decided on the optimal remedial approach.

48
6.6 SUGGESTED APPROACH TO IMPLEMENTING RECOMMENDATIONS The optimization review team recommends implementing the recommendations in Section 6.1 and
Section 6.3.1, and then following the decision flow chart presented in Figure 6-1 and Section 6.4.
Recommendations in Sections 6.2.1, 6.2.2, and Section 6.2.3 can be considered if consistent with the
decisions made during implementation of recommendations in Sections 6.2.4 and 6.4.

Table 6-1. Cost Summary Table
Recommendation Category
Additional
Capital Cost
Change in
Annual Cost
Change in Life-
Cycle Cost
(3% discount rate)
6.1.1 RESUME FISH TISSUE
SAMPLING Effectiveness $9,000
$25,000 once
every five years
30 years*
$125,000
6.1.2 SAMPLE THE
COCHATO RIVER SEDIMENTS
USING THE INCREMENTAL
SAMPLING METHOD
Effectiveness $15,000 $15,000 30 years*
$309,000
6.1.3 CONDUCT
SPECIATION ANALYSIS FOR
ARSENIC IN SELECT
MONITORING WELLS
Effectiveness $5,000 $0 30 years*
$5,000
6.1.4 ADD TPH AND TOC TO
LABORATORY ANALYSES
FOR ROUTINE
GROUNDWATER
MONITORING
Effectiveness $0 $3,000 30 years*
$59,000
6.1.5 PERFORM LEACHING
TESTS ON SITE SOILS TO
BETTER UNDERSTAND IF SITE
SOILS ARE A CONTINUING
SOURCE OF ARSENIC
Effectiveness $25,000 $0 $25,000
6.2.1 REDUCE TREATMENT
PLANT REPORTING
Cost
Reduction Not Estimated
6.2.2 OPTIMIZE METALS
REMOVAL SYSTEM
Cost
Reduction $30,000 ($10,000)
5 years*
($20,000)
6.2.3 DISCONTINUE
AERATION IN ACTIVATED
SLUDGE UNITS
Cost
Reduction $0 ($9,000)
30 years*
($176,000)
6.2.4 POTENTIAL LONG-
TERM COST SAVINGS FROM
REMEDIATION SCENARIOS
Cost
Reduction See Section 6.4
6.3.1 RECORD AND REPORT
ORP RESULTS WITH
GROUNDWATER
MONITORING DATA
Technical
Improvement $0 $0 $0
6.4.1 DETERMINE IF
PRIMARY FOCUS WILL BE
SOURCE REMEDIATION OR
CONTAINMENT
Site Closeout See Table 6-2
6.4.2 PILOT TESTING AND
LNAPL CHARACTERIZATION Site Closeout See Table 6-2
6.4.3 CONSIDERATIONS
FOR IMPROVING MIGRATION
CONTROL IN CONJUNCTION
WITH MORE AGGRESSIVE
SOURCE REMEDIATION
Site Closeout See Table 6-2
*Time frame indicated is a representative time frame selected by the optimization team for cost estimating purposes.

Table 6-2. Estimated Cost Summary Matrix for Site Closeout Considerations
Estimated Costs
Scenario A Scenario B Scenario C Scenario D
Extraction system
improvements and capture
zone analysis
$250,000 Up to $250,000* Up to $250,000*
Treatment system
upgrades $1,250,000** $100,000 $1,250,000**
Source area
characterization $460,000 $460,000 $460,000
Pilot testing $300,000 $300,000 $300,000
Source remedy equipment $500,000 $500,000 $500,000
Annual costs (and
duration in years) for
treatment plant operation
$500,000 (30+) $0 $900,000 (4) $500,000 (5)
Annual costs (and
duration in years) for
source remedy operation
$0 $3,850,000 (2) $3,850,000 (2) $3,850,000 (2)
Estimated life-cycle cost
(no discounting)
$11,300,000
to over
$16,500,000
$8,960,000 $12,910,000 $12,960,000
Scenario A – Containment only with continued LNAPL recovery (estimated life-cycle cost range based on various
assumptions regarding duration and discounting over the long operation period.
Scenario B – Source remediation without containment (no discounting of costs to present value)
Scenario C – Source remediation with containment provided by existing system (assumes all repairs and
modifications to treatment plant are conducted with the annual O&M cost) (no discounting of costs to present
value).
Scenario D – Source remediation with containment provided by new system (no discounting of costs to present
value)
All source remediation scenarios cost estimates assume the ISCO approach as presented in the text and a target
area similar in size to the LNAPL extent identified on Figure B-4 (See Appendix A). The actual source area for
treatment could be smaller or larger depending on the outcome of the source area characterization.
All cost estimates are feasibility level cost estimates and are depending on findings from additional characterization
and pilot studies.
*Containment strategies could range from partial containment by operating EW-7 only, which would require little
or no capture zone analysis and extraction system improvements, or more comprehensive capture that could require
up to $250,000.
** Presented estimated cost represents an average of two presented costs ($1,000,000 and $1,500,000).

ATTACHMENT A: Figures from Existing Site Reports


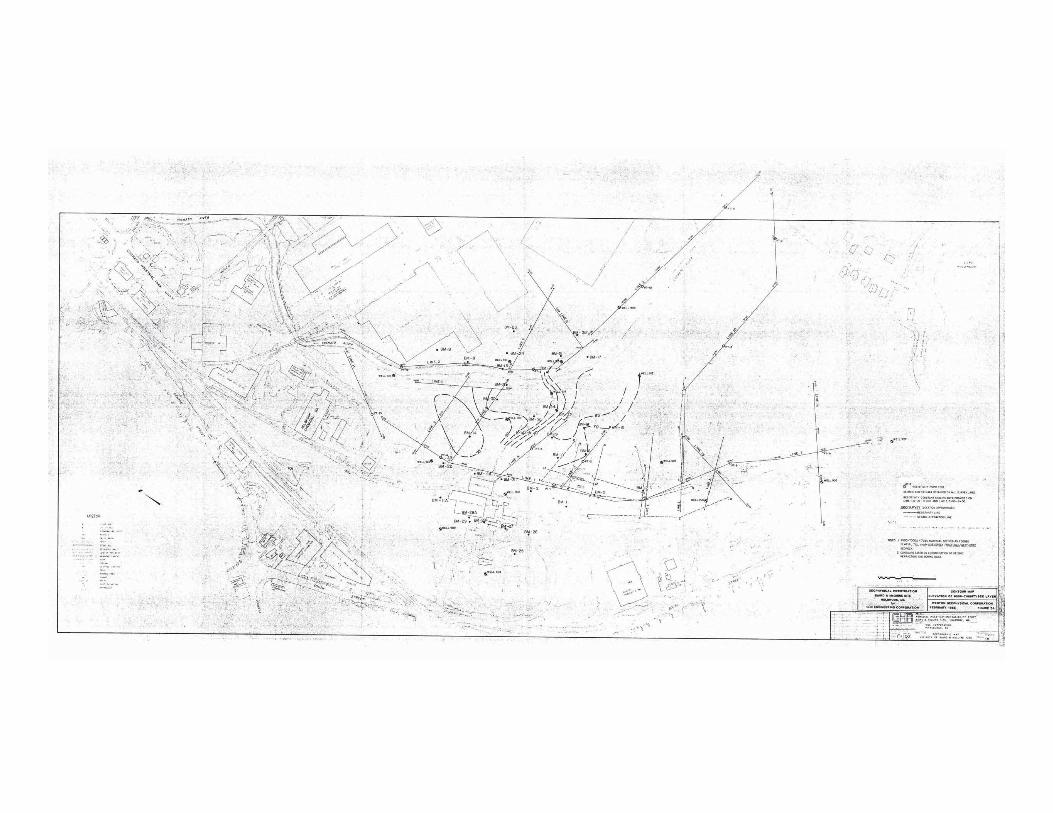
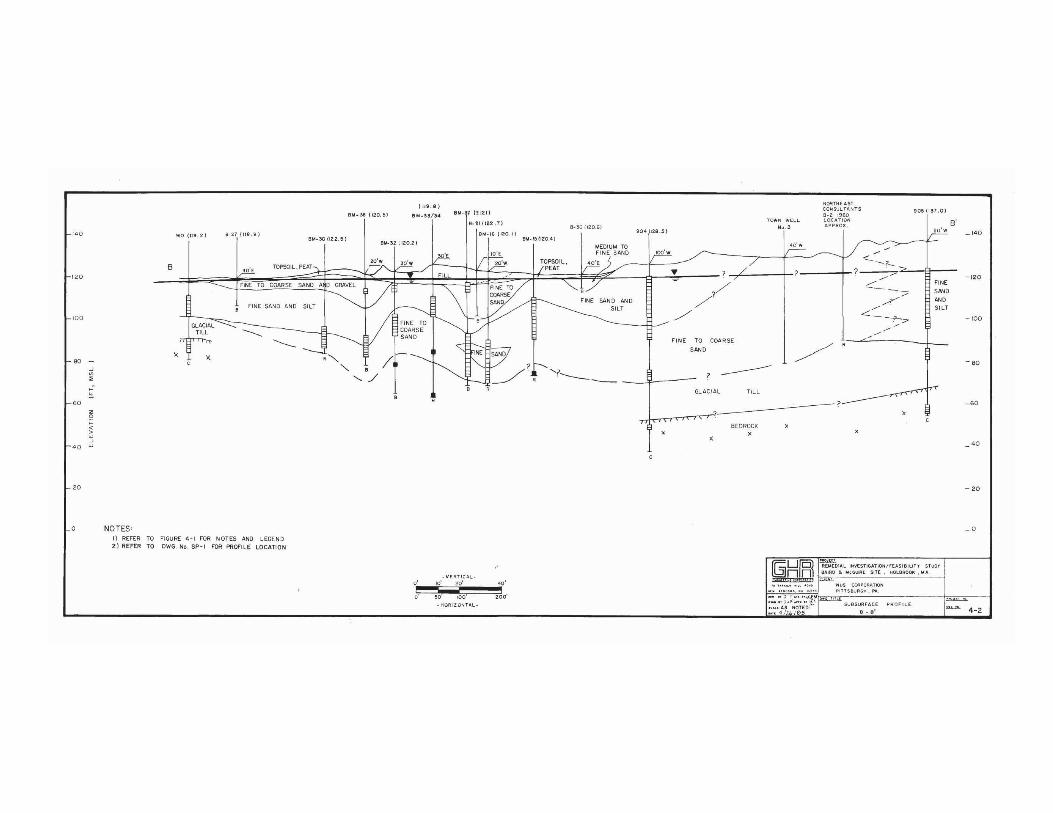


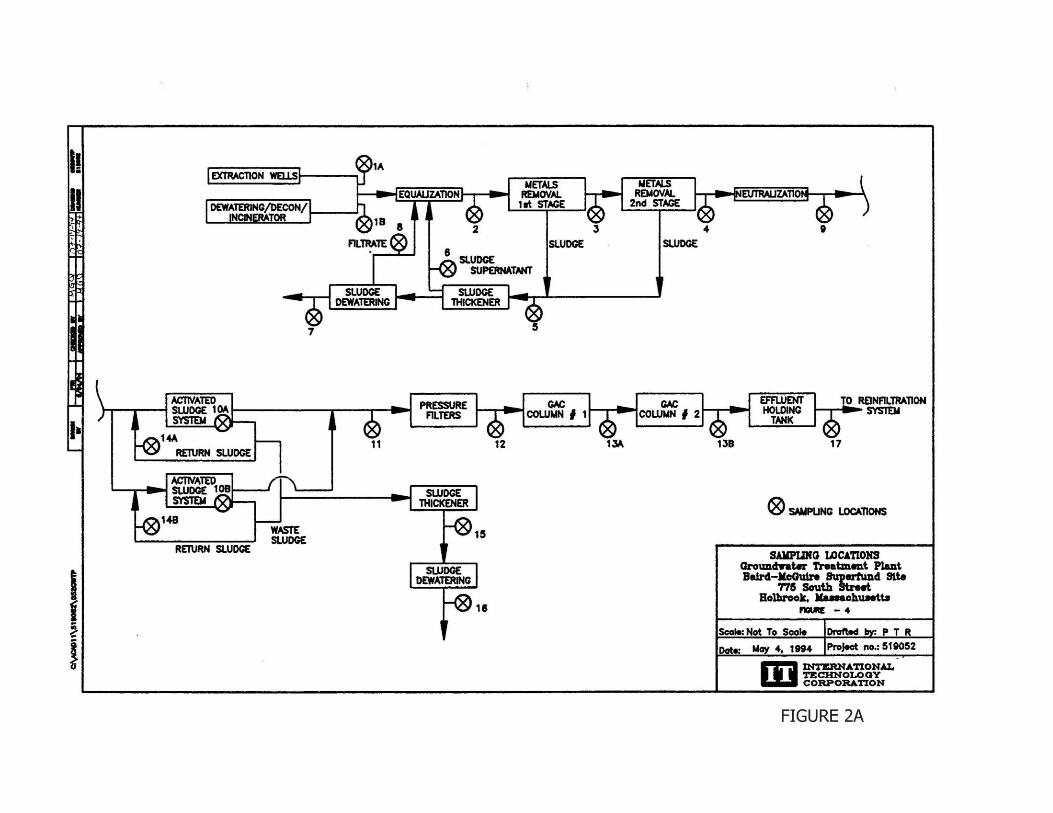


ATTACHMENT B: : Figures Prepared by Optimization Team


ATTACHMENT C: Historic VOC and SVOC Trends at Selected Wells