Embed Size (px)
Citation preview

PAPER www.rsc.org/jem | Journal of Environmental Monitoring
Publ
ishe
d on
03
Oct
ober
200
8. D
ownl
oade
d by
Sta
te U
nive
rsity
of
New
Yor
k at
Sto
ny B
rook
on
25/1
0/20
14 2
1:07
:59.
View Article Online / Journal Homepage / Table of Contents for this issue
Optimization of pulp mill effluent treatment with catalytic adsorbentusing orthogonal second-order (Box–Behnken) experimental design
Ekaterina V. Rokhina,*a Mika Sillanpaa,b Mathias C. M. Noltec and Jurate Virkutytea
Received 7th July 2008, Accepted 18th September 2008
First published as an Advance Article on the web 3rd October 2008
DOI: 10.1039/b811556g
Novel catalytic adsorbent (ruthenium on carbon) was employed for the treatment of pulp mill effluent
in the presence of hydrogen peroxide. Mathematical model and optimization of the process regarding
the most favorable COD (%), TOC (%) and color (%) removal rates was developed and performed with
experimental design taking into account catalytic adsorption process kinetics. As the initial
experimental design, 33�1 half-fractional factorial design (H-FFD) was accomplished at two levels to
study the significance of the main effects, such as catalytic adsorbent (g l�1) and hydrogen peroxide
(ppm) concentrations using the response surface methodology (RSM). Finally, a four factor-three
coded level central composite design (CCD) with 28 runs was performed in order to fit a second-order
polynomial model. Validation of the model was accomplished by different criteria including coefficient
of determination and the corresponding analysis of variance. The achieved removal rates for TOC
(up to 75%), COD (up to 73%) and color (up to 68%) were observed for the defined optimal conditions:
1g l�1 of ruthenium on carbon, 7 ppm of hydrogen peroxide, pH ¼ 4 and ambient temperature. The
proposed method benefited significantly improved TOC, COD and color removal efficiency,
regenerability and reusability of the catalytic adsorbent and unaltered initial pH of an effluent in
comparison to traditional adsorption or oxidation processes.
Introduction
In Finland, the pulp and paper industry accounts for a major
portion of the country’s economy in terms of value of production
and total wages paid.1 However, the wood pulping and
production of paper products generate a considerable amount of
hazardous pollutants. In general, level of contamination is
mainly characterized by total organic carbon (TOC), chemical
oxygen demand (COD), suspended solids (SS), toxicity, and
colour when untreated or poorly treated effluents are discharged
to receiving waters.
Advanced oxidation processes (AOPs) are widely used as
powerful methods capable of transforming contaminants into
harmless substances.2 AOPs are aimed to generate very reactive
non-selective transient oxidizing species such as the hydroxyl
radicals cOH, which are generally accepted as the dominant
oxidizing species. For effective oxidations of refractory organic
compounds, the hydroxyl radicals must be continuously gener-
ated in situ through chemical, photochemical or sonochemical
reactions due to their instability. The formation of cOH radicals is
aWaste Management Group, Department of Environmental Science,University of Kuopio, P.O. Box 1627, FIN-7021 Kuopio, Finland.E-mail: [email protected]; Fax: +358 153556363; Tel: +358440176196bLaboratory of Applied Environmental Chemistry, Department ofEnvironmental Science, University of Kuopio, Patteristonkatu 1, FIN-50100 Mikkeli, Finland. E-mail: [email protected]; Fax: +358153556513; Tel: +358 153556830cInstitute of Environmental Technology and Energy Economics, TechnischeUniversitat Hamburg–Harburg, Eibendorfer Strabe 40, 21073 Hamburg,Germany. E-mail: [email protected]; Fax: +40 428782315; Tel: +40428782597
1304 | J. Environ. Monit., 2008, 10, 1304–1312
usually accelerated by combining oxidizing agents such as ozone
(O3), hydrogen peroxide (H2O2) and UV radiation.3 However,
during recent decades, considerable attention has been focused on
the further improvement of these processes and the development
of catalytic AOPs methods because of their simplicity, reliability
and high effectiveness.1–4 Currently available methods, such as
catalytic wet oxidation process (CWAO), Fenton andFenton-like
processes or photocatalytic oxidation with TiO2, all have some
technical or economical drawbacks that limit their usefulness.1–4
Adsorption and catalytic oxidation reactions have always been
known as interrelated processes. It is argued that if successfully
developed, a combination of sorption with destruction technique
may overcome many of technical and economical drawbacks and
become a preferable choice for many industries.2,3,5 The work
principle of catalytic adsorbent is based on the assumption that
sorption and reaction sites are fundamentally different entities
and that the chemical reaction does not profit from sorption at
non-reactive sites.6 Centi and colleagues4 explored the use of
mixed oxides as regenerable solid catalytic adsorbents for the
development of an adsorption method to remove the organics
present in the rinse water of the electronics industry at room
temperature and the regeneration of the adsorbent at mild
conditions. Trawczynski7 investigated the effectiveness of noble
metal catalysts surfaces (Pt, Pd, Ru) supported on carbon black
composites (CBC) for the oxidation of phenol solutions using
a fixed-bed reactor working in a trickle-flow regime. Rodas-
Grapaın8 studied CuO–CeO2 sorbent-catalysts in de-SOx type
reactions. In addition, Moon and colleagues9 found that the
Pd/activated carbon powder can be used as an adsorbent for
recovering chloropentafluoroethane (CF3CF2Cl, CFC-115)
and also as a catalyst for manufacturing pentafluoroethane
This journal is ª The Royal Society of Chemistry 2008

Publ
ishe
d on
03
Oct
ober
200
8. D
ownl
oade
d by
Sta
te U
nive
rsity
of
New
Yor
k at
Sto
ny B
rook
on
25/1
0/20
14 2
1:07
:59.
View Article Online
(CF3CF2H, HFC-125) from CFC-115. Adsorption-catalytic
method for carbon disulfide removal from air with the use of
(Fe-EDTA/carbon) was experimentally tested by Yegiazarov
and co-authors.10 All these studies showed that catalytic adsor-
bents may be an efficient alternative to conventional treatment
methods because the catalytic component provides active sites
for oxidation of adsorbed substances and also tunes the textural
properties, as well as increases resistance and regenerability of
the adsorbent. Thus, catalytic adsorbents are apt for wastewater
treatment due to their high activity, commercial availability and
broad spectrum of substrates. Generally, three modes of opera-
tion are possible: (i) a two-step cycle consisting of an adsorption
followed by a regeneration step of the adsorbent, (ii) a mode
where sorption and destruction reaction take place simulta-
neously, and (iii) a quasi-simultaneous mode with the destruction
reaction cyclically performed under intensified conditions for the
complete regeneration of the adsorbent.5
Themain aimof thisworkwas to explore the use of rutheniumas
a novel catalytic element embedded in active support with high
sorption capacity—carbon. The resulting product was studied as
regenerable solid catalytic adsorbent for the development of
aprocess to removepersistent organic contaminants frompulpmill
factory effluent. The advantageous use of such catalytic adsorbent
was complemented by mild operational parameters (room
temperature and atmospheric pressure) and the ability of the
process to be performed without the adjustment of initial waste-
water characteristics (pHand temperature). In addition, secondary
aim of the study was to establish the optimum conditions of
the process by considering technological (maximizing removal
efficiencies) and economical (minimizing chemicals consumption)
aspects. It was hypothesized that Box–Behnken experimental
design would serve this purpose well through the collection of
mathematical and statistical methods for analysing and modelling
of the effects of several independent variables and their responses.
Fig. 1 Representative SEM micrographs of (a) fresh (b) calcinated at
400 �C and (c) after treatment with hydrogen peroxide ruthenium on
carbon catalytic adsorbent.
Results and discussion
Characterization of the catalytic adsorbent
Fig. 1 shows a typical SEM image of fresh ruthenium on carbon,
catalytic adsorbent calcinated at 400 �C for 4 h and the sample
after treatment with hydrogen peroxide. This figure clearly shows
the typical mesoporous order of the inner structure of the
material, showing that the addition of hydrogen peroxide did not
affect the catalytic adsorbent structure. When this material was
calcinated, the ordered structure was lost, a worm-like structure
was observed and a long range mesoporous order was not found
even after the calcination process at high temperature (Fig. 1b).
Despite the loss of the long-range mesoporous order, the relative
surface area of catalytic adsorbent was high (625 m2 g�1).
Accordingly, the surface area of the calcinated sample was the
same but the surface area of the catalytic adsorbent after
hydrogen peroxide treatment gradually decreased to 28.1 m2 g�1
as a result of adsorption of the pollutants onto the surface of
ruthenium on carbon. Fig. 2 shows textural properties of the
catalytic adsorbent and its particle size distribution. As can be
seen in Fig. 2a, the N2 adsorption/desorption isotherm belongs to
the type IV of isotherms, which is typical for these solids as well
as for mesostructured materials in general. The pore size
This journal is ª The Royal Society of Chemistry 2008
distribution, calculated using the Barrett-Joyner-Halenda (BJH)
method, ranged from 12.5 to 120 A (Fig. 2b). Particle size
distribution was the same for all three samples regardless
experimental conditions and was in the range of 266–1036 nm
with the average particle size of 347 nm as presented in Fig. 2b as
inset. There was no significant improvement observed in
adsorptive properties, physical stability or the overall perfor-
mance of the calcinated sample in comparison to the fresh
catalytic adsorbent. Thus, all the following discussion was only
based on results obtained while using fresh catalytic adsorbent.
Adsorption and catalytic process in the presence of hydrogen
peroxide
Generally, applied process is extremely complex and can
be regarded as two interrelated processes: adsorption and
J. Environ. Monit., 2008, 10, 1304–1312 | 1305

Fig. 2 Textural features of ruthenium on carbon (a) typical N2
adsorption/desorption isotherm, (b) pore size distribution (particle size
distribution as inset).
Table 1 Synergistic index of the catalytic adsorbent–H2O2 system interms of COD, TOC and color removal
COD TOC Color
SI 0.99 0.98 1.0RRads (%) 67.5 68.2 54.6RRox (%) 11.3 10.9 13.3
Table 2 Kinetic parameters of COD, TOC and color removal and theequilibrium adsorption capacities
Parameters g � 10�5/l mg�1min�1 k/min�1 qe/mg g�1
COD 0.069 0.035 0.046TOC 0.89 0.33 1.23Color 0.63 0.56 0.82
Publ
ishe
d on
03
Oct
ober
200
8. D
ownl
oade
d by
Sta
te U
nive
rsity
of
New
Yor
k at
Sto
ny B
rook
on
25/1
0/20
14 2
1:07
:59.
View Article Online
heterogeneous catalytic oxidation of organic contaminants
present in the pulp and paper effluent. The process investigated
in the current study consists of few steps: the adsorption of
contaminants onto adsorptive sites, decomposition of hydrogen
peroxide over active catalytic sites, and the reactions on the
surface with following desorption of the reaction products
from active catalytic sites. This mechanism is favourable for
cases when reactive species are generated at the surface of the
adsorbent, i.e. in a close vicinity to the adsorbed organic
contaminants.5 The generation of radicals via decomposition of
hydrogen peroxide on catalytically active sites follows the well
known Haber–Weiss mechanism:
Me + H2O2 / Me+ + OH� + cOH
cOH + H2O2 / H2O + cHO2
Short-lived radicals are mobile and react with adsorbed
substrate located nearby, immediately after the formation. This
hypothesis is supported by findings of Kwan and Voelker,6 who
stated that adsorbed substrate is preferentially available for
oxidation by hydroxyl radicals.
1306 | J. Environ. Monit., 2008, 10, 1304–1312
Total efficiency of the process may be expressed as a sum of
removal efficiencies from adsorption and catalytic oxidation in
the presence of hydrogen peroxide, studied separately. Therefore,
the synergism of both processes was assessed by using a syner-
gistic index (SI) expressed below:
SI ¼ RR/(RRads + RRox) (1)
where SI were synergistic indexes in terms of COD, TOC and
colour removal and RRs were the removal rates (%). Table 1
shows synergistic indexes of COD, TOC and colour. For the
catalytic adsorption, removal rates were marginally greater than
those obtained from the separate processes, indicating beneficial
effect of coupled over conventional processes. Another benefit
observed was the increased reusability of ruthenium on carbon
(up to six cycles of catalytic adsorption without the necessary
regeneration) with no significant loss (under 5%) in efficiency,
instead of two cycles with 50% loss in efficiency employing same
processes separately. The most likely reason for that was a direct
oxidation of adsorbed species on the catalytic absorbent surface
with hydrogen peroxide.11 It has been reported that regeneration
of activated carbons saturated with organic compounds may be
performed using reactive methods which also include catalytic
oxidation.12 Therefore, catalytic adsorbents used in the presence
of the oxidizing agent (hydrogen peroxide in a current study),
enhance the decomposition rates of contaminants and enable to
carry the self-regeneration at lower temperatures and lower
residence times in comparison to conventional processes.11
Process kinetics
Process kinetics, demonstrating the solute uptake rate, is one
of the most important characteristics, which represents the
efficiency of the selected catalytic adsorbent and therefore,
determines its potential application. As the process of catalytic
adsorption is rather complex, the proposed kinetics has been
presented as kinetics of main processes studied separately.
Table 2 shows main kinetic parameters of the catalytic adsorp-
tion process: adsorption (g) and oxidation kinetics coefficients
(k) and the equilibrium adsorption capacity (qe). Adsorption
kinetics of COD, TOC and color removal using catalytic
adsorbent was calculated as the initial velocity normalized by the
This journal is ª The Royal Society of Chemistry 2008

Publ
ishe
d on
03
Oct
ober
200
8. D
ownl
oade
d by
Sta
te U
nive
rsity
of
New
Yor
k at
Sto
ny B
rook
on
25/1
0/20
14 2
1:07
:59.
View Article Online
operating conditions parameters according to Brasquet and
colleages,13 and it was defined by the following equation:
g ¼ V/C0m(dC/dT)t/0 (2)
where V was the initial volume of the solution (l), m was weight
of the catalytic adsorbent (mg), C0 was the initial concentration
of COD, TOC and color (ppm) and C was the concentration
(ppm) of COD, TOC and color at time T (min).
Oxidation kinetics was found to follow the pseudo–first order
and kinetic rate constant was derived from the power law:
d[C]/dt ¼ k[C]n (3)
where C was the concentration of COD, TOC and color at time
(ppm) and n was the reaction order.
The most widely used isotherm equation for modelling of
adsorption data is the Langmuir equation, which is valid for
monolayer adsorption onto a surface with a finite number of
identical sites and is given as:
Qe ¼ KLqmCe/(1 + KLCe) (4)
where KL is the adsorption equilibrium constant including the
affinity of binding sites (g�1), Ce is the concentration of COD,
TOC and color at the equilibrium (ppm), qm is the maximum
adsorption capacity (mg g�1) and qe is the amount of sorbed
COD, TOC and color at the equilibrium (mg g�1). According to
the kinetic evaluation the optimization model was developed in
order to study the interaction of main process parameters taking
into account the adsorptive capacity and the oxidation ability of
novel catalytic adsorbent—ruthenium on carbon.
Experimental design
Preliminary study was accomplished at two coded levels: �1 and
+1 (Table 3) by means of orthogonal second-order (Box–
Behnken) half fractional factorial experimental design. Results
are shown in Table 3 marked with asterisks. With the assistance
of normal probability plot, the influence of main effects—X1and
X2 was assessed in terms of contribution to the removal efficiency
(Fig. 3). The normal probability plot revealed that studied effects
(X1 and X2) represented a sample from normal population since
they formed approximately a straight line. Thus, main effects and
their factor interactions influenced the removal efficiency of
COD, TOC and color in a great extent. 3D surfaces presented in
Fig. 4a, b and c for COD, TOC and color removal, respectively,
showed an improved conversion of all parameters with an
increase in concentrations of both, hydrogen peroxide and
Table 3 Coded levels and range of independent variables for theexperimental design
Variable Symbol
Coded variable level
Low �1 Center 0 High + 1
Ruthenium on carbon/g l�1 X1 1 2 3Hydrogen peroxide (ppm) X2 0 7 15pH X3 4 7 11Temperature/�C X4 20 40 60
This journal is ª The Royal Society of Chemistry 2008
ruthenium on carbon. It could be seen that an increase in
hydrogen peroxide concentration at a fixed high level of ruthe-
nium on carbon concentration considerably enhanced the
removal efficiency of COD, TOC and color. While the increase in
the H2O2 concentration at a low level of the catalytic adsorbent,
led to the insignificant changes in the removal rates. In addition,
at a low level of H2O2, increasing in the ruthenium on carbon
concentration produced a little increase in the removal efficiency.
However, the removal efficiencies strongly improved at high
levels of H2O2 concentration. It seems that with low catalytic
adsorbent loading, all the oxidation mechanisms that are based
on the catalytic decomposition of H2O2 slowed down due to
decreased amount of active catalytic sites. The removal rates
consistently reached maximum for high catalytic adsorbent
loading and medium hydrogen peroxide concentration level. The
excess amount of hydrogen peroxide was reported to be detri-
mental for the process due to scavenging of hydroxyl radicals and
also un-reacted hydrogen peroxide may lead to the secondary
contamination of wastewater.12 The proposed model supported
this observation as the significant decrease in the removal rate of
COD, TOC and color was observed at the highest level of H2O2
concentration. High positive regression coefficients indicated
that there was a strong correlation between independent vari-
ables and obtained results. Therefore, the next step of the design
was performed for aliased effect (X1X2) of the main effects versus
confounded (X3 and X4) effects.
The process is rather complex due to the possible effects of
different factors, not considered in the current study, e.g. the
amount of different organic compounds, their possible interac-
tion, etc. Moreover, to ensure the reproducibility of the experi-
ments, the CCD was performed in random order. In general, all
the data were very reproducible. The experimental data used for
fitting the model, are shown in Table 4. The ultimate model
resulting from ANOVA analysis in terms of the coded factors for
the removal efficiency is represented by the following equations:
Y1¼ 61.62 + 18.61X1 + 6.85X2� 10.12X3 + 19.46X4� 13.85X12�
8.86X22 � 2.03X3
2 � 1.71X1X2 + 6.12X1X3 � 7.18 X2X3 (5)
Y2 ¼ 72.33 + 24.67X1 + 9.33X2 � 14.0X3 � 6.0X12 � 20.0X2
2 �1.71X3
2 � 1.08X1X2 + 5.78X1X3 � 4.15 X2X3 (6)
Y3¼ 54.05 + 18.62X1 + 6.95X2� 11.02X3� 16.92X12 + 4.43X2
2�1.13X3
2 � 1.71X1X2 + 5.30X1X3 � 12.6 X2X3 (7)
For the current model only the coefficients for interacting
factors, which have a value of 0.15 or less were included in the
model. Therefore, among the interacting effects, the concentra-
tion of catalytic adsorbent � H2O2 concentration, catalytic
adsorbent � pH and pH � H2O2 concentration were the most
significant ((prob > F) <0.15), whereas those of catalytic adsor-
bent � temperature, H2O2 concentration � temperature and
temperature � pH were insignificant ((prob > F) > 0.2) in vari-
able ranges investigated and therefore were not considered in the
resulting model equations.
The adequacy of fit of models was possible to confirm by
different criteria (Tables 5–7). The F values of 23.4, 25.6 and 24.8
for COD, TOC and color removal models, respectively, implied
J. Environ. Monit., 2008, 10, 1304–1312 | 1307

Fig. 3 Normal probability plot of main effects (X1 and X2) and their interactions at different levels.
Publ
ishe
d on
03
Oct
ober
200
8. D
ownl
oade
d by
Sta
te U
nive
rsity
of
New
Yor
k at
Sto
ny B
rook
on
25/1
0/20
14 2
1:07
:59.
View Article Online
that the model was significant, and there was only a 0.01%
chance that a model with F value could occur due to noise. Also,
the lack of fit was found to be non essential (the highest 0.0450)
implying that the obtained model adequately represented the
experimental data. The statistical significance of the model was
also validated by the coefficients of the model determinations
(0.93, 096 and 0.95 for COD, TOC and color, respectively),
which revealed that only 4–7% of the variability in the responses
was not explained by the developed models. The values of the
predicted and observed data are given in Table 4, with the
correlation between the observed and predicted values being
satisfactory (r ¼ 0.97). Therefore, the proposed models were
found suitable for predicting the removal efficiencies in the range
of operation conditions investigated.
Assessment of the results indicated that there were three
interacting factors (concentrations of the catalytic adsorbent and
hydrogen peroxide and pH) that significantly affected the
removal efficiencies. Temperature did not affect the process,
although the temperature interval, chosen for the current study
was relatively low (up to 70 �C). However, temperatures higher
than 100 �C already belong to another group of AOPs and such
investigation is beyond the scope of the present work. From the
practical point of view, pH is one of the most important
parameters influencing the wastewater treatment. Acidic pH
(below 5) favors the efficient performance of hydrogen peroxide.
It has been reported that, at pH above 4, the rapid H2O2
decomposition produces molecular oxygen with an insufficient
amount of generated hydroxyl radicals.14 The effect of pH is
extremely important when adsorbing species are capable of
ionizing in response to the prevailing pH.15 In lower pH (pH < 5)
the majority of dissolved organic contaminants change their
charge and their tendency to adsorb increase.12 It is well known
that organic compounds adsorb poorly when they are ionized.
Acidic species adsorb better at low, and basic species adsorb
better at high pH.15 The experiments demonstrated that the
1308 | J. Environ. Monit., 2008, 10, 1304–1312
removal rates of TOC, COD and color significantly improved
with the decrease in pH. These results were in accordance with
Zhang and Chuang15 who studied the adsorption of organics
from kraft pulp mill wastewater on the activated carbon and
polymeric resin and proved that acidic species prevail in this type
of wastewater. However, it has also been reported that low pH
favors leaching of the active metal.16 Nevertheless, the leaching
of ruthenium in a current study was not detected throughout the
experiments.
Fig. 5 denotes the interaction between pH and the main effects
(1 g l�1 of ruthenium on carbon and 7 ppm of H2O2). The results
clearly showed that an increase in the concentration of reagents
at high pH had no significant effect on the removal of COD,
TOC and color. Moreover, the increase in pH was accompanied
by the substantial decrease in the removal rates. Obviously, high
pH favors the formation of carbonate ions, which are effective
scavengers of hydroxyl ions and therefore can reduce the effi-
ciency of the overall process.14 Furthermore, hydrogen peroxide
is unstable in basic solutions and may deliberately decompose to
O2 and H2O, losing some of its oxidation ability.17 With the
decrease in pH the removal rates were observed to increase and
pH 4 was predicted to be the optimum for removal of COD, TOC
and color, which was also in agreement with the experimental
data. Moreover, it was observed that the removal efficiencies for
COD, TOC and color at pH 4 were higher than these at pH 11,
regardless of the operational temperature of the process. The
remarkable increase in Y was already achieved for the average
level of X3 in comparison to high level, demonstrating the
efficient removal of COD, TOC and color at the initial pH 7 of
the wastewater (53%, 51% and 47%, respectively).
Experimental
All experiments were carried out in a glass reactor, equipped with
a magnetic stirrer and a temperature controller. The reaction
This journal is ª The Royal Society of Chemistry 2008
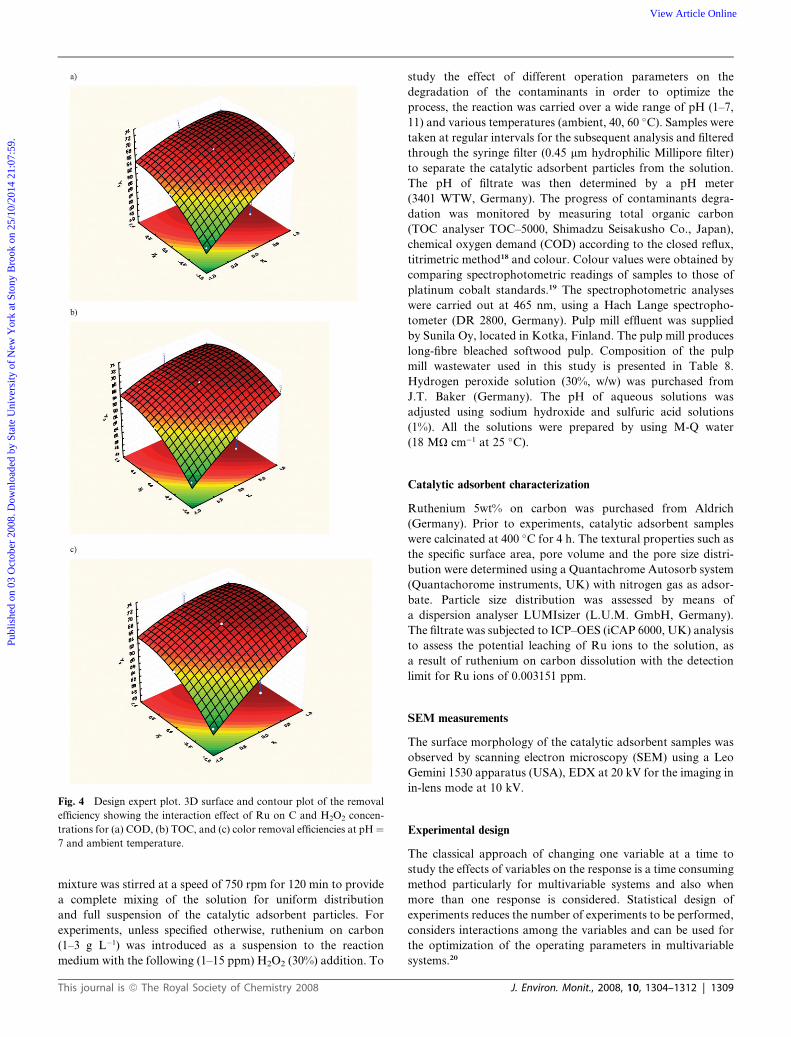
Fig. 4 Design expert plot. 3D surface and contour plot of the removal
efficiency showing the interaction effect of Ru on C and H2O2 concen-
trations for (a) COD, (b) TOC, and (c) color removal efficiencies at pH¼7 and ambient temperature.
Publ
ishe
d on
03
Oct
ober
200
8. D
ownl
oade
d by
Sta
te U
nive
rsity
of
New
Yor
k at
Sto
ny B
rook
on
25/1
0/20
14 2
1:07
:59.
View Article Online
mixture was stirred at a speed of 750 rpm for 120 min to provide
a complete mixing of the solution for uniform distribution
and full suspension of the catalytic adsorbent particles. For
experiments, unless specified otherwise, ruthenium on carbon
(1–3 g L�1) was introduced as a suspension to the reaction
medium with the following (1–15 ppm) H2O2 (30%) addition. To
This journal is ª The Royal Society of Chemistry 2008
study the effect of different operation parameters on the
degradation of the contaminants in order to optimize the
process, the reaction was carried over a wide range of pH (1–7,
11) and various temperatures (ambient, 40, 60 �C). Samples were
taken at regular intervals for the subsequent analysis and filtered
through the syringe filter (0.45 mm hydrophilic Millipore filter)
to separate the catalytic adsorbent particles from the solution.
The pH of filtrate was then determined by a pH meter
(3401 WTW, Germany). The progress of contaminants degra-
dation was monitored by measuring total organic carbon
(TOC analyser TOC–5000, Shimadzu Seisakusho Co., Japan),
chemical oxygen demand (COD) according to the closed reflux,
titrimetric method18 and colour. Colour values were obtained by
comparing spectrophotometric readings of samples to those of
platinum cobalt standards.19 The spectrophotometric analyses
were carried out at 465 nm, using a Hach Lange spectropho-
tometer (DR 2800, Germany). Pulp mill effluent was supplied
by Sunila Oy, located in Kotka, Finland. The pulp mill produces
long-fibre bleached softwood pulp. Composition of the pulp
mill wastewater used in this study is presented in Table 8.
Hydrogen peroxide solution (30%, w/w) was purchased from
J.T. Baker (Germany). The pH of aqueous solutions was
adjusted using sodium hydroxide and sulfuric acid solutions
(1%). All the solutions were prepared by using M-Q water
(18 MU cm�1 at 25 �C).
Catalytic adsorbent characterization
Ruthenium 5wt% on carbon was purchased from Aldrich
(Germany). Prior to experiments, catalytic adsorbent samples
were calcinated at 400 �C for 4 h. The textural properties such as
the specific surface area, pore volume and the pore size distri-
bution were determined using a Quantachrome Autosorb system
(Quantachorome instruments, UK) with nitrogen gas as adsor-
bate. Particle size distribution was assessed by means of
a dispersion analyser LUMIsizer (L.U.M. GmbH, Germany).
The filtrate was subjected to ICP–OES (iCAP 6000, UK) analysis
to assess the potential leaching of Ru ions to the solution, as
a result of ruthenium on carbon dissolution with the detection
limit for Ru ions of 0.003151 ppm.
SEM measurements
The surface morphology of the catalytic adsorbent samples was
observed by scanning electron microscopy (SEM) using a Leo
Gemini 1530 apparatus (USA), EDX at 20 kV for the imaging in
in-lens mode at 10 kV.
Experimental design
The classical approach of changing one variable at a time to
study the effects of variables on the response is a time consuming
method particularly for multivariable systems and also when
more than one response is considered. Statistical design of
experiments reduces the number of experiments to be performed,
considers interactions among the variables and can be used for
the optimization of the operating parameters in multivariable
systems.20
J. Environ. Monit., 2008, 10, 1304–1312 | 1309

Table 4 Results of CCD, FFD (marked with asteriks) conditions and the experimental as well as predicted values for COD (%), TOC (%) and color (%)(Y1, Y2 and Y3, respectively)
Run
Coded levels of variables Y1 (%) Y2 (%) Y3 (%)
X1 X2 X3 X4 Exp Pred Exp Pred Exp Pred
1 1 �1 �1 0 62.12 62.00 60.15 60.05 48.23 48.002 0 0 0 0 55.23 55.00 53.67 53.67 43.74 43.003 �1 �1 �1 1 47.00 47.00 45.12 45.12 33.62 33.004 �1 �1 �1 �1 46.12 46.00 46.87 45.87 34.41 34.005 �1 1 �1 0 57.32 57.00 55.01 55.51 49.64 49.006 1 1 �1 �1 72.46 69.20 70.28 68.20 68.01 61.897 1 1 1 1 40.87 38.54 39.57 37.91 35.00 34.308 �1 1 1 1 36.35 37.46 33.22 34.88 33.15 33.709 0 0 1 �1 45.13 45.00 44.29 44.29 39.37 39.0010 0 0 �1 �1 75.12 74.40 72.81 72.77 68.82 66.7811 1 0 �1 �1 60.00 66.93 59.01 64.79 58.69 61.9012 1 �1 1 �1 55.03 55.00 56.83 56.83 49.01 49.0013 0 0 1 0 51.64 51.00 49.75 49.75 36.94 36.0014 0 1 0 0 51.54 50.74 48.92 48.58 36.43 36.4115 �1 �1 1 1 34.23 32.54 33.56 31.90 27.13 26.3016 �1 �1 1 �1 34.67 34.00 33.12 33.12 27.00 27.0017 1 �1 0 1 45.46 45.00 43.25 43.25 37.47 37.0018 1 0 �1 0 77.14 74.87 76.38 73.27 67.84 66.2119 1 �1 1 1 35.36 34.73 33.05 34.09 27.19 27.3520 0 1 1 1 34.98 34.00 33.96 33.96 27.17 27.0021 0 1 �1 �1 64.00 64.34 63.74 63.45 56.73 57.6322 1 0 �1 �1 73.46 66.93 70.19 64.79 65.87 61.9023 1 0 �1 0 73.19 74.87 70.49 73.27 65.00 66.2124 0 1 �1 0 67.45 67.26 67.57 67.91 56.34 55.5925 1 1 �1 �1 67.12 69.20 66.16 68.20 57.24 61.8926 1 �1 1 1 33.13 34.73 33.48 34.09 27.37 27.3527 0 0 0 1 34.25 34.00 32.29 32.29 27.72 27.0028 1 0 0 0 56.76 56.26 55.00 55.34 48.51 47.5929* �1 0 0 �1 44.36 44.00 45.95 45.95 35.63 35.0030* 0 1 0 �1 52.32 51.66 49.18 49.47 45.00 43.3731* 1 �1 0 �1 56.05 54.54 53.48 51.82 49.03 48.3032* �1 �1 0 �1 40.00 41.46 37.71 39.37 33.23 33.7033* 0 0 0 �1 56.97 56.60 55.75 55.79 48.64 49.2234* 1 0 0 �1 53.23 52.14 52.58 52.20 49.00 48.1935* �1 1 0 �1 49.14 47.54 47.00 45.34 38.07 37.3036* 1 1 0 �1 62.63 59.53 61.37 58.63 54.12 51.4637* 1 1 0 �1 55.00 59.53 54.18 58.63 47.67 51.46
Table 5 ANOVA test for the response function Y1 (COD removalefficiency, %)
SourceSum ofsquares DF
Meansquare F value Prob > F
Model 6107.081 9 605.4056 12.9657 0.000070X1 137.136 1 68.56812 3.659755 0.000138X2 60.394 1 30.19695 1.611732 0.000747X3 136.803 1 68.40164 3.650869 0.000402X1
2 38.367 1 19.18327 1.023888 0.000237X2
2 97.437 1 32.47915 1.733542 0.000419X3
2 82.426 1 20.60657 1.099855 0.000166X1X2 160.714 1 40.17858 2.144491 0.007878X1X3 235.531 1 58.88281 3.142811 0.000928X2X3 0.163 1 0.16258 0.008678 0.000564Residual 59.055 16 14.76364 0.787995Lack of fit 51.23 11Pure error 145.36 8Cor. total 6598 25SD 11.6 R squared 0.940475Mean 55.876 Adj R
squared0.89765
CV 23.587 Pred rsquared
0.758493
Press 7654.1 Adeqprecision
10.6543
Table 6 ANOVA test for the response function Y2 (TOC removal effi-ciency, %)
SourceSum ofsquares DF
Meansquare F value Prob > F
Model 7903.382 9 705.4998 13.9543 0.000045X1 175.169 1 175.169 4.754701 0.000521X2 80.854 1 80.854 3.632214 0.000312X3 145.004 1 145.004 2.690822 0.000500X1
2 27.520 1 27.520 1.887932 0.000399X2
2 87.860 1 87.860 1.542280 0.000707X3
2 90.318 1 90.318 1.549756 0.000953X1X2 149.520 1 149.520 2.914342 0.008348X1X3 245.295 1 245.295 3.109153 0.000715X2X3 0.843 1 0.843 0.008774 0.000152Residual 69.932 16 12.23293 0.994634Lack of fit 54.54 11Pure error 156.36 8Cor. total 8045 25SD 15.3 R squared 0.96765Mean 57.876 Adj R
squared0.91235
CV 26.857 Pred rsquared
0.76432
Press 9854.1 Adeqprecision
11.345
1310 | J. Environ. Monit., 2008, 10, 1304–1312 This journal is ª The Royal Society of Chemistry 2008
Publ
ishe
d on
03
Oct
ober
200
8. D
ownl
oade
d by
Sta
te U
nive
rsity
of
New
Yor
k at
Sto
ny B
rook
on
25/1
0/20
14 2
1:07
:59.
View Article Online

Table 7 ANOVA test for the response function Y3 (color removal effi-ciency, %)
SourceSum ofsquares DF
Meansquare F value Prob > F
Model 6068.108 9 6068.108 12.8553 0.000060X1 128.441 1 128.441 4.039830 0.000446X2 51.211 1 51.211 1.610743 0.000018X3 83.968 1 83.968 2.641015 0.000248X1
2 53.418 1 53.418 1.680151 0.000943X2
2 54.767 1 54.767 1.148390 0.000831X3
2 66.539 1 66.539 1.046422 0.000150X1X2 164.845 1 164.845 2.592421 0.001723X1X3 233.372 1 233.372 3.670110 0.000434X2X3 0.184 1 0.184 0.011596 0.000099Residual 51.509 16 51.509 0.810050Lack of fit 48.93 11Pure error 143.36 8Cor. total 6347 25SD 11.9 R squared 0.96543Mean 48.578 Adj R
squared0.942147
CV 28.623 Pred rsquared
0.786742
Press 8576.4 Adeqprecision
11.8675
Publ
ishe
d on
03
Oct
ober
200
8. D
ownl
oade
d by
Sta
te U
nive
rsity
of
New
Yor
k at
Sto
ny B
rook
on
25/1
0/20
14 2
1:07
:59.
View Article Online
Half-fractional factorial design (H-FFD)
At the initial stage of the experimental design, a half-fractional
factorial design (33�1), H-FFD was accomplished at three
levels in order to get a general view of the significant factors
and possible noteworthy interactions in the studied range of
variables. Table 3 demonstrates the coded variables and
confounded effects of that design.
Fig. 5 Design expert plot. 3D surface and contour plot of the removal
efficiency showing the interaction effect of Ru on C and H2O2 concen-
trations and various pH for (a) COD, (b) TOC, and (c) color removal
efficiencies.
Central composite design (CCD)
During the next step, a central composite design was employed to
determine the optimal conditions for the critical factors. A
modified central composite experimental design known as the
Box–Behnken design is an independent, rotatable quadratic
design with no embedded factorial or fractional factorial points
where the variable combinations are at the midpoints of the
edges and at the center of the variable space. Among all the
response surface methodology (RSM) designs, Box–Behnken
design requires fewer runs than the others, e.g., 15 runs for
a three-factor experimental design. The actual values of inde-
pendent variables (Xi) were coded assigning the lowest values
listed in Table 3 as �1 and the highest values as +1, according to
the following equation:
xi ¼ Xi � xi/Dxj (8)
where xi was dimensionless value of independent variable, Xi
represented the real value of the independent variable, xi was the
real values of the independent variable at the center point, and
Dxj was the step charge.
The CCD allowed the response surface to be modelled by
fitting a second-order polynomial with a number of experiments
equal to 2f + 2f + n, where f and n were numbers of factors and
center runs, respectively (f ¼ 4 and n ¼ 2). The repetition of the
central runs was carried out to obtain the data on the variation of
This journal is ª The Royal Society of Chemistry 2008
the responses in average, the residual variance, and eventually to
evaluate the pure experimental uncertainty. Using a four factor–
three coded level (Table 4) central composite design (CCD),
28 runs were carried out to fit the general model, as following:
Y ¼ b0 +P
biXi +P
biiXi2 +
PPbijXiXj (9)
J. Environ. Monit., 2008, 10, 1304–1312 | 1311

Table 8 Main characteristics of the pulp mill effluent
Parameter Unit Value
COD ppm 510TOC ppm 220Color PtCo 540AOX ppm 5.4BOD7 ppm 8pH 7.1
Publ
ishe
d on
03
Oct
ober
200
8. D
ownl
oade
d by
Sta
te U
nive
rsity
of
New
Yor
k at
Sto
ny B
rook
on
25/1
0/20
14 2
1:07
:59.
View Article Online
where Y was the coded removal efficiency (%) of COD, TOC and
color, and bs were model coefficients calculated from the
experimental data.
The reproducibility of data in a complex process such as the
degradation of contaminants is a very important matter;
therefore, CCD experiments were performed twice and in
randomized order to minimize the effect of uncontrolled factors
and time trends. The average data was used as the final values for
the development of a current model. STATISTICA 7 (USA)
software was used for regression and graphical analysis of data.
Conclusion
Introduced novel catalytic adsorbent benefited higher removal
rates of contaminants regarding COD, TOC and color, better
reusability and regenerability as well as unaltered initial pH of
the wastewater than the traditional adsorbent. The optimum
operational parameters for effective treatment of pulp mill
effluent were determined and substantiated (1 g l�1 of ruthenium
on carbon, 7 ppm of H2O2, pH 4 and ambient temperature).
Removal rates demonstrated were 75, 73 and 68% for COD,
TOC and color, respectively. The valid effective models were
developed and explained using Box–Behnken design and CCD.
The major advantage of the used second-order polynomial
model was found to be its flexibility. It means that if there were
any limitations imposed by the operational and economical
consideration on the values of some factors, it was possible to
calculate new optimum conditions in which the effects of these
limitations would be compensated by the other factors.
1312 | J. Environ. Monit., 2008, 10, 1304–1312
Acknowledgements
Mikkeli Technology Center, Mikkeli University Consortium
(MUC), EU Objective 1 and Academy of Finland (decision
number 212649) are acknowledged for their financial support of
research.
References
1 E. C. Catalkaya and F. Kargi, J. Environ. Manage., 2008, 87, 396–404.
2 H. Nurmesniemi, R. Poykio and R. L. Keiski, Waste Manage., 2007,27, 1939–1948.
3 M. Kitisa, E. Karakayaa, N. O. Yigita, G. Civelekoglua andA. Akcilb, Water Res., 2005, 39, 1652–1662.
4 G. Centi, M. Gotti, S. Perathoner and F. Pinna, Catal. Today, 2000,55, 51–60.
5 A. Georgi and F.-D. Kopinke, Appl. Catal., B, 2005, 58, 9–18.6 W. P. Kwan and B. M. Voelker, Environ. Sci. Technol., 2004, 38,3425.
7 J. Trawczynski, Carbon, 2003, 41, 1515–1523.8 A. Rodas-Grapaın, J. Arenas-Alatorre, A. Gomez-Cortes andG. Dıaz, Catal. Today, 2005, 107–108, 168–174.
9 D. J. Moon, M. J. Chung, K. Y. Park and S. I. Hong, Carbon, 1999,37, 123–128.
10 Yu. Yegiazarov, J. Clark, L. Potapova, V. Radkevich, V. Yatsimirskyand D. Brunel, Catal. Today, 2005, 102–103, 242–247.
11 M. Sheintuch and Y. I. Matatov-Meytal, Catal. Today, 1999, 53, 73–80.
12 Q. U. Jiuhui, J. Environ. Sci., 2008, 20, 1–13.13 C. Brasquet, B. Rousseau, H. Estrade-Szwarckopf and P. Le Cloirec,
Carbon, 2000, 38, 407–422.14 C. W. Jones, Applications of hydrogen peroxide and derivatives, Royal
Society of Chemistry, Cambridge, UK, 1999.15 Q. Zhang and K. T. Chuang, Adv. Environ. Res., 2001, 3, 251–258.16 R. Molina, F. Martinez, J. A. Melero, D. H. Bremner and
A. G. Chakinala, Appl. Catal., B, 2006, 66, 198–207.17 C. Catrinescua, C. Teodosiua, M. Macoveanua, J. Miehe-Brendleb
and R. Le Dredb, Water Res., 2003, 37, 1154–1160.18 Water Analysis, Guidelines for the Determination of Chemical Oxygen
Demand (COD), Finnish Environmental Institute, Helsinki, Finland,SFS 5504, 1988.
19 Method NCASI 253, Analytical Methods for the Determination ofPollutants in Pulp and Paper Industry Wastewater, EPA 821-R-93–01, U.S. Environmental Protection Agency, Office of Water,Washington, DC, 1993.
20 Z. R. Lazic, Design of Experiments in Chemical Engineering, Wiley-VCH, Weinheim, 2004.
This journal is ª The Royal Society of Chemistry 2008