Embed Size (px)
Citation preview

Optimization of Process Variables for Retention of Functional Properties of Bitter Melon (Momordica Charantia L.)
and its Shelf - Life Extension
SHEETAL DEVI,1 DIPENDRA KUMAR MAHATO,2* SARVESH SINGH2 and SURENDRA PRASAD SINGH2
1SAB Miller India Ltd., Sonipat, Haryana 131001, India2Centre of Food Science and Technology, Banaras Hindu University (BHU),
Varanasi- 221005, Uttar Pradesh, India
AbstractThis study was carried out to investigate the effect of sodium hypochlorite (NaClO), hydrogen peroxide (H2O2) and soaking time on vitamin C, carotenoid, antioxidant activity and total phenolic content for optimizing the pre - treatment for minimal processing of bitter melon slices and to evaluate its shelf life at different storage conditions. Fresh - cut bitter melon slices were given post-cutting treatment of wash solution containing NaClO (25 - 500ppm) and H2O2 (1 - 5%) solution for different time intervals (10 - 120 minutes). The treated samples were analyzed for Vitamin C content, carotenoid, DPPH inhibition activity, ABTS inhibition activity and total phenolic content (TPC) using Central Composite Rotatable Design (CCRD). The optimum condition for soaking achieved by CCRD was NaClO (25 ppm), H2O2 (1 %) and soaking time (56.32 min). The minimally processed bitter melon at optimized wash water treatment was packed in LDPE pouch of 0.1 mm thickness and were evaluated for shelf-life under modified atmospheric packaging, MAP 1 (5 % O2, 25 % CO2 & 70 % N2) and MAP 2 (10 % O2, 20 % CO2 & 70 % N2) stored at temperature of 5, 20 and 35 °C, respectively. Based on microbiological, colour and textural analysis, MAP 1 was found to be better compared to MAP 2 and the shelf - life of fresh - cut bitter melon slices was prolonged up to twenty-eight days of storage.
Current Agriculture Research Journal
www.agriculturejournal.org
ISSN: 2347-4688, Vol. 7, No.(1) 2019, pg. 74-89
CONTACT Dipendra Kumar Mahato [email protected] Centre of Food Science and Technology, Banaras Hindu
University (BHU), Varanasi- 221005, Uttar Pradesh, India.
© 2018 The Author(s). Published by Enviro Research Publishers. This is an Open Access article licensed under a Creative Commons license: Attribution 4.0 International (CC-BY).Doi: http://dx.doi.org/10.12944/CARJ.7.1.10
Article History
Received: 8 February 2019Accepted: 22 April 2019
Keywords:
Bitter Melon;Minimal Processing;Modified AtmospherePackaging (MAP);RSM; Shelf-life.

75MAHATO et al., Curr. Agri. Res., Vol. 7(1) 74-89 (2019)
IntroductionBitter melon (Momordica charantia L.), a member of Cucurbitaceae family is variously known as bitter gourd, bitter squash, balsam pear, karalla, African cucumber and bitter cucumber. It has twice the calcium and potassium content with respect to spinach and banana, respectively. It is rich in minerals like iron, zinc, phosphorus, sodium, and magnesium as well as a fair source of vitamin C that contributes about 55% of total vitamins.1 Minimally processed vegetables, also referred to as ready-to-use, fresh-cut or pre-cut produce, are raw fruits and vegetables that undergo through various stages like washing, peeling, slicing, and chopping before actually being packaged for further processing and consumption. The market value of minimally processed fruits and vegetables are limited by their short shelf life. This is accountable to the tissue damage during processing stages and the microbial growth during storage. The washing of fresh-cut products with chlorinated water (50-200 mgL−1 of active chlorine) reduces the levels of various pathogenic microorganisms. For this purpose, sodium hypochlorite (NaClO) is most widely used as a sanitizer in the fresh-cut industry.2 In addition to this, hydrogen peroxide (H2O2), which is highly oxidative in nature due to the release of O2 in aqueous solutions, has antimicrobial activity both against gram-positive and gram-negative bacteria.3 H2O2 in the range of 1-5% is used as a sanitizer for food contact surfaces as well as for packaging materials in aseptic filling operations. The antimicrobial efficiency of 4-5% H2O2 is comparable to 100-200 ppm of chlorine treatment.4
The major concern regarding minimally processed fruits and vegetables are on their microbiological quality, safety, processing and packaging issues.5 As minimally processed vegetables require storage before cooking, thus, may possess a potential food safety issue.6 Minimally processed vegetables are usually contaminated with food-borne pathogens such as Escherichia coli O157: H7 and Listeria monocytogenes. According to Rodgers, Cash,7 the treatment of whole lettuce, strawberries, and cantaloupe with 100 ppm chlorine for 5 minutes reduced L. monocytogenes and E. coli O157:H7 to non-detectable levels. Both these pathogens have been reported in a variety of vegetables like leafy vegetables, bitter melon, cabbage, celery, cucumber, radish, tomato and bean sprouts.8 However, the
use of modified atmosphere packaging (MAP) have not been reported with any outbreaks. The MAP makes use of different levels of O2 and CO2 for packaging purpose, where 3-8% CO2 and 2-5% O2 is recommended for fruits and vegetables for MAP storage.9
Sodium hypochlorite (100-10,000 ppm) and H2O2 (5%) have been used for sanitization of “chile de árbol” pepper (Capsicum frutescens L.) fruit with the exposure time varying from 30-120 minutes.10 de São José and Vanetti11 used 5% of H2O2 for the decontamination of watercress, parsley and strawberries. Similarly, Meireles, Fulgêncio12 minimally processed the vegetable plants using NaClO solution. Till date, there are no reports available for the combined effects of NaClO and H2O2 with other hurdles like freezing and MAP for the processing and preservation of bitter melon. Therefore, the novelty of this study lies on the use of combined effect of NaClO and H2O2 as a sanitizer for decontaminating the wash water during minimal processing of bitter melon in the range of (25-500 ppm) and (1-5%) respectively for the exposure time of (10-120) minutes. Therefore, this study was conducted to evaluate the effects of NaClO and H2O2 with soaking time assisted by different MAP gas composition and storage temperatures for the retention of functional properties of bitter melon and its shelf - life evaluation based on microbial growth and physico - chemical properties. Bitter melon, being a good source of vitamin C, carotenoid, antioxidant activity and total phenolic content, these nutritional parameters were selected as responses. The above techniques are also free from any environmental hazards and are effective in maintaining various quality parameters of bitter melon as compared to other preservation technologies.
Materials and Methods MaterialsFresh bitter melon was procured from the local market of Varanasi, India. All chemical reagents used in this work were of analytical grade and purchased from Merck (Merck, Darmstadt, Germany) and Sigma (Sigma-Aldrich, Gillingham - Dorset, England). The LDPE pouch of 0.1 mm thickness was purchased from Sigma - Aldrich for MAP packaging of minimally processed bitter melon.

76MAHATO et al., Curr. Agri. Res., Vol. 7(1) 74-89 (2019)
Sample Preparation for Minimal ProcessingMature bitter melon of uniform size and dark green colour were selected for the study. They were first sorted and washed in running water. The tail ends of cleaned bitter melon were removed followed by slicing into rings of one cm thickness using a stainless-steel knife. Bitter melon slices were soaked in NaClO (25 - 500 ppm) and H2O2 (1 - 5 %) solution for different time intervals (10-120 minutes) for optimizating the pre-treatment. The sanitizers and soaking time were selected as per the earlier research focused on the synergistic effect of NaClO and H2O2 on microbial decontamination.13
Experimental DesignResponse Surface Methodology (RSM) was used to optimize the process variables for the functional properties of bitter melon. The effects of three independent variables: A (Sodium hypochlorite), B (Hydrogen peroxide) and C (Soaking time) at levels 25-500 ppm, 1-5% and 10-120 minutes respectively on five response variables: Vitamin C content, carotenoid, DPPH inhibition activity, ABTS inhibition activity and Total phenolic content (TPC) were evaluated using Central Composite Rotatable Design (CCRD). All the experiments were carried out in triplicate. The effects of the independent variables (A(X1), B(X2) and C(X3)) on the dependent variable Y was evaluated using the Eq. below:
Yn = α0 + α1X1 + α2X2 + α3X3 + α11X12 + α22X2
2+α33X32
+ α12 X1 X2 + α13 X1 X3 + α23X2X3
Where,Yn represents the response variable, α0 is a constant; α1, α2 and α3 are the coefficients of the linear effects; α12, α13 and α23 are the coefficients of the interaction between the factors; and α11,α22 and α33 are the coefficients of the quadratic effect.
The data were analyzed for analysis of variance (ANOVA) using Design-Expert 9.0.2.0 (State Ease, Inc.). The fitness of the polynomial equation was estimated using the coefficient of determination (R2) and at a level of 5% significance.
Proximate AnalysisThe official methods AOAC14 was used to determine moisture, proteins, fibre and ash content. The moisture content of fresh - cut bitter melon slices and the minimally processed at optimum condition were
determined using a rapid moisture analyzer (MB 45, Switzerland). Protein content was estimated using Automatic Kjeldahl method (Kjeldah 2006 Digester and Kjeltec® 2300 Analyzer unit, Hoganas, Sweden).
Estimation of Vitamin C ContentThe vitamin C was analyzed by the titration method. Ten grams of sample was taken, blended with 3% metaphosphoric acid (HPO3) and made up to 100 mL with HPO3. It was then filtered and centrifuged. Ten milliliters of samples were taken for the titration and titrated against the standard dye solution (2,6 - dicholorophenol endophenol).15 Prior to this, the dye was standardized using 5 ml of standard ascorbic acid and 5 ml of HPO3 and then titrated with dye solution to obtain a dye factor as:
Dye factor = 0.5 / titre
Then the dye factor is used in the actual calculation of Vitamin C as:
mg of ascorbic acid per 100g = titre × dye factor × volume made up ×100 / aliquot of extract taken for estimatiom × volume used
Estimation of Carotenoid ContentThe extraction and calculation of total carotenoid was done as per the method described by de Carvalho, Gomes.16 To about 15 g of sample, 3 g of celite 454 (Tedia, Ohio, USA) and 25 ml of acetone was added and crushed to paste in a mortar & pestle till colourless. The extract obtained was then transferred to a separating funnel containing 40 ml of petroleum ether. The acetone was removed by the addition of water and discarding the aqueous phase. The extract was then subjected to anhydrous sodium sulphate to remove the remaining moisture present. Finally, the volume was made up with petroleum ether and absorbance was read at 450 nm by UV-1800 spectrophotometer (Shimadzu, Japan). The total carotenoid is given by:
Carotenoid content (µg / g) = (Absorbance × volume used × 104) / (A1cm
1% × weight of sample)
Where,
A1cm1% = 2592, is the extinction coefficient of β -
carotene in petroleum ether.

77MAHATO et al., Curr. Agri. Res., Vol. 7(1) 74-89 (2019)
to which 3 mL of distilled water was added followed by 2 mL of Folin - Ciocalteau reagent. Then after 3 min, 2.0 mL of sodium carbonate 7.5 % (w / v) was added and the reaction mixtures were kept for 45 min in an incubator shaker in dark condition. After the appearance of blue colour, the absorbance was measured at 765 nm using UV - 1800 spectrophotometer (Shimadzu, Japan). Gallic acid was used to plot a standard calibration curve. The total phenolic content of the sample was determined by plotting the spectrophotometer readings of the samples against the standard calibration curve and the amount estimated was expressed in terms of gallic acid equivalents (GAE / g).
MAP Packaging of Minimally Processed Bitter Melon at Optimized Pre - Treatment The predicted values obtained by the desirability function method with the highest desirability for optimization was verified by experimental values. The minimally processed bitter melon slices at optimized pre - treatment were weighed in 50 g and packaged in low-density polyethylene (LDPE) pouches of 0.1 mm thickness, one set with MAP 1 (5% O2, 25% CO2 & 70% N2) and the other set with MAP 2 (10% O2, 20% CO2 & 70% N2) using modified atmospheric packaging machine (Induac Saurabh Engineers, INDIA). The MAP 1 and 2 gaseous levels were selected based on recommended (around 5% O2 and 10% CO2) gas composition for fruits and vegetables storage.9 The sample in LDPE pouch at the normal atmospheric gas condition was taken as control. Each set of MAPs packaged bitter melon samples were stored at temperature of 5 °C, 20 °C and 35 °C in triplicate for a period of one month and microbial growth, colour and textural changes were monitored at an interval of 7 days.
Microbiological AnalysisTotal plate count, total fungal count and coliform count were done according to method AOAC.20 The serial dilution was done in a test tube with 9 mL of 0.9% NaCl solution. One gram of sample was added to the first test tube and then serially diluted up to 10⁻5 dilution factor. 1 mL of each dilution was pour plated for plate count agar (PCA), Potato dextrose agar (PDA) and Violet Red Bile Agar (VRBA). The plates were incubated at 37 °C for 48 hours in an inverted position. The plate counts were expressed as colony - forming units (CFU)/g.
Extract for Antioxidant Inhibition Analysis Ten grams of minimally processed bitter melon slices were crushed to paste in mortar and pestle followed by the addition of 100 ml of ethanol (70%). The mixture was homogenized properly and filtered using Whatman no 42. The sample extract thus obtained was used for DPPH, ABTS and TPC analyses.
Antioxidant Inhibition Activity AnalysisDPPH (2, 2 Diphenyl-1-Picrylhydrazyl) MethodThe test was performed as per the method by Apak, Gorinstein.17 To 0.2 mL of sample extract, 1 mL of DPPH solution (80 µg / mL ethanol) was added. The blank was taken as 0.2 mL distilled water with 1 mL DPPH solution. Both the sample and blank were stored in a dark at room temperature for 30 minutes. After this, the samples were centrifuged at 3000 rpm for 15 minutes and the absorbance was measured at 515 nm using UV-1800 spectrophotometer (Shimadzu, Japan).
DPPH % = (Ablank – Asample) / Ablank × 100
Where, A is the absorbance of samples and blank
ABTS (2, 2’- Azino - Bis (Ethyl Benzthiazoline - 6 - Sulfonic Acid) MethodThe test was carried out as per the ABTS method described by Shalaby and Shanab.18 The stock solution of ABTS was prepared by mixing 7mM ABTS with 2.45 mM potassium persulfate (1:1, v/v) and kept for 4 - 16 hrs for the reaction to complete and give stable absorbance. ABTS•+ solution was then diluted with ethanol to an absorbance of 0.700 ± 0.05 at 734 nm for the measurements. Then, 0.1 mL of sample extract was mixed to 0.9 mL of ABTS• + solution, mixed properly and absorbance was taken after 15 minutes at 734 nm. The antioxidant is measured by a decrease in absorbance as:
ABTS % = (Ablank – Asample) / Ablank × 100
Where, A is the absorbance of samples and blank (ABTS•+)
Total Phenolic Content (TPC) AnalysisThe analysis for TPC was performed using Folin-Ciocalteau reagent as per the method described by Ainsworth and Gillespie19 with slight modification. Approximately 0.5 mL of sample extract was taken

78MAHATO et al., Curr. Agri. Res., Vol. 7(1) 74-89 (2019)
Results and Discussion The effects of sodium hypochlorite (NaClO), hydrogen peroxide (H2O2) and soaking time on the functional properties of minimally processed bitter melon have been evaluated. The individual as well as the synergistic effects of NaClO and H2O2 with respect to soaking time were used to optimize the level of sanitizers for pre-treatment. The optimum condition obtained was further carried for minimal processing of bitter melon followed by MAP packaging and shelf life evaluation.
Effect of Pre - Treatment on Proximate CompositionProximate composition of bitter melon slices before and after minimal processing using NaClO and H2O2 are shown in Table 1. These data are in accordance with the findings of Donya, Hettiarachchy23 and Bangash, Arif24 for bitter melon. The minimal processing by the use of selected combined sanitizers does not significantly impact on the proximate composition of bitter melon. Similarly, Sapers, Miller25 when treated the mushroom with H2O2, they observed no significant changes in the proximate analysis. This supports our findings regarding the effect of minimal processing on the proximate composition of bitter melon which remains almost unaffected.
Physical Properties of Stored Bitter Melon SamplesColour and Textural Analysis The color was determined by using a colorimeter (Konica Minolta, Japan). The color parameters were L* (L* = 0, black and L* = 100, white), a* (-a* = greenness and + a* = redness), and b* (-b* = blueness and + b* = yellowness). The colorimeter was calibrated with a white calibration tile.21
The texture analysis (hardness) was performed using a texture analyzer (Model CT3, Brookfield Engineering Laboratories, USA) with slight modification in methods used by Park, Kim.22 5 g of sample was put on a circular platform. It was compressed to 60% with a rod - type probe (TA 10, 25.4 hmm diameters) at a speed of 0.5 mm/s in order to carry out the TPA analysis. Hardness was determined and recorded in triplicates.
Statistical AnalysisThe physicochemical analysis was performed in triplicates and the results were reported as a mean ± standard deviation. The data were then analyzed for analysis of variance (ANOVA) at P < 0.05. All the statistical analyses were performed using Design-Expert 9.0.2.0 software.
Table 1: Nutritional evaluation of bitter melon before and after pre-
treatment at optimum condition
S.No. Parameters Quantity (%)
Before pre-treatment After pre-treatment
1. Moisture Content 90.20 ± 1.10a 91.20 ± 1.10a
2. Protein Content 2.27 ± 0.51b 2.47 ± 0.25b
3. Dietary fibre 2.75±0.42c 2.80±0.35c
4. Total Ash 1.46 ± 0.25d 1.32 ± 0.17d
*(a-d) same letters denote non-significant difference at p ≤ 0.05
79MAHATO et al., Curr. Agri. Res., Vol. 7(1) 74-89 (2019)
Effect of Pre-Treatment on Vitamin C ContentFrom the response plot (Figure 1), it is observed that the variables NaClO, H2O2 and soaking time adversely affected the vitamin C content of the minimally processed bitter melon. Vitamin C acts as a reducing agent and thus has an inhibitory effect on the H2O2 as reported by Carnelio, Khan.26 Weston, Ito27 and D’Aquino, Suming28 have also reported antagonist effects of NaClO on vitamin C. The vitamin C content was slightly reduced after washing the fresh-cut lettuce with NaClO solution as compared to the unwashed samples.29 The decrease in vitamin C content was similar to findings by Tirawat, Kunimoto30 showing the significant decrease in vitamin C content in cabbage. The interaction effect between NaClO & H2O2 and between H2O2 & soaking time had a negative effect while the interaction between NaClO
& soaking time had a positive effect. The regression equation obtained for the vitamin C content is given below:
Vit.C = +76.40 - 1.36 × A - 0.68 × B - 1.07 × C - 0.11 × AB + 0.034 × AC - 0.12 × BC + 0.24 × A2 - 50.037 × B2 - 0.44 × C2
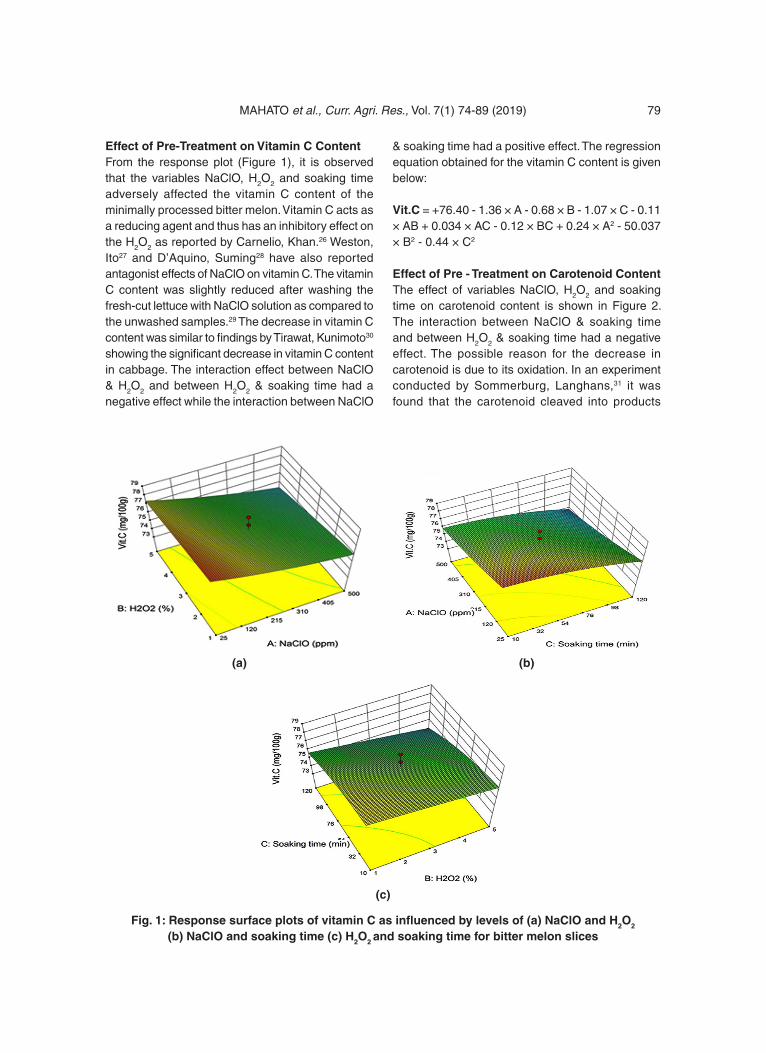
Effect of Pre - Treatment on Carotenoid ContentThe effect of variables NaClO, H2O2 and soaking time on carotenoid content is shown in Figure 2. The interaction between NaClO & soaking time and between H2O2 & soaking time had a negative effect. The possible reason for the decrease in carotenoid is due to its oxidation. In an experiment conducted by Sommerburg, Langhans,31 it was found that the carotenoid cleaved into products
Fig. 1: Response surface plots of vitamin C as influenced by levels of (a) NaClO and H2O2 (b) NaClO and soaking time (c) H2O2 and soaking time for bitter melon slices
(a) (b)
(c)

80MAHATO et al., Curr. Agri. Res., Vol. 7(1) 74-89 (2019)
after oxidation mediated by hypochlorous acid in presence of sodium hypochlorite (HOCl/-OCl). HOCl/-OCl interacts with more lipophilic constituents i.e. carotenoids and is able to destroy it.32 Similarly, the oxidative stress on carotenoid is induced by H2O2 which is the reason behind the decrease in carotenoid content. This is in accordance with the findings of Martano.33 Müller34 also observed a significant decrease in both α and β carotene levels in carrot by increasing the concentration of NaClO from 20 ppm to 200 ppm. Similarly, Martín‐Diana, Rico35 reported that when fresh-cut carrots were treated with 150 ppm of NaClO (pH 9.3) for 5 min, a carotenoid loss of 30% was obtained. However, a positive interaction effect between NaClO & H2O2
was observed. The regression equation for the response carotenoid is reported as:
Carotenoid = +87.80464 - 5.70171E - 003 × A + 0.49744 × B + 0.080589 × C + 5.78947E - 004 × AB - 1.02775E - 004 × AC - 2.18182E - 003 × BC - 5.99585E - 003 × A2 - 0.12300 × B2 - 9.48059E - 004 × C2
Effect of Pre-Treatment on DPPH Inhibition ActivityThe selected variable conditions had a positive effect (Figure 3) on the DPPH inhibition activity of the minimally processed bitter melon. This is supported by the findings of Ribeiro, Valentão36 and
Fig. 2: Response surface plots of carotenoid as influenced by levels of (a) NaClO and H2O2 (b) NaClO and soaking time (c) H2O2 and soaking time for bitter melon slices
(a) (b)
(c)

81MAHATO et al., Curr. Agri. Res., Vol. 7(1) 74-89 (2019)
Mendoza-Sánchez, Guevara-González.37 The H2O2 reacts with superoxide in the presence of certain transition metal ions give rise to a highly-reactive oxidizing species, i.e. the hydroxyl radical (•OH). This is responsible for influencing the DPPH activity positively. The interaction effect between NaClO & H2O2 had a negative effect while the interaction of the two with soaking time separately had positive effects. The equation below describes the regression for the DPPH inhibition activity.
DPPH Inhibition Activity = 61.43945 + 0.020863 × A + 2.19398 × B + 0.20286 × C - 1.36579E003 × AB + 7.75120E - 006 × AC + 3.44318E - 003 × BC - 4.20255E - 005 × A2 - 0.36547 × B2 - 1.60411E - 003 × C2
Effect of Pre-Treatment on ABTS Inhibition ActivityThe selected variable conditions had a positive effect (Figure 4) on the ABTS inhibition activity of the minimally processed bitter melon similar to that on DPPH inhibition activity. This is because antioxidants react with H2O2 and/or with derivate oxidizing species that inhibit the ABTS•+ radical formation which finally leads to overestimation of antioxidant capacity.38 The interaction effect between NaClO & H2O2 showed negative effect while the interaction between NaClO & soaking time and between H2O2 & soaking time had positive effects. The regression equation for the ABTS inhibition activity is:
ABTS Inhibition Activity = +66.50981+ 8.22336E - 003 × A + 3.17341 × B + 0.14174 × C - 2.12632E
(a) (b)
Fig. 3: Response surface plots of DPPH inhibition activity as influenced by levels of (a) NaClO and H2O2 (b) NaClO and soaking time (c) H2O2 and soaking time for bitter melon slices
(c)

82MAHATO et al., Curr. Agri. Res., Vol. 7(1) 74-89 (2019)
-003 × AB + 1.77608E - 004 × AC + 4.25000E - 003 × BC - 3.11494E - 005 × A2 - 0.47240 × B2 - 1.27917E - 003 × C2
Effect of Pre-Treatment on Total Phenolic ContentAll the selected variables viz., NaClO, H2O2 and soaking time had a positive effect (Figure 5) individually on the total phenolic content. This is supported by the findings of Vandekinderen, Van Camp39 who reported an increase in total phenolic content in minimally processed leek when treated with NaClO. The phenolic compounds leach into wash water because of their hydro-solubility. This is prevented by the wash water containing NaClO and H2O2 which could be the reason behind the increase in total phenolic content. The interaction effect between NaClO and H2O2 had a negative effect while the interaction of these two variables with soaking
time had positive effects. The regression equation for the Total Phenolic Content is as follows:
Total Phenolic Content = + 5.17290 + 8.62333E - 004 × A + 0.26719 × B + 0.016247 × C - 7.89474E - 005 × AB + 1.43541E - 005 × AC + 3.40909E - 004 × BC - 3.52113E - 006 × A2 - 0.036395 × B2 - 41628E - 004 × C2
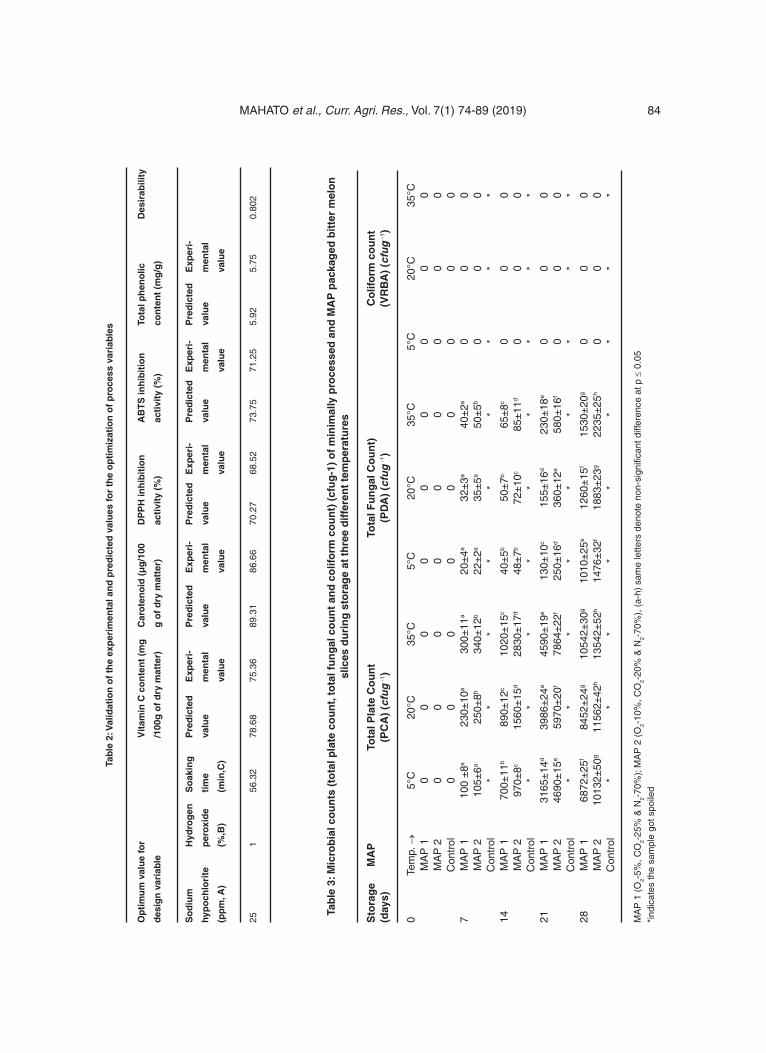
Validation of the Predicted ModelThe suitability of the model for the responses was determined at the optimum conditions of NaClO (25 ppm), H2O2 (1 %) and soaking time (56.32 min). The predicted values for vitamin C content, Carotenoid, DPPH inhibition activity, ABTS inhibition activity and total phenolic content and the experimental data obtained for these responses are shown in Table 2. The experimental values for the responses were
Fig. 4: Response surface plots of ABTS inhibition activity as influenced by levels of (a) NaClO and H2O2 (b) NaClO and soaking time (c) H2O2 and soaking time for bitter melon slices
(a) (b)
(c)

83MAHATO et al., Curr. Agri. Res., Vol. 7(1) 74-89 (2019)
Microbial Growth in MAP of Minimally Processed Bitter MelonThe combined effects of sanitizers (NaClO & H2O2), MAP and temperature (5 °C, 20 °C & 35 °C) on total plate count, total fungal count and coliform count were evaluated (Table 3) in bitter melon for its shelf-life study. The sample in LDPE pouch at atmospheric condition was taken as control. The control sample was spoiled after 4 days at 5 °C and 1 day at 20 °C & 35 °C, therefore, no analysis was done with control after spoilage. There was no coliform growth reported during 28 days of storage, however, bacterial and fungal growth were higher in MAP 2 compared to MAP 1 at higher temperature. An earlier study with the test solutions of NaClO & H2O2 in combination with modified atmosphere technology were effective in inhibiting the growth of the microorganisms. It
Fig. 5: Response surface of total phenolic content as influenced by levels of (a) NaClO and H2O2
(b) NaClO and soaking time (c) H2O2 and soaking time for bitter melon slices
(a) (b)
(c)
was reported by Pereira, Kothe40 that no coliforms growth detected at 45 °C in the minimally processed radicchio (Cichorium intybus L.) samples sanitized with NaClO solution (150 ppm) and H2O2 solution (4 %). The combined effects of NaClO and H2O2 on the elimination of A. hydrophila adhered to polythene under static and dynamic conditions have also been evaluated.13 This supports our findings where no coliforms were detected till the 28th day of storage at either temperature. The total plate count and total fungal count significantly increased with the increase in temperature of storage as well as with the concentration of oxygen from 5 to 10% and carbon dioxide from 20 to 25% in MAP 2 compared to MAP 1. It was also observed that the MAP 1 stored at 5 °C showed lesser fungal and total count as compared to that MAP 2 stored at higher temperatures. These
84MAHATO et al., Curr. Agri. Res., Vol. 7(1) 74-89 (2019)
Tab
le 3
: Mic
rob
ial c
ou
nts
(to
tal p
late
co
un
t, to
tal f
un
gal
co
un
t an
d c
olif
orm
co
un
t) (
cfu
g-1
) o
f m
inim
ally
pro
cess
ed a
nd
MA
P p
acka
ged
bit
ter
mel
on
sl
ices
du
rin
g s
tora
ge
at t
hre
e d
iffe
ren
t te
mp
erat
ure
s
Sto
rag
e M
AP
Tota
l Pla
te C
ou
nt
Tota
l Fu
ng
al C
ou
nt)
C
olif
orm
co
un
t(d
ays)
(P
CA
) (c
fug
-1)
(PD
A)
(cfu
g -1
)
(V
RB
A)
(cfu
g -1
)
0
Tem
p. →
5°
C
20°C
35
°C
5°C
20
°C
35°C
5°
C
20°C
35
°C
MA
P 1
0
0 0
0 0
0 0
0 0
M
AP
2
0 0
0 0
0 0
0 0
0
Con
trol
0
0 0
0 0
0 0
0 0
7
MA
P 1
10
0 ±
8a 23
0±10
a 30
0±11
a 20
±4a
32±
3a 40
±2a
0 0
0
MA
P 2
10
5±6a
250±
8b 34
0±12
b 22
±2a
35±
5a 50
±5b
0 0
0
Con
trol
*
* *
* *
* *
* *
14
MA
P 1
70
0±11
b 89
0±12
c 10
20±
15c
40±
5b 50
±7b
65±
8c 0
0 0
M
AP
2
970±
8c 15
60±
15d
2830
±17
d 48
±7b
72±
10c
85±
11d
0 0
0
Con
trol
*
* *
* *
* *
* *
21
MA
P 1
31
65±
14d
3986
±24
e 45
90±
19e
130±
10c
155±
16d
230±
18e
0 0
0
MA
P 2
46
90±
15e
5970
±20
f 78
64±
22f
250±
16d
360±
12e
580±
16f
0 0
0
Con
trol
*
* *
* *
* *
* *
28
MA
P 1
68
72±
25f
8452
±24
g 10
542±
30g
1010
±25
e 12
60±
15f
1530
±20
g 0
0 0
M
AP
2
1013
2±50
g 11
562±
42h
1354
2±52
h 14
76±
32f
1883
±23
g 22
35±
25h
0 0
0
Con
trol
*
* *
* *
* *
* *
MA
P 1
(O
2-5%
, CO
2-25
% &
N2-
70%
); M
AP
2 (
O2-
10%
, CO
2-20
% &
N2-
70%
), (
a-h)
sam
e le
tters
den
ote
non-
sign
ifica
nt d
iffer
ence
at p
≤ 0
.05
*ind
icat
es th
e sa
mpl
e go
t spo
iled
Tab
le 2
: Val
idat
ion
of
the
exp
erim
enta
l an
d p
red
icte
d v
alu
es fo
r th
e o
pti
miz
atio
n o
f p
roce
ss v
aria
ble
s
Op
tim
um
val
ue
for
V
itam
in C
co
nte
nt
(mg
C
aro
ten
oid
(μ
g/1
00
DP
PH
inh
ibit
ion
A
BT
S in
hib
itio
n
Tota
l ph
eno
lic
Des
irab
ility
des
ign
var
iab
le
/100
g o
f d
ry m
atte
r)
g o
f d
ry m
atte
r)
acti
vity
(%
) ac
tivi
ty (
%)
con
ten
t (m
g/g
)
So
diu
m
Hyd
rog
en
So
akin
g
Pre
dic
ted
E
xper
i-
Pre
dic
ted
E
xper
i-
Pre
dic
ted
E
xper
i-
Pre
dic
ted
E
xper
i-
Pre
dic
ted
E
xper
i-
hyp
och
lori
te
per
oxid
e
tim
e va
lue
men
tal
valu
e m
enta
l va
lue
men
tal
valu
e m
enta
l va
lue
men
tal
(pp
m, A
) (%
,B)
(min
,C)
va
lue
va
lue
va
lue
va
lue
va
lue
25
1 56
.32
78.6
8 75
.36
89.3
1 86
.66
70.2
7 68
.52
73.7
5 71
.25
5.92
5.
75
0.80
2

85MAHATO et al., Curr. Agri. Res., Vol. 7(1) 74-89 (2019)Ta
ble
4: C
olo
ur
and
tex
tura
l ch
ang
es in
min
imal
ly p
roce
ssed
an
d M
AP
pac
kag
ed b
itte
r m
elo
n
slic
es d
uri
ng
sto
rag
e at
th
ree
dif
fere
nt
tem
per
atu
res
Sto
rag
e M
AP
C
olo
ur
Text
ure
(h
ard
nes
s, N
)(d
ays)
L
*
a*
b
*
Te
mp.
→
5°C
20
°C
35°C
5°
C
20°C
35
°C
5°C
20
°C
35°C
5°
C
20°C
35
°C0
MA
P 1
79
79
79
-2
.41
-2.4
1 -2
.41
30.1
4 30
.14
30.1
4 35
.68
35.6
8 35
.68
±0.
58a
±0.
58a
±0.
58a
±0.
14a
±0.
14a
±0.
14a
±0.
21a
±0.
21a
±0.
21a
±1.
08a
±1.
08a
±1.
08a
M
AP
2
79
79
79
-2.4
1 -2
.41
-2.4
1 30
.14
30.1
4 30
.14
35.6
8 35
.68
35.6
8
±
0.58
a ±
0.58
a ±
0.58
a ±
0.14
a ±
0.14
a ±
0.14
a ±
0.21
a ±
0.21
a ±
0.21
a ±
1.08
a ±
1.08
a ±
1.08
a
C
ontr
ol
79
79
79
-2.4
1 -2
.41
-2.4
1 30
.14
30.1
4 30
.14
35.6
8 35
.68
35.6
8
±
0.58
a ±
0.58
a ±
0.58
a ±
0.14
a ±
0.14
a ±
0.14
a ±
0.21
a ±
0.21
a ±
0.21
a ±
1.08
a ±
1.08
a ±
1.08
a
7 M
AP
1
78.9
7 78
.45
76.5
5 -2
.27
-2.1
9 -1
.84
34.2
9 35
.5
36.7
7 33
.28
32.0
1 31
.78
±0.
11b
±0.
21b
±0.
19b
±0.
07b
±0.
05b
±0.
15b
±0.
44b
±0.
28b
±0.
21b
±0.
46b
±0.
05b
±0.
11b
M
AP
2
78.4
5 76
.06
74.8
2 -2
.13
-2.0
7 -1
.28
34.8
4 35
.94
37.1
6 32
.29
32.0
6 31
.02
±0.
19c
±0.
71c
±0.
13c
±0.
09b
±0.
05c
±0.
05c
±0.
06c
±0.
06c
±0.
05c
±0.
19c
±0.
23b
±0.
30c
C
ontr
ol
* *
* *
* *
* *
* *
* *
14
MA
P 1
74
.45
70.6
7 68
.71
-1.2
6 -1
.12
-0.6
1 37
.55
40.2
5 42
.24
31.1
6 28
.86
27.7
8
±
0.11
d ±
0.09
d ±
0.20
d ±
0.07
c ±
0.09
d ±
0.06
d ±
0.11
d ±
0.03
d ±
0.15
d ±
0.81
d ±
0.17
c ±
0.14
d
M
AP
2
74.0
9 70
.16
68.0
8 -1
.29
-1.0
5 -0
.48
37.9
2 40
.92
43
30.6
9 28
.26
26.8
1
±
0.13
e ±
0.07
e ±
0.55
e ±
0.07
c ±
0.05
d ±
0.02
e ±
0.03
e ±
0.04
e ±
0.11
e ±
0.34
e ±
0.18
d ±
0.12
e
C
ontr
ol
* *
* *
* *
* *
* *
* *
21
MA
P 1
65
.63
60.4
5 58
.86
1.56
1.
91
2.49
42
.59
46.7
50
.49
28.7
3 24
.29
22.2
1
±
0.17
f ±
0.19
f ±
0.02
f ±
0.02
d ±
0.06
e ±
0.05
f ±
0.04
f ±
0.05
f ±
0.05
f ±
0.35
f ±
0.35
e ±
0.43
f
M
AP
2
64.2
60
.46
58.1
9 1.
92
2.26
2.
74
43.5
7 47
.44
50.9
28
.23
23.9
6 21
.24
±0.
07g
±0.
02g
±0.
06g
±0.
04e
±0.
06f
±0.
06g
±0.
09g
±0.
12g
±0.
09g
±0.
57f
±0.
33f
±0.
34g
C
ontr
ol
* *
* *
* *
* *
* *
* *
28
MA
P 1
58
.57
55.7
5 52
.66
2.47
2.
95
3.2
45.7
8 50
.37
55.7
6 25
.38
20.4
2 18
.4
±
0.09
h ±
0.03
h ±
0.02
h ±
0.02
f ±
0.07
g ±
0.07
h ±
0.01
h ±
0.12
h ±
0.11
h ±
0.48
g ±
0.27
g ±
0.45
h
M
AP
2
57.6
6 54
.44
52.4
9 2.
94
2.98
3.
58
46.2
9 50
.67
56.4
1 22
.44
15.4
8 11
.93
±0.
10i
±0.
21i
±0.
05i
±0.
05g
±0.
03g
±0.
04i
±0.
06i
±0.
12i
±0.
07i
±0.
30h
±0.
26h
±0.
67i
C
ontr
ol
* *
* *
* *
* *
* *
* *
MA
P 1
(O
2-5%
, CO
2-25
% &
N2-
70%
); M
AP
2 (
O2-
10%
, CO
2-20
% &
N2-
70%
), (
a-i)
sam
e le
tters
den
ote
non-
sign
ifica
nt d
iffer
ence
at p
≤ 0
.05
*ind
icat
es th
e sa
mpl
e go
t spo
iled

86MAHATO et al., Curr. Agri. Res., Vol. 7(1) 74-89 (2019)
found to be significant with the predicted values at the 5 % level of significance.
Microbial Growth in MAP of Minimally Processed Bitter MelonThe combined effects of sanitizers (NaClO & H2O2), MAP and temperature (5 °C, 20 °C & 35 °C) on total plate count, total fungal count and coliform count were evaluated (Table 3) in bitter melon for its shelf-life study. The sample in LDPE pouch at atmospheric condition was taken as control. The control sample was spoiled after 4 days at 5 °C and 1 day at 20 °C & 35 °C, therefore, no analysis was done with control after spoilage. There was no coliform growth reported during 28 days of storage, however, bacterial and fungal growth were higher in MAP 2 compared to MAP 1 at higher temperature. An earlier study with the test solutions of NaClO & H2O2 in combination with modified atmosphere technology were effective in inhibiting the growth of the microorganisms. It was reported by Pereira, Kothe40 that no coliforms growth detected at 45 °C in the minimally processed radicchio (Cichorium intybus L.) samples sanitized with NaClO solution (150 ppm) and H2O2 solution (4 %). The combined effects of NaClO and H2O2 on the elimination of A. hydrophila adhered to polythene under static and dynamic conditions have also been evaluated.13 This supports our findings where no coliforms were detected till the 28th day of storage at either temperature. The total plate count and total fungal count significantly increased with the increase in temperature of storage as well as with the concentration of oxygen from 5 to 10% and carbon dioxide from 20 to 25% in MAP 2 compared to MAP 1. It was also observed that the MAP 1 stored at 5 °C showed lesser fungal and total count as compared to that MAP 2 stored at higher temperatures. These observations are supported by the earlier findings on bitter melon.41-43
Colour and Textural Changes in MAP of Minimally Processed Bitter MelonThe colour and textural changes were observed over the storage period in MAP of minimally processed bitter melon (Table 4). The lightness of the product in MAP 2 decreased more compared to Map 1 with the increasing number of days as well as
with the increase in storage temperature. Further, the values for greenness shifted towards redness more rapidly in MAP 2 and the changes were more significant at higher temperature. Similar trend was observed for yellowness of the samples over storage. Furthermore, the texture (hardness) of the sample was seen to decrease faster at higher temperature in MAP 2 as in against MAP 1. These findings are supported by the earlier research on fresh-cut bitter melon packaged in active MAP in LDPE and their physico-chemical changes over the storage period.44
ConclusionThis study revealed that the wash water solution of sodium hypochlorite (25 ppm), hydrogen peroxide (1%) and soaking time (56.32 min) was relatively optimum in maintaining the functional properties: vitamin C, carotenoid content, antioxidant activity (DPPH & ABTS) and total phenolic content without significantly affecting the proximate composition of the bitter melon. The use of modified atmosphere packaging (MAP) with the gas composition of MAP 1 (5% O2, 25% CO2 & 70% N2) combined with cooling at 5 °C was sufficient to prolong the shelf-life of minimally processed bitter melon for up to 28 days of storage. The low oxygen concentration along with low temperature was effective in reducing the growth of the microorganisms. It has been possible to extend the shelf life of minimally processed bitter melon by 28 days in combination of hurdles and MAP. The result is of significant interest due to low cost and easy availability of the commodity and chemicals which can link the agricultural sector to a more prosperous and sustainable industrial application.
FundingNo funding was received for the study.
AcknowledgmentsThe authors are thankful to the Centre of Food Science and Technology, Banaras Hindu University, India, for the use of their equipment and their valuable support.
Conflict of Interest The authors declare no conflict of interest.

87MAHATO et al., Curr. Agri. Res., Vol. 7(1) 74-89 (2019)
1. Foy’s Lake B. Nutrient and phytochemical analysis of four varieties of bitter gourd (Momordica charantia) grown in chittagong hill tracts, Bangladesh. Asian Journal of Agricultural Research. 2011;5(3):186-198.
2. Lee S.Y., & Baek S.Y. Effect of chemical sanitizer combined with modified atmosphere packaging on inhibiting Escherichia coli O157: H7 in commercial spinach. Food Microbiology. 2008;25(4):582-587.
3. Andrade N.J.D. & Pinto C.L.D.O. Higienização na indústria de alimentos e segurança alimentar. BASTOS, MSR Ferramentas da Ciência e Tecnologia para a Segurança dos Alimentos. 1ªed, Fortaleza: Embrapa Agroindustria Tropical, 2008.
4. Allende A., Selma M.V., López-Gálvez F., Villaescusa R. & Gil M.I. Role of commercial sanitizers and washing systems on epiphytic microorganisms and sensory quality of fresh-cut escarole and lettuce. Postharvest Biology and Technology. 2008;49(1):155-163.
5. Foley D.M., Dufour A., Rodriguez L., Caporaso F. & Prakash A. Reduction of Escherichia coli 0157: H7 in shredded iceberg lettuce by chlorination and gamma irradiation. Radiation Physics and Chemistry. 2002;63(3-6):391-396.
6. Gleeso, E., & O’Beirne D. Effects of process severity on survival and growth of Escherichia coli and Listeria innocua on minimally processed vegetables. Food Control, 2005;16(8):677-685.
7. Rodgers S.L., Cash J.N., Siddiq M. & Ryser E.T.A comparison of different chemical sanitizers for inactivating Escherichia coli O157: H7 and Listeria monocytogenes in solution and on apples, lettuce, strawberries, and cantaloupe. Journal of food protection. 2004;67(4):721-731.
8. De Roever C. Microbiological safety evaluations and recommendations on fresh produce. Food control. 1998;9(6):321-347.
9. Daş E., Gürakan G.C. & Bayındırlı A. Effect of controlled atmosphere storage, modified atmosphere packaging and gaseous ozone treatment on the survival of Salmonella
Enterit idis on cherry tomatoes. Food Microbiology. 2006;23(5):430-438.
10. Mani-López E., Palou E., & López-Malo A. Effect of different sanitizers on the microbial load and selected quality parameters of “chile de árbol” pepper (Capsicum frutescens L.) fruit. Postharvest Biology and Technology. 2016;119:94-100.
11. de São José J.F.B. & Vanetti M.C.D. Application of ultrasound and chemical sanitizers to watercress, parsley and strawberry: Microbiological and physicochemical quality. LWT-Food Science and Technology. 2015;63(2):946-952.
12. Meireles A., Fulgŕncio R., Machado I., Mergu lhŃo F. , Me lo L . & S im M. Characterization of the heterotrophic bacteria from a minimally processed vegetables plant. LWT-Food Science and Technology. 2017;85:293-300.
13. Djimeli C.L., Tamsa Arfao A., Ewoti N., Olive V., Nougang M.E., Moungang M.L. & Sime-Ngando T. Mixture of Sodium Hypochlorite and Hydrogen Peroxide on Adhered Aeromonas hydrophila to Solid Substrate in Water: Impact of Concentration and Assessment of the Synergistic Effect. International Journal of Bacteriology. 2014; p.121367.
14. AOAC, Association of Official Analytical Chemists. Official methods of analysis of the Association of Official Analytical Chemists. Vol. 1. 1990.
15. Ranganna S. Handbook of analysis and quality control for fruit and vegetable products. 1986: Tata McGraw-Hill Education.
16. de Carvalho L.M.J., Gomes P. B., de Oliveira Godoy R.L., Pacheco S., do Monte P.H.F., de Carvalho J.L.V. & Ramos S.R.R. Total carotenoid content, α-carotene and β-carotene, of landrace pumpkins (Cucurbita moschata Duch): A preliminary study. Food Research International. 2012;47(2):337-340.
17. Apak R., Gorinstein S., Böhm V., Schaich K.M., Özyürek M., & Güçlü K. Methods of measurement and evaluation of natural antioxidant capacity/activity (IUPAC Technical Report). Pure and Applied Chemistry.
References

88MAHATO et al., Curr. Agri. Res., Vol. 7(1) 74-89 (2019)
2013;85(5):957-998.18. Shalaby E.A. & Shanab S.M. Comparison
of DPPH and ABTS assays for determining antioxidant potential of water and methanol extracts of Spirulina platensis. 2013.
19. Ainsworth E.A. & Gillespie K.M. Estimation of total phenolic content and other oxidation substrates in plant tissues using Folin–Ciocalteu reagent. Nature protocols , 2007;2(4):875.
20. AOAC, Association of Official Analytical Chemists. Methods of analysis, 17th Ed. Association of official analytical chemistry Washington, USA. 2000.
21. Kraithong S., Lee S. & Rawdkuen S. Physicochemical and functional properties of Thai organic rice flour. Journal of Cereal Science. 2018;79:259-266.
22. Park J.K., Kim S.S. & Kim K.O. Effect of milling ratio on sensory properties of cooked rice and on physicochemical properties of milled and cooked rice. Cereal chemistry. 2001;78(2):151-156.
23. Donya A., Hettiarachchy N., Liyanage R., Lay J., Chen P. & Jalaluddin M. Effects of processing methods on the proximate composit ion and momordicosides K and L content of bitter melon vegetable. Journal of agricultural and food chemistry. 2007;55(14):5827-5833.
24. Bangash J.A., Arif M., Khan M. A., Khan F. & Hussain I. Proximate composition, minerals and vitamins content of selected vegetables grown in Peshawar. Journal of the Chemical Society of Pakistan. 2011;33(1):118-122.
25. Sapers G.M., Miller R.L., Choi S.W. & Cooke P.H. Structure and composition of mushrooms as affected by hydrogen peroxide wash. Journal of Food Science. 1999;64(5): 889-892.
26. Carnelio S., Khan S.A. & Rodrigues G. Definite, probable or dubious: antioxidants trilogy in clinical dentistry. British dental journal. 2008;204(1): 29.
27. Weston C.H., Ito S., Wadgaonkar B., & Pashley D. H. Effects of time and concentration of sodium ascorbate on reversal of NaOCl-induced reduction in bond strengths. Journal of Endodontics. 2007;33(7): 879-881.
28. D’Aquino S., Suming D., Deng Z., Gentile A.,
Angioni A., De Pau L. & Palma A. A sequential treatment with sodium hypochlorite and a reduced dose of imazalil heated at 50° C effectively control decay of individually film-wrapped lemons stored at 20° C. Postharvest Biology and Technology. 2017;124:75-84.
29. López-Gálvez F., Allende A., Truchado P., Martínez-Sánchez A., Tudela J.A., Selma M.V. & Gil M.I. Suitability of aqueous chlorine dioxide versus sodium hypochlorite as an effective sanitizer for preserving quality of fresh-cut lettuce while avoiding by-product formation. Postharvest Biology and Technology. 2010;55(1):53-60.
30. Tirawat D., Kunimoto H., Noma S., Igura N. & Shimoda M. Comparison of Decontamination Efficacy between the Rapid Hygrothermal Pasteurization and Sodium Hypochlorite Treatments. Food and Nutrition Sciences. 2013;4(06): 636.
31. Sommerburg O., Langhans C.D., Arnhold J., Leichsenring M., Salerno C., Crifò C., Hoffmann G.F., Debatin K. M. & Siems W. G. β-Carotene cleavage products after oxidation mediated by hypochlorous acid—a model for neutrophil-derived degradation. Free Radical Biology and Medicine. 2003;35(11):1480-1490.
32. Panasenko O., Panasenko O.O., Briviba K., & Sies H. Hypochlorite destroys carotenoids in low density lipoproteins thus decreasing their resistance to peroxidative modification. Biochemistry-New York-English Translation of Biokhimiya. 1997;62(10):1140-1145.
33. Martano G., Vogl C., Bojaxhi E., Bresgen N., Eckl P. & Stutz H. Solid-phase extraction and GC-MS analysis of potentially genotoxic cleavage products of β-carotene in primary cell cultures. Analytical and bioanalytical chemistry. 2011;400(8):2415-2426.
34. Müller H. Determination of the carotenoid content in selected vegetables and fruit by HPLC and photodiode array detection. Zeitschrift für Lebensmitteluntersuchung und-Forschung A. 1997;204(2):88-94.
35. Martín‐Diana A.B., Rico D., Barry‐Ryan C., Frías J.M., Mulcahy J. & Henehan G.T. Comparison of calcium lactate with chlorine as a washing treatment for fresh‐cut lettuce and carrots: quality and nutritional

89MAHATO et al., Curr. Agri. Res., Vol. 7(1) 74-89 (2019)
parameters. Journal of the Science of Food and Agriculture. 2005;85(13):2260-2268.
36. Ribeiro B., Valentão P., Baptista P., Seabra R.M. & Andrade P.B. Phenolic compounds, organic acids profiles and antioxidative properties of beefsteak fungus (Fistulina hepatica). Food and Chemical Toxicology. 2007;45(10):1805-1813.
37. Mendoza-Sánchez M., Guevara-González R.G., Castaño-Tostado E., Mercado-Silva E.M., Acosta-Gallegos J.A., Rocha-Guzmán N.E. & Reynoso-Camacho R. Effect of chemical stress on germination of cv Dalia bean (Phaseolus vularis L.) as an alternative to increase antioxidant and nutraceutical compounds in sprouts. Food chemistry. 2016;212:128-137.
38. Strljbe M., Haenen G.R., Van Den Berg H. & Bast A. Pitfalls in a method for assessment of total antioxidant capacity. Free Radical Research. 1997;26(6):515-521.
39. Vandekinderen I., Van Camp J., Devlieghere F., Ragaert P., Veramme K., Bernaert N., Denon Q. & De Meulenaer B. Evaluation of the use of decontamination agents during fresh-cut leek processing and quantification of their effect on its total quality by means of a multidisciplinary approach. Innovative
food science & emerging technologies. 2009;10(3): 363-373.
40. Pereira G.d.M., Kothe C.I., Machado C.C., Lopes S.M., Flôres S.H., & Rios A.D.O. Effect of modified atmosphere applied to minimally processed radicchio (Cichorium intybus L.) submitted to different sanitizing treatments. Food Science and Technology. 2014;34(3):513-521.
41. Mohammed M. & Wicham L.D. Extension of bitter gourd (Momordica charantia L.) storage life through the use of reduced temperature and polyethylene wraps. Journal of food quality. 1993;16(5):371-382.
42. Zong R.J., Morris L. & Cantwell M. Postharvest physiology and quality of bitter melon (Momordica charantia L.). Postharvest Biology and Technology. 1995;6(1-2):65-72.
43. Wang L., Li Q., Cao J., Cai T. & Jiang W. Keeping quality of fresh‐cut bitter gourd (Momordica charantia L.) at low temperature of storage. Journal of food processing and preservation. 2007;31(5):571-582.
44. Preetha, P., Varadharaju, N., & Vennila, P. Enhancing the shelf life of fresh-cut bitter gourd using modified atmospheric packaging. African Journal of Agricultural Research, 2015; 10(17):1943-1951.