Embed Size (px)
Citation preview
polymers
Article
On the Effects of Process Parameters andOptimization of Interlaminate Bond Strengthin 3D Printed ABS/CF-PLA Composite
Syed Waqar Ahmed 1 , Ghulam Hussain 2,*, Khurram Altaf 1 , Sadaqat Ali 3,Mohammed Alkahtani 4,5 , Mustufa Haider Abidi 5 and Ayoub Alzabidi 4
1 Department of Mechanical Engineering, Universiti Teknologi PETRONAS,Perak Darul Ridzuan 32610, Malaysia; [email protected] (S.W.A.);[email protected] (K.A.)
2 Faculty of Mechanical Engineering, Ghulam Ishaq Khan Institute of Engineering Sciences and Technology,Topi 23640, Pakistan
3 Department of Mechanical Engineering, National University of Sciences and Technology,Islamabad 44000, Pakistan; [email protected]
4 Industrial Engineering Department, College of Engineering, King Saud University,Riyadh 11421, Saudi Arabia; [email protected] (M.A.); [email protected] (A.A.)
5 Advanced Manufacturing Institute, King Saud University, Riyadh 11421, Saudi Arabia; [email protected]* Correspondence: [email protected]
Received: 14 August 2020; Accepted: 18 September 2020; Published: 22 September 2020�����������������
Abstract: The scope of additive manufacturing, particularly fused deposition modelling (FDM),can indeed be explored with the fabrication of multi-material composite laminates using thistechnology. Laminar composite structures made up of two distinct materials, namely acrylonitrilebutadiene styrene (ABS) and carbon fiber reinforced polylactic acid (CF-PLA), were producedusing the FDM process. The current study analyzes the effect of various printing parameterson the interfacial bond strength (IFBS) of the ABS/CF-PLA laminar composite by employingresponse surface methodology. The physical examination of the tested specimens revealed twofailure modes, where failure mode 1 possessed high IFBS owing to the phenomenon of materialpatch transfer. Contrarily, failure mode 2 yielded low IFBS, while no patch transfer was observed.The analysis of variance (ANOVA) revealed that printing parameters were highly interactive in nature.After extensive experimentation, it was revealed that good quality of IFBS is attributed to the mediumrange of printing speed, high infill density, and low layer height. At the same time, a maximum IFBSof 20.5 MPa was achieved. The study presented an empirical relation between printing parametersand IFBS that can help in forecasting IFBS at any given printing parameters. Finally, the optimizedprinting conditions were also determined with the aim to maximize IFBS.
Keywords: additive manufacturing; 3D printing; interlaminate bonding; interfacial bond strength;laminates; composite; fused deposition modelling; optimization
1. Introduction
Additive manufacturing (AM) techniques carry a substantial role in today’s industrial andtechnological arena. AM offers the flexibility of producing complex geometries while consumingminimal operational time. AM technology has been adopted by a very wide range of fields such asaerospace, automobile, manufacturing, designing, tissue, and biomedical engineering industries [1–6].Fused deposition modelling (FDM) is one of the most widely used AM technologies owing to itsoperational flexibility and low cost [7]. FDM creates three-dimensional objects by laying up successive
Polymers 2020, 12, 2155; doi:10.3390/polym12092155 www.mdpi.com/journal/polymers

Polymers 2020, 12, 2155 2 of 16
layers of thermoplastic material upon one another. Thermoplastic filament, acting as feedstock material,is pulled through rollers and inserted into the heated extruder. The heated extruder then meltsand extrudes the material via an extrusion nozzle onto the pre-heated bed, while following thecoordinates already provided by the software to move into the x–y plane accordingly. Subsequently, theextruder moves up into the z-plane to build the next layer until a three-dimensional object is obtained.While depositing these sequential layers, the molten layers of extruded material called the laminaform a bond among the adjacent layers. Likewise, laminates comprising of dissimilar thermoplasticpolymers can also be produced using the FDM technique.
The operational flexibility of FDM technology makes it relatively suitable to producenon-conventional laminates as well. The advancements in FDM technology have stimulated its role fromjust prototyping to a process becoming capable of producing finished products. However, standalonepolymer parts produced from FDM technology are mainly used as just prototypes, as they lack strengthand durability [8–12]. The mechanical properties of parts produced from FDM have been improved byeither introducing reinforced materials into the base filament or by optimizing the printing processparameters. Besides reinforcements, mechanical properties have also been improved with optimizedslicing parameters, infill density, and application of appropriate support materials [13–15]. Moreover,the mechanical properties of FDM produced parts have also been improved by simultaneously usingreinforced filament materials and optimizing the printing process parameters as well. Therefore,by utilizing the 3D printing technique, hybrid composite laminates were produced that have shownbetter mechanical properties [16,17]. To produce mechanically improved multi-material polymerlaminates from FDM technology, the interfacial bond strength (IFBS) and limitations of the printedmaterials must be studied.
In recent years, very limited studies have been reported that address the mechanical behaviourof additively manufactured laminar composite structures. Zhang used FDM to print and compareIFBS among pristine and reinforced polymers. It was observed that printing orientations and printingparameters coupled with the material composition control the IFBS of the printed samples. As aresult, the printing speed of 60 mm/s and layer thickness of 0.18 mm yield the highest shear strengths,which indicate relatively strong IFBS. Moreover, among these composite materials, carbon nanotubesreinforced acrylonitrile butadiene styrene (CNT-ABS) samples printed at 0◦ orientation possessed aminimum degree of porosity [18]. Singh used the FDM process to 3D print multi-material recycledcomposite using ABS, polylactic acid (PLA), and high impact polystyrene (HIPA). The tensile testsconcluded that the multi-material composite offered better mechanical properties, while varying thelaminar sequence of material could induce customization as well [19]. Li compared the interlaminarbonding strength (ILBS) for ABS and polyamide-12 (PA12). The study reported that, in the case ofABS material, the extrusion nozzle temperature did not affect the ultimate tensile strength (UTS).Conversely, for PA12, the extrusion temperature in combination with melt flow viscosity played animportant role in achieving better ILBS. It was noted that UTS increased directly with an increase inextrusion temperature up to 250 ◦C [20]. Patrick studied the interlayer performance of short carbon-fibrereinforced polyamide. The study introduced the infrared preheating system (IPS) to enhance theinterlayer tensile strength of the specimen produced through the extrusion process. It was observedthat interlayer tensile strength could be characteristic to the interlayer bonding strength [21].
Aliheidari studied the relationship between printing parameters, interlayer structures such asvoids, and fracture resistance of FDM parts. It was found that, apart from meso-structural features,printing parameters like extrusion temperature and layer height have a significant effect on fracturebehaviour [22]. Kevin Hart printed ABS samples in different orientations to study the relationshipbetween interlaminar fracture properties and lamina orientation angles. It was observed that the energyrequired for crack propagation across lamina was almost an order of magnitude greater than the energyrequired for crack propagation along lamina. Therefore, laminar orientation is an important parameterfor customization and designing tailored failure behaviours [23]. Islam used FDM technology tointroduce reinforcements at an interlaminar level to improve the inter-laminar shear strength of multi

Polymers 2020, 12, 2155 3 of 16
directional polymer laminates. A significant improvement of 28% in inter-laminar shear strength wasobserved. Consequently, it helped in minimizing the delamination in multi-directional laminates [24].Yin studied the effect of printing process parameters on the IFBS of thermoplastic polyurethane(TPU)/ABS bi-material structures. The study concluded that building stage temperature was the mosteffective parameter among the considered parameters. IFBS was increased from 0.86 to 1.66 MPawhen the building stage temperature was adjusted from 30 to 68 ◦C [25]. Tamburrino studied materialprinting order, slicing pattern, and degree of infill density as the considered parameters to measure theadhesion strength of the three different filaments. It was concluded that, apart from thermodynamicdiffusion mechanisms, mechanical interlocking strategies are also effective in increasing IFBS [13].
The above-presented literature demonstrates that the interfacial bonding strength (IFBS) of theFDM parts can be characteristic to the printing parameters. However, these interfacial propertiesare likely to change with material as well. The available literature presents studies regarding theinterlaminar bonding strength of FDM printed parts for mono-material filaments or reinforced polymerfilaments only. Additionally, multi-material hybrid composites offer relatively improved mechanicalproperties and have more applications than mono-material printed parts. The FDM printed hybridlaminar composite comprising of carbon fiber reinforced polylactic acid and ABS (CF-PLA/ABS)has yielded better mechanical performance than standalone CF-PLA or ABS printed parts [16,26].Until now, to the best of the author’s knowledge, no study in the literature presents research on thebonding strength at the interface of the CF-PLA/ABS composite as a function of printing parameters.Therefore, there is a need to systematically study the relationship between printing parameters andbonding strength at the interface of the hybrid composite of CF-PLA and ABS. Moreover, the predictionmodel from the current study can be used to simultaneously predict and customize the IFBS by selectingthe appropriate values for the considered printing parameters. This work is an extension of previouslydone research that has established the capability of FDM technology for producing hybrid compositelaminate parts that bear higher mechanical properties as compared with their parent materials [16].
2. Materials and Methods
In this study, a hybrid laminar composite was printed by employing two materials, namely ABS andCF-PLA, as the parent materials. The ABS filament was supplied by Xplorer3D (UAE), having filamentdensity of 1.07 g/m3, and the recommended extrusion and bed temperature were 220 ◦C and90 ◦C, respectively, as also recommended in the literature [27]. CF-PLA filament was suppliedby MatterHackers (Lake Forest, CA, USA), having 10% carbon fibres by mass. The carbon fibres weresufficiently small enough to easily pass through the extrusion nozzle, and long enough to provideadditional strength to PLA matrix. The extrusion and bed temperature of around 210 ◦C and 80 ◦C,respectively, were maintained during the printing process. The diameters of both filaments were1.75 mm, which were compatible with the extrusion nozzle of the Xplorer3D printer (Xplorer 3D,Dubai, UAE).
The scope of this study covers the effect of four printing parameters, namely, printing speed (S),infill density (ID), layer thickness ratio (LTR), and layer height (LH), on the interfacial bond strength(IFBS) of the hybrid laminar composite produced through the FDM process. Printing speed is attributedas the speed of the nozzle with which it travels over the printing bed during the printing process.Infill density is the total amount of printing material inside the periphery of the printed part, whichis usually measured in percentage. Layer height is the thickness of the layer when the filament isextruded from the printing nozzle. Layer thickness ratio is the composition ratio of two differentmaterials (ABS and CF-PLA) in the single composite sheet as different LTRs constitute a differentpercentage of individual parent materials to form a composite laminate, as illustrated in Figure 1.Therefore, LTR was varied at three different levels of 0.25, 0.63, and 1. Table 1 shows the amount ofindividual parent material in the composite for each level of LTR.

Polymers 2020, 12, 2155 4 of 16
Polymers 2020, 12, x FOR PEER REVIEW 4 of 16
Figure 1. (a) Layer thickness ratio of 1.00; (b) layer thickness ratio of 0.63; (c) layer thickness ratio of 0.25. CF-PLA, carbon fiber reinforced polylactic acid; ABS, acrylonitrile butadiene styrene.
Table 1. Layer thickness ratio vs. material percentage. CF-PLA, carbon fiber reinforced polylactic acid; ABS, acrylonitrile butadiene styrene.
Layer Thickness Ratio Material Percentage by Volume 1.00 50% CF-PLA 50% ABS 0.63 63% CF-PLA 37% ABS 0.25 75% CF-PLA 25% ABS
A statistical approach called the design of experiment was adopted to design the set of experiments for testing as well as to analyze the results. This statistical method requires a relatively fewer number of experiments to explore the effects of various input variables on the target variables or responses. For an investigation of the output variable, interfacial bond strength, in this case, response surface methodology (RSM) was employed in design expert (DX12) software (Stat-Ease, Minneapolis, MN, USA). RSM computes the individual and combined effects with a relatively lower number of experiments and yields good statistical accuracy as well as trends [28,29]. The lower and upper levels of the considered printing parameters were selected according to the preceding research work [16], also given in Table 2. The experimental plan is presented in Table 3, which constitutes 22 experiments having four replicates, while each of the four parameters was varied over three levels.
Table 2. Range of parameters.
Factor Symbol Unit Low Level Mid-Level Upper Level Printing speed S mm/s 20.00 52.50 80.00 Infill density ID % 60.00 80.00 100.00 Layer height LH mm 0.10 0.30 0.50
Layer Thickness ratio LTR - 0.25 0.63 1.00
The test specimens were printed by employing the values of printing parameters for each run, as shown in the experimental plan (Table 3). The printing of specimen was carried out by Xplorer3D, while the nozzle diameter, nozzle temperature, and bed temperature were kept constant at 0.75 mm, 210 °C, and 90 °C, respectively. The printing pattern specifically called the raster angle was kept as the 0/90° pattern, as it offers more strength than the 45/45° printing pattern [30]. The geometry of the specimen to conduct IFBS is a square of 19 mm × 19 mm, having a total thickness of 4 mm. To produce the composite bi-material sample, firstly, ABS material was used to print laminate on the printing bed until the pre-defined thickness was achieved. It was then instantly followed by the printing of CF-PLA filament onto the already printed ABS laminate in a single printing operation, which resulted
Figure 1. (a) Layer thickness ratio of 1.00; (b) layer thickness ratio of 0.63; (c) layer thickness ratio of0.25. CF-PLA, carbon fiber reinforced polylactic acid; ABS, acrylonitrile butadiene styrene.
Table 1. Layer thickness ratio vs. material percentage. CF-PLA, carbon fiber reinforced polylactic acid;ABS, acrylonitrile butadiene styrene.
Layer Thickness Ratio Material Percentage by Volume
1.00 50% CF-PLA 50% ABS0.63 63% CF-PLA 37% ABS0.25 75% CF-PLA 25% ABS
A statistical approach called the design of experiment was adopted to design the set of experimentsfor testing as well as to analyze the results. This statistical method requires a relatively fewer numberof experiments to explore the effects of various input variables on the target variables or responses.For an investigation of the output variable, interfacial bond strength, in this case, response surfacemethodology (RSM) was employed in design expert (DX12) software (Stat-Ease, Minneapolis, MN, USA).RSM computes the individual and combined effects with a relatively lower number of experiments andyields good statistical accuracy as well as trends [28,29]. The lower and upper levels of the consideredprinting parameters were selected according to the preceding research work [16], also given in Table 2.The experimental plan is presented in Table 3, which constitutes 22 experiments having four replicates,while each of the four parameters was varied over three levels.
Table 2. Range of parameters.
Factor Symbol Unit Low Level Mid-Level Upper Level
Printing speed S mm/s 20.00 52.50 80.00Infill density ID % 60.00 80.00 100.00Layer height LH mm 0.10 0.30 0.50
Layer Thickness ratio LTR - 0.25 0.63 1.00
The test specimens were printed by employing the values of printing parameters for each run,as shown in the experimental plan (Table 3). The printing of specimen was carried out by Xplorer3D,while the nozzle diameter, nozzle temperature, and bed temperature were kept constant at 0.75 mm,210 ◦C, and 90 ◦C, respectively. The printing pattern specifically called the raster angle was kept asthe 0/90◦ pattern, as it offers more strength than the 45/45◦ printing pattern [30]. The geometry of thespecimen to conduct IFBS is a square of 19 mm × 19 mm, having a total thickness of 4 mm. To producethe composite bi-material sample, firstly, ABS material was used to print laminate on the printing beduntil the pre-defined thickness was achieved. It was then instantly followed by the printing of CF-PLA

Polymers 2020, 12, 2155 5 of 16
filament onto the already printed ABS laminate in a single printing operation, which resulted in thefusion of two materials at the interface, hence forming an interfacial bond. The transition of printingfilament from ABS to CF-PLA was governed by the combination of layer thickness ratio and layerheight, as given in Table 4.
Table 3. Experimental plan and test results.
SpecimenNo.
PrintingSpeed(mm/s)
InfillDensity
(%)
LayerHeight(mm)
LayerThickness Ratio
No Units
InterfacialBond Strength
(MPa)
FailureMode
S ID LH LTR IFBS 1/2
1 52.5 100 0.5 1 2.5 22 20 60 0.1 0.25 4.2 23 80 100 0.1 0.25 11.4 14 52.5 100 0.3 0.63 6.2 25 52.5 80 0.3 0.25 7.92 16 20 100 0.5 0.25 6 17 20 60 0.5 0.63 8.5 28 80 80 0.3 0.63 7.1 29 52.5 60 0.1 1 2.3 2
10 52.5 60 0.3 0.63 5 211 80 60 0.5 0.25 8.2 112 20 80 0.1 1 20.5 113 80 100 0.1 1 3.1 214 52.5 60 0.1 1 7.9 115 52.5 60 0.5 0.25 6.3 116 80 60 0.5 1 3.4 217 20 100 0.1 0.25 7.9 118 20 60 0.3 1 2.43 119 20 100 0.5 0.25 0.56 220 80 60 0.1 0.25 14.8 121 20 100 0.1 1 4.9 122 20 60 0.3 1 7.4 1
Table 4. Material transition against various printing parameters.
ExperimentNo.
Layer ThicknessRatio Layer Height Total Number
of LayersLayers of
ABSLayers ofCF-PLA
1 1.00 0.50 8.00 4.00 4.002 0.25 0.10 40.00 10.00 30.004 0.63 0.30 14.00 9.00 5.00
3. Results and Discussion
3.1. Interfacial Behavior under Uniaxial Tensile Loading
Tests were conducted to measure IFBS of the specimens using an ultimate tensile machine (UTM)having a capacity of 30 kN load with a constant strain rate of 2 mm/min [13,25]. Table 3 presents theresults for the bond strength of hybrid composite sheets. Epoxy was applied on both sides of thespecimens to adhere them with the testing fixtures to perform tests. Figure 2 represents the samplebeing tested on the UTM machine as well as the post-testing sample. The results of IFBS testing arepresented in Table 3, which shows that the maximum bond strength of 20.5 MPa was achieved forspecimen number 12, while the minimum value of bond strength was recorded to be 0.56 MPa forspecimen number 19. Figure 3 shows the graph of force versus extension for IFBS of the representativespecimens. It indicates two failure modes, which are failure mode 1 and failure mode 2, as also

Polymers 2020, 12, 2155 6 of 16
mentioned in Table 3. In Figure 2, specimen number 3, 7, 11, and 14 represent failure mode 1, whereasspecimen number 4, 7, 8, and 10 represent failure mode 2.Polymers 2020, 12, x FOR PEER REVIEW 6 of 16
Figure 2. (a) Pre-testing sample; (b) post-testing sample.
Figure 3. Force vs. extension graph for representative specimens.
In the first type of failure (failure mode 1), catastrophic failure behaviour is observed during the delamination process. It was statistically observed that failure mode 1 has an average bond strength of 9.63 MPa, whereas theaverage bond strength for failure mode 2 was found to be 4.36 MPa. Therefore, it can be deduced that specimens failing under failure mode 1 have a relatively higher bond strength than specimens failing under failure mode 2. Moreover, visual inspection through an optical microscope of the interfacial surface of tested specimens revealed that failure mode 1 exhibits patch transfer behaviour as well. In patch transfer behaviour, one of the laminae from the two dissimilar materials at the composite interface remains attached to the other one after being subjected to delamination forces at the laminar interface. As evident from Figure 4, laminae of ABS material have remained bonded with CF-PLA at the interface of the ABS/CF-PLA composite even after being subjected to delamination. It refers to a strong inter-laminar bond that occurs at the interface of the composite, which could be a result of favourable printing parameters. This patch transfer behaviour (scales of ABS material on CF-PLA portion) indicates the strong bond developed between the two parent materials of the composite at the interface. An in-depth investigation of the specimens revealed a direct relationship between the percentage of patch transfer area versus bond strength, as shown in Figure 5. Therefore, for specimens failing under failure mode 1, interlaminar bond strength is most likely governed by the percentage of patch transfer area.
0
2
4
6
8
10
12
0 0.02 0.04 0.06 0.08
Forc
e (N
)
Extension (mm)
14
3
11
17
8
4
7
10
Figure 2. (a) Pre-testing sample; (b) post-testing sample.
Polymers 2020, 12, x FOR PEER REVIEW 6 of 16
Figure 2. (a) Pre-testing sample; (b) post-testing sample.
Figure 3. Force vs. extension graph for representative specimens.
In the first type of failure (failure mode 1), catastrophic failure behaviour is observed during the delamination process. It was statistically observed that failure mode 1 has an average bond strength of 9.63 MPa, whereas theaverage bond strength for failure mode 2 was found to be 4.36 MPa. Therefore, it can be deduced that specimens failing under failure mode 1 have a relatively higher bond strength than specimens failing under failure mode 2. Moreover, visual inspection through an optical microscope of the interfacial surface of tested specimens revealed that failure mode 1 exhibits patch transfer behaviour as well. In patch transfer behaviour, one of the laminae from the two dissimilar materials at the composite interface remains attached to the other one after being subjected to delamination forces at the laminar interface. As evident from Figure 4, laminae of ABS material have remained bonded with CF-PLA at the interface of the ABS/CF-PLA composite even after being subjected to delamination. It refers to a strong inter-laminar bond that occurs at the interface of the composite, which could be a result of favourable printing parameters. This patch transfer behaviour (scales of ABS material on CF-PLA portion) indicates the strong bond developed between the two parent materials of the composite at the interface. An in-depth investigation of the specimens revealed a direct relationship between the percentage of patch transfer area versus bond strength, as shown in Figure 5. Therefore, for specimens failing under failure mode 1, interlaminar bond strength is most likely governed by the percentage of patch transfer area.
0
2
4
6
8
10
12
0 0.02 0.04 0.06 0.08
Forc
e (N
)
Extension (mm)
14
3
11
17
8
4
7
10
Figure 3. Force vs. extension graph for representative specimens.
In the first type of failure (failure mode 1), catastrophic failure behaviour is observed duringthe delamination process. It was statistically observed that failure mode 1 has an average bondstrength of 9.63 MPa, whereas theaverage bond strength for failure mode 2 was found to be 4.36 MPa.Therefore, it can be deduced that specimens failing under failure mode 1 have a relatively higherbond strength than specimens failing under failure mode 2. Moreover, visual inspection throughan optical microscope of the interfacial surface of tested specimens revealed that failure mode 1exhibits patch transfer behaviour as well. In patch transfer behaviour, one of the laminae from the twodissimilar materials at the composite interface remains attached to the other one after being subjectedto delamination forces at the laminar interface. As evident from Figure 4, laminae of ABS materialhave remained bonded with CF-PLA at the interface of the ABS/CF-PLA composite even after beingsubjected to delamination. It refers to a strong inter-laminar bond that occurs at the interface of thecomposite, which could be a result of favourable printing parameters. This patch transfer behaviour(scales of ABS material on CF-PLA portion) indicates the strong bond developed between the twoparent materials of the composite at the interface. An in-depth investigation of the specimens revealeda direct relationship between the percentage of patch transfer area versus bond strength, as shown inFigure 5. Therefore, for specimens failing under failure mode 1, interlaminar bond strength is mostlikely governed by the percentage of patch transfer area.

Polymers 2020, 12, 2155 7 of 16Polymers 2020, 12, x FOR PEER REVIEW 7 of 16
Figure 4. Patch transfer of ABS lamina on the CF-PLA portion after delamination.
Figure 5. Patch transfer vs. bond strength.
In the case of failure mode 2, in contrast with failure mode 1, no catastrophic behaviour is observed. The relatively large values of extension for failure mode 2 infer that these specimens do not possess strong inter-laminar bonding when compared with failure mode 1. This could be due to the unfavourable printing parameters incorporated during the specimen printing. Furthermore, Figure 6 presents that no patch transfer has occurred after the delamination process, and the ABS laminae remain intact to their laminar mesh. At the same time, no beads or fibres of CF-PLA are found attached to this portion of the composite. Therefore, this supports and corroborates the finding that there exists a weak interfacial bonding strength for specimens failing under mode 2. Therefore, patch transfer is fair evidence that indicates interfacial bonding is related to the failure modes. To conclude, two types of failures occurred: (1) Patch transfer: This infers that, for corresponding printing parameters, intra layer bonding of the materials was weaker than the interfacial bonding between the two laminates. Resultantly, the patch of material with weaker intra layer bond transferred from one laminate to other laminate during the pull test. (2) No patch transfer: This indicates that intra layer bonding of the materials was stronger than the interfacial bonding between
0
10
20
30
40
50
60
70
0 5 10 15 20 25
Patc
h tr
ansf
er (%
)
Bond Strength (MPa)
Patch Transfer Vs Bond Strength
Figure 4. Patch transfer of ABS lamina on the CF-PLA portion after delamination.
Polymers 2020, 12, x FOR PEER REVIEW 7 of 16
Figure 4. Patch transfer of ABS lamina on the CF-PLA portion after delamination.
Figure 5. Patch transfer vs. bond strength.
In the case of failure mode 2, in contrast with failure mode 1, no catastrophic behaviour is observed. The relatively large values of extension for failure mode 2 infer that these specimens do not possess strong inter-laminar bonding when compared with failure mode 1. This could be due to the unfavourable printing parameters incorporated during the specimen printing. Furthermore, Figure 6 presents that no patch transfer has occurred after the delamination process, and the ABS laminae remain intact to their laminar mesh. At the same time, no beads or fibres of CF-PLA are found attached to this portion of the composite. Therefore, this supports and corroborates the finding that there exists a weak interfacial bonding strength for specimens failing under mode 2. Therefore, patch transfer is fair evidence that indicates interfacial bonding is related to the failure modes. To conclude, two types of failures occurred: (1) Patch transfer: This infers that, for corresponding printing parameters, intra layer bonding of the materials was weaker than the interfacial bonding between the two laminates. Resultantly, the patch of material with weaker intra layer bond transferred from one laminate to other laminate during the pull test. (2) No patch transfer: This indicates that intra layer bonding of the materials was stronger than the interfacial bonding between
0
10
20
30
40
50
60
70
0 5 10 15 20 25
Patc
h tr
ansf
er (%
)
Bond Strength (MPa)
Patch Transfer Vs Bond Strength
Figure 5. Patch transfer vs. bond strength.
In the case of failure mode 2, in contrast with failure mode 1, no catastrophic behaviour isobserved. The relatively large values of extension for failure mode 2 infer that these specimens do notpossess strong inter-laminar bonding when compared with failure mode 1. This could be due to theunfavourable printing parameters incorporated during the specimen printing. Furthermore, Figure 6presents that no patch transfer has occurred after the delamination process, and the ABS laminaeremain intact to their laminar mesh. At the same time, no beads or fibres of CF-PLA are found attachedto this portion of the composite. Therefore, this supports and corroborates the finding that there existsa weak interfacial bonding strength for specimens failing under mode 2. Therefore, patch transfer isfair evidence that indicates interfacial bonding is related to the failure modes. To conclude, two typesof failures occurred: (1) Patch transfer: This infers that, for corresponding printing parameters,intra layer bonding of the materials was weaker than the interfacial bonding between the two laminates.Resultantly, the patch of material with weaker intra layer bond transferred from one laminate to other

Polymers 2020, 12, 2155 8 of 16
laminate during the pull test. (2) No patch transfer: This indicates that intra layer bonding of thematerials was stronger than the interfacial bonding between the two laminates. Therefore, no patchtransfer (from one laminate to other laminate) was observed and, resultantly, the two laminatesdecoupled. In other words, we can also say that mode 1 failure occurs when the inter-layer bond ofthe laminates is weaker than the inter-laminates bond. Meanwhile, mode 2 failure occurs when theinter-laminates bond is weaker than the inter-layer bond of the laminates.
Polymers 2020, 12, x FOR PEER REVIEW 8 of 16
the two laminates. Therefore, no patch transfer (from one laminate to other laminate) was observed and, resultantly, the two laminates decoupled. In other words, we can also say that mode 1 failure occurs when the inter-layer bond of the laminates is weaker than the inter-laminates bond. Meanwhile, mode 2 failure occurs when the inter-laminates bond is weaker than the inter-layer bond of the laminates.
Figure 6. No patch transfer from the CF-PLA to ABS portion after delamination.
3.2. Analysis of Variance (ANOVA)
To investigate the significant printing parameters that yield strong IFBS, analysis of variance (ANOVA) was conducted. The ANOVA for bond strength is presented in Table 5. Four parameters, namely, printing speed (S), infill density (ID), layer height (LH), and layer thickness ratio (LTR), were considered in the current study, while interfacial bond strength (IFBS) was the response variable against the given printing parameters. A parameter was considered to have a significant effect if its p-value was ≤0.05, which employs a confidence level of more than 95%. As can be seen from Table 5, the model is significant, which means the quadratic model used for the ANOVA response surface is statistically correct. Further, following the predefined criterion, printing speed and layer height are the significant individual parameters. It was observed from Table 5 that, among the considered printing parameters, most of them interact with each other. This infers that the nature of the influence of the considered parameters is associated with the interacting ones. These interactions refer to the fact that a combined effect on the response variable was posed when the effect of one parameter is dependent on its corresponding companion parameter. The lack of fit, in this case, has a p-value > 0.1, which indicates towards its insignificance; therefore, the model can successfully interpolate between two design points. The analysis also revealed that the standard deviation for the response was 0.72, which shows that dispersion was low, and the results possess good repeatability.
Figure 6. No patch transfer from the CF-PLA to ABS portion after delamination.
3.2. Analysis of Variance (ANOVA)
To investigate the significant printing parameters that yield strong IFBS, analysis of variance(ANOVA) was conducted. The ANOVA for bond strength is presented in Table 5. Four parameters,namely, printing speed (S), infill density (ID), layer height (LH), and layer thickness ratio (LTR),were considered in the current study, while interfacial bond strength (IFBS) was the response variableagainst the given printing parameters. A parameter was considered to have a significant effect if itsp-value was ≤0.05, which employs a confidence level of more than 95%. As can be seen from Table 5,the model is significant, which means the quadratic model used for the ANOVA response surfaceis statistically correct. Further, following the predefined criterion, printing speed and layer heightare the significant individual parameters. It was observed from Table 5 that, among the consideredprinting parameters, most of them interact with each other. This infers that the nature of the influenceof the considered parameters is associated with the interacting ones. These interactions refer to thefact that a combined effect on the response variable was posed when the effect of one parameter isdependent on its corresponding companion parameter. The lack of fit, in this case, has a p-value > 0.1,which indicates towards its insignificance; therefore, the model can successfully interpolate betweentwo design points. The analysis also revealed that the standard deviation for the response was 0.72,which shows that dispersion was low, and the results possess good repeatability.

Polymers 2020, 12, 2155 9 of 16
Table 5. Analysis of variance (ANOVA) for bond strength.
Source p-Value Significance (Y/N)
Model 0.0249 YA—Printing Speed 0.0317 YB—Infill Density 0.5621 NC—Layer Height 0.0036 Y
D—Layer Thickness Ratio 0.3364 NAB 0.0394 YAC 0.0072 YAD 0.4049 NBC 0.0809 NBD 0.2369 NCD 0.0722 NA2 0.3571 NB2 0.0209 YC2 0.8441 ND2 0.2110 N
Lack of Fit 0.9692 N
3.3. Effect of Printing Parameters on Interfacial Bond Strength (IFBS)
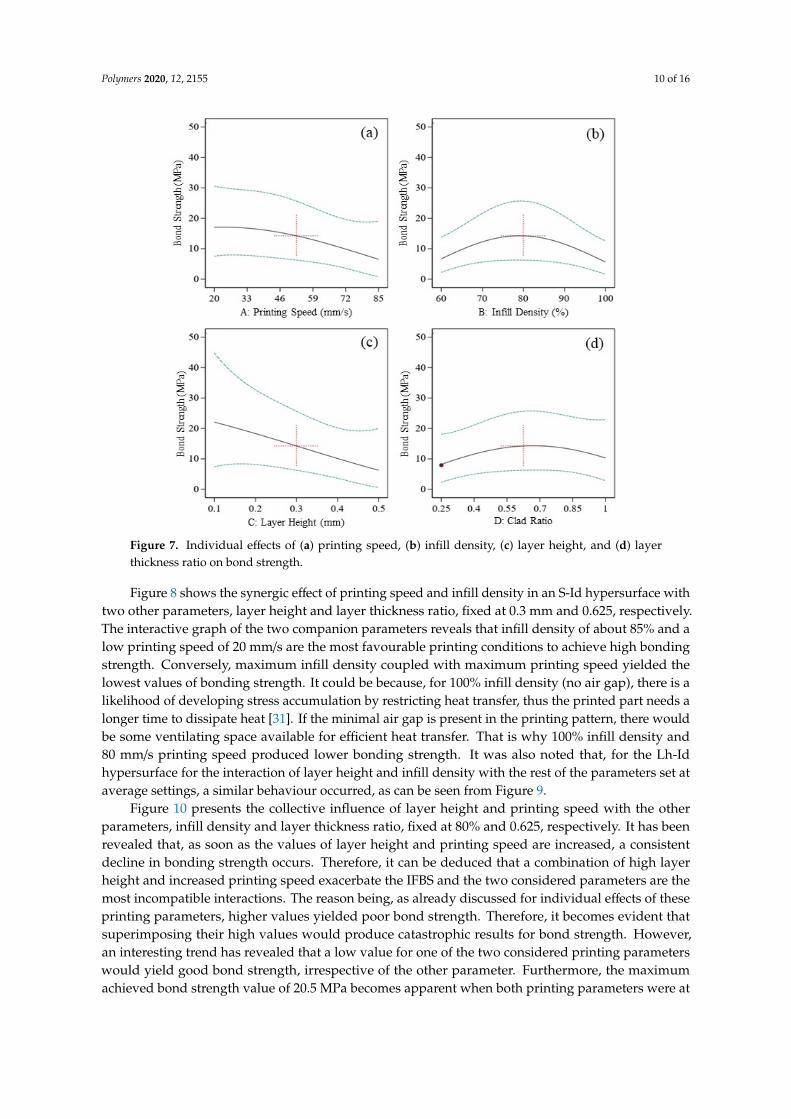
Generally, the effect of input parameters on the output response can be studied with the help ofsingle parameter versus response graphs, as shown in Figure 7a–d. However, when the two-factorinteraction (2FI) model is used for ANOVA, it becomes imperative to study interactive graphs or 3Dhypersurfaces as well. In this study, Figure 7a–d presents the individual effect of printing parameterson bond strength. It is evident from Figure 7b,d that infill density and layer thickness ratio have anegligible or no effect on bond strength, which is also supported from Table 5, where both parameterswere marked as insignificant parameters. Conversely, printing speed and layer height were consideredas significant parameters. From Figure 7a, it was noted that bond strength displayed an inverserelationship with printing speed. It is generally observed that, at high printing speed as the rasteris still in semi-molten phase, there is a likelihood of improved IFBS due to better interlayer fusion.However, a high printing speed induces distortions as well prevents good IFBS. Therefore, there existcompeting mechanisms regarding the relationship of printing speed with IFBS, hence it varies frommaterial to material. In this case, a high printing speed did not allow the printing beads to settledown properly; thus, the latter effect was found to be a dominant mechanism. Additionally, a highprinting speed lacks printing accuracy and creates distortions in the printing patterns. Furthermore,distortions were also responsible for the poor quality of bonded layers, which could potentially be dueto non-uniform temperature gradient between the consecutive layers [31]. It also requires the feedstockto be flowable enough at the allowable printing temperature to flow out of the extrusion nozzle atthe respective speed to deal with the high printing speed. Because of the reasons mentioned above,the subsequent upcoming layer of different material in the transition phase cannot properly fuse tothe previously printed layer. Consequently, the interfacial bond strength of 3D printed compositematerials is compromised. Therefore, in this case, the high printing speed is unsupportive for printingthermoplastic materials. On the other hand, the low printing speed supplements the interlayer fusionby allowing the subsequent layer to adhere properly, hence better bonding strength is achieved.The other significant printing parameter that individually affects the bond strength is layer height.Its behaviour towards bond strength is very synonymous to the printing speed, as shown in Figure 7c.As the layer height increases, bonding strength starts decreasing gradually. It may be because theincreased layer height incorporates air gaps into the printing pattern, which means that there existsunwanted porosity in the specimen. The air gaps due to increased layer height will not allow therasters to properly adhere and fuse with each other. Therefore, a weak interfacial bonding will occurdue to increased layer height. Contrary to this, low values of layer height will incorporate less volumeof air gaps, thus there will be a greater likelihood of strong interfacial bonding strength.
Polymers 2020, 12, 2155 10 of 16
Polymers 2020, 12, x FOR PEER REVIEW 10 of 16
values of layer height will incorporate less volume of air gaps, thus there will be a greater likelihood of strong interfacial bonding strength.
Figure 7. Individual effects of (a) printing speed, (b) infill density, (c) layer height, and (d) layer thickness ratio on bond strength.
Figure 8 shows the synergic effect of printing speed and infill density in an S-Id hypersurface with two other parameters, layer height and layer thickness ratio, fixed at 0.3 mm and 0.625, respectively. The interactive graph of the two companion parameters reveals that infill density of about 85% and a low printing speed of 20 mm/s are the most favourable printing conditions to achieve high bonding strength. Conversely, maximum infill density coupled with maximum printing speed yielded the lowest values of bonding strength. It could be because, for 100% infill density (no air gap), there is a likelihood of developing stress accumulation by restricting heat transfer, thus the printed part needs a longer time to dissipate heat [31]. If the minimal air gap is present in the printing pattern, there would be some ventilating space available for efficient heat transfer. That is why 100% infill density and 80 mm/s printing speed produced lower bonding strength. It was also noted that, for the Lh-Id hypersurface for the interaction of layer height and infill density with the rest of the parameters set at average settings, a similar behaviour occurred, as can be seen from Figure 9.
Figure 10 presents the collective influence of layer height and printing speed with the other parameters, infill density and layer thickness ratio, fixed at 80% and 0.625, respectively. It has been revealed that, as soon as the values of layer height and printing speed are increased, a consistent decline in bonding strength occurs. Therefore, it can be deduced that a combination of high layer height and increased printing speed exacerbate the IFBS and the two considered parameters are the most incompatible interactions. The reason being, as already discussed for individual effects of these printing parameters, higher values yielded poor bond strength. Therefore, it becomes evident that superimposing their high values would produce catastrophic results for bond strength. However, an interesting trend has revealed that a low value for one of the two considered printing parameters would yield good bond strength, irrespective of the other parameter. Furthermore, the maximum achieved bond strength value of 20.5 MPa becomes apparent when both printing parameters were at
Figure 7. Individual effects of (a) printing speed, (b) infill density, (c) layer height, and (d) layerthickness ratio on bond strength.
Figure 8 shows the synergic effect of printing speed and infill density in an S-Id hypersurface withtwo other parameters, layer height and layer thickness ratio, fixed at 0.3 mm and 0.625, respectively.The interactive graph of the two companion parameters reveals that infill density of about 85% and alow printing speed of 20 mm/s are the most favourable printing conditions to achieve high bondingstrength. Conversely, maximum infill density coupled with maximum printing speed yielded thelowest values of bonding strength. It could be because, for 100% infill density (no air gap), there is alikelihood of developing stress accumulation by restricting heat transfer, thus the printed part needs alonger time to dissipate heat [31]. If the minimal air gap is present in the printing pattern, there wouldbe some ventilating space available for efficient heat transfer. That is why 100% infill density and80 mm/s printing speed produced lower bonding strength. It was also noted that, for the Lh-Idhypersurface for the interaction of layer height and infill density with the rest of the parameters set ataverage settings, a similar behaviour occurred, as can be seen from Figure 9.
Figure 10 presents the collective influence of layer height and printing speed with the otherparameters, infill density and layer thickness ratio, fixed at 80% and 0.625, respectively. It has beenrevealed that, as soon as the values of layer height and printing speed are increased, a consistentdecline in bonding strength occurs. Therefore, it can be deduced that a combination of high layerheight and increased printing speed exacerbate the IFBS and the two considered parameters are themost incompatible interactions. The reason being, as already discussed for individual effects of theseprinting parameters, higher values yielded poor bond strength. Therefore, it becomes evident thatsuperimposing their high values would produce catastrophic results for bond strength. However,an interesting trend has revealed that a low value for one of the two considered printing parameterswould yield good bond strength, irrespective of the other parameter. Furthermore, the maximumachieved bond strength value of 20.5 MPa becomes apparent when both printing parameters were at

Polymers 2020, 12, 2155 11 of 16
their low extremes. Therefore, it can be said that both printing parameters complement each other toproduce high interfacial bond strength.
Polymers 2020, 12, x FOR PEER REVIEW 11 of 16
their low extremes. Therefore, it can be said that both printing parameters complement each other to produce high interfacial bond strength.
Figure 8. Combined effect of printing speed and infill density (S-ID hypersurface).
Figure 9. Combined effect of layer height and infill density (LH-ID hypersurface).
Figure 10. Combined effect of layer height and printing speed (LH-S hypersurface).
Figure 8. Combined effect of printing speed and infill density (S-ID hypersurface).
Polymers 2020, 12, x FOR PEER REVIEW 11 of 16
their low extremes. Therefore, it can be said that both printing parameters complement each other to produce high interfacial bond strength.
Figure 8. Combined effect of printing speed and infill density (S-ID hypersurface).
Figure 9. Combined effect of layer height and infill density (LH-ID hypersurface).
Figure 10. Combined effect of layer height and printing speed (LH-S hypersurface).
Figure 9. Combined effect of layer height and infill density (LH-ID hypersurface).
Polymers 2020, 12, x FOR PEER REVIEW 11 of 16
their low extremes. Therefore, it can be said that both printing parameters complement each other to produce high interfacial bond strength.
Figure 8. Combined effect of printing speed and infill density (S-ID hypersurface).
Figure 9. Combined effect of layer height and infill density (LH-ID hypersurface).
Figure 10. Combined effect of layer height and printing speed (LH-S hypersurface). Figure 10. Combined effect of layer height and printing speed (LH-S hypersurface).

Polymers 2020, 12, 2155 12 of 16
To further investigate and explore the behavior of IFBS with the changing printing parameters,superimposed effects of selected printing parameters on IFBS were studied. Figure 11 shows thesuperimposed effects when printing speed and infill density were coupled with varying layer height.To explore the superimposed effects, layer height was varied at 0.1, 0.3, and 0.5 mm, respectively.Keeping the layer height at a low setting (0.1 mm) while considering the printing speed and infilldensity, the maximum bonding strength can be achieved regardless of whether the layer thicknessratio is high or low. However, it was observed that, by increasing the value of layer height, the bondingstrength immediately started decreasing. Figure 11 corroborates this trend as the S-Id hypersurfacestook a shift towards lower values of bonding strength when layer height values of 0.3 mm and 0.5 mmwere employed. Additionally, it was also noted that IFBS was constrained to a maximum of 10 MPausing 0.5 mm as layer height. Therefore, it was noted that such unfavourable printing combinationsposed a diminishing effect on IFBS and, consequently, its magnitude was reduced to half of theachievable value. Likewise, Figure 12 presents the superimposed effects of infill density on printingspeed-layer height (S-LH) hypersurface. Infill density was employed at 60%, 80%, and 100% settings.It is evident from Figure 11 that a low infill density was detrimental for the IFBS and reduced to as lowas 13 MPa, whereas the settings with an infill density of 80% and 100% improved the bonding strength.From the above discussion, it can be concluded that the considered superimposed printing conditionsonly affect the magnitude of IFBS, whereas the nature of the response remains unchanged.
Polymers 2020, 12, x FOR PEER REVIEW 12 of 16
To further investigate and explore the behavior of IFBS with the changing printing parameters, superimposed effects of selected printing parameters on IFBS were studied. Figure 11 shows the superimposed effects when printing speed and infill density were coupled with varying layer height. To explore the superimposed effects, layer height was varied at 0.1, 0.3, and 0.5 mm, respectively. Keeping the layer height at a low setting (0.1 mm) while considering the printing speed and infill density, the maximum bonding strength can be achieved regardless of whether the layer thickness ratio is high or low. However, it was observed that, by increasing the value of layer height, the bonding strength immediately started decreasing. Figure 11 corroborates this trend as the S-Id hypersurfaces took a shift towards lower values of bonding strength when layer height values of 0.3 mm and 0.5 mm were employed. Additionally, it was also noted that IFBS was constrained to a maximum of 10 MPa using 0.5 mm as layer height. Therefore, it was noted that such unfavourable printing combinations posed a diminishing effect on IFBS and, consequently, its magnitude was reduced to half of the achievable value. Likewise, Figure 12 presents the superimposed effects of infill density on printing speed-layer height (S-LH) hypersurface. Infill density was employed at 60%, 80%, and 100% settings. It is evident from Figure 11 that a low infill density was detrimental for the IFBS and reduced to as low as 13 MPa, whereas the settings with an infill density of 80% and 100% improved the bonding strength. From the above discussion, it can be concluded that the considered superimposed printing conditions only affect the magnitude of IFBS, whereas the nature of the response remains unchanged.
Figure 11. Effect of layer height superimposed on the combined effect of printing speed and infill density.
Figure 11. Effect of layer height superimposed on the combined effect of printing speed and infill density.

Polymers 2020, 12, 2155 13 of 16
Polymers 2020, 12, x FOR PEER REVIEW 13 of 16
Figure 12. Effect of infill density superimposed on the combined effect of layer height and printing speed.
3.4. Prediction Model and Optimum Printing Conditions
The combined effects of printing parameters on the bond strength can be represented into one hypersurface known as the empirical model. For the current study, the empirical model is given below: 𝑆𝑞𝑟𝑡 (𝐵𝑜𝑛𝑑 𝑆𝑡𝑟𝑒𝑛𝑔𝑡ℎ) = 3.84 0.89𝐴 1.14𝐶 0.75𝐴𝐵 1.60𝐴𝐶 0.54𝐶 (1)
Generally, two criterions can be used to measure the fitness of the empirical model: R2 value and normal distribution. The determination coefficient (R2) for bond strength was 0.9021, which is close to 1. This infers that 90.21% of the total variation in bond strength can be derived by the empirical models developed in the experimental design, which represents that the relationship between the experimental and estimated results is in good agreement. The signal to noise ratio is measured with adequate precision, while a ratio of greater than 4 is desirable. For the current regression model, a value of 8.36 indicates a fair signal, which follows that the present model can be used to navigate the design space. Figure 13 represents the normal distribution of internally studentized residuals, which shows that residuals follow the normal distribution. Therefore, these tests validate that the model is fairly accurate.
Figure 12. Effect of infill density superimposed on the combined effect of layer height and printing speed.
3.4. Prediction Model and Optimum Printing Conditions
The combined effects of printing parameters on the bond strength can be represented into onehypersurface known as the empirical model. For the current study, the empirical model is given below:
Sqrt (Bond Strength) = 3.84− 0.89A− 1.14C− 0.75AB− 1.60AC + 0.54C (1)
Generally, two criterions can be used to measure the fitness of the empirical model: R2 value andnormal distribution. The determination coefficient (R2) for bond strength was 0.9021, which is closeto 1. This infers that 90.21% of the total variation in bond strength can be derived by the empiricalmodels developed in the experimental design, which represents that the relationship between theexperimental and estimated results is in good agreement. The signal to noise ratio is measured withadequate precision, while a ratio of greater than 4 is desirable. For the current regression model,a value of 8.36 indicates a fair signal, which follows that the present model can be used to navigatethe design space. Figure 13 represents the normal distribution of internally studentized residuals,which shows that residuals follow the normal distribution. Therefore, these tests validate that themodel is fairly accurate.
It has been established that printing parameters affect the IFBS of the printed specimen. Therefore,optimum printing conditions were determined to achieve suitable IFBS. The optimization performedby the software was an iterative process, and a total of 100 solutions were obtained. The optimizationwas achieved by employing the desirability function as described in [32] and given in Equation (2).
D =(dr1
1 ·dr22 . . . . . . . . . ·d
rmm
) 1(r1+r2+...+rm) (2)

Polymers 2020, 12, 2155 14 of 16
where di is the desirability of an individual response, r is the weightage of each response, and D is thecollective desirability of considered responses. Meanwhile, the objective was to maximize the bondstrength. For optimization in the current study, a single solution was accepted, having the highestdesirability function of 0.89. The printing speed of 50.54 mm/s, infill density of 79.82%, layer height of0.15 mm, and layer thickness ratio of 0.49 were found to be the best printing parameters.Polymers 2020, 12, x FOR PEER REVIEW 14 of 16
Figure 13. Normal probability plot.
It has been established that printing parameters affect the IFBS of the printed specimen. Therefore, optimum printing conditions were determined to achieve suitable IFBS. The optimization performed by the software was an iterative process, and a total of 100 solutions were obtained. The optimization was achieved by employing the desirability function as described in [32] and given in Equation (2). 𝐷 = (𝑑 . 𝑑 … … … . 𝑑 ) ( ⋯ ) (2)
where di is the desirability of an individual response, r is the weightage of each response, and D is the collective desirability of considered responses. Meanwhile, the objective was to maximize the bond strength. For optimization in the current study, a single solution was accepted, having the highest desirability function of 0.89. The printing speed of 50.54 mm/s, infill density of 79.82%, layer height of 0.15 mm, and layer thickness ratio of 0.49 were found to be the best printing parameters.
4. Conclusions
The current study investigated the interfacial bond strength (IFBS) of multi-material laminar composites manufactured through the fused deposition modelling process. The research aimed to study the influence of printing parameters on the IFBS by employing response surface methodology. Following are the important findings of the current study:
1. Optical microscopy revealed two types of failure modes after the specimens were subjected to uniaxial tensile loading. Mode 1 exhibited patch transfer behavior that indicated a strong interfacial bond between the two constituent materials (ABS and CF-PLA). Whereas, in case of failure mode 2, no scales or patch transfer of laminae material were found, which was characteristic to a weak interfacial bond. Moreover, a linear relationship between patch transfer percentage and IFBS was discovered.
Figure 13. Normal probability plot.
4. Conclusions
The current study investigated the interfacial bond strength (IFBS) of multi-material laminarcomposites manufactured through the fused deposition modelling process. The research aimed tostudy the influence of printing parameters on the IFBS by employing response surface methodology.Following are the important findings of the current study:
1. Optical microscopy revealed two types of failure modes after the specimens were subjectedto uniaxial tensile loading. Mode 1 exhibited patch transfer behavior that indicated a stronginterfacial bond between the two constituent materials (ABS and CF-PLA). Whereas, in case offailure mode 2, no scales or patch transfer of laminae material were found, which was characteristicto a weak interfacial bond. Moreover, a linear relationship between patch transfer percentage andIFBS was discovered.
2. Printing parameters were found to be very effective in determining the IFBS of the compositelaminates. The ANOVA suggested that low printing speed and low layer height coupled with highinfill density yield better IFBS. Moreover, the superimposed effects revealed that the magnitudeof IFBS varies with varying superimposed parameters; however, the nature of IFBS remainsthe same.
3. The empirical relation devised would guide the researchers to successfully predict the IFBS forany given printing parameters. Meanwhile, optimum printing parameters yielding good IFBS

Polymers 2020, 12, 2155 15 of 16
were found to be printing speed of 50.54 mm/s, infill density of 79.82%, layer height of 0.15,and layer thickness ratio of 0.49.
Author Contributions: G.H., S.W.A., and M.A. conceptualized the idea; G.H., M.H.A., and A.A. devised themethodology; S.W.A. and S.A. performed experimentation; M.H.A. performed analysis, S.W.A., K.A., and S.A.conducted investigation. S.W.A., K.A., A.A., and M.A. wrote this paper. All authors have read and agreed to thepublished version of the manuscript.
Funding: This research was funded by Deanship of Scientific Research, King Saud University, through researchgroup number RG-1439-027.
Acknowledgments: The authors are thankful to the UTP Malaysia and GIK Institute, Pakistan for providingnecessary technical assistance. The authors also extend their appreciation to the Deanship of Scientific Research atKing Saud University for funding this work through research group number RG-1439-027.
Conflicts of Interest: The authors declare no conflict of interest.
References
1. Wimpenny, D.I.; Pandey, P.M.; Jyothish Kumar, L. Advances in 3D Printing & Additive ManufacturingTechnologies; Springer: Singapore, 2017; pp. 1–186. [CrossRef]
2. Keles, Ö.; Blevins, C.W.; Bowman, K.J. Effect of build orientation on the mechanical reliability of 3D printedABS. Rapid Prototyp. J. 2017, 23, 320–328. [CrossRef]
3. Oztan, C.; Ballikaya, S.; Ozgun, U.; Karkkainen, R.; Celik, E. Additive manufacturing of thermoelectricmaterials via fused filament fabrication. Appl. Mater. Today 2019, 15, 77–82. [CrossRef]
4. Ou, C.; Sangle, A.L.; Datta, A.; Jing, Q.; Busolo, T.; Chalklen, T.; Narayan, V.; Kar-Narayan, S. Fully PrintedOrganic-Inorganic Nanocomposites for Flexible Thermoelectric Applications. ACS Appl. Mater. Interfaces2018, 10, 19580–19587. [CrossRef] [PubMed]
5. Ng, W.L.; Chua, C.K.; Shen, Y.F. Print Me An Organ! Why We Are Not There Yet. Prog. Polym. Sci. 2019, 97,101145. [CrossRef]
6. González-Henríquez, C.M.; Sarabia-Vallejos, M.A.; Rodriguez-Hernandez, J. Polymers for additivemanufacturing and 4D-printing: Materials, methodologies, and biomedical applications. Prog. Polym. Sci.2019, 94, 57–116. [CrossRef]
7. He, Q.; Wang, H.; Fu, K.; Ye, L. 3D printed continuous CF/PA6 composites: Effect of microscopic voids onmechanical performance. Compos. Sci. Technol. 2020, 191, 108077. [CrossRef]
8. Safonov, A.A. 3D topology optimization of continuous fiber-reinforced structures via natural evolutionmethod. Compos. Struct. 2019, 215, 289–297. [CrossRef]
9. Zhang, H.; Yang, D.; Sheng, Y. Performance-driven 3D printing of continuous curved carbon fibre reinforcedpolymer composites: A preliminary numerical study. Compos. Part B Eng. 2018, 151, 256–264. [CrossRef]
10. Justo, J.; Távara, L.; García-Guzmán, L.; París, F. Characterization of 3D printed long fibre reinforcedcomposites. Compos. Struct. 2018, 185, 537–548. [CrossRef]
11. Nakagawa, Y.; Mori, K.I.; Maeno, T. 3D printing of carbon fibre-reinforced plastic parts. Int. J. Adv.Manuf. Technol. 2017, 91, 2811–2817. [CrossRef]
12. Dickson, A.N.; Barry, J.N.; McDonnell, K.A.; Dowling, D.P. Fabrication of continuous carbon, glass andKevlar fibre reinforced polymer composites using additive manufacturing. Addit. Manuf. 2017, 16, 146–152.[CrossRef]
13. Tamburrino, F.; Graziosi, S.; Bordegoni, M. The influence of slicing parameters on the multi-material adhesionmechanisms of FDM printed parts: An exploratory study. Virtual Phys. Prototyp. 2019, 14, 316–332. [CrossRef]
14. Jiang, J.; Lou, J.; Hu, G. Effect of support on printed properties in fused deposition modelling processes.Virtual Phys. Prototyp. 2019, 14, 308–315. [CrossRef]
15. Porter, J.H.; Cain, T.M.; Fox, S.L.; Harvey, P.S. Influence of infill properties on flexural rigidity of 3D-printedstructural members. Virtual Phys. Prototyp. 2019, 14, 148–159. [CrossRef]
16. Ahmed, S.W.; Hussain, G.; Al-Ghamdi, K.A.; Altaf, K. Mechanical properties of an additive manufacturedCF-PLA/ABS hybrid composite sheet. J. Thermoplast. Compos. Mater. 2019. [CrossRef]
17. Lopez, D.M.B.; Ahmad, R. Tensile mechanical behaviour of multi-polymer sandwich structures via fuseddeposition modelling. Polymers 2020, 12, 651. [CrossRef]

Polymers 2020, 12, 2155 16 of 16
18. Zhang, W.; Cotton, C.; Sun, J.; Heider, D.; Gu, B.; Sun, B.; Chou, T.W. Interfacial bonding strength ofshort carbon fiber/acrylonitrile-butadiene-styrene composites fabricated by fused deposition modeling.Compos. Part B Eng. 2018, 137, 51–59. [CrossRef]
19. Singh, R.; Kumar, R.; Farina, I.; Colangelo, F.; Feo, L.; Fraternali, F. Multi-material additive manufacturing ofsustainable innovative materials and structures. Polymers 2019, 11, 62. [CrossRef]
20. Li, H.; Zhang, S.; Yi, Z.; Li, J.; Sun, A.; Guo, J.; Xu, G. Bonding quality and fracture analysis of polyamide12 parts fabricated by fused deposition modeling. Rapid Prototyp. J. 2017, 23, 973–982. [CrossRef]
21. Striemann, P.; Hülsbusch, D.; Niedermeier, M.; Walther, F. Optimization and quality evaluation of theinterlayer bonding performance of additively manufactured polymer structures. Polymers 2020, 12, 1166.[CrossRef]
22. Aliheidari, N.; Christ, J.; Tripuraneni, R.; Nadimpalli, S.; Ameli, A. Interlayer adhesion and fracture resistanceof polymers printed through melt extrusion additive manufacturing process. Mater. Des. 2018, 156, 351–361.[CrossRef]
23. Hart, K.R.; Wetzel, E.D. Fracture behavior of additively manufactured acrylonitrile butadiene styrene (ABS)materials. Eng. Fract. Mech. 2017, 177, 1–13. [CrossRef]
24. Islam, M.S.; Prabhakar, P. Interlaminar strengthening of multidirectional laminates using polymer additivemanufacturing. Mater. Des. 2017, 133, 332–339. [CrossRef]
25. Yin, J.; Lu, C.; Fu, J.; Huang, Y.; Zheng, Y. Interfacial bonding during multi-material fused depositionmodeling (FDM) process due to inter-molecular diffusion. Mater. Des. 2018, 150, 104–112. [CrossRef]
26. Khan, A.S.; Ali, A.; Hussain, G.; Ilyas, M. An experimental study on interfacial fracture toughness of 3-Dprinted ABS/CF-PLA composite under mode I, II, and mixed-mode loading. J. Thermoplast. Compos. Mater. 2019.[CrossRef]
27. Dawoud, M.; Taha, I.; Ebeid, S.J. Mechanical behaviour of ABS: An experimental study using FDM andinjection moulding techniques. J. Manuf. Process. 2016, 21, 39–45. [CrossRef]
28. Ali, S.; Rani, A.M.A.; Mufti, R.A.; Ahmed, S.W.; Baig, Z.; Hastuty, S.; Razak, M.A.H.A.; Aliyu, A.A.A.Optimization of sintering parameters of 316L stainless steel for in-situ nitrogen absorption and surfacenitriding using response surface methodology. Processes 2020, 8, 297. [CrossRef]
29. Al-Ghamdi, K.A.; Hussain, G. On the CO2 characterization in incremental forming of roll bonded laminates.J. Clean. Prod. 2017, 156, 214–225. [CrossRef]
30. Wu, W.; Geng, P.; Li, G.; Zhao, D.; Zhang, H.; Zhao, J. Influence of layer thickness and raster angle on themechanical properties of 3D-printed PEEK and a comparative mechanical study between PEEK and ABS.Materials 2015, 8, 5834–5846. [CrossRef]
31. Mohamed, O.A.; Masood, S.H.; Bhowmik, J.L.; Nikzad, M.; Azadmanjiri, J. Effect of Process Parameters onDynamic Mechanical Performance of FDM PC/ABS Printed Parts Through Design of Experiment. J. Mater.Eng. Perform. 2016, 25, 2922–2935. [CrossRef]
32. Costa, N.R.; Lourenço, J.; Pereira, Z.L. Desirability function approach: A review and performance evaluationin adverse conditions. Chemom. Intell. Lab. Syst. 2011, 107, 234–244. [CrossRef]
© 2020 by the authors. Licensee MDPI, Basel, Switzerland. This article is an open accessarticle distributed under the terms and conditions of the Creative Commons Attribution(CC BY) license (http://creativecommons.org/licenses/by/4.0/).