Embed Size (px)
Citation preview

Office of Solid Waste and Emergency Response (5102G)
EPA-542-R-11-009 December 2011 www.epa.gov/tio
www.clu-in.org/optimization
Optimization Evaluation General Motors Former AC Rochester Facility
Sioux City, Iowa

OPTIMIZATION EVALUATION
GENERAL MOTORS FORMER AC ROCHESTER FACILITY
SIOUX CITY, IOWA
Report of the Optimization Evaluation
Site Visit Conducted at the General Motors Former AC Rochester Facility
on June 21, 2011
Final Report
September 30, 2011

i
NOTICE
Work described herein was performed by Tetra Tech GEO, Inc. (Tetra Tech GEO) for the U.S.
Environmental Protection Agency (USEPA). Work conducted by Tetra Tech GEO, including
preparation of this report, was performed as Task Order #36E, Work Order 14 under USEPA
contract EP-C-05-061 with Tetra Tech EM, Inc., Chicago, Illinois. Mention of trade names or
commercial products does not constitute endorsement or recommendation for use.

ii
EXECUTIVE SUMMARY
Optimization Background
For more than a decade, the U.S. Environmental Protection Agency’s Office of Superfund
Remediation and Technology Innovation (USEPA OSRTI) has provided technical support to
USEPA Regional offices through the use of third-party optimization evaluations. OSRTI has
conducted more than 100 optimization studies at Superfund sites nationwide via Independent
Design Reviews, Remediation System Evaluation (RSE) and Long-Term Monitoring
Optimization (LTMO) reviews.
OSRTI is now implementing its National Strategy to Expand Superfund Optimization from
Remedial Investigation to Site Completion (Strategy). The Strategy unifies previously
independent optimization efforts (i.e., RSE, LTMO, Triad Approach, and Green Remediation)
under the singular activity and term “optimization,” which can be applied at any stage of the
Superfund project life cycle.
USEPA OSRTI’s working definition of optimization as of June 2011 is as follows:
“A systematic site review by a team of independent technical experts, at any
phase of a cleanup process, to identify opportunities to improve remedy
protectiveness, effectiveness, and cost efficiency, and to facilitate progress
toward site completion.”
An optimization evaluation considers the goals of the remedy, available site data, conceptual site
model (CSM), remedy performance, protectiveness, cost-effectiveness, closure strategy, and
environmental footprint. The evaluation includes reviewing site documents, potentially visiting
the site for one day, and compiling a report that includes recommendations in the following
categories:
Protectiveness
Cost-effectiveness
Technical improvement
Site closure
Environmental footprint reduction
The recommendations are intended to help the site team identify opportunities for improvements
in these areas. In many cases, further analysis of a recommendation, beyond that provided in this
report, may be needed prior to implementation of the recommendation. Note that the
recommendations are based on an independent evaluation, and represent the opinions of the
evaluation team. These recommendations do not constitute requirements for future action, but
rather are provided for consideration by the USEPA Region and other site stakeholders.

iii
Site-Specific Background
The General Motors (GM) Former AC Rochester Facility (site) is located within the valley of the
Missouri River in Sioux City, Iowa and is bounded by a steep loess bluff to the north, commercial
properties to the east, and undeveloped properties to the south and west. A Sioux City municipal
drinking water wellfield is located along the Missouri River southeast of the site. GM formerly
used the site to assemble and test throttle-body injection fuel systems. Chemicals of potential
concern (COPC) in soil and groundwater are chlorinated volatile organic compounds (CVOCs).
CVOCs were encountered in soil and groundwater during Phase I and Phase Environmental Site
Assessments (ESAs) conducted by GM at the site in 1993 after GM had ceased production at the
site. GM conducted additional investigations and implemented a groundwater remedy that was
operational by the end of 2006. GM declared bankruptcy in 2009, and the State of Iowa referred
the site to USEPA in 2011 for site remediation. The current remedy includes a hydraulic capture
system (HCS) and a former city supply well that is currently operating as a recovery well to
protect other supply wells in the area. No active remedy is occurring in the source area.
Remediation to date has occurred under the oversight of the State of Iowa. USEPA was not
involved in selecting the existing site remedies.
Summary of the Conceptual Site Model
The soil and shallow groundwater CVOC concentrations indicate that the main contamination
source area is in the north end of the parking lot to the west of the main site building. No specific
infrastructure (e.g., tanks) was present in this area to suggest a cause for the release. Once in
shallow groundwater, the CVOCs migrated to the east/southeast and to greater depths under the
influence of pumping from City Well #3 and the other municipal supply wells. Reductive
dechlorination of the contamination is occurring but degradation appears to be stalling prior to
reaching non-toxic products. Residual contamination in the unsaturated and saturated soil of the
source area continue to result in total CVOC detections above 20,000 micrograms per liter (µg/L)
after more than 13 years of sampling. Under current conditions and remedial activities, source
area concentrations and the downgradient plume will likely not reach cleanup goals for many
decades.
Though the more concentrated CVOCs have migrated below the shallow groundwater before
passing beneath the facility’s main building, elevated CVOC concentrations are still present near
the water table, and vapor intrusion (VI) in the facility building could be an issue.
HCS operation has been generally effective at capturing the core of the detected plume.
Concentrations dropped substantially when HCS operation began, and by April 2009,
concentrations of each CVOC were approaching cleanup standards at the HCS sentinel wells.
These concentration trends are generally consistent with the groundwater flow modeling and
particle tracking that was done during design. Small gaps in capture that might also (or
alternatively) contribute to low level concentrations at the HCS sentinel wells can be explained by
periodic underperformance of the HCS due to fouling. Plume capture may not be complete to the
north and/or below the HCS.

iv
Summary of Findings
Improved operation of the HCS and confirmation of capture is crucial to reducing concentrations
downgradient of the property boundary and allow operation of City Well #3 to resume supplying
water to the city. Evaluation of the potential for soil VI and source area remediation are also high
priorities for the site.
Summary of Recommendations
Recommendations and/or considerations are provided regarding effectiveness, technical
improvement, and site closure as follows:
Improving remedy effectiveness – evaluate potential for VI, sample for 1,4-dioxane,
delineate extent of horizontal contaminant migration, and consider options for addressing
City Well #3
Technical improvement – prepare an annual report with specific remedy information
Site closure – consider factors that will affect the development of remedy alternatives,
determine shutdown criteria for the various active remedies, consider specific options for
source area remediation, and consider specific options for a containment remedy at the
property boundary. For active remediation, the optimization team favors air sparging
(AS) and soil vapor extraction (SVE) for the source area and continued operation of the
HCS for the containment remedy.
v
PREFACE
This report was prepared as part of a national strategy to expand Superfund optimization from
remedial investigation to site completion implemented by the United States Environmental
Protection Agency Office of Superfund Remediation and Technology Innovation (USEPA
OSRTI). The optimization project contacts are as follows:
Organization Key Contact Contact Information
USEPA Office of Research and
Development
(ORD)
David Reisman U. S. Environmental Protection
Agency Engineering Technical
Support Center, National Risk
Management Research Laboratory
Cincinnati, Ohio 45268
phone: 513-569-7588
Tetra Tech EM, Inc.
(Contractor to USEPA)
Stan Lynn Tetra Tech EM Inc.
250 West Court Street, Suite 200W
Cincinnati, OH 45202
phone: 513-564-8349
Tetra Tech GEO, Inc.
(Contractor to Tetra Tech EM, Inc.)
Doug Sutton,
P.E., PhD.
Tetra Tech GEO, Inc.
2 Paragon Way
Freehold, NJ 07728
phone: 732-409-0344
Work conducted by Tetra Tech was performed as Task Order #36E, Work Order 14 under
USEPA contract EP-C-05-061 with Tetra Tech EM, Inc., Chicago, Illinois. The USEPA Project
Officer is Jennifer Goetz.

vi
TABLE OF CONTENTS
NOTICE ............................................................................................................................... i
EXECUTIVE SUMMARY ................................................................................................ ii
PREFACE ............................................................................................................................v
TABLE OF CONTENTS ................................................................................................... vi
1.0 INTRODUCTION ......................................................................................................1
1.1 PURPOSE .................................................................................................................1 1.2 TEAM COMPOSITION ...............................................................................................2 1.3 DOCUMENTS REVIEWED .........................................................................................2
1.4 QUALITY ASSURANCE ............................................................................................3 1.5 PERSONS CONTACTED ............................................................................................3
2.0 SITE BACKGROUND ...............................................................................................5
2.1 LOCATION ..............................................................................................................5 2.2 SITE HISTORY .........................................................................................................5
2.3 POTENTIAL HUMAN AND ECOLOGICAL RECEPTORS ...............................................7 2.4 EXISTING DATA AND INFORMATION .......................................................................7
2.4.1 SOURCES OF CONTAMINATION .................................................................7
2.4.2 GEOLOGIC SETTING AND HYDROGEOLOGY ..............................................7
2.4.3 SOIL CONTAMINATION .............................................................................8 2.4.4 SOIL VAPOR CONTAMINATION .................................................................9 2.4.5 GROUNDWATER CONTAMINATION ...........................................................9
2.4.6 SURFACE WATER CONTAMINATION .......................................................10 2.4.7 OTHER EXISTING INFORMATION ............................................................10
3.0 DESCRIPTION OF EXISTING OR PLANNED REMEDIES ................................11
3.1 REMEDY AND REMEDY COMPONENTS ..................................................................11 3.1.1 HCS. ......................................................................................................11 3.1.2 CITY WELL #3 ........................................................................................11
3.1.3 SOURCE AREA REMEDIES .......................................................................12 3.2 REMEDIAL ACTION OBJECTIVES AND STANDARDS ...............................................12
3.3 PERFORMANCE MONITORING PROGRAMS .............................................................14
4.0 CONCEPTUAL SITE MODEL (CSM) ...................................................................15
4.1 CSM OVERVIEW ..................................................................................................15 4.2 CSM DETAILS AND EXPLANATION .......................................................................16
4.2.1 SOURCE AREA EXTENT AND CONCENTRATIONS ....................................16
4.2.2 VAPOR INTRUSION .................................................................................17 4.2.3 HCS CAPTURE .......................................................................................17 4.2.4 CITY WELL #3 ........................................................................................18
4.3 DATA GAPS ..........................................................................................................19

vii
4.4 IMPLICATIONS FOR REMEDIAL STRATEGY ............................................................19
5.0 FINDINGS ................................................................................................................21
5.1 GENERAL FINDINGS ..............................................................................................21 5.2 SUBSURFACE PERFORMANCE AND RESPONSE ......................................................21
5.2.1 PLUME CAPTURE ....................................................................................21 5.2.2 GROUNDWATER CONTAMINANT CONCENTRATIONS ..............................21
5.3 COMPONENT PERFORMANCE ......................................................................22 5.3.1 GROUNDWATER EXTRACTION SYSTEM ..................................................22 5.3.2 WATER DISCHARGE ...............................................................................23
5.4 REGULATORY COMPLIANCE .................................................................................23 5.5 COMPONENTS OR PROCESSES THAT ACCOUNT FOR MAJORITY OF ANNUAL
COSTS ...................................................................................................................23
5.5.1 CITY WELL POWER AND MAINTENANCE ................................................24 5.5.2 HCS UTILITIES .......................................................................................24 5.5.3 POTW FEES ...........................................................................................24
5.5.4 LABOR ...................................................................................................24 5.5.5 WELL SAMPLING AND ANALYSIS ...........................................................24
5.6 APPROXIMATE ENVIRONMENTAL FOOTPRINTS ASSOCIATED WITH THE REMEDY .25 5.6.1 ENERGY, AIR EMISSIONS AND GREENHOUSE GASES ..............................25 5.6.2 WATER RESOURCES ...............................................................................25
5.6.3 LAND AND ECOSYSTEMS ........................................................................25 5.6.4 MATERIALS USAGE AND WASTE DISPOSAL ...........................................25
5.7 SAFETY RECORD ..................................................................................................25
6.0 RECOMMENDATIONS ..........................................................................................26
6.1 RECOMMENDATIONS TO IMPROVE EFFECTIVENESS ..............................................26 6.1.1 ASSESS VAPOR INTRUSION RISK IN FACILITY BUILDING ........................26
6.1.2 ANALYZE FOR 1,4-DIOXANE ..................................................................26 6.1.3 DELINEATE MIGRATION PATH OFF-SITE AND RECOGNIZE POTENTIAL
FOR MODIFICATIONS TO CONTAINMENT REMEDY ..................................26
6.1.4 CONSIDERATIONS FOR CITY WELL #3 ....................................................27 6.2 RECOMMENDATIONS TO REDUCE COSTS ..............................................................28
6.3 RECOMMENDATIONS FOR TECHNICAL IMPROVEMENT ..........................................29 6.3.1 PREPARE AND ANNUAL REPORT ............................................................29
6.4 CONSIDERATIONS FOR GAINING SITE CLOSE OUT ................................................29 6.4.1 DEVELOP SHUTDOWN CRITERIA ............................................................29
6.4.2 OPTIONS FOR SOURCE AREA SOIL AND GROUNDWATER
REMEDIATION ........................................................................................30 6.4.3 OPTIONS FOR A CONTAINMENT REMEDY ...............................................33 6.4.4 OPTIMIZATION TEAM RECOMMENDATION .............................................34
6.5 RECOMMENDATIONS FOR FOOTPRINT REDUCTION ...............................................35
viii
Tables
Table 1-1. Tetra Tech GEO Optimization Evaluation Team .............................................. 2 Table 1-2. Individuals Associated with the Site Present for the Site Visit ......................... 3 Table 3-1. Groundwater Standards ................................................................................... 13
Table 5-1. HCS Flow Rates and Concentrations .............................................................. 22 Table 5-2. Annual Operating Costs .................................................................................. 23 Table 6-1. Recommendations Cost Summary Table ........................................................ 35
Appendices
Attachment A – Select Figures from Site Documents
Attachment B – CVOC Trends at HCS Sentinel Wells
Attachment C – 1,1-DCA at City Well #3
Attachment D – Emission factors for Electricity Use
Attachment E – Pump Curve
Attachment F – Photo Log (taken by Rob Weber of USEPA ORD from August 1 through
August 3, 2011)

ix
ACRONYMS AND ABBREVIATIONS
% percent
µg/kg micrograms per kilogram
µg/L micrograms per liter
AS air sparging
bgs below ground surface
BTU British thermal units
CERCLA Comprehensive Environmental Response, Compensation, and
Liability Act
COPC chemicals of potential concern
CSM conceptual site model
CVOC chlorinated volatile organic compound
DCA dichloroethane
DCE dichloroethylene
DEP Division of Environmental Protection
DPNR Department of Planning and Natural Resources
ER environmental restoration
ERD enhanced reductive dechlorination
ESA environmental site assessment
ETSC Engineering Technology Support Center
FS feasibility study
GAC granular activated carbon
GM General Motors
gpm gallons per minute
HCS hydraulic capture system
HDR HDR Engineering, Inc.
HGL HydroGeoLogic, Inc.
HP horsepower
HQ headquarters
IC Institutional Control
IDNR Iowa Department of Natural Resources
ISCO in situ chemical oxidation
kWh kilowatt-hour
LTMO long-term monitoring optimization
MCL maximum contaminant level
MLC Motors Liquidation Company
NAPL non-aqueous phase liquid
NT not detected
O&M operation and maintenance
ORD Office of Research and Development
ORP oxidation reduction potential
OSP Office of Science and Policy
OSRTI Office of Superfund Remediation and Technology Innovation
OSWER Office of Solid Waste and Environmental Response
P&T pump and treat

x
PCE tetrachloroethylene
PDB passive diffusion bags
PEX AquaPEX
POTW publicly owned treatment works
ppb parts per billion
PVC polyvinyl chloride
QAPP quality assurance project plan
RAO remedial action objective
RI remedial investigation
ROD record of decision
ROI radius of influence
RSE remediation system evaluation
SCFM standard cubic feet per minute
SVE soil vapor extraction
TCA trichloroethane
TCE trichloroethylene
Tetra Tech GEO Tetra Tech GEO, Inc.
TOC total organic carbon
USDOJ United States Department of Justice
USEPA United States Environmental Protection Agency
UST underground storage tank
VI vapor intrusion
VOC volatile organic compound

1
1.0 INTRODUCTION
1.1 PURPOSE
During fiscal years 2000 and 2001 independent reviews called Remediation System Evaluations
(RSEs) were conducted at 20 operating Fund-lead pump-and-treat (P&T) sites (i.e., those sites
with P&T systems funded and managed by Superfund and the States). Due to the opportunities
for system optimization that arose from those RSEs, the USEPA Office of Superfund
Remediation and Technology Innovation (OSRTI) has incorporated RSEs into a larger post-
construction complete strategy for Fund-lead remedies as documented in OSWER Directive No.
9283.1-25, Action Plan for Ground Water Remedy Optimization. Concurrently, USEPA
developed and applied the Triad Approach to optimize site characterization and development of a
conceptual site model (CSM). The USEPA has since expanded the definition of optimization to
encompass investigation stage optimization using the Triad Approach, optimization during
design, and RSEs. The USEPA’s working definition of optimization as of June 2011 is as
follows:
“A systematic site review by a team of independent technical experts, at any
phase of a cleanup process, to identify opportunities to improve remedy
protectiveness, effectiveness, and cost efficiency, and to facilitate progress
toward site completion.”
As stated in the definition, optimization refers to a “systematic site review”, indicating that the
site as a whole is often considered in the review. Optimization can be applied to a specific aspect
of the remedy (e.g., focus on long-term monitoring optimization or focus on one particular
operable unit), but other site or remedy components are still considered to the degree that they
affect the focus of the optimization. An optimization evaluation considers the goals of the
remedy, available site data, CSM, remedy performance, protectiveness, cost-effectiveness, and
closure strategy. A strong interest in sustainability has also developed in the private sector and
within Federal, State, and Municipal governments. Consistent with this interest, OSRTI has
developed a Green Remediation Primer (http://cluin.org/greenremediation/), and now routinely
considers environmental footprint reduction during optimization evaluations. The evaluation
includes reviewing site documents, potentially visiting the site for one day, and compiling a
report that includes recommendations in the following categories:
Protectiveness
Cost-effectiveness
Technical improvement
Site closure
Environmental footprint reduction
The recommendations are intended to help the site team identify opportunities for improvements
in these areas. In many cases, further analysis of a recommendation, beyond that provided in this
report, may be needed prior to implementation of the recommendation. Note that the
recommendations are based on an independent evaluation, and represent the opinions of the

2
evaluation team. These recommendations do not constitute requirements for future action, but
rather are provided for consideration by the USEPA Region and other site stakeholders.
The national optimization strategy includes a system for tracking consideration and
implementation of the optimization recommendations and includes a provision for follow-up
technical assistance from the optimization team as mutually agreed upon by the site management
and USEPA OSRTI.
The General Motors (GM) Former AC Rochester Facility (site) is located within the valley of the
Missouri River in Sioux City, Iowa. The Sioux City Riverside Park Well Field, which is a major
source of the city’s water supply, is located along the Missouri River southeast of the site.
Chlorinated volatile organic compound (CVOC) contamination is present in soil and
groundwater. GM developed and operated site remedies under the oversight of the Iowa
Department of Natural Resources (IDNR) until GM declared bankruptcy in 2009, and the State of
Iowa referred the site to USEPA in 2011 for site remediation. USEPA Region 7 assumed the
lead for site remediation on April 1, 2011 and requested the optimization evaluation to provide an
independent third-party review of the current remediation efforts and to assist USEPA with
strategy for future remediation.
1.2 TEAM COMPOSITION
The optimization evaluation team consisted of the following individuals:
Table 1-1. Tetra Tech GEO Optimization Evaluation Team
Name Affiliation Phone Email
Peter Rich Tetra Tech GEO, Inc. 410-990-4607 [email protected]
Scott Parsons Tetra Tech GEO, Inc. 949-809-5222 [email protected]
Doug Sutton* Tetra Tech GEO, Inc. 732-409-0344 [email protected]
* Not present at the site visit.
In addition, the following individuals from USEPA Headquarters (HQ) and USEPA Office of
Research and Development (ORD) participated in the site visit:
Kirby Biggs, USEPA HQ
Dave Reisman, USEPA ORD/Engineering Technology Support Center (ETSC)
Robert Weber, USEPA ORD/Office of Science and Policy (OSP)
1.3 DOCUMENTS REVIEWED
The following documents were reviewed. The reader is directed to these documents for
additional site information that is not provided in this report.
Action Memorandum: Request for Approval and Funding for a Removal Action and 12-
Month Emergency Exemption (USEPA Region 7) – April 2011
Baseline Groundwater Sampling Report (HydroGeoLogic, Inc.) – February 2011

3
HCS 2009 Summary Report (HDR Engineering, Inc.) – January 2010
Hydraulic Capture System Operation and Maintenance Plan (HDR Engineering, Inc.) –
March 2007
Memorandum from Steven D. Acre to Nancy Swyer dated December 29, 2004regarding
the Butane Biostimulation Pilot Study Report, Response to Comments
Remedial Action Plan (HDR Engineering, Inc.) – December 2004
Volatile Organic Compound (VOC) Removal at the Water Treatment Plant (Olsson
Associates) – December 2002
Record of Decision (Iowa Department of Natural Resources) – May 2001
Feasibility Study (HDR Engineering, Inc) – May 2000
Remedial Investigation Report (HDR Engineering, Inc) – December 1998
1.4 QUALITY ASSURANCE
This optimization evaluation utilizes existing environmental data to interpret the CSM, evaluate
remedy performance, and make recommendations to improve the remedy. The quality of the
existing data is evaluated by the optimization team prior to using the data for these purposes. The
evaluation for data quality includes a brief review of how the data were collected and managed
(where practical, the site Quality Assurance Project Plan [QAPP] is considered), the consistency
of the data with other site data, and the use of the data in the optimization evaluation. Data that
are of suspect quality are either not used as part of the optimization evaluation or are used with
the quality concerns noted. Where appropriate, this report provides recommendations made to
improve data quality.
1.5 PERSONS CONTACTED
The following individuals associated with the site were present for the visit:
Table 1-2. Individuals Associated with the Site Present for the Site Visit
Name Affiliation Phone
Nancy Swyers Remedial Project Manager
USEPA 913-551-7703
Anna Baldwin USEPA
Ricky Mach City
Brad Puetz City
Alan Rittgers HGL
Stephen Holmes HGL
Dennis Wilson ER
Rich Feder ER
Mike Conzett HDR
Todd Wilson HDR

4
HydroGeoLogic, Inc. (HGL) is the prime remedial contractor for EPA. Environmental
Restoration (ER) is contracted by USEPA to implement tasks including rehabilitation and
operation of the HCS and City Well #3. HDR Engineering, Inc. (HDR) was GM’s remedial
contractor and attended the site visit to assist with the description of the work done at the site to
date. HDR is subcontracted by HGL, as needed, to provide technical support. Sioux City staff
attended a portion of the site visit to discuss the status of the city well field and future operation
plans.

5
2.0 SITE BACKGROUND
2.1 LOCATION
The site is a 26-acre property located in the Tri-View Industrial District in Woodbury County,
Sioux City, Iowa. Formerly a GM Corporation assembly and testing facility for throttle body
injection fuel systems, the site is currently owned by Confluent Enterprises LLC and leased to
Bomgaars Supply and is used as office space and warehousing. The site contains several
structures including a 221,000 square foot metal and masonry building (“main site building”)
used for warehousing and connected to a 19,000 square foot administrative offices building, a
cooling tower and a fire water tank/pump house. The site is bounded by a railroad, a steep bluff
and then residential properties to the north, commercial properties to the east, the Sioux City
municipal well field to the southeast, Interstate Highway 29 and the Missouri River to the south
and undeveloped properties to the west. The site location and surrounding area is depicted in
Figures 1 and 2 of the HGL 2011 Baseline Groundwater Sampling Report (see first two figures of
Attachment A).
2.2 SITE HISTORY
The 2001 Record of Decision (ROD) and the 2011 Request for Approval and Funding for a
Removal Action and 12-Month Emergency Exemption Memorandum provides the following
information:
Prior to 1965, the site was comprised of individual and small business owned parcels.
In 1965, the Zenith Corporation purchased the property and constructed a radio
manufacturing facility. Six underground storage tanks (USTs) were constructed to store
acetone, isopropanol, white gas, lacquer thinner, 1,1,1-Trichloroethane (1,1,1-TCA), and
gasoline.
In 1980, GM purchased the site and modified the manufacturing facility to an assembly
and testing facility for throttle body injection fuel systems. As part of its operation, GM
used an aboveground Stoddard solvent tank farm but did not use the USTs installed by
Zenith Corporation. The layout of the facility at the time GM owned the property is
illustrated in Figure 1.3.1 of the May 2000 Feasibility Study (see Attachment A).
In 1984, GM removed the USTs that were installed by Zenith Corporation.
In 1993, production at the facility ceased and the site underwent Phase I and Phase II
Environmental Site Assessments (ESAs) in preparation for its sale. During these
assessments, the existence of CVOCs was discovered, which GM then reported to the
IDNR.
In 1994, GM removed the Stoddard solvent tank farm. At the request of IDNR, GM
conducted additional investigations at the site that further defined the extent of

6
groundwater contamination. Contaminant concentrations in excess of the USEPA-
established maximum contaminant levels (MCLs) for drinking water were discovered.
Also at this time, the USEPA conducted a preliminary assessment.
In 1996, after completing a preliminary assessment, the USEPA deferred the site to
IDNR for cleanup and oversight. At this time, GM entered into a formal agreement with
IDNR to conduct another phase of investigations at the site.
In 1997, after an investigation of the Stoddard solvent tank farm area, the IDNR issued a
no further action determination for that area. GM also entered into another agreement
with IDNR to perform remedial investigation (RI) and feasibility studies (FS) at the site.
These studies detected CVOCs in the groundwater at levels above the MCLs for drinking
water. An area of contaminated soil that could be the source for the groundwater
contamination was also discovered during these studies. The soil contamination was not
found at levels that pose a risk to human health from direct exposure. The IDNR
prepared a Proposed Plan that summarized the RI and FS and presented a proposed
alternative for addressing contamination at the site. Sampling conducted subsequent to
the release of the Proposed Plan revealed that the contamination extended off-site.
Between June 19 and July 21, 2000 the Proposed Plan and supporting documentation in
the Administrative Record were made available to the public.
In 2001, a state ROD was signed. The ROD specified a remedy consisting of a butane
biosparge system to treat the source area and a hydraulic capture system (HCS) to prevent
continued migration of contaminated groundwater off site.
In 2005 and 2006, the HCS and butane biostimulation systems were constructed and by
the end of 2006, both systems were operational. Additionally, City Well #3 was taken
out of service as a municipal drinking water well to be used as a recovery well to prevent
contaminated groundwater from reaching the remainder of the city municipal well field.
From 2006 to 2009, a butane biostimulation pilot study for groundwater in the source
area was initiated and showed some concentration reductions. However, the pilot study
was not conducted for the source area soils and ended when GM declared bankruptcy.
In 2009, GM declared bankruptcy and sold its assets to General Motors, LLC, a separate
and independent entity. GM then became Motors Liquidation Company (MLC), which
was responsible for settling the company’s liability. MLC reached a settlement with the
U.S. Department of Justice (USDOJ) for the liability associated with the site. The State
deferred the lead regulatory role to the USEPA.
On April 1, 2011, USEPA assumed the lead for site remediation.

7
2.3 POTENTIAL HUMAN AND ECOLOGICAL RECEPTORS
The primary potential human receptors are users of Sioux City municipal water, and workers in
the former GM facility site building and other buildings above the plume that may be exposed to
soil vapors intruding into the building:
With respect to groundwater users, there are multiple public supply wells approximately
1,000 feet downgradient of the site source area. These wells include but are not
necessarily limited to City Well #2, City Well #6, City Well #10, and City Well #24 (a
radial collector well). City Well #3 was taken out of service as a municipal drinking
water well to be used as a recovery well to prevent contaminated groundwater from
reaching the remainder of the municipal well field. City Well #4 was also taken out of
service and could be used as a recovery well, if needed.
The 240,000 square foot main site building is used as a warehouse and offices by
Bomgaars Supply. It is a potential receptor via vapor intrusion (VI) because the shallow
CVOC plume is directly beneath the building. Sub-slab soil vapor samples have not been
taken to date to determine if this pathway is present. The site team reports that limited
indoor air sampling was conducted by the Iowa DNR, but additional study is merited.
Additional buildings above the plume downgradient of the former GM facility building
may also have VI issues.
Contamination that migrates past the site hydraulic containment system and the city production
wells, if any, would discharge to the Missouri River. City Well #3, when operated is discharged
to the Missouri River. These discharges are not expected to have a measureable impact on
ecological receptors due to the large size of the receiving water body.
2.4 EXISTING DATA AND INFORMATION
2.4.1 SOURCES OF CONTAMINATION
Several ESAs and RIs conducted from 1993 through 1998 identified two primary potential source
areas of CVOCs: one along the property boundary to the northwest of the building near the
location of current monitoring well AC-155 (known as Potential Source Area #1) and the other in
the general location of the former Zenith USTs along the northern border of the building (known
as Potential Source Area #2). The extent and magnitude of contamination at both source areas
are depicted in Figures 2.1.2 and 2.1.3 of the May 2000 Feasibility Study by HDR (see
Attachment A). The optimization team has also indicated the approximate locations of these
potential source areas on a modified version of Figure 2 from the HGL 2001 Baseline Sampling
Event (see last figure of Attachment A). Potential Source Area #1 is described in the 1998
Remedial Investigation Report as approximately 500 feet long and 70 feet wide. Potential Source
Area #2 is described in the 1998 Remedial Investigation Report as approximately 110 feet in
diameter.
2.4.2 GEOLOGIC SETTING AND HYDROGEOLOGY
Sediments at the site are from the DeForest Formation and are commonly found in floodplains
along streams in the area. This formation was deposited during the Holocene Epoch and is

8
comprised of alluvium, colluviums, and pond sediments. Investigations at the site revealed fine
to medium-grained sand and silty sand with clay intervals that vary in thickness and extend to
approximately 60 feet below ground surface (bgs). The upper and lower portions of this 60-foot
interval are separated by a clay layer that is present across much of the site at approximately 45 to
50 feet bgs. This clay layer acts as a leaky aquitard and is most likely capable of transmitting
water between the upper and lower members of the formation. The lower DeForest Formation
materials consist of coarser sand and gravel units that vary in thickness from 5 to 10 feet and form
a semi-confined aquifer at the site.
The Noah Creek Formation lies directly below the DeForest Formation. The upper portion of this
formation consists of clay containing fine- to medium-grained sand and silt. Borings previously
conducted at the site indicate that the clay layer varies in thickness from 5 to 30 feet and is absent
beyond Interstate 29. The absence of this clay layer allows contaminated groundwater from the
site to flow into the lower Noah Creek Formation. The lower portion of the Noah Creek
Formation varies in thickness from 0 to 20 feet and consists of coarser silt, sand, and gravel. This
unit is a significant aquifer to the area that is recharged by leakage through the overlying clay unit
and connection to the Missouri River.
Regional bedrock is identified as the Dakota Formation, which is comprised of the Woodbury
(upper) and Nishnabotna (lower) Members. The upper member consists of interbedded very fine-
to medium-grained, friable, micaceous sandstone and non-calcareous, dark gray or yellow- to red-
mottled shale or mudstone with interbeds of lignite and siltstone. The lower member consists
primarily of sandstone/micaceous sandstone but also contains some shale, claystone, fine-grained
sandstone and conglomerate beds. City Well #3, which is located about 1,100 feet downgradient
from the site source area, is screened from 130 feet bgs to 312 feet bgs in productive reworked
sandstone of the Dakota Formation.
Cross sections from the 1998 Remedial Investigation Report are provided in Attachment A.
The water table is found at approximately 25 to 30 feet bgs. According to the 1998 Remedial
Investigation Report, the hydraulic gradient observed is approximately 0.0067 feet per foot
between monitoring wells AC-112 and AC-106 (north of manufacturing plant and screened
across perched water). Groundwater levels measured in wells screened in the aquifer indicate
that groundwater appears to flow to the east-southeast at a gradient of 0.0027 feet per foot
between AC-155 and AC-143. A 2004 pumping test, which seems appropriately interpreted,
suggests a hydraulic conductivity of 36 feet per day for the upper sand aquifer (a 13 foot saturated
thickness above the clay found at approximately 42 feet bgs). Hydraulic conductivities measured
at the nearest city wells are known to be up 250 feet per day (from the 1998 Remedial
Investigation Report reference to “Report on Riverfront Well Field and Zenith Water Treatment
Plant for the City of Sioux City, IA, July 1984).
2.4.3 SOIL CONTAMINATION
The ESAs and investigations attempted to delineate the source area soil contamination. Field
sampling techniques primarily included head space analysis and laboratory analysis of direct-
push soil samples from various depth intervals. The most comprehensive event occurred in 1998
and included direct-push sampling from 28 locations at four 5-foot depth intervals. All samples
were subject to head space analysis for VOCs, and 15 percent (%) of the samples were subject to
laboratory analysis for VOCs. For Potential Source Area #1, soil contamination appeared to be
highest between 10 feet bgs and the water table. Total CVOC concentrations above 1,000

9
micrograms per kilogram (µg/kg) were limited to a 100-foot long area just south of the railroad
tracks. These elevated soil concentrations were delineated horizontally except to the south and to
the southeast. Maximum detected CVOC concentrations were as follows:
Trichloroethene (TCE) – 6,060 µg/kg
Tetrachloroethene (PCE) – 3,890 µg/kg
1,1,1-Trichloroethane (1,1,1-TCA) – 380 µg/kg
1,1-Dichloroethane (1,1-DCA) – 150 µg/kg
cis-1,2-Dichloroethene (cis-1,2-DCE) – 80.8 µg/kg
1,1-Dichloroethene (1,1-DCE) – 57.6 µg/kg
1,1,2-Trichloroethane (1,1,2-TCA) – 11 µg/kg
Methylene chloride – 9.8 µg/kg
Vinyl chloride – 1.4 µg/kg
For Potential Source Area #2, soil contamination appeared to be highest in the upper 10 feet bgs.
Soil contamination was reasonably delineated horizontally and vertically. Maximum detected
CVOC concentrations were as follows:
PCE – 660 µg/kg
TCE – 9.7 µg/kg
1,1-DCA – 7.6 µg/kg
1,1-DCE – 2.7 µg/kg
Methylene chloride – 1.4 µg/kg
2.4.4 SOIL VAPOR CONTAMINATION
In addition to the head space analysis conducted on direct-push soil samples (see Section 2.4.3),
limited soil gas sampling was conducted in 2004 by HDR associated with a butane stimulation
pilot study but was generally not informative with respect to delineating soil vapor contamination.
The sampling was completed in Potential Source Area #1 at five locations upgradient,
crossgradient, and downgradient of system injection points. The samples were taken at each
location on two dates (one with the butane biostimulation system operating and one with the
system off). No conclusions could be made from the sampling except that VOCs were present at
all locations with higher levels in the 15 foot bgs samples versus the 25 foot bgs samples.
2.4.5 GROUNDWATER CONTAMINATION
Groundwater is contaminated with the same CVOCs that were detected in soil. Groundwater
concentrations are highest in wells AC-155, AC-223 and AC-226 in the vicinity of Potential
Source Area #1. Total CVOC concentrations in these shallow wells, which are screened from 25
feet to 30 feet bgs (AC-155) and 27 feet to 32 feet bgs, were above 15,000 micrograms per liter
(µg/L) in February 2011, which is of comparable magnitude to the 35,000 µg/L detected during
the RI in 1998. From this area groundwater contamination has spread to the east-southeast and
progressively deeper. The current extent of groundwater contamination is depicted in Figures 5
and 6 from the February 2011 Baseline Groundwater Sampling Report. At its furthest detected
downgradient extent, the groundwater plume extends to more than 130 feet deep in City Well #3.
Low concentrations of 1,1-DCA and cis-1,2-DCE in City Well #3 have resulted in the well being
taken offline as a supply well for the city. There are no wells screened in the lower Noah Creek
Formation onsite near the HCS to determine if CVOC impacts are deeper than 65 feet bgs.

10
Groundwater sampling has included multiple rounds of sampling from site monitoring wells and
218 direct-push samples in which the head space was analyzed on-site for CVOCs. This
additional sampling is described in the 1998 Remedial Investigation Report and does not have the
data quality of laboratory analyses, but the data generally support the sources of contamination
described above.
2.4.6 SURFACE WATER CONTAMINATION
The surface water of the Missouri River is not sampled as part of remedial activities.
2.4.7 OTHER EXISTING INFORMATION
No additional data are reported here.

11
3.0 DESCRIPTION OF EXISTING OR PLANNED REMEDIES
3.1 REMEDY AND REMEDY COMPONENTS
In September 2004, GM and the Iowa DNR entered into a Consent Order (2004-HC-06) agreeing
to the following actions:
Implement a hydraulic control system on the downgradient site boundary.
Implement a butane biostimulation system, or variation thereof, in the suspected source
area.
GM will continue to pump and discharge City Well #3 until contaminant levels in that
well are less than 20% of statewide standards.
Submit an Operation and Maintenance (O&M) Plan for the remedial actions.
Currently, the operating systems at the site include a HCS and operation of City Well #3 as a
recovery well that discharges water to the Missouri River.
3.1.1 HCS
The HCS consists of 11 recovery wells (6 “shallow” wells and 5 “deep” wells) located along the
southern half of the eastern site boundary that were installed and began operation in December
2006. The recovery wells have 5-foot screens at approximately 40 feet bgs in the shallow aquifer
and 52 feet bgs in the deep aquifer. The shallow and deep screen intervals are separated by a clay
lens. The HCS extracts groundwater and discharges the water directly to the publicly owned
treatment works (POTW). The design flow rate, based on groundwater modeling, is 51 gallons
per minute (gpm) as interpreted from Table 2.3 of the 2007 O&M Plan. The well locations
(designated with an RW) are depicted in Figure 1 of the 2011 Baseline Sampling Event (see
second figure of Attachment A). The HCS was originally designed to include 18 wells with a
total pumping rate of 60 gpm, but the wells installed in the northern part of the original system
produced very little water even after several development approaches. Extraction in the southern
wells was increased based on modeling simulations to partially compensate for the absence of the
northern wells in the final system.
Wells and pumps have had fouling issues because of iron and biological growth. Based on the
2009 actual pumping data, the HCS pumping is about 42 gpm from 9 of 11 wells because RW-3S
and RW-8S have been off line since early 2009 due to fouling.
3.1.2 CITY WELL #3
City Well #3 was taken off-line as a supply well and was converted to a recovery well in 2001
that discharges water directly to the Missouri River. The well was operated at up to 1,000 gpm to
capture contaminated water and divert it to the Missouri River to protect other supply wells in the
vicinity, but extraction rates declined to below 200 gpm by the end of 2010. City Well #3 is

12
screened from approximately 130 feet to 312 feet bgs. USEPA reports there was an agreement
between GM and the City to lease Well #3 for pumping and discharging to protect other wells
from CVOC migration. Well #4 was also in the agreement to be used if required to enhance
hydraulic control, but Well #4 has not shown CVOC impacts from the site. USEPA received
authorization from Iowa DNR dated March 24, 2011 that allowed continuing discharge of City
Well #3 only to the stormwater ditch at a rate up to 1,000 gpm. City Well #3 was inundated by
flooding of the Missouri River in the Spring of 2011, which caused the well and pump to become
inaccessible and inoperable. It cannot be determined if the well can be refurbished or will need to
be replaced until the flood waters recede enough to make the well accessible. At the optimization
site visit, it was estimated that City Well #3 will not become accessible until at least September
2011 and as of the completion date of this report, City Well #3 was still not accessible. The well
location is depicted in Figure 2 of the 2011 Baseline Sampling Event (see second figure of
Attachment A).
3.1.3 SOURCE AREA REMEDIES
Other remedies tested at the site include a butane biostimulation pilot system and a soil vapor
extraction (SVE) pilot test. Neither technology is currently operating at the site. The butane pilot
system effectiveness was unknown (December 2004 Memorandum from Steven D. Acree). The
SVE system was piloted in 2004 and provided meaningful information. The test showed good
radius of influence (ROI) and CVOC removal. The tests used wells installed near AC-155
screened at two five foot depth intervals (10 feet to 15 feet bgs and 20 feet to 25 feet bgs) in the
vadose zone. Each well produced 10 to 20 standard cubic feet per minute (scfm) at about 45
inches of water column (H2O) vacuum. The deep well test showed high induced vacuum at 30
feet from the extraction point while the shallow test showed lower but measurable induced
vacuum at the same distance. The CVOC concentrations extracted from both tests were elevated,
especially at the shallow test well where concentrations were detected over 60 ppm
(approximately 250,000 micrograms per cubic meter [µg/m3] assuming an average molecular
weight of 100 grams per mole for CVOCs) when the blower was operated at 100% of capacity.
3.2 REMEDIAL ACTION OBJECTIVES AND STANDARDS
The Remedial Action Objectives (RAOs) from the Iowa DNR ROD of May 14, 2001 are:
Prevent ingestion of groundwater containing contaminants from the site above drinking
water standards.
Prevent leaching of contaminants from soil that would preclude achievement of the above
objective.
Attempt to keep all site-related contaminants out of the city wells.
The groundwater COCs at the site include:
1,1-Dichloroethene (1,1-DCE)
trans-1,2-Dichloroethene (trans-1,2-DCE)
cis-1,2-Dichloroethene (cis-1,2-DCE)
1,2-Dichloroethane (1,2-DCA)

13
1,1-Dichloroethane (1,1-DCA)
Tetrachloroethene (PCE)
Trichloroethene (TCE)
1,1,1-Trichloroethane (1,1,1-TCA)
1,1,2- Trichloroethane (1,1,2-TCA)
Vinyl chloride
Primary focus is on the cleanup of 1,2-DCA, 1,1-DCE, cis-1,2-DCE, trans-1,2-DCE, 1,1,1-TCA,
PCE and TCE.
Groundwater standards for the chemicals of potential concern (COPC) included in the ROD are
shown in Table 3.1 below.
Table 3-1. Groundwater Standards
Chemical of Concern Remediation Level*
(µg/L)
PCE 5
TCE 5
cis-1,2-DCE 70
trans-1,2-DCE 100
Vinyl chloride 2
1,1-DCE 7
1,1,1- TCA 200
1,1- DCA 140
1,2-DCA 5
1,1,2-TCA 5
* IDNR standard
The site team received a one-year agreement for the discharge of water from the HCS to the
POTW from the City dated July 21, 2011. Item 2 of the agreement conditions states that the
POTW is a temporary method of water disposal and that “under no circumstances will said permit
be extended for a period of more than a total of five (5) years, assuming all other conditions are
met.” The discharged water is sampled monthly. Total CVOCs in 2009 were about 517 µg/L in
the HCS water. This is below the typical industrial pretreatment limit of 2,130 µg/L total toxic
organics.
The site team reports that the city discharges City Well #3 effluent directly to surface water
without treatment. USEPA received authorization from the DNR on March 24, 2011 to continue
discharge of up to 1,000 gpm from this well. The total CVOC discharge concentration from this
well based on April 2009 sampling was about 59 µg/L.
The Consent Order between GM and the Iowa DNR included criteria to shut down the HCS, but
this Consent Order does not apply to USEPA and new shutdown criteria need to be established by
EPA. For reference, the shutdown criteria in the Consent Order are as follows:
Concentrations of contaminants originating from the site in groundwater remain below
statewide standards at site boundary monitoring wells for a period of at least one year.
Contaminants originating from the site have not been detected in water from active RWs
at concentrations less than 50% of statewide standards for a period of at least one year.

14
For a period of at least one year, no contaminant originating from the site has been
detected in water from any active city water supply well at a concentration less than 20%
of its statewide standard.
No concentration of a contaminant originating from the site greater than 0.5 parts per
billion (ppb) has been identified in the influent to the Sioux City Water Treatment Plant
for a period of at least one year.
There is no compelling evidence, such as increasing trends in contaminant concentration,
which suggest compliance with the above would not be achieved in the future.
Individual recovery wells may be shut down when contaminant concentrations remain below 50%
of statewide standards for a year provided the overall hydraulic effectiveness of the system is not
impaired.
The Iowa DNR 2001ROD estimated a time frame of 18 years of HCS operation to achieve the
RAOs. At that time the HCS pumping rate was assumed to be 900 gpm with five wells at the
downgradient site boundary and one in the source area. The optimization evaluation team is not
aware of any formal updates to the estimate provided in the Iowa DNR 2001 ROD. It is noted that
the current actual total pumping rate is less than 5% of the pumping rate assumed in the Iowa
DNR 2001 ROD, and that there are no wells in the source area. The difference is primarily due to
site-specific information that became available after the Iowa DNR 2001 ROD was prepared.
This note is included to clarify an apparent discrepancy of the remedy summarized in this
document and the remedy described in the Iowa DNR 2001 ROD. It is not intended to imply a
lack of effectiveness or appropriateness of the existing remedy.
3.3 PERFORMANCE MONITORING PROGRAMS
EPA has tasked HGL with conducting semi-annual sampling at 45 monitoring wells (includes
HCS sentinel wells), the 11 recovery wells and 7 city wells. Well samples are analyzed for
CVOCs. The next sampling round is scheduled for August 2011. In addition, monthly HCS
effluent samples are taken for analysis for CVOCs to meet the minimum sampling requirements
of the POTW.

15
4.0 CONCEPTUAL SITE MODEL (CSM)
This section discusses the optimization team’s interpretation of existing characterization and
remedy operation data to explain how historic events and site characteristics have led to current
conditions. This CSM may differ from that described in other site documents.
4.1 CSM OVERVIEW
The shallow groundwater CVOC concentrations indicate that the main contamination source area
is Potential Area #1 in the north end of the parking lot to the west of the main site building (see
last figure of Attachment A). No specific infrastructure in this area (e.g., tanks) was present in
this area to suggest a cause for the release. One potential explanation could have been dumping,
rinsing, or handling of spent solvent containers just to the west of the former propane storage area
from where the solvent could have accumulated in the depressed area and infiltrated to shallow
groundwater. Once in shallow groundwater, the CVOCs migrated to the east/southeast and to
greater depths as they were influenced by pumping from City Well #3 and the other municipal
supply wells. Reductive dechlorination of the contamination is occurring (either naturally or
partially due to the butane stimulation), but degradation appears to be stalling prior to reaching
non-toxic products and overall CVOC concentrations are still high. Residual contamination in
the unsaturated and saturated soil of the source area continue to result in total CVOC detections
above 20,000 µg/L in the source area after more than 13 years of sampling. Under current
conditions and remedial activities, source area concentrations and the downgradient plume will
likely not reach cleanup goals for many decades.
Though the more concentrated CVOCs have migrated below the shallow groundwater before
passing beneath the facility’s main building, elevated CVOC concentrations are still present near
the water table, and VI in the facility building and possibly downgradient structures could be an
issue. The presence of CVOCs in the low permeable material between the upper and lower
DeForest Formation beneath the building will pose a challenge to site remediation.
Historically, the CVOC contamination migrated off-property to the east where the groundwater
flow direction turns south to southeast as a result of the municipal water supply well operation at
the Riverside Park Well Field. Contamination is intercepted by City Well #3 at detectable
concentrations. The CVOC concentrations detected at City Well #3 were generally substantially
lower than those measured in monitoring wells near the property boundary because the majority
of the 100 gpm to 1,000 gpm extracted by City Well #3 was clean water from a much more
productive portion of the subsurface. That is, there were likely depth intervals of contamination
with substantially higher concentrations than the concentration detected in City Well #3 but
because of dilution from extracting clean water, much lower concentrations were detected in City
Well #3. The change in groundwater flow direction to the south and southeast due to water
supply pumping make it unlikely that contamination that can be linked to the site is present
further to the east or northeast of City Well #3. City Well #3 was inundated by flooding of the
Missouri River in the Spring of 2011, which caused the well and pump to become inaccessible
and inoperable. It cannot be determined if the well can be refurbished or will need to be replaced
until the flood waters recede enough to make the well accessible.

16
HCS operation has been generally effective at capturing the core of the detected plume.
Concentrations dropped substantially when HCS operation began, and by April 2009,
concentrations of each CVOC were approaching cleanup standards at the HCS sentinel wells.
These concentration trends are generally consistent with the groundwater flow modeling and
particle tracking that was done during design. Small gaps in capture that might also (or
alternatively) contribute to low level concentrations at the HCS sentinel wells can be explained by
periodic underperformance of the HCS due to fouling. Concentration trends at City Well #3
suggest that continued operation of the HCS under improved operating conditions might allow
the portion of the aquifer downgradient of the HCS to cleanup in a few years if HCS operation is
maintained at a suitable level of performance. Due to the temporary nature of the agreement to
discharge to the POTW, continued long-term use of the HCS will require capital expense to treat
and discharge the water elsewhere.
The contaminant plume is well delineated to the south. Contamination appears to be present
north of the extraction system as far north as the AC-163/AC-164 cluster. Recovery wells
installed north of the existing extraction system had poor yields and were not included in the
system. The flux of contamination north of the extraction system is likely low. Contaminant
migration might be diverted south toward the extraction network by low permeability material to
the north. Contamination has not been delineated vertically in groundwater at the site boundary.
Given the regional pumping in the bedrock, there may be significant vertical gradient that results
in downward contaminant migration prior to the HCS wells.
4.2 CSM DETAILS AND EXPLANATION
4.2.1 SOURCE AREA EXTENT AND CONCENTRATIONS
Potential Source Area #1, which is located at the north end of the parking lot on the west side of
the facility building (see last figure in Attachment A), has the highest CVOC concentrations in
shallow (25 feet to 32 feet bgs) groundwater. Total VOC concentrations exceeded 15,000 µg/L
within an area bounded by monitoring wells AC-155, AC-223 and AC-226 in February 2011.
These three monitoring wells form a triangular area with approximately 150-foot long sides. The
nearest shallow wells to this triangle are about 150 feet east (AC-220), 300 feet west (AC-152),
and 400 feet south (AC-149). The north side is limited by railroad tracks and the steep bluff
within 100 feet. Total CVOC concentrations were less than 70 µg/L in monitoring well AC-152
and not detected (ND) in monitoring well AC-149. Total CVOC concentrations were detected at
767 µg/L in monitoring well AC-220 and greater than 2,500 µg/L in monitoring well AC-221.
Monitoring well AC-220 is to the east (downgradient) of the triangle, and monitoring well AC-
221 is the next deeper well at the same location (screened from 41 to 46 feet bgs). The source
area extent would need to be better characterized for remediation.
In Potential Source Area #1, PCE and TCE are the CVOCs with the highest concentrations in soil
samples, and 1,1,1-TCA and 1,1-DCA are the CVOCs with the highest concentrations in
groundwater. 1,1-DCA and cis-1,2-DCE (degradation products of 1,1,1-TCA and TCE,
respectively) have the highest concentrations downgradient of the source area. Vinyl chloride
(degradation product of cis-1,2-DCE) is also present, but generally at concentrations that are an
order of magnitude or more lower than the cis-1,2-DCE concentrations. Chloroethane
(degradation product of 1,1-DCA) is generally not detected. These results suggest that significant
reductive dechlorination of TCE and 1,1,1-TCA are occurring in groundwater but may be stalling
prior to reaching the next step of degradation. Although butane stimulation may play a role in the

17
observed degradation, 1,1-DCA and cis-1,2-DCE have been the primary CVOCs observed in City
Well #3 for some time, suggesting that the observed level of dechlorination may be naturally
occurring.
The subsurface material in the source area includes sands, silts, and some clay. Groundwater
concentrations as high as 35,000 µg/L have been present in this area for at least two decades,
allowing time for contamination to diffuse into the relatively immobile zones of the finer grain
material. Diffusion is proportional to the concentration gradient and has therefore been relatively
high. As groundwater is restored in the more permeable portions of the subsurface,
contamination will diffuse back into the more permeable portions causing contaminant
concentrations to remain elevated above standards. It is unclear if non-aqueous phase liquid
(NAPL) is present.
4.2.2 VAPOR INTRUSION
Based on shallow groundwater total CVOC concentrations at AC-220, soil vapor (if it is in
equilibrium with shallow groundwater under the facility structure) may be above VI guidance
levels. Equilibrium at 15 degrees Celsius for AC-220 PCE at 60 µg/L in groundwater is 15,780
µg/m3 compared to OSWER 2002 Draft Subsurface Vapor Intrusion Guidance soil gas
concentration of 810 µg/m3 for a 10
-4 increased cancer risk.
4.2.3 HCS CAPTURE
Sentinel wells AC-204, AC-205, and AC-207 have similar screened intervals to the shallow
recovery wells (RW-S), and AC-206 and AC-208 have similar screened intervals to the deeper
recovery wells (RW-D). These sentinel wells are located about 200 feet downgradient of the
HCS and upgradient of the municipal drinking water wells, and should indicate the effectiveness
of the HCS in preventing lateral migration of CVOCs in the deep and shallow aquifers to the
municipal drinking water wells. The sentinel wells are not screened to assess whether or not
CVOCs are migrating beneath the HCS recovery wells (i.e., in the Noah Creek Formation).
Cross-sections A-A’ and B-B’ (Remedial Investigation Figures 5.6 and 5.7, see Attachment A)
suggest permeable layers are present beneath 60 feet bgs. Cross-section D-D’ (Remedial
Investigation Figure 5.9, see Attachment A), which is located along the axis of the plume, does
not have sufficiently deep borings to confirm or deny the presence of permeable layers below 60
feet bgs. Cross-Section C-C’ suggests only clay and shale/siltstone bedrock are present below 60
feet bgs, but the subsurface is heterogeneous and this interpretation is based on two boring
locations that are more than 1,000 feet apart. The relatively permeable layers indicated on cross-
sections A-A’ and B-B’ are interpreted from geological borings and water quality data are not
available from these wells.
Capture of the CVOCs in the upper and lower DeForest Formation (by RW-S and RW-D wells,
respectively) should result in decreasing concentrations in the sentinel wells. If the HCS is
capturing the CVOC plume, clean water will come around the edges of the HCS and flow through
the sentinel wells, resulting in lower concentrations at the sentinel wells. Assuming a hydraulic
conductivity of 36 feet per day, a hydraulic gradient of approximately 0.0027 feet per foot, and an
effective porosity of 0.25, the groundwater velocity is approximately 140 feet per year, perhaps
slower when retardation due to chemical and physical transport processes are considered and
perhaps faster if the effective porosity is lower due to clay lenses. Concentration decreases at the
sentinel wells were observed relatively quickly after HCS operation began, and rebound occurred

18
relatively quickly after HCS flow was reduced due to the shut down of RW-3S and RW-8S and
potentially fouling in other wells after 2009.
From the HCS start in December 2006 to April 2009 CVOC concentrations decreased
significantly in all of the sentinel wells (AC-204: -69%; AC-205:-93%; AC-206:-97%; AC-207:-
96%; AC-208: -83%). Charts of the concentration trends of these wells are provided in
Attachment B. Note that the total CVOC concentration is plotted and that a significant portion of
the total CVOC concentration is 1,1-DCA for which the Iowa Standard is 140 µg/L and cis-1,2-
DCE for which the Iowa Standard is 70 µg/L. Therefore, concentrations in 2009 were closer to
remedial standards than may be apparent at first glance. The most gradual decline was observed
in sentinel well AC-204, which is the northernmost shallow sentinel well. The gradual decline
could be the result of slower groundwater flow in this portion of the aquifer due to lower
permeability material. There also may be relatively small contaminant flux migrating around the
HCS to the north.
Total CVOC concentrations rebounded significantly in sentinel wells AC-204, AC-206 and AC-
208 (+378%, +361% and +266%, respectively) in the February 2011 sampling results compared
to April 2009. Recovery wells RW-3S and RW-8S were taken off-line during this time, which
would have decreased the effectiveness of the HCS. Not pumping at RW-3S (with no co-located
well for deep aquifer pumping) could explain the CVOC concentration increase at AC-204. In
addition, the site team reports that water recovered at other wells may have discharged through
the inoperable pump at RW-3S from 2009 through 2011. The increases at AC-206 and AC-208
and the lack of rebound at the shallow co-located wells AC-205 and AC-207 could be due to
deeper contamination migrating past the HCS due to lower total flows during the period from
2009 to 2011.
The four recovery wells located at the south end of the HCS (RW-9D, RW-10S, RW-10D, and
RW-9S) account for over half of the groundwater that is extracted but make a minimal
contribution to mass removal. However, as suggested by modeling during design (Draft
Remedial Action Plan, HDR, 2004), these wells may be instrumental in plume capture by
enhancing the southerly flow of groundwater such that the more northern HCS wells can more
effectively capture the plume.
4.2.4 CITY WELL #3
The shallow aquifer has a hydraulic conductivity of approximately 36 feet per day, and the
bedrock screened by the city wells has a hydraulic conductivity that is reportedly as high as 250
feet per day. In addition, the HCS was designed to extract 51 gpm (it actually extracts less due to
fouling) and most of the city wells each pump well over 300 gpm. City Well #3 previously
pumped as much as 1,000 gpm. It is reasonable to expect that the contaminated water that has
historically reached City Well #3 comprises only a small fraction (perhaps 10% or less) of the
water extracted by City Well #3 accounting for perhaps an order of magnitude dilution between
the highest concentrations in the vicinity of City Well #3 and the water sampled from City Well
#3 when it is operating.
Total CVOC concentrations at City Well #3 were about 26 µg/L in the February 2011 sampling.
This indicates a continued decrease from April 2009 (59 µg/L) and January 2007 (121 µg/L)
levels, potentially indicating that the HCS was relatively effective in the 2007 to 2009 time
frame. A chart of the 1,1-DCA concentration trend in City Well #3 since 2000 is included in
Appendix C. The chart shows an initial decrease in 2001 when the well began operating

19
continuously for remediation purposes and then another decrease in 2008 due to the operation of
the HCS, which began in 2006. Because of reduced pumping since 2009 (and absence of
pumping during the Summer of 2011), there is some concern that the decreasing concentration
trend will not continue, but this will be temporary if HCS performance can be restored.
Furthermore, the temporary concentration increases may not fully rebound to levels that result in
exceedances of drinking water criteria.
4.3 DATA GAPS
The following data gaps are relevant to site remediation:
The source area extent is not adequately defined to target source area remediation. The
extent of the area with total CVOC levels in shallow groundwater and soil representing a
source area around AC-155, AC-223 and AC-226 should be further defined so that a
scope and cost for implementing “source area” mass removal can be better defined.
It is not known if 1,4-dioxane is present at the site.
The potential for human exposures to soil vapors is uncertain.
The potential for contamination to migrate beneath the HCS or around the northern extent
of the HCS is uncertain.
The CVOC concentrations at the property boundary that would reliably result in
concentrations below MCLs at City Well #3 are not known.
The condition and future use of City Well #3 is uncertain.
4.4 IMPLICATIONS FOR REMEDIAL STRATEGY
Once the CSM data gaps are filled, the remedial strategy can be better defined.
Although site documents suggest that soil contamination does not pose a risk to human
health at the site, soil contamination could continue to serve as a source of groundwater
contamination and soil vapor contamination and therefore should be remediated.
The cost for source area remediation cannot be reasonably estimated until the source is
better characterized. The known extent of the source area, however, is relatively large
and consists of both soil and groundwater contamination, some of which may be bound in
relatively low permeable material (e.g., the clay layer separating the upper and lower
DeForest Formation) in or immediately downgradient of the source area. The cost for
source area remediation will therefore require a significant expense. Although some
remedial technologies may remove mass more aggressively (e.g., excavation and in situ
thermal remediation), remediation of an area of this size with these technologies could
cost several million dollars, and achieving results that prevent further active remediation
is not guaranteed. A source area of this size and nature may be better suited to remedies
such as SVE, air sparging (AS), in situ chemical oxidation (ISCO), and enhanced

20
reductive dechlorination (ERD). These technologies also remove substantial mass, are
less capital intensive, and have the infrastructure in place to address contamination that
may remain after initial operation. Site conditions appear to favor reductive
dechlorination, but reductive dechlorination could complicate operation of the HCS.
Section 6.4 of this report includes further discussion of remedial options for this site.
Capital expenditures to provide HCS treatment, capital expenditures to refurbish City
Well #3, and continued operation of the HCS and City Well #3 will compete with source
area remediation for funds. Effective source area remediation should shorten the duration
of HCS operation. Effective source area remediation and/or effective HCS operation is
important for allowing the downgradient plume to be restored.
There are likely contaminant concentrations above cleanup levels at the property
boundary that would allow the city supply wells to reliably extract water that meets
standards without HCS operation. Determining these concentrations and establishing
them as the shutdown criteria for the HCS could lead to an alternate exit strategy if
acceptable to site stakeholders.
If a VI mitigation system is needed, it could be tied into a source area SVE system to
minimize costs.

21
5.0 FINDINGS
5.1 GENERAL FINDINGS
The optimization team observed that the active remedy components are operated by capable and
organized operators. The observations provided below are not intended to imply a deficiency in
the work of the system designers, system operators, or site managers but are offered as
constructive suggestions in the best interest of the USEPA and the public. These observations
have the benefit of being formulated based upon operational data unavailable to the original
designers. Furthermore, site conditions and general knowledge of groundwater remediation have
changed over time.
5.2 SUBSURFACE PERFORMANCE AND RESPONSE
5.2.1 PLUME CAPTURE
As discussed in Section 4.0, plume capture provided by the HCS is likely effective when the HCS
is operating in optimal condition. Plume capture has not been provided since 2009 or earlier due
to the reduced operating capacity of several recovery wells. However, since taking over the site
in April 2011, USEPA has replaced pumps, valves, and piping to bring the system back to full
operation, and with this current level of operation, the optimization team believes HCS capture is
likely effective. However, insufficient information is available to determine if some
contamination is migrating beneath or around the northern end of the HCS. City Well #3 appears
to have been effectively protecting other municipal supply wells in the area. If operable,
operation of City Well #3 is appropriate for a few more years until contamination between the
HCS and City Well #3 is flushed from the groundwater system. Because City Well #3 was
inundated by the flood, it is unclear if it will continue to operate.
5.2.2 GROUNDWATER CONTAMINANT CONCENTRATIONS
The area including wells AC-155, AC-223 and AC-226 (and potentially extending to the north,
west, and south) has elevated CVOC concentrations in shallow groundwater that are not
decreasing. Total CVOC concentrations in these wells in the February 2011 sampling event were
17,811 µg/L, 25,835 µg/L and 21,982 µg/L, respectively. Total CVOC concentrations at the
HCS wells vary from 26 µg/L to 3,101 µg/L and indicate relatively effective plume capture when
operating at or near design capacity.
Total CVOC concentrations at City Well #3 were about 26 µg/L in the February 2011 sampling
event. City Well #2 is the only other production well that had CVOC impacts (0.59 µg/L 1,1
DCA) in the February 2011 sampling. Well #2 is 800 feet further east-southeast (downgradient)
from City Well #3 and the site.

22
5.3 COMPONENT PERFORMANCE
5.3.1 GROUNDWATER EXTRACTION SYSTEM
The HCS recovery wells are outfitted with Grundfos Redi-Flo 3 pumps with 0.33 horsepower
(HP) variable speed drive motors in 9 wells and 0.5 HP variable speed drive motors in two wells
(RW-9S and RW-10S only). All motors are running at full capacity except at recovery well RW-
9S, which is the highest producing well (over 10 gpm). The wells also have high and low set
points to start and stop the pumps. A 1 ¼-inch diameter AquaPEX (PEX) flexible tube is run in
4–inch diameter polyvinyl chloride (PVC) conduit to each well. The PEX is designed to be
pulled and replaced when necessary because of fouling.
HCS operation includes monthly site visits and remote daily status checks using PC-Anywhere.
The system also has an autodialer to alert the operators of power outages, high well levels or a
pump control fault; autodialer call-outs are rare.
System maintenance since the December 2006 startup has included cleaning the line to one well
and rehabilitating the wells once. Because of the GM bankruptcy, system maintenance has been
reduced since 2009. Recovery wells RW-3S and RW-8S have not been operated since early 2009
because of pump intake fouling. Recovery well RW-7S was operated in 2009 at 50% of its
design flow rate. These wells and others may be in need of redevelopment, rehabilitation, or even
replacement. The site team did not provide post-2009 flow rate data, specific capacity
measurements, or any other information on system conditions resulting in restricted flow. Since
taking the site lead in April 2011, USEPA has focused on rehabilitating the HCS wells, pumps,
and piping.
Table 5-1 shows each recovery well with design and 2009 flow rates and total CVOCs in 2007,
2009, and early 2011 (prior to EPA’s rehabilitation efforts).
Table 5-1. HCS Flow Rates and Concentrations
Well
Modeled
Pumping
Rate (gpm)1
Actual Pumping
Rate – 2009 (gpm)
Total CVOC
Concentration
(µg/L)
January 2007
Total CVOC
Concentration
(µg/L)
April 2009
Total CVOC
Concentration
(µg/L)
February 2011
RW-3S 2 No pumping after
Jan.2009 863 423 Not sampled
RW-5D 5 4.8 779 588 1033
RW-6S 2 1.8 3183 1864 3101
RW-7S 2 1.0 4990 4820 1106
RW-7D 5 5.2 837 829 1977
RW-8S 2 No pumping after
March 2009 1675 1725 Not sampled
RW-8D 5 4.9 1112 318 456
RW-9S 10 10.7 894 425 80
RW-9D 5 5.6 442 6 29
RW-10S 8 2.6 313 18 28
RW-10D 5 5.2 107 8 26
TOTAL 51 41.8 - - - 1 HDR O&M Plan 2007

23
The total CVOC mass removed by the HCS in 2009 was estimated to be 94.68 pounds,
with a total removal estimate of 377.73 pounds since system operation began in
December 2006.
At an assumed rate of 300 gpm (consistent with recovery rates in 2008 and 2009) and a
total CVOC concentration of 26 µg/L (February 2011 data), City Well #3 would remove
34.2 pounds per year if it were to continue operating.
5.3.2 WATER DISCHARGE
The water pumped from the HCS wells is discharged directly without treatment to the POTW.
USEPA has an agreement with the City to accept this discharge for up to 5 years with a current
maximum flow limit of 50 gpm. The discharged water is sampled monthly. Total CVOCs in
2009 were about 517 µg/L in the HCS water. This is below the total organic compound
requirement identified in the agreement.
The site team reports that the city discharges City Well #3 effluent directly to the Missouri River
without treatment with authorization from Iowa DNR.
5.4 REGULATORY COMPLIANCE
The site team did not report and regulatory compliance issues related to effluent discharge, but no
discharge agreements or permits are in place.
5.5 COMPONENTS OR PROCESSES THAT ACCOUNT FOR MAJORITY OF
ANNUAL COSTS
Annual cost estimates for operating the remedy are summarized below based on information
provided by the site team for typical actual costs while the system was operated by HDR for GM
and/or estimated by the optimization evaluation team based on discussions with the site team. As
discussed in the following sections, some of these costs may change under USEPA lead.
Table 5-2. Annual Operating Costs
Item Description Approximate Annual Cost
Project Management $40,000
HCS Operations and Maintenance $36,000
Well Sampling and Analysis $71,000
HCS Electricity and Phone $6,000
City Well Power $130,000
City Well Maintenance $150,000
POTW Fee $60,000
Total Estimated Annual Cost $493,000
Additional details regarding these items are provided below.

24
5.5.1 CITY WELL POWER AND MAINTENANCE
The site team reported pumps with 150 HP motors in both City Well #3 and #4. The $130,000
power costs per year were provided by the previous consultant and are consistent with 2,600,000
kilowatt-hour (kWh) per year at a cost of $0.05 per kWh (consistent with the average price of
electricity for industrial facilities in Iowa, www.eia.gov). This electricity usage is equivalent to
City Well #3 and City Well #4 running at 75% efficiency, 100% load and $0.05/kWh. The
electricity usage and cost for City Well #3 only should be approximately 1,300,000 kWh and
$65,000, respectively. When the wells can be operated, City Well #3 is pumped and discharged
to surface water. The site team reports that City Well #4 has not been operated for plume
recovery and discharge. The basis for the $130,000 is unclear. USEPA Region 7 reports that
these costs may be substantially reduced with USEPA responsible for the remedy.
The site team reports an annual maintenance cost of $150,000. This is elevated for one well (City
Well #3) discharging to surface water and one well not being operated. The optimization team
assumes that this was part of an agreement between GM and the City. USEPA Region 7 reports
that these costs may be reduced with USEPA responsible for the remedy.
5.5.2 HCS UTILITIES
The site team reported a cost of about $5,000 per year for power and $1,000 per year for
telephone (autodialer) service at the HCS. The 4 HP of connected pumps operating at 60%
efficiency (reasonable estimate for small motors) and 100% load yields about 44,000 kWh per
year. At $0.075 per kWh (average price for electricity for commercial facilities in Iowa,
www.eia.gov), this translates to an annual cost of $3,300 per year. Costs for heating, lights and
controls likely makes up the difference.
5.5.3 POTW FEES
The site team reported a unit rate of $0.00221 per gallon plus about $100 in laboratory analytical
fees per month to discharge the HCS water to the POTW, yielding a cost of about $50,000 for 42
gpm (2009 HCS flow rate) or $60,000 for the design flow rate of 51 gpm.
5.5.4 LABOR
The site team reported costs of $36,000 per year for system operation labor and $40,000 per year
for project management in past years. It is assumed that the same costs are a reasonable estimate
for future operations of the system in its current form under USEPA lead.
5.5.5 WELL SAMPLING AND ANALYSIS
The site team reported a cost of $28,000 for a semi-annual sampling event of a total of 63 wells
per event (45 of which are monitoring wells), excluding analysis. In the optimization team’s
opinion, this is a reasonable conservative cost for groundwater sampling.
Analysis is completed by the USEPA laboratory but based on a typical CVOC analytical cost of
$100 per sample with quality assurance sampling, the cost would be about $7,500 for each
semiannual event.

25
Based on these assumptions, the optimization team assumes that the costs include analytical
costs. The site team is planning to add analysis of 1,4-dioxane in the August 2011 sampling
event, which should increase the cost by approximately $7,500 per event in analytical costs.
5.6 APPROXIMATE ENVIRONMENTAL FOOTPRINTS ASSOCIATED WITH
THE REMEDY
5.6.1 ENERGY, AIR EMISSIONS AND GREENHOUSE GASES
The energy, air emissions, and greenhouse gas footprint of the remedy that has operated to date
has been primarily due to the electricity usage for operating the City Well #3 pump. Other
contributions include the electricity for operation of the HCS and the footprint associated with the
treatment of the discharged water by the POTW. An estimated 1,344,000 kWh of electricity is
used each year to operate the City Well #3 pump and HCS. Assuming 33% efficiency of thermal
power plants and 10% loss of electricity through transmission and distribution, this translates to
annual energy usage of approximately 15,400 million British thermal units (BTUs) per year.
Based on this electricity usage and the emissions reported by www.eia.gov for Iowa (Attachment
D), annual greenhouse gas emissions are approximately 2,500,000 pounds of carbon dioxide
equivalents and criteria pollutant emissions (i.e., nitrogen oxides, sulfur oxides, particulate
matter) are approximately 8,000 pounds per year. Hazardous air pollutants are released from the
generation of electricity and the off-gas of CVOCs discharged to the Missouri River.
5.6.2 WATER RESOURCES
The primary use of water is associated with groundwater extracted by the HCS and City Well #3.
Between the two systems, approximately 180 million gallons of water is removed from the
aquifer without beneficial use. We note that subsequent to the site visit, the site team identified a
potential local user of treated water for industrial purposes, but significant more evaluation is
needed before considering this a feasible option. City Well #3 was inundated by flooding in
2011, and its future use is unknown.
5.6.3 LAND AND ECOSYSTEMS
Land and ecosystems are not directly affected by the current operation of the remedy.
5.6.4 MATERIALS USAGE AND WASTE DISPOSAL
There is no significant use of materials or waste generation at the site with the exception of well
maintenance activities.
5.7 SAFETY RECORD
The site team did not report any safety concerns or incidents related to the remedial activities.

26
6.0 RECOMMENDATIONS
Cost estimates provided herein have levels of certainty comparable to those done for Comprehensive
Environmental Response, Compensation, and Liability Act (CERCLA) Feasibility Studies (-30%/+50%),
and these cost estimates have been prepared in a manner consistent with USEPA 540-R-00-002, A Guide
to Developing and Documenting Cost Estimates During the Feasibility Study, July 2000.
EPA is not constrained to the existing remedies at the site and has the task of conducting a FS and
formally selecting a remedy for the site in the upcoming months. This recommendation section is
therefore primarily focused on identifying remedial options and highlighting advantages and
disadvantages of those options that may be of use to USEPA during this process. Sections 6.1 through
6.3 provide initial recommendations that are independent of the discussion in Section 6.4.
6.1 RECOMMENDATIONS TO IMPROVE EFFECTIVENESS
6.1.1 ASSESS VAPOR INTRUSION RISK IN FACILITY BUILDING
Based on the CVOC concentrations in nearby shallow wells, there is potential for VI at the main site
building and the building immediately downgradient of the HCS. An investigation at the main site
building, including installation of about 10 shallow monitoring points through the slab and sampling and
analysis for CVOCs should be conducted to determine VI potential. Shallow soil vapor concentrations
could also be collected in the paved area downgradient of the HCS to evaluate soil vapor concentrations
downgradient of the HCS. This investigation should require approximately $45,000, including $10,000
for planning, up to $15,000 for a week in the field, $10,000 for laboratory analysis (paid for by the
USEPA Region laboratory), and $10,000 for reporting the findings. Additional sub-slab and indoor air
quality sampling (and potentially mitigation) may be indicated based on the initial results but that scope
and cost cannot be determined at this time.
6.1.2 ANALYZE FOR 1,4-DIOXANE
The site team has already decided that 1,4-dioxane should be added to the parameter list, which should
cost about $15,000 extra per year (assuming the same monitoring program). The optimization team
reinforces this decision because its presence will affect the development of remedial alternatives during
the FS.
6.1.3 DELINEATE MIGRATION PATH OFF-SITE AND RECOGNIZE POTENTIAL FOR
MODIFICATIONS TO CONTAINMENT REMEDY
The optimization team believes that a fully functioning HCS likely captures the plume and that continued
operation of a fully functioning HCS is an appropriate containment remedy. However, as discussed in
Section 4.2.3, it is unclear if contamination is migrating off-site beneath, or around the northern end, of
the HCS. The vertical and horizontal extents of horizontal contaminant migration is a key design factor
for containing the plume at the property boundary. Additional containment sentinel wells could be
installed as follows:
27
one co-located with AC-204 but screened within the lower DeForest Formation (e.g.,
approximately 55 to 60 feet bgs)
a cluster of two wells approximately 150 feet north AC-204, one screened in the upper DeForest
Formation and one screened in the lower DeForest formation
one deep well to approximately 80 feet bgs between the AC-204 cluster and the AC-205 cluster
one deep well to approximately 80 feet bgs between the AC-205 cluster and the AC-207 cluster
Geologic logging should be conducted for the deep well north of AC-204 and the two new deep wells to
approximately 80 feet bgs. The optimization team estimates that installation of these wells might cost
approximately $55,000 as follows: $7,500 for planning, $30,000 for drilling and other field services (e.g.,
waste disposal and surveying), $7,500 for oversight, and $10,000 for interpretation and reporting. The
wells should be added to the routine groundwater monitoring program, which would add approximately
$4,000 per year in sampling costs and $2,500 in analytical costs (paid by the USEPA Region 7
laboratory) for semi-annual sampling. The geologic logging and water quality results from this effort and
the water quality results from existing HCS sentinel wells should be evaluated over time to determine if
the HCS is adequately capturing the plume. It should be noted, however, that increasing concentrations in
the sentinel wells may occur for one year (possibly longer) as a result of the reduced performance prior to
USEPA taking over the lead. Therefore, increasing concentrations for the next year should not suggest to
USEPA that the currently operating HCS is not providing capture.
The optimization team believes that the above characterization is important regardless of whether or not
the site team decides to continue use the HCS as the containment remedy. If the above sampling confirms
that the HCS is providing adequate capture, and the HCS continues to operate, the optimization team does
not see any significant benefit from tweaking extraction rates to optimize flow, influent concentrations, or
mass removal. Changes in these parameters will not substantially change operating costs, and the main
objective of the HCS is to prevent the contamination from migrating off-site. If the above well
installation and sampling does not suggest that the HCS provides adequate capture, additional analysis
will be needed to determine where the gap in capture is occurring and the changes that would need to be
made to the HCS (or an alternative containment remedy).
6.1.4 CONSIDERATIONS FOR CITY WELL #3
When the flood waters subside and City Well #3 is accessible, USEPA will have the opportunity to assess
the condition of the well. In addition to damage from the flood, the performance of City Well #3
appeared to be declining based on available data in 2010. The causes of these declines are uncertain, and
it may be possible that the pump or well screen require additional attention for reliable operation. The
site team will have three potential options:
Discontinue pumping from this location for remediation purposes
Repair the well as needed and resume operation
Construct a new well and operate it
CVOC concentrations have decreased significantly in City Well #3 as the result of operating City Well #3
(which dilutes shallow contaminated water with deeper clean water) and HCS operation. Since 2002,
there have been two sampling events where contaminant concentrations have exceed Iowa standards:
7.5 µg/L of 1,1-DCE in June 2007

28
7.4 µg/L of 1,1-DCE and 5.1 µg/L of TCE in January 2008
For comparison, the Iowa standard for 1,1-DCE is 7 µg/L, and the Iowa standard for TCE is 5 µg/L. As
of the 2011 Baseline Sampling Event, 1,1-DCE is 1.2 µg/L and TCE is 1.5 µg/L. The other sampled
supply wells have had no exceedances since the start of sampling in 2007. Sampling data from the radial
collector well from May 2001 through April 2002 showed concentrations at least an order of magnitude
lower than City Well #3 prior to July 2001 when City Well #3 began operating as a remediation well and
decreasing concentrations thereafter. With City Well #3 turned off and recent lapses in HCS operation, it
is possible that CVOC concentrations will increase in the radial collector well, but it is unlikely that
concentrations will result in exceedances of Iowa standards. There is insufficient historical data available
at the other water supply wells to predict concentrations at City Well #2, City Well #6, or City Well #10,
but given the concentration history at City Well #3, it is possible (perhaps likely) that concentrations in
these other wells would not result in exceedances of Iowa standards if City Well #3 were to remain off.
Discontinuing remediation pumping from this location is therefore a possibility as long as a contingency
plan is available. Therefore, prior to repairing the well and/or resuming pumping, the site team might
consider a period of monthly or quarterly monitoring with a plan available to resume pumping at
relatively short notice. During this monitoring period, the site team might consider monitoring different
intervals of the well screen using passive diffusion bags (PDBs) to provide a better idea of the
concentration depth profile. The cost of this sampling would likely be on the order of $1,500 if three
depth intervals are sampled quarterly and sampling can be conducted in conjunction with other activities.
If the site team decides to operate the well, the site team could consider using a smaller pump. A 40 HP
Gould pump Model 300L40 (Attachment E) would provide the same flow at an adequate pressure for the
use of the well as part of the containment system. Operating this pump (assuming 75% motor efficiency
and 100% load) would require approximately 350,000 kWh per year. With an electricity rate of $0.05 per
kWh, this would cost $17,500 per year. Even if a higher rate of $0.075 per kWh were assessed, the cost
would be approximately $26,000 per year. The cost savings of operating this smaller pump compared to
the current pump (or equivalent replacement) is approximately$48,000 per year assuming an electrical
rate of $0.05 per kWh.
Given that the discharge agreement is limited to City Well #3 and that a similar agreement would not
likely be available for a new well, the optimization team strongly recommends using City Well #3 instead
of a new well to provide the same function.
6.2 RECOMMENDATIONS TO REDUCE COSTS
No recommendations are provided in this category that are independent of the options discussed in
Section 6.4.

29
6.3 RECOMMENDATIONS FOR TECHNICAL IMPROVEMENT
6.3.1 PREPARE AN ANNUAL REPORT
It is recommended that an annual report be prepared by EPA. Some of the content of the report will
depend on the remedy that is selected and implemented. In addition to remedy specific information, the
report should include the following:
Current and historical analytical results from groundwater monitoring
Water level measurements and potentiometric surface maps that include average pumping rates
from all remedy wells and nearby water supply wells in the month leading up to the water level
measurement events
Discussion of the concentration trends in AC-204 through AC-208, and City Well #3
Current plume configuration both in plan view (shallow and deep aquifers) and cross-section
Total monthly extracted totals from the operating wells at the Riverside Park Well Field
Revisions to the CSM based on remedy performance
The optimization team estimates that the annual report will cost approximately $20,000 per year to
prepare, including data management and analysis.
6.4 CONSIDERATIONS FOR GAINING SITE CLOSE OUT
Allowing the downgradient portion of the aquifer to clean up is a critical element to maintaining
protectiveness and achieving a cost-effective remedy, and significant contaminant mass is present
between the source area and the property boundary. For this reason, containment of contamination at the
property boundary is needed until on-site contamination is remediated to levels that require no further
active remediation. In addition, unsaturated soils remain contaminated and can serve as a continuing
source of groundwater contamination. The site remedy will therefore likely include three general
components: a source area soil remedy, a source area groundwater remedy, and a containment remedy.
There are several options each component. These various source area and containment technologies are
discussed below, along with some initial considerations regarding shutdown criteria for each active
remedy.
6.4.1 DEVELOP SHUTDOWN CRITERIA
The site should consider and develop the shutdown criteria or exit strategy for the active source area soil,
source area groundwater, and containment remedies. Knowledge of this shutdown criteria will help the
site team and vendors better evaluate various remedial approaches. The shutdown criteria for the active
soil remedy will likely be associated with the level of remaining soil concentrations that do not continue
to impact groundwater or lead to soil vapor. The shutdown criteria for the active source area groundwater
will likely be associated with the remaining source area groundwater concentrations that will attenuate
prior to reaching the property boundary or a pre-determined distance from the property boundary. The
shutdown criteria for the containment system will likely be associated with the concentrations at the

30
property boundary that will allow the plume to attenuate an appropriate pre-determined distance from the
property boundary. For example, in early 2007, the maximum CVOC concentration at the property
boundary was approximately 5,000 µg/L and the CVOC concentration at operating City Well #3 was
approximately 121 µg/L. This represents an attenuation/dilution factor of approximately 40. Following
this line of reasoning, CVOC concentrations at operating City Well #3 may drop to 12 µg/L (with each
constituent below its respective cleanup criteria) when the maximum CVOC concentration detected at the
property boundary is approximately 500 µg/L. Discontinuing one or more active remedies would not
suggest the end of remediation. Continued operation of the other remedies (if any) and monitoring of the
plume would continue. The optimization team assumes that several discussions, data analysis, and
monitoring might be required to develop this approach and assumes up to $50,000 in contractor support
might be needed over the course of the process.
6.4.2 OPTIONS FOR SOURCE AREA SOIL AND GROUNDWATER REMEDIATION
Because source area soil and groundwater are closely linked it is appropriate to discuss the remedies
together. Additional source area delineation is suggested for remediation, but for the purpose of this
comparison, the soil and groundwater source area is assumed to be a 200-foot by 200-foot area in the
vicinity of the AC-155, AC-223, and AC-226 clusters extending from approximately 5 feet bgs to
approximately 35 feet bgs. This is a total volume of approximately 45,000 cubic yards. Contamination is
present outside of this area and deeper than 35 feet bgs, but not to the extent that it would be considered
for source area treatment. The goal of source area remediation would be to remove the contaminant mass
from the source area to allow cleanup water from upgradient to flush the remaining on-site contamination
toward a containment remedy at the downgradient edge of the property. Several remedial options are
discussed below.
In situ thermal remediation. Electrical resistance heating (ERH) is a form of in situ thermal
remediation that could be used to treat the source area soils and groundwater. This approach
provides aggressive mass removal and is more effective than many other in situ remedies for
removing contaminant mass from less permeable zones (e.g., silts and clays). Based on a volume
of 45,000 cubic yards, costs incurred at Pemaco Superfund Site in California, projected costs at
Grants Chlorinated Solvent Plume Superfund Site in New Mexico, and other various other ERH
applications, the optimization team expects that ERH for this source zone might cost over
$5,000,000. No additional active remediation would be expected in the source area. Given the
geology of the source area, the optimization team believes that contamination may be removed
relatively effectively by other technologies (e.g., SVE) without the need for the additional cost
and resources associated with ERH. Based on the geological logs and contaminant distribution, it
appears that the less permeable material that would be more effectively addressed by ERH are
much broader in area, downgradient of the source (beneath the building), and deeper (e.g., to at
least 60 feet bgs). Treating this extended volume of CVOCs with thermal remediation would
likely cost an order of magnitude more (e.g., more than $50,000,000). For these reasons, even if
the source area is substantially smaller than the assumed volume, optimization team does not
believe that in situ thermal remediation is appropriate for this site.
AS/SVE. The source area geology, primarily consistent of silty, fine, and medium sands with
small lenses of clay appears to be favorable for AS/SVE. A full scale SVE system has not been
operated at the site to date. It is unlikely that an SVE system would have emissions of CVOCs
exceeding the limit in 567 Iowa Administrative Code (IAC) 22.1(2) “Small Unit Exemption” of 5
tons/yr for total CVOCs. However, the site team may choose to use a control technology such as
granular activated carbon (GAC) to remove CVOCs prior to discharge. An AS/SVE system in

31
the source area would require about 25 extraction wells (each about 30 feet deep) and 16 injection
wells (each about 40 feet deep). The wells could be arranged in a grid system appropriate for the
actual dimensions of the source area, and sampling could be done during well installation to
refine or expand the treatment area as needed. Capital costs for system installation would be
approximately $600,000, assuming the following:
o $120,000 for well installation
o $100,000 for piping
o $120,000 for blowers, compressors, moisture separators, and controls
o $80,000 for two 10,000 pound GAC units for off-gas treatment
o $50,000 for a small building or enclosure
o $10,000 for sample collection and analysis for delineation
o $100,000 for design, startup, and commissioning
o $20,000 for reporting
Operating costs would be about $150,000 per year assuming vapor treatment is included ($26,000
labor, $24,000 project management/reporting, $30,000 power, $40,000 for replacing 20,000
pounds of carbon per year, $18,000 for process vapor analysis, and $10,000 maintenance). The
costs for vapor treatment can be eliminated if it is determined that vapor treatment is not needed,
and the cost for vapor analysis could be eliminated or substantially reduced if monitoring
requirements are not rigorous. The system could be adjusted as needed to target recalcitrant areas.
A VI mitigation system, if needed could be tied into the SVE system from the main site building,
which is less than 300 feet away. The system should reach asymptotic influent concentrations
within five years. Total cost would therefore be approximately $1,350,000.
ISCO. Application of ISCO at this site would require the use activated persulfate or Fenton’s
reagent because permanganate will not be effective on 1,1,1- TCA. The assumed treatment
volume for source area groundwater is approximately 23,000 cubic yards with a pore space of this
volume is approximately 1,400,000 gallons. A total of 40 injection locations in groundwater with
one injection interval each is assumed. Three injection events for treatment are assumed. A total
oxidant demand has not been established for the site and could have a significant effect on costs.
For the purpose of this analysis, 100,000 gallons of 8% modified Fenton’s reagent is used for
each injection event. The events would each be approximately 15 days and would occur over a
six to nine month period. The capital cost of benchscale testing, pilot testing, designing the
ISCO program, and installing the injection points would be approximately than $300,000,
including delineation sampling as described above. The cost for conducting each event would be
approximately $200,000 (about $150,000 for chemicals and $50,000 in labor and materials). The
monitoring conducted between each event, project management and reporting would likely add
an additional $30,000 per event. In sum, the total ISCO cost for groundwater alone might be
approximately $1,000,000. The actual cost would be heavily dependent on results of benchscale
testing to determine actual chemical addition requirement and the number of injection events
needed to reach mass removal goals. Each additional injection event would cost about $230,000.
This approach, as costed, would not address the soil. The assumed treatment volume for soil is
approximately the same as the treatment volume for groundwater, but even distribution is more
difficult to achieve. Mixing would provide the most even distribution but would be costly to a
depth of 25 feet bgs. Infiltration galleries could be used to reduce the cost to something
comparable to that of the groundwater injection system, but distribution of the oxidant would not
be ideal. Another option would be to conduct SVE in the vadose zone and ISCO in the
groundwater. The SVE system alone would cost approximately $500,000 to install and less than
$130,000 to operate. SVE operation (without AS) might only operate for 3 years for a total SVE
cost of approximately $900,000. The application of ISCO in the groundwater and SVE in the soil
might cost approximately $1,900,000. The area and depth of ISCO could be expanded closer to

32
the building to remove more mass than that limited to the assumed source area. This expanded
effort could be attempted after the source area is treated and the downgradient concentrations are
monitored for a few years. If downgradient concentrations are not declining to allow shutdown of
the containment system in a reasonable time frame, a cost-benefit analysis could be conducted for
applying ISCO to a larger area. An additional ISCO application would require capital but would
presumably decrease the time frame of the containment remedy.
In situ bioremediation. Application of in situ bioremediation at this site would be similar in
application to ISCO but would use an carbon source such as emulsified vegetable oil or a similar
material to reduce the oxidation reduction potential (ORP) and provide a microbe food source.
Data at the site currently suggest reducing conditions are present but that reductive dechlorination
stalls at 1,1-DCE, 1,1-DCA, and cis-1,2-DCE. Therefore, in addition to adding electron donor
(e.g., emulsified vegetable oil), the microbial population would need to be stimulated with one of
several proprietary cultures grown to address 1,1,1-TCA and the PCE/TCE reductive
dechlorination pathways. The technology would enhance currently observed reductive
dechlorination, but the technology could increase fouling of wells at the HCS by promoting
biological growth. It would likely take longer to restore the source area than ISCO. Absent
additional information from bench scale tests or pilot tests (excluding the butane stimulation test),
it is reasonable to assume that the cost for applying stimulated bioremediation to groundwater is
similar or higher to applying ISCO to groundwater. Like ISCO, unsaturated soils would best be
addressed separately. An advantage that in situ bioremediation has over ISCO is that reductive
dechlorination could continue some limited distance downgradient of the injection area. The
effects of in situ bioremediation also persist in the aquifer for a longer period. This would be
advantageous for the portion of the plume that is diffusing from lower permeability materials
(e.g., the clay layer between the upper and lower DeForest Formation), but this zone is
downgradient of the source area and primarily under the building. Because the addition of total
organic carbon (TOC) to the subsurface could increase fouling of the HCS, the use of in situ
bioremediation in the source area would likely result in switching the containment system from
the existing HCS to a biobarrier. For comparison purposes, it is a reasonable assumption to
conclude that bioremediation and SVE in the source area would cost approximately $2,000,000
with the potential to expand to other locations for an additional cost. The costs of using a
biobarrier for containment are described in the next section.
Source area pumping. This remedial approach would only be reasonable to consider if the HCS
is used as the containment system and on-site treatment is provided instead of discharging to the
POTW. The additional costs would likely involve approximately $200,000 in capital to install
four extraction wells and piping and $50,000 to account for a larger air stripper and GAC units to
accommodate the higher flow rates and concentrations (assuming source area pumping is planned
prior to design and installation of the HCS treatment plant). Operational costs would likely
increase by about $10,000 per year. Mass removal would be limited, and the duration of
pumping would be uncertain. The optimization team expects that the duration in pumping and
the extended time to operate the source area pumping and HCS would result in a higher overall
cost than more aggressive source area treatment with AS/SVE or ISCO/SVE. Source area
pumping would not address unsaturated soils. A soil remedy would be needed in addition to the
source area pumping.
Excavation. Excavation would address soils only and would likely cost more than $5 million to
address the assumed volume.

33
6.4.3 OPTIONS FOR A CONTAINMENT REMEDY
There are two primary options for containment: the HCS and a biobarrier. As suggested in Section 4.2.3
and 6.1.3 it is unclear if the current HCS fully captures the plume. For the purposes of this comparison,
the optimization team assumes that the current extent of the HCS (horizontally and vertically) provides
adequate capture. This extent is approximately 500 feet horizontally and 30 feet of saturated thickness
(e.g., approximately 30 feet bgs to 60 feet bgs). The goal of the containment remedy is to allow the
aquifer downgradient of the property boundary to cleanup to the appropriate standards. The duration of
the HCS is highly dependent on the timely implementation of a successful source are remedy and the
flushing of contamination presently downgradient of the source area to the containment remedy for
treatment. The HCS and biobarrier and discussed separately below.
HCS. The HCS currently discharges to the POTW, and the agreement with the POTW states that
discharge cannot occur for more than 5 years. Although there may be room to negotiate this, it is safer to
assume that it cannot be renewed and that on-site treatment is required before the water can be discharged
to another location (either a beneficial use or to surface water). If HCS is selected as the containment
remedy, prior to designing the HCS treatment system, the site team should evaluate the HCS capture as
discussed in Section 6.1.1, the presence of 1,4-dioxane, and the whether or not source area pumping will
occur. Sampling during the RI indicated dissolved iron concentrations are variable across the site. For
example, at co-located wells AC-140, AC-141, and AC-142, total iron ranged from 15.1 to 216 mg/L and
dissolved iron ranged from <0.1 mg/L to 8.12 mg/L. Given the presence of high total iron and dissolved
iron that may be present over 2 mg/L, and the history of well and piping fouling with the HCS, it is
reasonable to conclude that routine well maintenance will be required and some form of filtration will be
required. It is assumed that iron scaling on the air stripper can be managed by routine cleaning and that
and iron removal step is not required. Based on these assumptions, an HCS flow rate of 50 gpm, a total
CVOC influent concentration of approximately 500 µg/L, and a nearby discharge point to the storm
sewer, the cost for treatment system design, installation, and commissioning is likely approximately
$300,000. Annual costs for O&M are likely approximately $150,000 per year assuming the following:
$40,000 for project management
$40,000 for operator labor
$20,000 for electricity
$7,500 for two vapor phase GAC changeouts per year
$10,000 for routine maintenance
$15,000 for laboratory analysis for process vapor sampling
$2,500 for laboratory analysis of the effluent
$15,000 for annual well, pump, and piping maintenance to prevent fouling
Since taking over the lead for the site in April 2011, USEPA has conducted a substantial amount of work
to rehabilitate the wells and piping. The efforts included replacing all extraction pumps and check valves,
clearing two clogged pump lines, cleaning the other nine pump lines, and cleaning the 3-inch discharge
pipe to the sanitary sewer. The above cost well, pump, and piping maintenance does not assume this level
of effort. Rather, it is an approximate cost for maintaining the system so that it operates at the desired
capacity and avoids the need for large scale efforts. If fouling continues to be a problem, the use of a
sequestering agent in the wells may help protect the pumps, piping, and treatment system.
Biobarrier. A biobarrier would involve injection of a carbon source and appropriate microbial
population as described above for source area bioremediation, but the injections would occur along the
property boundary to create a reactive zone that degrades the CVOCs as they migrate through the reactive

34
zone. If this approach were used in place of the HCS, the HCS recovery wells could be used for injecting
and dispersing the carbon source. Based on the dimensions for capture and typical soil adsorptive
capacity for emulsified vegetable oil of 0.002 pounds of oil per pound of soil, approximately 60,000
pounds might be required to establish the biobarrier. The cost for the oil or another product may be as
high as $200,000. The frequency of maintenance injections and the amount of oil needed for the
maintenance injections is uncertain but would probably be between once every one to two years.
Performance monitoring would likely involve sampling for bioremediation parameters (e.g., ORP, TOC,
ferrous iron, nitrate, sulfate, and methane/ethane/ethane) and more frequent monitoring. Given the
material needs, labor and equipment needed for injection, and additional monitoring, it is unclear that the
biobarrier approach would be more cost effective than the HCS.
6.4.4 OPTIMIZATION TEAM RECOMMENDATION
Based on the above analysis, and assuming preliminary findings by the site team (e.g., 1,4-dioxane
results) are favorable, the optimization team would suggest the following:
installation and operation of an AS/SVE system to remediate source area soil and groundwater
design and installation of an air-stripper based treatment system for the HCS
operation of the HCS as a containment system
It is noted that this recommendation is based on professional judgment related to technical aspects and
does not include a full consideration of the nine Superfund remedy selection criteria.
The optimization team does not believe that there is significant cost to be gained by transitioning quickly
from the POTW discharge to on-site treatment. Therefore, the optimization team believes that the focus
should be placed on the recommendations in Section 6.1, the design criteria for the treatment plant (e.g.,
flow rates, need for vapor treatment), and the source area remedy.
If contamination in the source area persists after source area remediation, the SVE system can be operated
in pulse mode at substantially reduced cost to address the remaining contamination. SVE and ISCO may
also be an option for the source area, particularly if 1,4-dioxane is present. The site team may wish to
contact a vendor to get more information and a site-specific cost estimate.
The optimization team believes that the rate-limiting step for site remediation is the flushing of the
contamination from beneath the building where contamination is present in the upper DeForest
Formation, lower DeForest Formation, and the clay that separates them. Removal of the source area
contamination, and monitoring for a few years should provide an indication as to how quickly that area
will cleanup.

35
6.5 RECOMMENDATIONS FOR FOOTPRINT REDUCTION
The primary focus of the site team is to capture the plume and select the optimal remedy for the site. The
optimization team believes that the primary focus should be placed on the nine Superfund selection
criteria, including reducing remedy cost and time frame. For this reason, the optimization team has not
provided specific recommendations for footprint reduction.
Table 6-1 summarizes the O&M and reporting recommendations and associated change in annual costs
discussed previously.
Table 6-1. Recommendations Cost Summary Table
Recommendation Reason
Additional
Capital Costs
($)
Estimated
Change in
Annual Costs
($/yr)
Estimated
Change in
Life-Cycle
Costs
6.1.1 ASSESS
VAPOR INTRUSION RISK IN
FACILITY BUILDING
Effectiveness $45,000 $0
Not quantified
6.1.2 ANALYZE
FOR 1,4-DIOXANE Effectiveness $15,000 See text
6.1.3
DELINEATE MIGRATION
PATH OFF-SITE AND RECOGNIZE
POTENTIAL FOR MODIFICATIONS
FOR CONTAINMENT REMEDY
Effectiveness $55,000 $6,500*
6.1.4 CONSIDERATIONS FOR
CITY WELL #3 Effectiveness See text
6.3.1 PREPARE
AND ANNUAL REPORT
Technical
Improvement $0 $20,000
6.4.1 DEVELOP
SHUTDOWN CRITERIA Site Closeout $50,000 See text
6.4.2 OPTIONS
FOR SOURCE AREA SOIL AND
GROUNDWATER REMEDIATION
Site Closeout See text
6.4.3 OPTIONS
FOR A CONTAINMENT REMEDY Site Closeout See text
6.4.3 OPTIONS
FOR A CONTAINMENT REMEDY Site Closeout See text
6.4.4
OPTIMIZATION TEAM
RECOMMENDATION
Site Closeout See text
Costs in parentheses imply cost reductions
* $2,500 would be paid for by the USEPA Region 7 laboratory

ATTACHMENT A
SELECT FIGURES FROM SITE DOCUMENTS

US HWY 77 US H
WY
75
USHW
Y 75
B ST
6TH ST G
ST
FLOY
D BLVD
PIERC
E ST
W 19TH ST
NEBR
ASKA
ST
HAMI
LTON
BLV
D 11TH ST
27TH ST
18TH ST
MILITARY RD
US H
WY
20 B
US
TALBOT RD
W 21ST ST
W 29TH ST
W 7TH ST
W 9TH ST
CUNNINGHAM DR E 9TH ST
STONE PARK BLVD
E 21ST ST
CHEYENNEBLVD
8TH
AVE
WESLEY WAY
S FLO
YD B
LVD S H
AMILT
ONBL
VD
S FAIR
MOUN
T ST
19TH ST
W 4TH ST
US HWY 20 BUS
USHW
Y 75
US HWY 20
US HWY 20 BUS
US HWY 20
US HWY 20
STATE H W Y 35
STATE HWY 982
Sioux City
HGL—Baseline Groundwater Sampling Report, GM/AC Site—Sioux City, Iowa
I 129§¦ §¦I 29 S
W 4TH ST
GM/S
ACite
§¦29 N
³0 0.5 1
Miles
\\gst-srv-01\Gmap\GMAC\Baseline_GW_Sampling_Report\(1)general_location.mxd5/5/2011 thompsons Figure 1Source: HGL Database 2011ESRI www.esri.com Site Location Map
GM/AC SiteSioux City, Iowa
LegendGM/Proper
ACty
BoundaryInterstateHighwaysRoads
§¦29 N
MinnesotaSouth Dakota
Sioux City^ IowaNebraska _

"
!
""""
"""
""
"""
"
"""
"
"
"""
""" """ ""
""
""
""
""""
!>
!>!>!>!>!>!>
!>
!>
!>!>
""
"J
"J
"J
"J
"J
""
"
"
AC-165
ZENITH DRIVE
HA
MIL
TO
NB
LV
D
§¦I 29
RAILROAD
TRI - VIEW AVE
MISSOURI RIVER CITY WELL #6
CITY WELL #3
CITY WELL #2
CITY WELL #10
CITY WELL #24 (RADIAL COLLECTOR WELL)
RW-3S
RW-5D
RW-9D RW-9S RW-8D
RW-7D
RW-7S
AC-166
AC-167
AC-164
AC-163
RW-10S
AC-142
AC-141
AC-204
AC-200
AC-205 AC-206
AC-208
AC-207
AC-143 AC-144AC-148
AC-147
AC-146
AC-222 AC-221 AC-220
AC-149
AC-152 AC-225
AC-224
AC-223
AC-157
AC-154
AC-153
AC-158 RW-8S RW-6S
RW-10D
AC-140
AC-201
AC-202 AC-203
AC-145
AC-227
AC-156
AC-155
AC-228
AC-226
AC-160
AC-159
AC-161
AC-162
HYDRAULIC CAPTURE SYSTEM BUILDING
AC-103
Figure 2 Well Locations Map
GM/AC Site Sioux City, Iowa
³\\gst-srv-01\Gmap\GMAC\Baseline_GW_Sampling_Report\ (2)Well_Locations.mxd 5/6/2011 thompsons Source: HGL Database 2011 ESRI www .esri.com
Legend
0 300 600
Feet
´ Monitoring Well
> Recovery Well
"J Municipal Well
Hydraulic Capture System Building
GM/AC Property Boundary
HGL—Baseline Groundwater Sampling Report, GM/AC Site—Sioux City, Iowa

""" "
"
"
"
"
"
" "" "
"
"
"
""
!>!>!>
!>
"
"
ZENITH DRIVE
HA
MIL
TO
NB
LV
D
§¦I 29
RAILROAD
TRI - VIEW AVE
MISSOURI RIVER
1072
1069
10701071
1068
1067
1070
RW-9S
RW-8S RW-7S
AC-166
AC-164
RW-10S
AC-141 AC-204
AC-200
AC-202
AC-205
AC-207
AC-143
AC-144
AC-146
AC-221
AC-149
AC-223
AC-155
AC-226 AC-154
AC-160
AC-159
AC-161
Figure 3 Shallow Aquifer
Groundwater Elevation Map
³\\gst-srv-01\Gmap\GMAC\Baseline_GW_Sampling_Report\ (3)ShallowAquiferGW_Elevations.mxd 5/6/2011 thompsons Source: HGL Database 2011 ESRI www .esri.com
Legend
0 300 600
Feet
Hydraulic Capture System Building
GM/AC Property Boundary
HGL—Baseline Groundwater Sampling Report, GM/AC Site—Sioux City, Iowa
Groundwater Contour
Note: Groundwater contours in feet above mean sea level.

ô
ô
ô
ô
ô
ô
ô ô ô
ô
ô
ô
ô
"0"0"0
"0
"0
ô
ô
ZENITH DRIVE
HA
MIL
TO
NB
LV
D
§¦I 29
RAILROAD
TRI - VIEW AVE
MISSOURI RIVER
1073
1072 1071 1070
1069
10
68
1067
1074
1066
10
65
10641065
RW-5D
RW-9D
RW-7D
AC-167
AC-163
RW-10D
AC-201
AC-203
AC-206
AC-208 AC-145
AC-148
AC-222
AC-225
AC-157
AC-228
AC-158
AC-162
RW-8D
AC-142
Figure 4 Deep Aquifer
Groundwater Elevation Map
³\\gst-srv-01\Gmap\GMAC\Baseline_GW_Sampling_Report\ (4)DeepAquiferGW_Elevations.mxd 5/6/2011 thompsons Source: HGL Database 2011 ESRI www.esri.com
Legend
0 300 600
Feet
Hydraulic Capture System Building
GM/AC Property Boundary
HGL—Baseline Groundwater Sampling Report, GM/AC Site—Sioux City, Iowa
Groundwater Contour
Note: Groundwater contours in feet above mean sea level.

"
!
³
"J
"J
"J
"J
"J
""" "
"
"
"
"
"
" "" "
"
"
"
""
"
"
!>!>
!>
!> RW-6S (190J)
City Well #3
(1.2)
City Well #10
(ND)
City Well #24
(ND)
City Well #6
(ND)
ZENITH DRIVE
HA
MIL
TO
NB
LV
D
§¦I 29
RAILROAD
TRI - VIEW AVE
MISSOURI RIVER
RW-7S (69J)
AC-166 (ND)
AC-164 (ND)
RW-10S (0.6)
RW-9S (3.0)
AC-141 (23)
AC-200 (23)
AC-143 (ND)AC-144
(ND)
AC-149 (ND)
AC-160 (ND)
AC-159 (ND)
AC-161 (ND) AC-204
(6.1)
AC-205 (5.7)
AC-207 (1.2)AC-146
(4.9)
AC-221
(100)
AC-223 (930)
AC-155
(370)
AC-226 (950)
AC-154 (4.5)
AC-202 (520J)
7
500
100
HGL—Baseline Groundwater Sampling Report,
GM/AC Site—Sioux City, Iowa
Figure 5
Shallow Aquifer 1,1-Dichloroethene
Isoconcentration Map
Legend
´ Monitoring Well
> Recovery Well
"J Municipal Well
GM/AC Property Boundary
Hydraulic Capture System Building
1,1-Dichloroethene Isoconcentration Contour (Micrograms per Liter)
0 300 600
Feet
\\gst-srv-01\Gmap\GMAC\Baseline_GW_Sampling_Report\ (5)ShallowAquiferIsoconcentrationMap_Dichloroethene.mxd 5/6/2011 thompsons Source: HGL Database 2011 ESRI www .esri.com

"
!
"J
"J
"J
"J
"J
#
#
#
#
#
#
# # #
#
#
#
#
!>
!>
!>
!>
!>
#
#
City Well #3 (1.2)
City Well #10 (ND)
City Well #24 (ND)
City Well #6 (ND)
City Well #2 (ND)
ZENITH DRIVE
HA
MIL
TO
NB
LV
D
§¦I 29
RAILROAD
TRI - VIEW AVE
MISSOURI RIVER
AC-167 (ND)
RW-5D (26J)
RW-9D (2.5)
RW-8D (35J)
AC-201 (19)
AC-203 (32)
AC-206 (49J)
AC-208 (37)
AC-145 (ND)
AC-148 (ND)
AC-222 (13)
AC-158 (ND)
AC-162 (ND)
AC-163
(18J)
RW-10D (2.5)
AC-225 (20J)
AC-157 (8.6)
AC-228 (13J)
RW-7D (99J)
AC-142 (4.6)
7
50
Figure 6 Deep Aquifer
1,1-Dichloroethene Isoconcentration Map
³\\gst-srv-01\Gmap\GMAC\Baseline_GW_Sampling_Report\ (6)DeepAquiferIsoconcentrationMap_Dichloroethene.mxd 5/6/2011 thompsons Source: HGL Database 2011 ESRI www.esri.com
Legend
0 300 600
Feet
´ Monitoring Well
> Recovery Well
"J Municipal Well
Hydraulic Capture System Building
GM/AC Property Boundary
HGL—Baseline Groundwater Sampling Report, GM/AC Site—Sioux City, Iowa
1,1-Dichloroethene Isoconcentration Contour (Micrograms per Liter)

"
!
"J
"J
"J
"J
"J
!!! !!
!
!
!
!
!
!
!! ! !
!
!
!
!!
!>
!>!>
!
!
City Well #3
(11)
City Well #10
(ND)
City Well #24
(ND)
City Well #6
(ND)
City Well #2
(ND)
!>
RW-6S (350J)
ZENITH DRIVE
HA
MIL
TO
NB
LV
D
§¦I 29
RAILROAD
TRI - VIEW AVE
MISSOURI RIVER
AC-166 (ND)
RW-9S (36)
AC-147 (ND)
AC-164 (ND)
RW-10S (10)
AC-205 (53)AC-149
(ND)
AC-152 (ND)
AC-226 (40)
AC-154
(ND)
AC-153 (ND)
AC-160 (ND)
AC-159 (ND)
AC-161 (ND)
AC-204 (250)
AC-207 (5.6)AC-146
(2.5)
AC-224 (200)
AC-141 (1700)
AC-202 (640J)
AC-221 (1000)
AC-155
(3100)
RW-7S (83J)
AC-144 (1.7)
AC-200 (2400)
70
500
1000
Figure 7 Shallow Aquifer
cis-1,2-Dichloroethene Isoconcentration Map
³\\gst-srv-01\Gmap\GMAC\Baseline_GW_Sampling_Report\ (7)ShallowAquiferIsoconcentrationMap_cis12_Dichloroethene.mxd 5/6/2011 thompsons Source: HGL Database 2011 ESRI www .esri.com
Legend
0 300 600
Feet
´ Monitoring Well
> Recovery Well
"J Municipal Well
Hydraulic Capture System Building
GM/AC Property Boundary
HGL—Baseline Groundwater Sampling Report, GM/AC Site—Sioux City, Iowa
cis-1,2-Dichloroethene Isoconcentration Contour (Micrograms per Liter)

"
!
"J
"J
"J
"J
"J
ô
ô
ô
ô
ô
ô
ô ô ô
ô
ô
ô
ô
"0"0"0
"0
"0
ô
ô
AC-142 (120)
RW-8D (42 J)
City Well #3
(11)
City Well #10
(ND)
City Well #24
(ND)
City Well #6
(ND)
City Well #2
(ND)
ZENITH DRIVE
HA
MIL
TO
NB
LV
D
§¦I 29
RAILROAD
TRI - VIEW AVE
MISSOURI RIVER
RW-10D (5)
AC-145 (ND)
AC-163 (67)
RW-5D (390)
RW-9D (4.9)
RW-7D (320)
AC-201 (84)
AC-148 (ND)
AC-157 (36)
AC-158 (ND)
AC-162 (ND)
AC-167 (2.4)
AC-203 (860)
AC-206 (180)
AC-208 (230)
AC-222 (210)
AC-225 (3.0J)
AC-228 (5.2J)
70
500
Figure 8 Deep Aquifer
cis-1,2-Dichloroethene Isoconcentration Map
³\\gst-srv-01\Gmap\GMAC\Baseline_GW_Sampling_Report\ (8)DeepAquiferIsoconcentrationMap_cis12_Dichloroethene.mxd 5/6/2011 thompsons Source: HGL Database 2011 ESRI www.esri.com
Legend
0 300 600
Feet
´ Monitoring Well
> Recovery Well
"J Municipal Well
Hydraulic Capture System Building
GM/AC Property Boundary
HGL—Baseline Groundwater Sampling Report, GM/AC Site—Sioux City, Iowa
cis-1,2-Dichloroethene Isoconcentration Contour (Micrograms per Liter)

•
•
200!
Scale in Feet
...:', I ...(--'-';:,t )
\~
....._,,/ ...... ..... ~._.../
o 100 200i
.yt.S-SOVAf/
HDR EngIneering, Inc.
Geologic Cross-Section Traverse Locations
Remedial Investigation ReportFormer AC Rochester Facility. Sioux City, IowaGeneral Motors Corporation
Date
Dec. 1998
5.5
" ~

1080
AC.159
1060
;l-c~1040
!iii
1020
......----?--------------?
200 ft.
RI GeologicalBoring AC.196r-:-~ 300 ft.
Well ClusterRI Geological
r 850 ft.
AIWell ClusterRI Geologicalr
1100
1080
1060
Note
1. See Figure 5.5 for location of geologic cross section.2. SWL Static Water Level in shallow well (October 8, 1998).
980-L-----------------------------------------.-------------------------.-------------------.L980Scale: Horizontal 1" 222'
Vertical 1"= 22' (Vertical Exaggeration x10)
5.6
Dec. 1998
Dm
1--Remedial Investigation ReportFormer AC Rochester Facility. Sioux City, IowaGeneral Motors Corporation
Geologic Cross SE!ction A-AI
HDR Engineering, Inc.
MonitoringWell No. wIScreenedInterval
AC_1~~I~~ Soil
ConductivityLog
Shale/SiltstoneBedrockSilt
Clay
Silty Sand
Gravel
Inferred Boundary
Sand
=
=

-Eco1040!W
1080
1060
1100
1020
1000
8'Well ClusterRI Geologicalroring AC.173
T
AC-171SWL
Sand
1.100ft.
Sand
. . ~.. '.~.'.:..:.'.'.:..... '. . . ,.
Well ClusterRI Geologicalroring AC.176
I
AC.175
AC-175SWL
Sand
650 ft.
Sand
Well ClusterGeological
II
........
700 ft.
RI Geologicalr0ring AC.184
200 ft.
Well ClusterGeological
rring:::s
-- -------------------------------------------------------------
1060
1080
1020
200 ft.
1100
8RI GeologicalBoring AC.162
Well Cluster
-£c:81040!jjj
980
5.7
Dec. 1998
DateGeologic Cross Section B-B1
Note
1. See Figure 5.5 for location of geologic cross section.2. SWL Static Water Level in shallow well (October 8, 1998).
Remediallnve$tigation ReportII Former AC Rochester Facility Sioux City, IowaGeneral Motors Corporation
HDR Engineering. Inc.
MonitoringWell No. w/ScreenedInterval
AC.'~~
Shale/SiltstoneBedrock
SoilConductivityLog
ReworkedDakota Sandstone
Silt
Gravel
Gravel w/ Fines
Clay
Silty Sand
1" = 200'1"= 20' (Vertical Exaggeration x10)
Fill
Sand w/ Gravel
Sand ~\.)ri<JInferred Boundary
Scale: HorizontalVertical
Legend
980
=
-~

1020
-£c
1040~
W
1060
1080
1100
Sand
.;.~:.$ilt}~:~'~;~:\
;;,Y~~,~:~lnd
clWell Cluster
RI Geological
rAC-143 AC-175SWL SWL
Well Cluster
GeologicalBoring AC.138
I:Sand
Well Cluster
GeologicalBoring AC.139
132Sa
. .".-=--=--=---=- -=--=--=--=--Z':----------__ = Shale/Siltstone Bedrock :------=--==-========= =::::::-=~,------------_.--------- ..---_._-
425 ft.
Well Cluster
RIGeologicalBoring AC.164r-:a
c
AC-164'~:SWL \;
1100
1080
1060
1020
-£co:;1040
W
1000 1000
980 980
Dec. 1998
Data
1"- 5.8
Geologic Cross Section C-CI
Note1. See Figure 5.5 for location of geologic cross section.2. SWL Static Water Ll:!vel in shallow well (October 8, 1998).
Remedial Investigation ReportIIFormer AC Rochester Facility. Sioux City, IowaGeneral Motors Corporation
MonitoringWell No. w/ScreenedInterval
AC.'5.~SoilConductivityLog
HDR EngIneering, Inc.
Shale/SiltstoneBedrock
SiltClay
Silty Sand
Gravel w/ Fines
1" 200'1"= 20' (Vertical Exaggeration x10)
Fill
Sand w/ Gravel I[:~Ir-::...••...~.,....:j
Sand r.>/:'/.:~jInferred Boundary
Scale: HorizontalVertical
LegendGO
i
~ ~
=
~
=

1060
1100
-$.c
1040 :8
w
1080
1020
1000
980
5.9
Dec. 1998
01
Well ClusterRI Geologicalroring AC.173
AC-171
AC-171SWLSand
Note
1. See Figure 5.5 for location of geologic cross section.2. SWL Static Water Level in shallow well (October 8, 1998).
Geologic Cross Section 0-01
Remedial Investigation Report
IIFormer AC Rochester F.acility Sioux City, IowaGeneral Motors Corporation
HDREngineering, Inc.
Gravel wI FinesAC-140SWL
• ! ..I
Well ClusterGeologicalroring AC.139
MonitoringWell No. wIScreenedInterval
Sand
AC_15.~
. /
/
ReworkedDakota Sandstone
1200 ft.
Gravel wI Fines
Silty Sand
Clay
Sand wI Gravel
1D = 200'1D= 20' (Vertical Exaggeration x10)
Well ClusterGeologicalr0ring AC-l34
o
tnferred Boundary
Fill
Sand wI Gravel
Sand
Scale: HorizontalVertical
Legend
It1YEf.t~f~I I
1100
1080
980
1060
1020
1000
-c1040
W
..Ii!
i
~
=
~
-
~~
~
~
~

May 2000
Do..
NoteData obtained in August and September 1998.
Potential Source Area 1 • Remedial InvestigationSoil Headspace Geo-probe Results, Total ChlorinatedHydrocarbons
Feasibility StUdy ReportII Former AC Rochester Facility Sioux City, IowaGeneral Motors Corporation
•T-8t
.~1-183 -86.
T-18; T.184. 10
T-,90. .............-/100/
lil'1HOR Engineering, Inc.
Partial Plan - 10' BGSScale:1" 80'
•
T-84.
Key Map
Partial Plan - 20' BGSr-----------------------, Scale:1" 80'
1.75.
T-86 ••1.183
1~"84 •......•8
1-190 •
1.188_
T 9"
Partial Plan - 5' BGSScale:1" 80'
Partial Plan - 15' BGSScale:1" 80'
1.193_
IIIIIIIIII
~
-
=
=
=
=

Partial Plan 10' BGSScale: 1" 80'
May 2000
0...
IF~U~2.1.3
Key Map
r Estimated Extentof Impacted Soil
.... --" ..../ ,,~ \1 \I I
1.l..1 -'-
\ I, /
.... "..... _-.."".
•
Potential Source Area 2 Remedial InvestigationSoil Headspace Geo-probe Results, Total ChlorinatedHydrocarbons
Feasibility Study Reportm Former AC Rochester Facility Sioux City, IowaGeneral Motors Corporation
HDR EngIneering. Inc.
r Estimated Extentof Impacted Soil
.... --" ....
/'u"\I I\ .90 1r--,\I '.... ",/..... _-~
Partial Plan 5' BGSScale: 1" 80'
Partial Plan 15' BGSScale: 1" 80'
IIIIIIIIIIIII
-=
\ _
-
~
-
-=
-=


ATTACHMENT B
TREND CHARTS FOR HCS SENTINEL WELLS

0
100
200
300
400
500
600
700
Jul-06 Jul-07 Jul-08 Jul-09 Jul-10 Jul-11
AC-204 - Total CVOCs (ug/L)
0
1000
2000
3000
4000
5000
6000
Jul-06 Jul-07 Jul-08 Jul-09 Jul-10 Jul-11
AC-205 - Total CVOCs (ug/L)
0
1000
2000
3000
4000
5000
6000
7000
8000
Jul-06 Jul-07 Jul-08 Jul-09 Jul-10 Jul-11
AC-206 - Total CVOCs (ug/L)

0
100
200
300
400
500
600
700
Jul-06 Jul-07 Jul-08 Jul-09 Jul-10 Jul-11
AC-207 - Total CVOCs (ug/L)
0
200
400
600
800
1000
1200
Jul-06 Jul-07 Jul-08 Jul-09 Jul-10 Jul-11
AC-208 - Total CVOCs (ug/L)

ATTACHMENT C
1,1-DCA TREND AT CITY WELL #3

0
50
100
150
200
250
300
Dec-99 Apr-01 Sep-02 Jan-04 May-05 Oct-06 Feb-08 Jul-09 Nov-10 Apr-12
1,2
-DC
A (
ug/
L)
Date
1,1-DCA in City Well #3
Operation as a remediation well
begins
Operation of the HCS begins
1,1-DCA is used as an indicator parameter

ATTACHMENT D
ELECTRICITY EMISSION FACTORS

Table 1. 2009 Summary Statistics Item Value U.S. Rank
Iowa
NERC Region(s)....................................................................................................... MRO/SERC
Primary Energy Source........................................................................................... Coal
Net Summer Capacity (megawatts) ....................................................................... 14,579 28 Electric Utilities ...................................................................................................... 11,479 24
Independent Power Producers & Combined Heat and Power................................ 3,101 30
Net Generation (megawatthours)........................................................................... 51,860,063 28 Electric Utilities ...................................................................................................... 41,723,059 25
Independent Power Producers & Combined Heat and Power................................ 10,137,004 31
Emissions (thousand metric tons) .......................................................................... Sulfur Dioxide ........................................................................................................ 92 21
Nitrogen Oxide ....................................................................................................... 45 24
Carbon Dioxide....................................................................................................... 42,978 21
Sulfur Dioxide (lbs/MWh) ..................................................................................... 3.9 18
Nitrogen Oxide (lbs/MWh) .................................................................................... 1.9 17
Carbon Dioxide (lbs/MWh).................................................................................... 1,827 12
Total Retail Sales (megawatthours) ....................................................................... 43,641,195 30 Full Service Provider Sales (megawatthours) ........................................................ 43,641,195 28
Direct Use (megawatthours) ................................................................................... 1,931,968 15
Average Retail Price (cents/kWh) .......................................................................... 7.37 40
MWh = Megawatthours. kWh = Kilowatthours. Sources: U.S. Energy Information Administration, Form EIA-860, "Annual Electric Generator Report." U.S. Energy Information Administration, Form EIA-861, "Annual Electric Power Industry Report." U.S. Energy Information Administration, Form EIA-923, "Power Plant Operations Report" and predecessor forms.
Table 2. Ten Largest Plants by Generating Capacity, 2009
Plant Primary Energy Source or Technology Operating Company
Net Summer Capacity
(MW)
Iowa
1. Walter Scott Energy Center................................................................. Coal MidAmerican Energy Co 1,623
2. George Neal North............................................................................... Coal MidAmerican Energy Co 945
3. Louisa .................................................................................................. Coal MidAmerican Energy Co 745
4. Ottumwa .............................................................................................. Coal Interstate Power and Light Co 710
5. George Neal South............................................................................... Coal MidAmerican Energy Co 644
6. Duane Arnold Energy Center .............................................................. Nuclear NextEra Energy Duane Arnold LLC 601
7. Emery Station ...................................................................................... Gas Interstate Power and Light Co 516
8. Greater Des Moines ............................................................................. Gas MidAmerican Energy Co 493
9. Pioneer Prairie Wind Farm.................................................................. Other Renewables Pioneer Prairie Wind Farm I, LLC 300
10. Lansing ............................................................................................... Coal Interstate Power and Light Co 292
MW = Megawatt. Source: U.S. Energy Information Administration, Form EIA-860, "Annual Electric Generator Report."
State Electricity Profiles 2009 91

ATTACHMENT E
PUMP CURVE
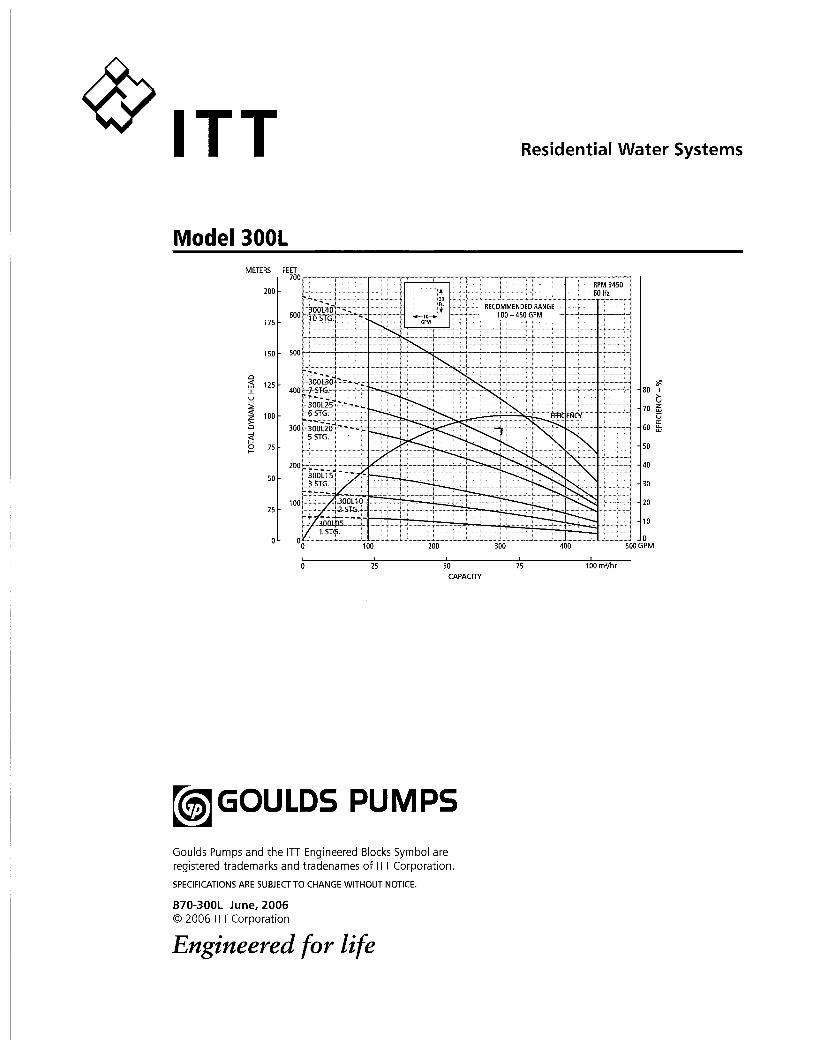


ATTACHMENT F
PHOTO LOG
Photos taken by Rob Weber of USEPA ORD from August 1 through August 3, 2011.

OPTIMIZATION EVALUATION SITE VISIT ON JUNE 21, 2011 GENERAL MOTORS FORMER AC ROCHESTER FACILITY
SIOUX CITY, IOWA
1 HCS Well Recovery Well Vault Exterior. 2 HCS Recovery Well Vault Interior. Note: Double-Contained Separate Lines to Each Well.
3 HCS Building Interior – Well Pump Controls. 4 HCS Building Interior – Pipe Manifold.
5 Closeup of Well Piping and Flow Meter Maintenance. 6 HCS Building Interior – Electric and Control Panels.