Embed Size (px)
Citation preview

OPTIMIZATION BASED TOUCHSCREEN GRAPHICAL USER INTERFACE
DESIGN
A Thesis
presented to
the Faculty of California Polytechnic State University,
San Luis Obispo
In Partial Fulfillment
of the Requirements for the Degree
Master of Science in Industrial Engineering
by
Christian D. Royer
April 2014

ii
© 2014
Christian D. Royer
ALL RIGHTS RESERVED

iii
COMMITTEE MEMBERSHIP
TITLE:
Optimization Based Touchscreen Graphical User
Interface Design
AUTHOR:
Christian D. Royer
DATE SUBMITTED:
April 2014
COMMITTEE CHAIR:
Dr. Tali Freed
Professor of Industrial Engineering
COMMITTEE MEMBER:
Dr. Lizabeth Schlemer
Professor of Industrial Engineering
COMMITTEE MEMBER: Dr. Reza Pouraghabagher
Professor of Industrial Engineering
iv
ABSTRACT
Optimization Based Touchscreen Graphical User Interface Design
Christian D. Royer
Tablets have been increasing in popularity throughout the past couple years and
developers are designing their graphical user interfaces (GUIs) with this trend in mind.
This thesis attempts to examine how a process can be designed to automatically create a
GUI layout for a menu driven interface based on predetermined criteria. The
effectiveness of the system along with a qualitative analysis of GUIs was examined
through the use of human subjects testing ATM designs on a tablet. A three-way
ANOVA was designed to see if Gender, the type of Form, or if the order they did their
testing was a significant factor in how fast a subject was able to complete certain tasks
and what they thought of each of these forms. While these results were not able to prove
which form could be completed the fastest because of an interaction between blocking
and forms, the subject’s ratings were able to demonstrate their high preference towards a
system that was more simplified. They felt that a simpler designed interface is more
aesthetic and usable. The subjects also had a higher sense of satisfaction while using a
simple form. This thesis provides background for future research in designing a process
that can automatically determine the layout of a menu driven system.
Keywords: Human Computer Interaction, Graphical User Interface Design, Operations
Research, Tablets, Touchscreens

v
ACKNOWLEDGMENTS
I want to thank Dr. Tali Freed for providing me with feedback and guidance
throughout the course of this thesis. She was extremely helpful in assisting with the
design of the operations research system and getting the project completed. In addition, I
want to thank Dr. Schlemer and Dr. Pouraghabagher for providing advice and help
throughout my college career and helping me become the engineer that I am today.

vi
TABLE OF CONTENTS
LIST OF TABLES ...............................................................................................................x
LIST OF FIGURES ........................................................................................................... xi
CHAPTER1: INTRODUCTION ........................................................................................ 1
CHAPTER 2: LITERATURE REVIEW ............................................................................ 3
2.1 History of Graphical User Interfaces ........................................................................ 3
2.1.1 History of Traditional Graphical User Interfaces ............................................... 3
2.1.2 History of Touchscreen Computer Interfaces ..................................................... 3
2.2 Design Aspects of Graphical User Interfaces ........................................................... 4
2.2.1 Aesthetics............................................................................................................ 4
2.2.2 Usability.............................................................................................................. 4
2.2.3 Simplicity............................................................................................................ 5
2.2.4 Color ................................................................................................................... 5
2.2.5 Information Limits .............................................................................................. 5
2.2.6 Symmetry............................................................................................................ 6
2.2.7 Information Sequencing and Standardization ..................................................... 6
2.2.8 Button Size and Importance ............................................................................... 6
2.3 Operations Research .................................................................................................. 6
2.4 Previous Studies on the Subject ................................................................................ 7
2.4.1 What is Beautiful is Usable [26] ......................................................................... 7
2.4.2 Research on GUIs that Automatically Adjust in Size ........................................ 8
CHAPTER 3: METHODS ................................................................................................ 10
3.1 Preparation for Building an ATM ........................................................................... 10
3.1.1.1 Examining an ATM ....................................................................................... 10
3.1.1.2 Statement Print .............................................................................................. 10
3.1.1.3 Payments ........................................................................................................ 11
3.1.1.4 Additional Services ........................................................................................ 11
3.1.1.5 Fast Cash........................................................................................................ 11
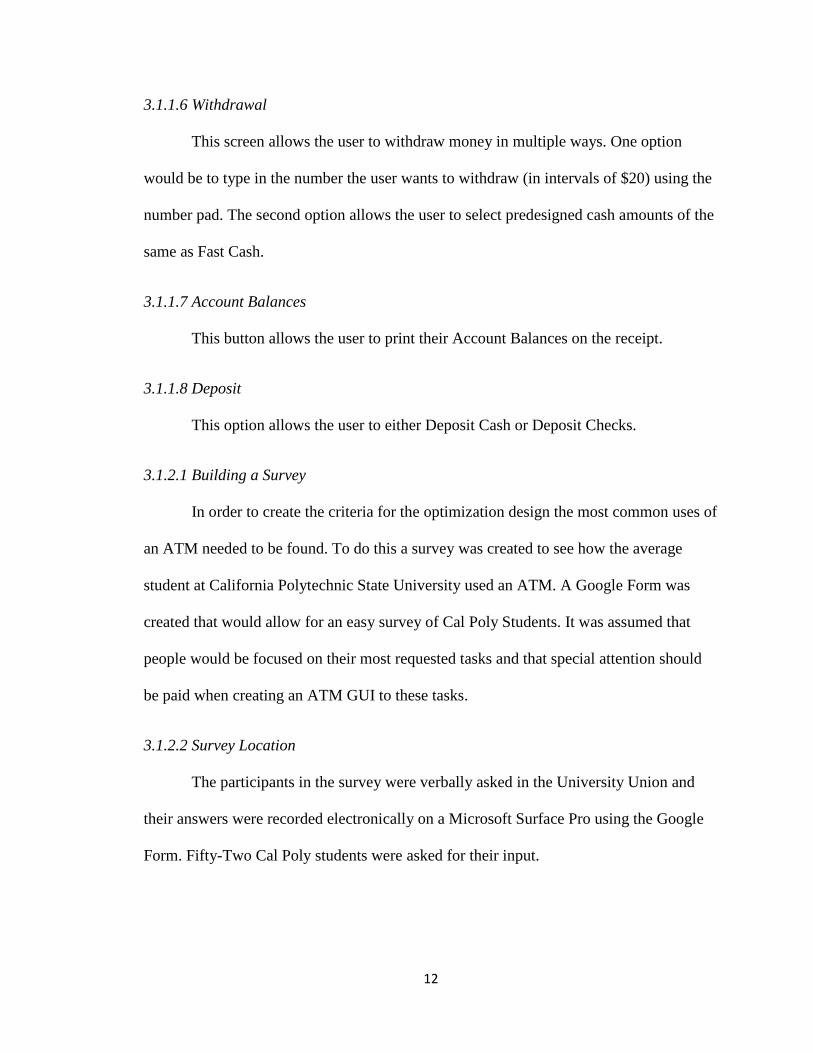
3.1.1.6 Withdrawal .................................................................................................... 12
3.1.1.7 Account Balances .......................................................................................... 12
3.1.1.8 Deposit ........................................................................................................... 12
3.1.2.1 Building a Survey .......................................................................................... 12

vii
3.1.2.2 Survey Location ............................................................................................. 12
3.1.2.3 Survey Script ................................................................................................. 13
3.1.2.4 Survey Questions and Form .......................................................................... 13
3.1.2.5 Results from Survey ...................................................................................... 14
3.2 Building Optimization Model ................................................................................. 15
3.2.1 Location of Buttons .......................................................................................... 15
3.2.2 Size of Buttons.................................................................................................. 16
3.2.3 Symmetry of Buttons ........................................................................................ 17
3.2.4 Number of Buttons ........................................................................................... 17
3.3 Developing the Optimization Model ....................................................................... 18
3.3.1 Defining the Variables in Optimization Model ................................................ 18
3.3.2 Developing Objective Function ........................................................................ 18
3.4 Constraints ............................................................................................................... 19
3.4.1 Number of Buttons ........................................................................................... 19
3.4.2 Symmetry.......................................................................................................... 19
3.4.3 Large Button Interference ................................................................................. 20
3.4.4 Adjacent Buttons .............................................................................................. 21
3.4.5 Mixing Boxes ................................................................................................... 21
3.4.6 Results from Optimization Model .................................................................... 22
3.5 ATM System Design ............................................................................................... 22
3.5.1 All ATM Models .............................................................................................. 22
3.5.2 All Button ATM GUI ....................................................................................... 23
3.5.3 Traditional ATM GUI ...................................................................................... 24
3.5.4 Optimization Model ATM GUI ........................................................................ 26
3.5.5 Post Experiment Survey ................................................................................... 28
CHAPTER 4: METHODOLOGY .................................................................................... 29
4.1 Design...................................................................................................................... 29
4.2 Hypotheses .............................................................................................................. 30
4.3 Participants .............................................................................................................. 31
4.4 Variables.................................................................................................................. 32
4.4.1 Controlled Variables ......................................................................................... 32
4.4.2 Independent Variables ...................................................................................... 32

viii
4.4.3 Dependent Variables ......................................................................................... 33
4.5 Experiment .............................................................................................................. 33
4.6 Post Experiment ...................................................................................................... 35
CHAPTER 5: RESULTS .................................................................................................. 36
5.1 Overview of Data .................................................................................................... 36
5.1.1 Overview of ANOVA Tests ............................................................................. 36
5.2 Completion Time Score Data .................................................................................. 37
5.2.1 Descriptive Statistics of Completion Times ..................................................... 37
5.2.2 Test of Normality of Time Score ...................................................................... 38
5.2.3 Time ANOVA Table ........................................................................................ 39
5.2.4 Interaction Plots of Score Time ........................................................................ 40
5.2.5 Comparison for Order ....................................................................................... 43
5.2.6 Order ANOVA Table ....................................................................................... 44
5.2.7 Interaction Plots of Order Interaction ............................................................... 45
5.2.8 Tukey Tests....................................................................................................... 46
5.3 Aesthetics Score Data.............................................................................................. 47
5.3.1 Descriptive Statistics of Aesthetics Scores ....................................................... 47
5.3.2 Test of Normality for Aesthetics ...................................................................... 48
5.3.3 ANOVA Table for Aesthetics Score ................................................................ 48
5.3.4 Interaction Plots of Aesthetics Score ................................................................ 49
5.3.5 Tukey Results of Aesthetics Score ................................................................... 51
5.4 Usability Score Data................................................................................................ 53
5.4.1 Descriptive Statistics of Usability Scores ......................................................... 53
5.4.2 Test of Normality.............................................................................................. 54
5.4.3 ANOVA Table for Usability Score .................................................................. 55
5.4.4 Interaction Plots of Usability Score .................................................................. 56
5.4.5 Tukey Results of Usability Score ..................................................................... 58
5.5 Satisfaction Score Data ........................................................................................... 59
5.5.1 Descriptive Statistics of Satisfaction Times ..................................................... 59
5.5.2 Test of Normality.............................................................................................. 60
5.5.3 ANOVA Table for Satisfaction Score .............................................................. 61
5.5.4 Interaction Plots of Satisfaction Score.............................................................. 62
ix
5.5.5 Tukey Results of Aesthetics Score ................................................................... 64
CHAPTER 6: DISCUSSION ............................................................................................ 66
6.1 Time Score Discussion ............................................................................................ 66
6.2 Aesthetic Discussion ............................................................................................... 67
6.3 Usability Discussion ................................................................................................ 68
6.4 Satisfaction Discussion ........................................................................................... 69
CHAPTER 7: CONCLUSION & FUTURE WORK........................................................ 71
7.1 Conclusion ............................................................................................................... 71
7.2 Future Work ............................................................................................................ 72
References ......................................................................................................................... 74
Appendix A: Images of ATM System .............................................................................. 78
Appendix B: Images of Solver ........................................................................................ 124
Appendix C: Raw Data ................................................................................................... 125
Appendix D: Informed Consent Form ............................................................................ 128
Appendix E: Experiment Form ....................................................................................... 129
Appendix F: Experiment Form ....................................................................................... 130
Appendix G: Survey Form .............................................................................................. 131

x
LIST OF TABLES
Table 1 - All Factors and Levels ....................................................................................... 29
Table 2- Experimental Design .......................................................................................... 29
Table 3 - Combination of Runs ......................................................................................... 30
Table 4- Hypotheses ......................................................................................................... 31
Table 5 ANOVA Factors and Levels ................................................................................ 36
Table 6 - Descriptive Statistics for Completion Times ..................................................... 37
Table 7 - Time ANOVA Table ......................................................................................... 39
Table 8 - Order ANOVA Design ...................................................................................... 43
Table 9 - Order ANOVA Table ........................................................................................ 44
Table 10 - Tukey Test of Order ........................................................................................ 46
Table 11 - Descriptive Statistics for Aesthetics Scores .................................................... 47
Table 12- ANOVA of Aesthetics Score............................................................................ 48
Table 13 - Aesthetics Tukey Results ................................................................................ 52
Table 14 - Descriptive Statistics for Completion Times ................................................... 53
Table 15- ANOVA of Usability Score.............................................................................. 55
Table 16 - Usability Tukey Results .................................................................................. 59
Table 17 - Descriptive Statistics for Completion Times ................................................... 59
Table 18- ANOVA of Usability Score.............................................................................. 61
Table 19 - Satisfaction Tukey Results .............................................................................. 65

xi
LIST OF FIGURES
Figure 1 - Xerox Star GUI Example [20] ........................................................................... 1
Figure 2- Example of Windows 8 GUI [10] ....................................................................... 2
Figure 3- Fuzzy Agent GUI [1] .......................................................................................... 8
Figure 4 – Example of Questions from Survey ................................................................ 14
Figure 5 - Cal Poly Student ATM Usage .......................................................................... 14
Figure 6 - Location of Nodes ............................................................................................ 16
Figure 7 - Large Button at Node X1 ................................................................................. 17
Figure 8 - Objective Function ........................................................................................... 19
Figure 9 - Number of Buttons ........................................................................................... 19
Figure 10 - Symmetry Constraints .................................................................................... 20
Figure 11 - Large Button Interference .............................................................................. 21
Figure 12 - Adjacent Buttons ............................................................................................ 21
Figure 13 - Mixing Boxes ................................................................................................. 21
Figure 14 - Example of the Main Screen .......................................................................... 23
Figure 15 - All Buttons Menu Box Message Box............................................................. 24
Figure 16 - Traditional ATM GUI .................................................................................... 24
Figure 17- Statement Print Form GUI .............................................................................. 25
Figure 18 - Printing Out Last Debit Cards Message Box ................................................. 25
Figure 19 - Optimization Model GUI ............................................................................... 26
Figure 20 - Deposit Options GUI...................................................................................... 27
Figure 21 - Depositing Cash Message Box....................................................................... 27
Figure 22 - Rating form of Optimization Model .............................................................. 28
Figure 23 - Example of Practice Form .............................................................................. 33
Figure 24- Histogram of Score ......................................................................................... 38
Figure 25 - Residual Normality of Time Score ................................................................ 39
Figure 26 – Gender Versus Form Time Score Interaction ................................................ 40
Figure 27 - Gender Versus Block Time Score Interaction ............................................... 41
Figure 28- Form Versus Block Time Score Interaction.................................................... 42
Figure 29 - Probability Plot of Form and Order ............................................................... 43
Figure 30 – Form Versus Order Time Score Interaction .................................................. 45
Figure 31 - Gender Versus Order Time Score Interaction ................................................ 46
Figure 32- Histogram of Aesthetics Scores ...................................................................... 47
Figure 33 - Residual Normality of Aesthetics Score ........................................................ 48
Figure 34- Gender Versus Form Aesthetics Score Interaction ......................................... 49
Figure 35 - Gender Versus Block Aesthetics Score Interaction ....................................... 50
Figure 36 - Form Versus Block Aesthetics Score Interaction .......................................... 51
Figure 37- Histogram of Usability Scores ........................................................................ 53
Figure 38 - Residual Normality of Usability Score .......................................................... 54
Figure 39 - Gender Versus Form Usability Score Interaction .......................................... 56
Figure 40 - Gender Versus Block Usability Score Interaction ......................................... 57
Figure 41 - Form Versus Block Usability Score Interaction ............................................ 58

xii
Figure 42 - Histogram of Satisfaction Scores ................................................................... 60
Figure 43 - Residual Normality of Satisfaction Score ...................................................... 61
Figure 44 - Gender Versus Form Satisfaction Score Interaction ...................................... 62
Figure 45 - Gender Versus Block Satisfaction Score Interaction ..................................... 63
Figure 46 - Form Versus Block Satisfaction Score Interaction ........................................ 64

1
CHAPTER1: INTRODUCTION
When operating a computer many individuals take for granted all the work that
goes into creating the design of an interface. Ever since Xerox introduced the Star in the
1980s, engineers and designers have been trying to make our interaction with computers
and programs a more enjoyable experience. People have moved on from traditional
personal computers to tablets and smartphones as time progressed. As our usage in these
electronic devices change so must our research in how to make these experiences
effective.
Figure 1 - Xerox Star GUI Example [20]
Tablets are not new inventions, but their popularity has been increasing rapidly
since the introduction of the Apple iPad. In 2001, Bill Gates spoke to CNN about their
usefulness and said “It’s a PC that is virtually without limits – and within five years I
predict it will be the most popular form of PC sold in America” [23]. While it took a bit
longer than the five years he predicted, tablets have been rapidly replacing laptops and
ultrabooks. Within the 14 months of being on the market, the iPad sold 25 million tablets,
and by the end of 2011 it sold over 55 million worldwide [6]. Moreover, their use in the

2
business world has been increasing as well. Gartner predicts that the purchase of tablets
will more than triple in volume from 13 million in 2012 to 43 million by 2016 [4]. The
Yankee Group also predicted that about 30% of employees would be using a tablet while
at their job [4]. Lastly, Canalys, a market research industry analyst, predicts that in the
year 2014 Tablets will take over 50% of the personal computer market by selling over
285 million units and continuing to increase rapidly with 396 million units by 2017 [24].
Because of their rise in popularity Microsoft designed their latest operating system,
Windows 8, to be a more touch friendly UI and tried to improve their use among casual
users [2] [10].
Figure 2- Example of Windows 8 GUI [10]
For these reasons companies need to pay attention to the popularity of tablets
when designing their GUIs or “Graphical User Interfaces”. Especially since tablets
typically have smaller screens compared to a laptops. Ultimately, the designer cannot fit
as many items on a screen as they could before. There are many aspects to look at when
designing an effective GUI. The aesthetics, function, and useful are some of the
important aspects to look at while designing a GUI and tablets can showcase them in new
ways.
3
CHAPTER 2: LITERATURE REVIEW
This section will feature some background information on the GUIs (Graphical
User Interfaces). This information is to explain the different type of design aspects that
go into creating and utilizing a GUIs. It also highlights some important features to
consider like aesthetics and symmetry.
2.1 History of Graphical User Interfaces
2.1.1 History of Traditional Graphical User Interfaces
The history of GUIs goes back to the 1950s when researchers at Massachusetts
Institute of Technology would use a cathode ray tube and a light pen to control actions
being performed on the screen. Later in the late 1970s, Xerox began to experiment more
with GUI with personal computers and introduced the Xerox Star in 1981 [8].While they
created the first application with a GUI it was slow and not a commercial success. It
wasn’t until Steve Jobs introduced the Apple Macintosh that the design began to take off.
The Macintosh featured a mouse, menu, and icons. It marked the beginning of the
modern day GUI since the computer could be used with a mouse to select items on a
display and having a menu system prevented the user from selecting unrelated tasks to be
performed. Typically, a good GUI will not stand in the way of a user trying to complete a
task [9].
2.1.2 History of Touchscreen Computer Interfaces
Touchscreen interfaces have been developed since the 1970s alongside with the
mouse and they were mostly used for medical device, industrial, and point of sale
machines [13]. Most touchscreens in the past have been single touch along with non-

4
moving applications like an ATM that featured a touchscreen. These type of actions
typically only require the user to touch the screen with their finger and do not need much
finesse. While multi-touch has been increasing in popularity with the rise of smart phones
and tablets [13], this project will focus on static images that do not require multi-touch
displays.
2.2 Design Aspects of Graphical User Interfaces
Designing a graphical user interface involves utilizing many different factors.
There is not a set guideline for how to create one, but there are many opinions backed by
research about how a designer should create one.
2.2.1 Aesthetics
Aesthetics in GUIs is related to the beauty of the design. The aesthetics are an
important role in designing a good GUI, but it needs to be a balancing act. The design
needs to be something that looks good to the user, but doesn’t distract or prevent tasks
from being completed [27].
2.2.2 Usability
A computer system that is usable has been defined as a computer system that has
learnability, efficiency, memorability, errors (or free from them), and satisfaction [27]. In
short, usability refers to how easy a user is able to perform tasks without making errors.
Having a usable design is important because for many companies (and people) time is
money. If a person is spends time searching through a GUI for the correct input it wastes
times and it can even harm their health. There have been studies that show bad GUI

5
design can even effect a users’ health because of all the extra motion that needs to be
done [12].
2.2.3 Simplicity
Even though flashing color and lights may be interesting or get people’s attention,
they do not always make a good GUI. Many people prefer things that are simple and easy
to understand. Some researches argue that people need to stop thinking that graphics need
to be energetic or “alive” [26]. Most users just want to know the bare minimum of how to
get things done. So while it is possible to put a lot of options on one screen it does not
mean a designer should. [7]
2.2.4 Color
An important aspect to consider is the color of the not only the background, but
the icons as well. Different color schemes can allow the operator to focus or not focus on
areas of the screen. For example, the color red is usually associated with danger or stop.
This color could be used to log off or stop an application [22].
2.2.5 Information Limits
George Miller’s study on our capacity for information processing has been used in
many fields and GUI design is no exception. With “Miller’s Law” it is frequently said
that human mind processes items in a one-dimensional batch of seven, plus or minus two.
[15] This also applies to GUI design because the human mind will process menu items
and icons in this same type of setting and overloading the user with more icons can cause
the user to get frustrated and make mistakes. [9].

6
2.2.6 Symmetry
Symmetrical designs have been thought of as ideal and aesthetic ever since the
time of the Greeks [18]. They had an idea that there was beauty and perfection in things
that were in nature or man-made that were symmetrical. This idea of symmetry as beauty
has been carried out to modern times and there has been numerous studies on the
symmetry of people’s faces in relation to beauty [19]. In a GUI, symmetry can allow the
user to see the options in a simple manner that doesn’t confuse.
2.2.7 Information Sequencing and Standardization
When creating a layout the order of actions should be put on a screen in way that
makes logistical sense for the end user. When something is standard or used often users
will expect these actions to take place on similar GUIs. Hence important features that
people use should be featured at the top of the screen because that is what users are
familiar with or they should be placed in similar locations every time [9].
2.2.8 Button Size and Importance
Things of importance should be in a location that is easily distinguishable for
users. If there are many options that are possible, the most frequently used ones should be
at the top of the list [9]. Button size should also be taken into account for users because of
eye strain [7]. It can also be used to engage the user into performing certain tasks.
2.3 Operations Research
Operations research (OR) as defined by INFORMS (Institute of Operations
Research and the Management Sciences) is the field of study that involves the use of
advanced analytical methods to make decisions that are optimal or near-optimal. It

7
typically overlaps with disciplines like industrial engineering and it is often used to find a
maximum or minimum of criteria like profit, performance, or risk [28]. Operations
research typically includes many different problem solving techniques such as decision
analysis, mathematical optimization, data analysis, and viewing of different economical
methods.
Operations research can be used in many different fields to find solutions to
problems that come up. Things like scheduling airlines, managing water flows,
establishing locations of warehousing, and even identifying company strategies are areas
that operations research has been used [28]. Operations research has also been used as a
research tool to look into the following [14]:
Creating or improving models of various systems
Creating or improving algorithms to solve models
Creating or improving methodologies
Creating or improving software tools
Increasing the understanding
2.4 Previous Studies on the Subject
2.4.1 What is Beautiful is Usable [26]
In a study titled, What is Beautiful is Usable, Tractinsky and Ikar looked at the
relationship between a usable GUIs and an aesthetically pleasing one. In this study an
ATM system was utilized to see the relationship between how a user’s thoughts on
different GUIs and how quickly they could complete the experiment. In this experiment it
was seen that users had a high correlation between what they thought was aesthetic and
8
what they thought was usable; however, their actual results did not show an improvement
on their completion times. This shows that people view an aesthetic GUI as “working
better” even if that isn’t the actual case. The study of aesthetics was also shown in a study
in Japan showing that this may be a worldwide phenomenon [25]. This can be important
because users will leave a system feeling happy and possibly want to work on it again.
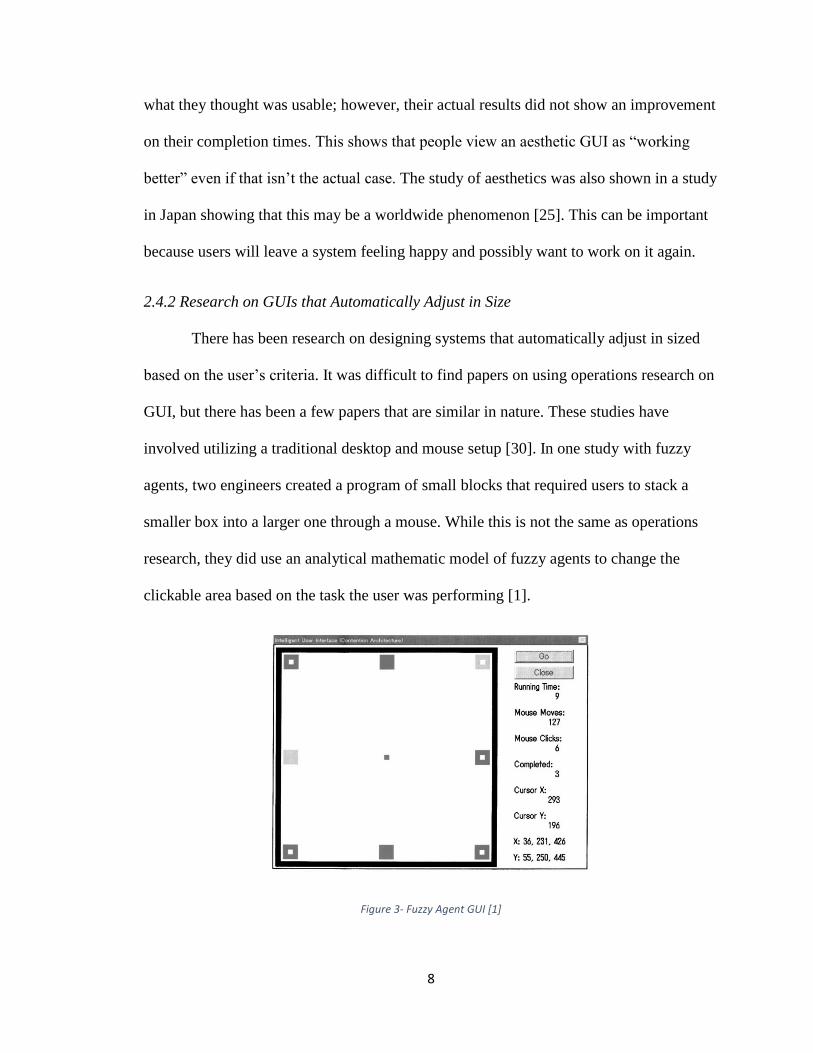
2.4.2 Research on GUIs that Automatically Adjust in Size
There has been research on designing systems that automatically adjust in sized
based on the user’s criteria. It was difficult to find papers on using operations research on
GUI, but there has been a few papers that are similar in nature. These studies have
involved utilizing a traditional desktop and mouse setup [30]. In one study with fuzzy
agents, two engineers created a program of small blocks that required users to stack a
smaller box into a larger one through a mouse. While this is not the same as operations
research, they did use an analytical mathematic model of fuzzy agents to change the
clickable area based on the task the user was performing [1].
Figure 3- Fuzzy Agent GUI [1]

9
They were able to demonstrate a faster completion time for the six subjects they used in
the experiment by changing the clickable area around each task making it easier for
people to use. While their completion times were increased, they did not test the user’s
satisfaction or opinions on the GUIs they used. There are also patents pending on GUI
designs that change automatically based on predetermined criteria set by the user [3] [21].
However these patents do not display their effectiveness nor measure how users react to
changing GUIs.
Research Question:
Does the use of optimization design increase the usability, aesthetics, and
performance of a menu driven touchscreen GUI design and is there an interaction with
gender or blocking.

10
CHAPTER 3: METHODS
In order to examine if an optimization model for GUI design is possible a task
needed to be created so that the effectiveness could be tested. Developing an ATM model
was chosen because of the prior research on GUI design used on ATMs [26]. Moreover,
tasks involving an ATM are easy to understand for non-tech users and they are familiar
for most people. There were many steps that were taken in order to build a usable ATM
model. This goes over the reasons and justifications for this.
3.1 Preparation for Building an ATM
3.1.1.1 Examining an ATM
Multiple ATMs on campus were first examined to see what the main components
on the front screen were. One specific Major US Bank was chosen in order to test the
optimization model against. Some of these components were:
Statement Print
Payments
Additional Services
Fast Cash
Withdrawal
Account Balances
Deposit
3.1.1.2 Statement Print
This button would allow the user to print the following transactions on their receipt at
the end of the transaction.

11
Last 5 Card Transactions
Last 5 Checks
Last 5 Deposits
Last 10 Transactions
3.1.1.3 Payments
This button was not able to display anything useful for the user unless the person
with the account already has payments going through.
3.1.1.4 Additional Services
This served as a miscellaneous option that allows the user to change their
preferences about what appears when they use their debit card on the ATM.
3.1.1.5 Fast Cash
On this screen the user can select to withdrawal money, but only in intervals that
was present on the display screen.
$20
$40
$60
$80
$100
$200
$300
$400
12
3.1.1.6 Withdrawal
This screen allows the user to withdraw money in multiple ways. One option
would be to type in the number the user wants to withdraw (in intervals of $20) using the
number pad. The second option allows the user to select predesigned cash amounts of the
same as Fast Cash.
3.1.1.7 Account Balances
This button allows the user to print their Account Balances on the receipt.
3.1.1.8 Deposit
This option allows the user to either Deposit Cash or Deposit Checks.
3.1.2.1 Building a Survey
In order to create the criteria for the optimization design the most common uses of
an ATM needed to be found. To do this a survey was created to see how the average
student at California Polytechnic State University used an ATM. A Google Form was
created that would allow for an easy survey of Cal Poly Students. It was assumed that
people would be focused on their most requested tasks and that special attention should
be paid when creating an ATM GUI to these tasks.
3.1.2.2 Survey Location
The participants in the survey were verbally asked in the University Union and
their answers were recorded electronically on a Microsoft Surface Pro using the Google
Form. Fifty-Two Cal Poly students were asked for their input.

13
3.1.2.3 Survey Script
Thank you for taking the time to do this survey. I am doing a study on ATMs. I
wanted to ask you questions about your last 10 times you were at an ATM. If you have
not used an ATM more than 10 times then I cannot ask for your survey results. If you did
multiple things during an ATM transaction please count each task.
3.1.2.4 Survey Questions and Form
The following questions were asked for the survey and the participant would then
select from 0 to 10 how many times this happened during an ATM transaction:
1. Of the last 10 times you used an ATM, how many times did you withdraw
money NOT using Fast Cash?
2. Of the last 10 times you used an ATM, how many times did you withdraw
money USING Fast Cash?
3. Of the last 10 times you used an ATM, how many times did you deposit a
check using an ATM?
4. Of the last 10 times you used an ATM, how many times did you deposit
cash using an ATM?
5. Of the last 10 times you used an ATM, how many times did you transfer
money using an ATM?
6. Of the last 10 times you used an ATM, how many times did you print out
your LAST FIVE transactions during A SINGLE transaction?
14
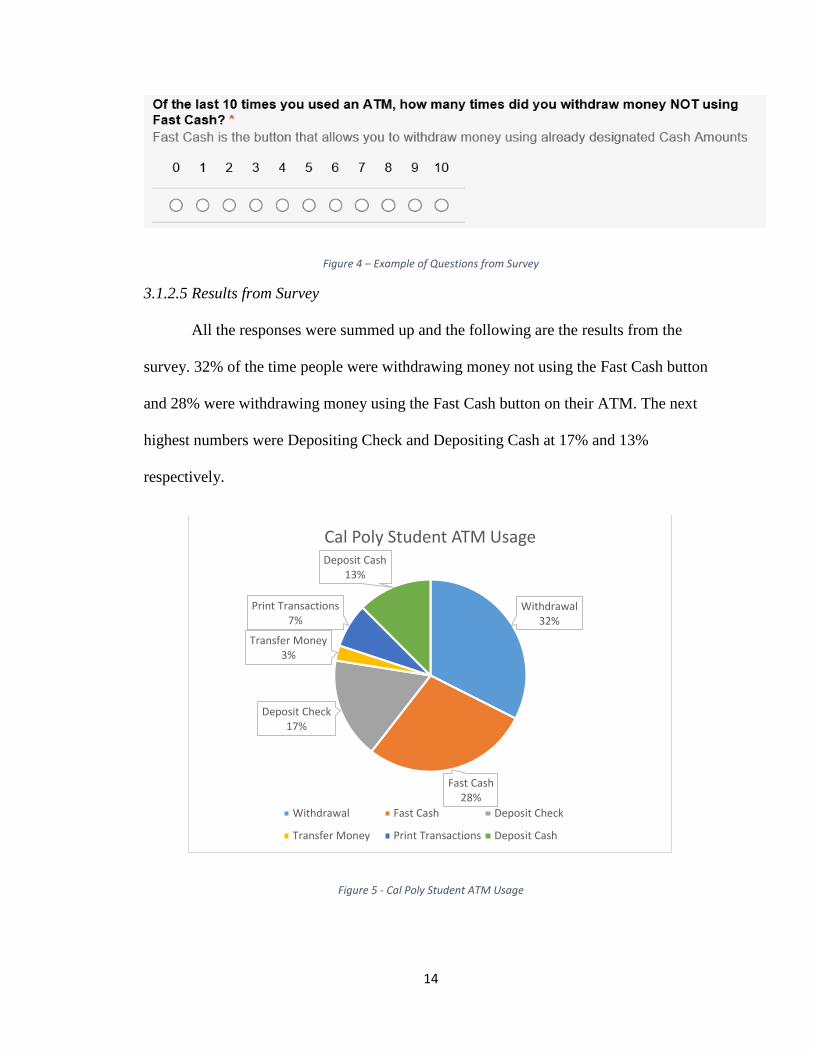
Figure 4 – Example of Questions from Survey
3.1.2.5 Results from Survey
All the responses were summed up and the following are the results from the
survey. 32% of the time people were withdrawing money not using the Fast Cash button
and 28% were withdrawing money using the Fast Cash button on their ATM. The next
highest numbers were Depositing Check and Depositing Cash at 17% and 13%
respectively.
Figure 5 - Cal Poly Student ATM Usage
Withdrawal32%
Fast Cash28%
Deposit Check17%
Transfer Money3%
Print Transactions7%
Deposit Cash13%
Cal Poly Student ATM Usage
Withdrawal Fast Cash Deposit Check
Transfer Money Print Transactions Deposit Cash

15
This survey shows that majority of the time (over 50%) people want to withdraw money
at the ATM. And around 30% of the time people want to deposit cash or checks into the
ATM. This is important because it shows what the most common uses of an ATM are
and this popularity will be built into the optimization model.
3.2 Building Optimization Model
Building the Optimization model required creating constraints based on the design
criteria stated in the literature review. This includes symmetry, button size, and button
location. The survey results from the students about ATM usage was also used to create
button sizes and the layout order.
3.2.1 Location of Buttons
Nodes were created in order to keep symmetry and simplicity to show where
buttons could and could not go. The assumption is that a simple and symmetric design
would be good for a user according to the research stated in the literature review [18] [19]
[27]. Since the experiment is being tested on a Tablet with a 10 inch screen there was a
limit on the amount of buttons that could be fit. It was decided that four rows of three
columns would maximize space while not overloading the user with buttons as seen
below in Figure 6 - Location of Nodes.

16
Figure 6 - Location of Nodes
3.2.2 Size of Buttons
To keep the model simple there were two size buttons decided for the
Optimization model, a large size and a small size. A large size button would take the spot
of its own node as well as the button below itself. For example, if a large button was
placed in node X1 it would also take the spot of node X4. It was decided that a large
button would be used if a task is done more than 25% of the time for all tasks. A small
size button would only take the spot of a single node. Withdrawals and Deposits were
chosen as the larger buttons since they represented he majority of the user’s tasks.

17
Figure 7 - Large Button at Node X1
3.2.3 Symmetry of Buttons
To keep aesthetics high with the Optimization model it was decided that the
design needed to have symmetry. The following guidelines were developed to account
for symmetry:
Each row can only have buttons of the same size
If an odd amount of the same size buttons is needed than one of the same size
buttons needs to be in the middle
If an even amount of the same size buttons is needed than the same size buttons
must be placed on the sides
3.2.4 Number of Buttons
The number of buttons is limited by the size of the screen and the amount of
nodes. A large button takes the space of two nodes and there can only be two nodes per
row. Therefore, there can be a maximum of 4 large buttons or a maximum of 8 smaller
buttons.
18
3.3 Developing the Optimization Model
Using the constraints above a binary programming model was created using
Microsoft Excel 2013 and the Solver Add On.
3.3.1 Defining the Variables in Optimization Model
In the Optimization model each button at each location is represented by the
following binary variable:
𝑋𝑖𝑗 = 1 𝑖𝑓 𝑙𝑜𝑐𝑎𝑡𝑖𝑜𝑛 𝑖 ℎ𝑎𝑠 𝑎 𝑏𝑢𝑡𝑡𝑜𝑛 𝑠𝑖𝑧𝑒 𝑗, 𝑎𝑛𝑑 0 𝑜𝑡ℎ𝑒𝑟𝑤𝑖𝑠𝑒
𝑊ℎ𝑒𝑟𝑒 𝑖 = 1,2 … ,12; 𝑎𝑛𝑑 𝑗 = 𝑠 (𝑠𝑚𝑎𝑙𝑙 𝑏𝑢𝑡𝑜𝑛)𝑜𝑟 𝐿 (𝑙𝑎𝑟𝑔𝑒 𝑏𝑢𝑡𝑡𝑜𝑛)
The locations of each node is shown in Figure 6 - Location of Nodes.
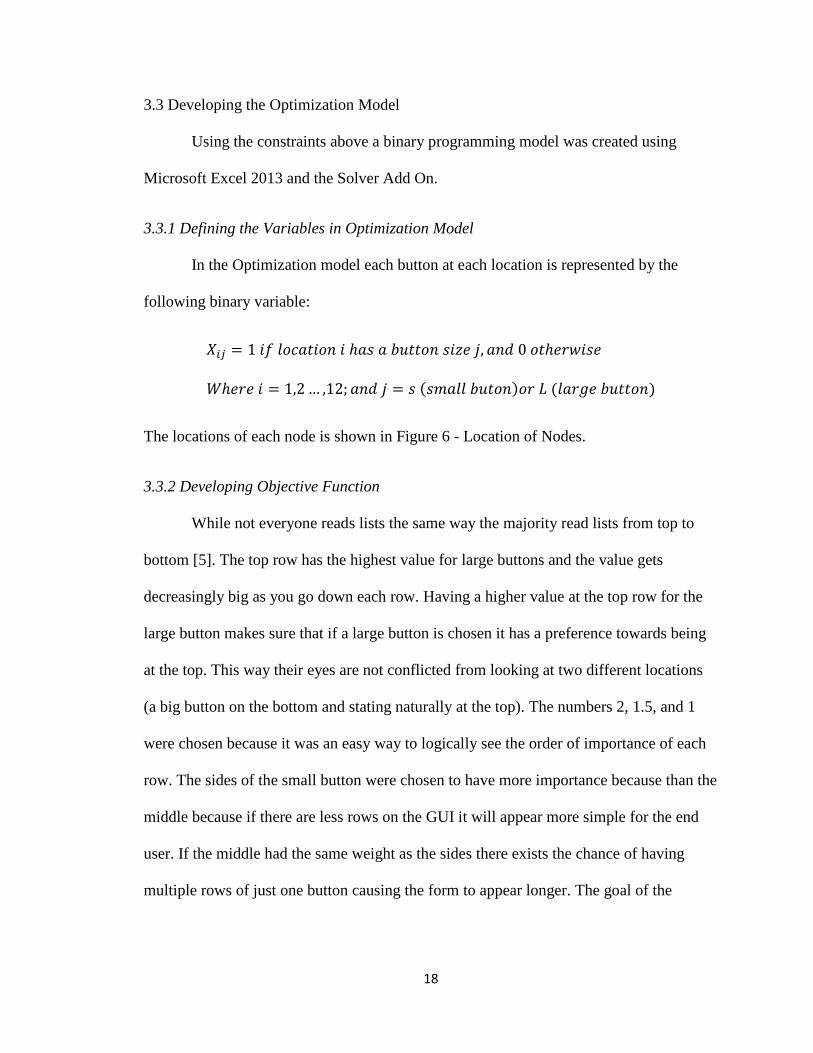
3.3.2 Developing Objective Function
While not everyone reads lists the same way the majority read lists from top to
bottom [5]. The top row has the highest value for large buttons and the value gets
decreasingly big as you go down each row. Having a higher value at the top row for the
large button makes sure that if a large button is chosen it has a preference towards being
at the top. This way their eyes are not conflicted from looking at two different locations
(a big button on the bottom and stating naturally at the top). The numbers 2, 1.5, and 1
were chosen because it was an easy way to logically see the order of importance of each
row. The sides of the small button were chosen to have more importance because than the
middle because if there are less rows on the GUI it will appear more simple for the end
user. If the middle had the same weight as the sides there exists the chance of having
multiple rows of just one button causing the form to appear longer. The goal of the

19
objective function is to maximize the score so that the GUI would have the highest
aesthetics. Thus the objective function is shown in Figure 8 - Objective Function.
𝑀𝑎𝑥 𝑍: 2𝑋1𝐿 + 2𝑋2𝐿 + 2𝑋3𝐿 + 1.5𝑋4𝐿 + 1.5𝑋5𝐿 + 1.5𝑋6𝐿 + 𝑋7𝐿 + 𝑋8𝐿 + 𝑋9𝐿 + 𝑋1𝑠
+ 𝑋2𝑠 + 𝑋3𝑠 + 𝑋4𝑠 + 𝑋5𝑠 + 𝑋6𝑠 + 1.1𝑋7𝑠 + 𝑋8𝑠 + 1.1𝑋9𝑠 + 1.1𝑋10𝑠
+ 𝑋11𝑠 + 1.1𝑋12𝑠
Figure 8 - Objective Function
3.4 Constraints
3.4.1 Number of Buttons
The first constraint guarantees there are not more buttons than allowed based on
the requirements of the user. This was based off of the results of the ATM survey and
what tasks are required to do on the ATM. It was determined that there were two main
tasks that would be given a large button, Deposit and Withdrawal. The four remaining
tasks, Transfer Account Balances, Statement Print, Additional Services, and Log Off,
were chosen to have smaller buttons. This can be seen in Figure 9 - Number of Buttons.
𝑋1𝐿 + 𝑋2𝐿 + 𝑋3𝐿 … + 𝑋9𝐿 ≤ 2
𝑋1𝑆 + 𝑋2𝑆 + 𝑋3𝑆 … + 𝑋12𝑆 ≤ 4
Figure 9 - Number of Buttons
3.4.2 Symmetry
The second set of constraints makes sure a button is symmetrical about the middle
by not allowing only one button on the left or right side. Either both are chosen to be a
button or neither is chosen.
𝑋1𝐿 − 𝑋3𝐿 = 0

20
𝑋4𝐿 − 𝑋6𝐿 = 0
𝑋7𝐿 − 𝑋9𝐿 = 0
𝑋1𝑆 − 𝑋3𝑆 = 0
𝑋4𝑆 − 𝑋6𝑆 = 0
𝑋7𝑆 − 𝑋9𝑆 = 0
𝑋10𝑆 − 𝑋12𝑆 = 0
Figure 10 - Symmetry Constraints
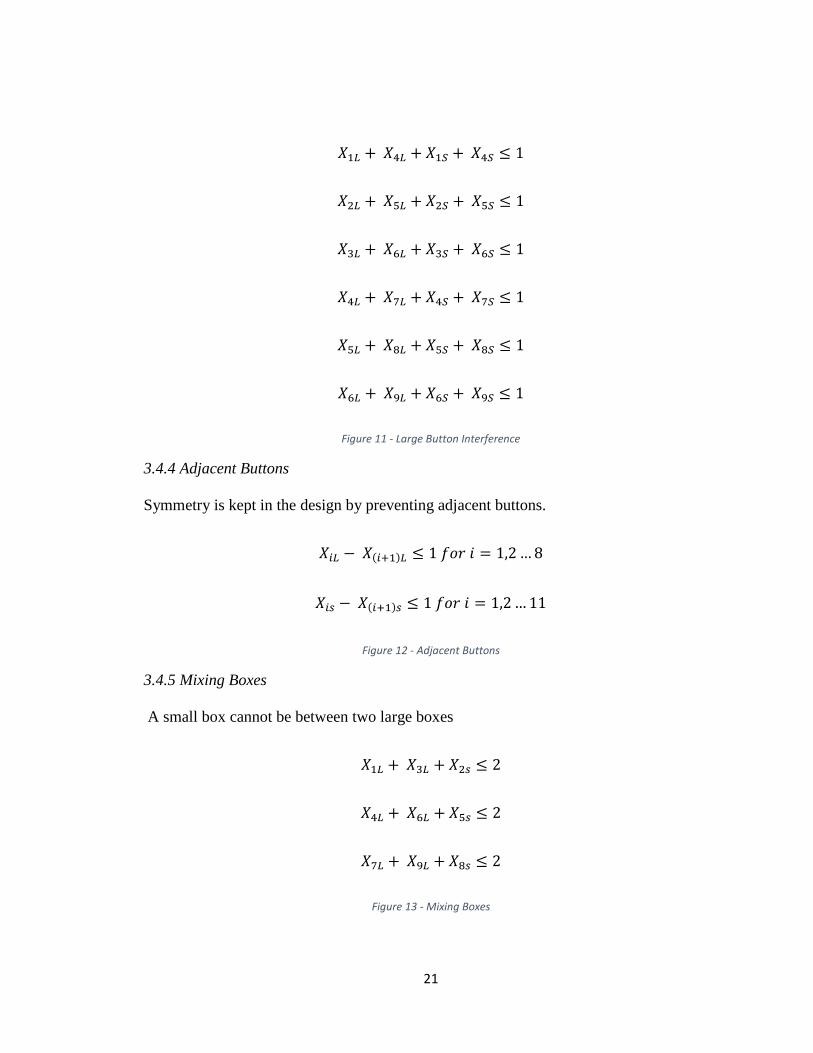
3.4.3 Large Button Interference
A large box or small box cannot exist in the same column in the following row of
an existing large box. This constraint can be seen in Figure 11 - Large Button
Interference.
21
𝑋1𝐿 + 𝑋4𝐿 + 𝑋1𝑆 + 𝑋4𝑆 ≤ 1
𝑋2𝐿 + 𝑋5𝐿 + 𝑋2𝑆 + 𝑋5𝑆 ≤ 1
𝑋3𝐿 + 𝑋6𝐿 + 𝑋3𝑆 + 𝑋6𝑆 ≤ 1
𝑋4𝐿 + 𝑋7𝐿 + 𝑋4𝑆 + 𝑋7𝑆 ≤ 1
𝑋5𝐿 + 𝑋8𝐿 + 𝑋5𝑆 + 𝑋8𝑆 ≤ 1
𝑋6𝐿 + 𝑋9𝐿 + 𝑋6𝑆 + 𝑋9𝑆 ≤ 1
Figure 11 - Large Button Interference
3.4.4 Adjacent Buttons
Symmetry is kept in the design by preventing adjacent buttons.
𝑋𝑖𝐿 − 𝑋(𝑖+1)𝐿 ≤ 1 𝑓𝑜𝑟 𝑖 = 1,2 … 8
𝑋𝑖𝑠 − 𝑋(𝑖+1)𝑠 ≤ 1 𝑓𝑜𝑟 𝑖 = 1,2 … 11
Figure 12 - Adjacent Buttons
3.4.5 Mixing Boxes
A small box cannot be between two large boxes
𝑋1𝐿 + 𝑋3𝐿 + 𝑋2𝑠 ≤ 2
𝑋4𝐿 + 𝑋6𝐿 + 𝑋5𝑠 ≤ 2
𝑋7𝐿 + 𝑋9𝐿 + 𝑋8𝑠 ≤ 2
Figure 13 - Mixing Boxes
22
3.4.6 Results from Optimization Model
The results from the Optimization model gave the following result:
Large Boxes Located at X1 and X3
Small Box Located at X7, X9, X10, and X12
“Score” from Objective Function is 8.4
3.5 ATM System Design
The ATM System design was creating using Microsoft Access 2013 on a
Microsoft Surface Pro featuring Windows 8.1. Microsoft Access was used because of the
familiarity of the coding language VBA, and because it could store time completion data
and export it easily to Excel. There were 3 ATM systems created. One featured every
button on the main menu screen, another featuring a traditional ATM GUI, and lastly an
ATM GUI utilizing the Optimization design.
3.5.1 All ATM Models
In order to reduce the type of variations in the different GUI models some aspects
were kept the same in each model. Each model had a red-orange log off button that
would call the users attention to exit the program when the user was completed. Each
button and background in the models had the same color to prevent color from being a
factor that needed to be tested. Each GUI was also capable of performing the same
actions, the only difference was the way the layouts were designed and if a user needed to
go into sub menus to perform tasks.

23
3.5.2 All Button ATM GUI
In this ATM setting the ATM features a button for every single action on the front
screen. This will be to see if a “crowded” GUI will effect performance or aesthetics
compared to the Optimization or Traditional form. It will also see if a user finds a form
more useful if every option is available for the subject. When a user wants to withdraw
cash they must enter a different screen in order to punch in the numbers.
Figure 14 - Example of the Main Screen
In this setting the buttons are arranged in alphabetical order from up and down
since previous GUI said that having a set order makes a good graphical design [9]. When
an option is selected on this screen a message box will open up letting the user know the
task has gone through.
For example, when a user clicks the button that says “Print Last 5 Checks” a
menu box opens and alerts the user that the transaction has gone through as seen in
Figure 15 - All Buttons Menu Box Message Box.
24
Figure 15 - All Buttons Menu Box Message Box
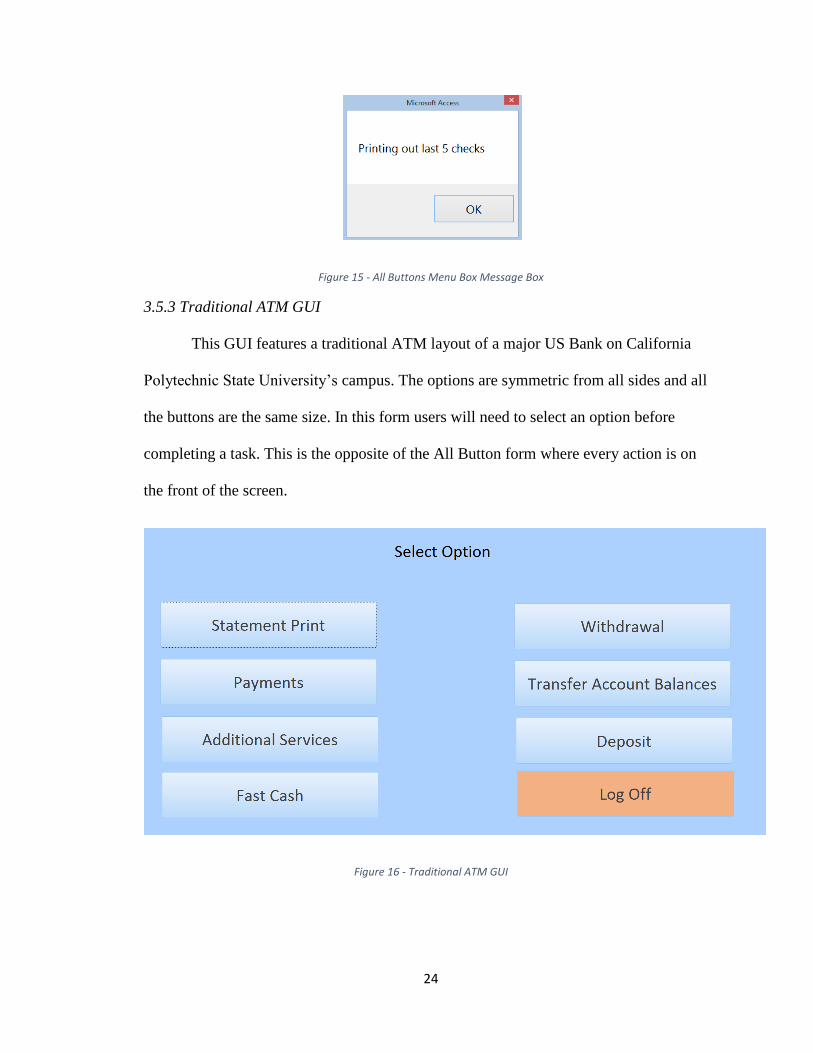
3.5.3 Traditional ATM GUI
This GUI features a traditional ATM layout of a major US Bank on California
Polytechnic State University’s campus. The options are symmetric from all sides and all
the buttons are the same size. In this form users will need to select an option before
completing a task. This is the opposite of the All Button form where every action is on
the front of the screen.
Figure 16 - Traditional ATM GUI

25
When a user clicks on one of the buttons the next menu opens up. For example,
when a person clicks on “Statement Print” a list of available actions is shown as seen in
Figure 17- Statement Print Form GUI.
Figure 17- Statement Print Form GUI
From this menu the user would be able to print statements to show up on the
receipt and a message box would appear as shown in Figure 18 - Printing Out Last Debit
Cards Message Box.
Figure 18 - Printing Out Last Debit Cards Message Box

26
3.5.4 Optimization Model ATM GUI
This model is based off of the Optimization Model that was created. There are
two large buttons located at X1 and X3. There are small buttons located at X7, X9, X10
and X12. The Withdrawal and Deposit are chosen because of the poll results that were
decided earlier that these were the most popular transactions. There needed to be at least
4 other buttons to perform all the other tasks. So Statement Print, Additional Services,
Transfer Account Balances, and Log Off were chosen as the final option for the smaller
buttons.
Figure 19 - Optimization Model GUI
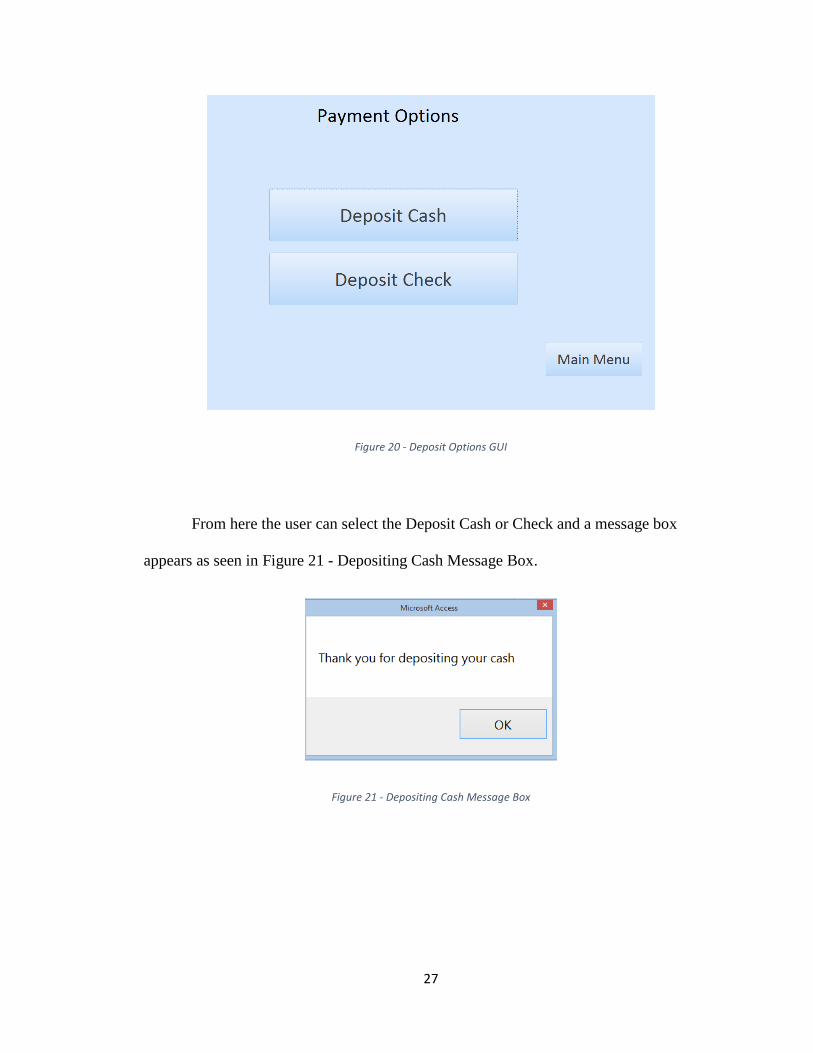
When a user clicks on one of these buttons another form will open up allowing
the user to select the final action. For example, when clicking on Deposit another menu
screen pops up as seen in Figure 20 - Deposit Options GUI
27
Figure 20 - Deposit Options GUI
From here the user can select the Deposit Cash or Check and a message box
appears as seen in Figure 21 - Depositing Cash Message Box.
Figure 21 - Depositing Cash Message Box

28
3.5.5 Post Experiment Survey
After the participant is finished with the experiment he or she will be asked to fill
out what they thought about the aesthetics, usability, and satisfaction about the design of
each of the GUIs. This data will be stored in a Microsoft Excel database.
A Likert scale was chosen to rate the forms so that the users feedback could be
analyzed statistically. A scale from 1 to 7 was chosen and was kept constant throughout
the entire experiment to reduce biases from the subjects. Even though some people may
have different opinion on a GUI, this scale can effectively take a holistic approach at all
users feedback. [11] [17].
Figure 22 - Rating form of Optimization Model

29
CHAPTER 4: METHODOLOGY
4.1 Design
The design of the experiment is a three-way ANOVA with three fixed variables:
Form, Gender, and Block. The factors and experiment design are detailed in Table 1 and
Table 2.
Table 1 - All Factors and Levels
Factors Levels Type of Variables
Form 3 Fixed
Gender 2 Fixed
Block 6 Fixed
Table 2- Experimental Design
All Buttons Optimization Traditional
Male
Female
In order to reduce the effects of learning the experiment was counterbalanced as
seen in Table 3 - Combination of Runs. Every male and female subject in the experiment
performed all three tests; however, the order was changed per participant. The number 1
under each run corresponds to the All Button form, 2 is the Optimization form, and 3 is
the Traditional form. First Run, Second Run, and Third run refer to how many times the
order has been repeated. For example, Subject 16 would be the third male to do complete
the experiment in Optimization, Traditional, and All Button form order.

30
Table 3 - Combination of Runs
4.2 Hypotheses
There are seven hypothesis in this experiment. This purpose of the experiment is
to see if the type of form (All Button, Optimization, or Traditional) or gender (Male vs
Female) has an effect on the speed of completing tasks using a tablet or their ratings of
the aesthetics, usability, or satisfaction. The blocking (A, B, C, D, E, or F) is also looked
at to see if the way they complete the experiment has an effect on their results. The
hypotheses are listed below in Table 4- Hypotheses.
Subject Subject Subject
1 1 2 3 7 1 2 3 13 1 2 3
2 1 3 2 8 1 3 2 14 1 3 2
3 2 1 3 9 2 1 3 15 2 1 3
4 2 3 1 10 2 3 1 16 2 3 1
5 3 1 2 11 3 1 2 17 3 1 2
6 3 2 1 12 3 2 1 18 3 2 1
Subject Subject Subject
19 1 2 3 25 1 2 3 31 1 2 3
20 1 3 2 26 1 3 2 32 1 3 2
21 2 1 3 27 2 1 3 33 2 1 3
22 2 3 1 28 2 3 1 34 2 3 1
23 3 1 2 29 3 1 2 35 3 1 2
24 3 2 1 30 3 2 1 36 3 2 1
First Run Second Run Third Run
Male
Female
First Run Second Run Third Run

31
Table 4- Hypotheses
Null Hypothesis Type
The population means for Forms are equal Main effect
The population means for Gender are equal Main effect
The population means for Blocks are equal Main effect
There is no interaction between Forms and Gender First-Order Interaction
There is no interaction between Forms and Blocks First-Order Interaction
There is no interaction between Gender and Blocks First-Order Interaction
There is no interaction between Forms, Gender, and Blocks Second-Order
Interaction
4.3 Participants
The subjects for this experiment were recruited on campus and needed to fit the
following criteria.
Cal Poly Students between the ages of 18 and 26
All majors except Computer Science and Software Engineers
A student needed to have normal vision. If a student uses contacts or glasses they
must wear them during the experiment.
Thirty-Six subjects were recruited in this experiment, eighteen men and eighteen
women. Each subject was offered a slice of pizza or a candy bar for participating in the
experiment.
32
4.4 Variables
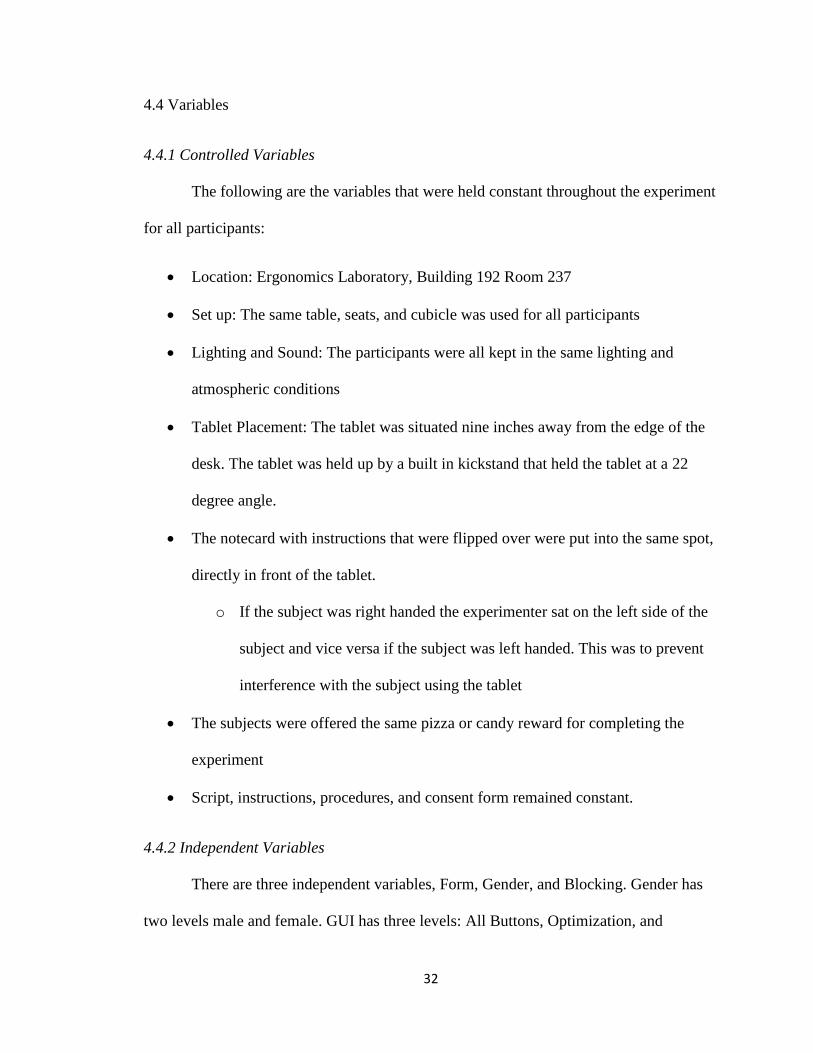
4.4.1 Controlled Variables
The following are the variables that were held constant throughout the experiment
for all participants:
Location: Ergonomics Laboratory, Building 192 Room 237
Set up: The same table, seats, and cubicle was used for all participants
Lighting and Sound: The participants were all kept in the same lighting and
atmospheric conditions
Tablet Placement: The tablet was situated nine inches away from the edge of the
desk. The tablet was held up by a built in kickstand that held the tablet at a 22
degree angle.
The notecard with instructions that were flipped over were put into the same spot,
directly in front of the tablet.
o If the subject was right handed the experimenter sat on the left side of the
subject and vice versa if the subject was left handed. This was to prevent
interference with the subject using the tablet
The subjects were offered the same pizza or candy reward for completing the
experiment
Script, instructions, procedures, and consent form remained constant.
4.4.2 Independent Variables
There are three independent variables, Form, Gender, and Blocking. Gender has
two levels male and female. GUI has three levels: All Buttons, Optimization, and

33
Traditional form. Blocking has 6 levels that corresponds to the order the experiment is
completed: A, B, C, D, E, & F.
4.4.3 Dependent Variables
The dependent variable is the speed in how fast they complete the tasks per form
in seconds. Moreover, they were asked to rate the Aesthetics, Usability, and Satisfaction
of each form on a scale that went from 1 to 7.
4.5 Experiment
First the participant will be asked to read and sign the Informed Consent Form.
[See Appendix D] Afterwards the subject will be asked to perform the practice run (See
Figure 23 - Example of Practice Form) so that they can become familiar with the
experiment. [Attachment F] will be given to them. They will be asked to perform the
following tasks on the practice form through index cards:
Touch Button 1
Touch Button 5
Touch Button 6
Figure 23 - Example of Practice Form

34
Each task will be shown one at a time and the next task will not be shown until they
complete the preceding task. This shows the subjects three major things about the
program: How a button reacts to being touched on the system, how a message box
appears, and how a subject may need to push a button in order to access the next button.
This way they are not learning this when they are experimenting on the actual experiment
GUI.
After the practice run is completed the subject will be handed the instructions [See
Appendix E] while the experimenter reads them out loud. The participant will be
randomly assigned an order to complete the three forms as shown in Table 3 -
Combination of Runs. The timing would begin as soon as the subject touched “Begin the
Experiment” and would stop when they touched “Log Off”. The subject would start the
experiment doing the following transactions on the ATM in the same order for all the
forms.
Deposit Cash
Withdraw $100
Deposit Check
Print Last 5 Deposits
Withdraw $120
Print Last 5 Checks
Withdraw $180
Deposit Check
Print Last 5 Card Transactions
Log Off

35
Each task would be on a notecard and would be revealed to the subject in between
themselves and the tablet only after they completed the preceding task. The subject was
not told that the order would be the same for all three forms.
4.6 Post Experiment
The subject would then be asked to read over the survey form when they
completed the experiment. (See Appendix F) They would be asked to rate the forms in
the same order that they completed the experiment on the Aesthetics, Usability, and their
Satisfaction of the forms.
36
CHAPTER 5: RESULTS
5.1 Overview of Data
The completion times and the user’s ratings based on Aesthetics, Usability, and
Satisfaction of each form was analyzed to determine if Gender, Form, or Blocking were
significant interactions in the experiment. First, descriptive statistics were made for each
of the completion times and rating criteria. Next, the normality of the data was analyzed
for each criteria. Finally, a three-way ANOVA as performed to see if the factors or their
interactions had any significant effect on the results.
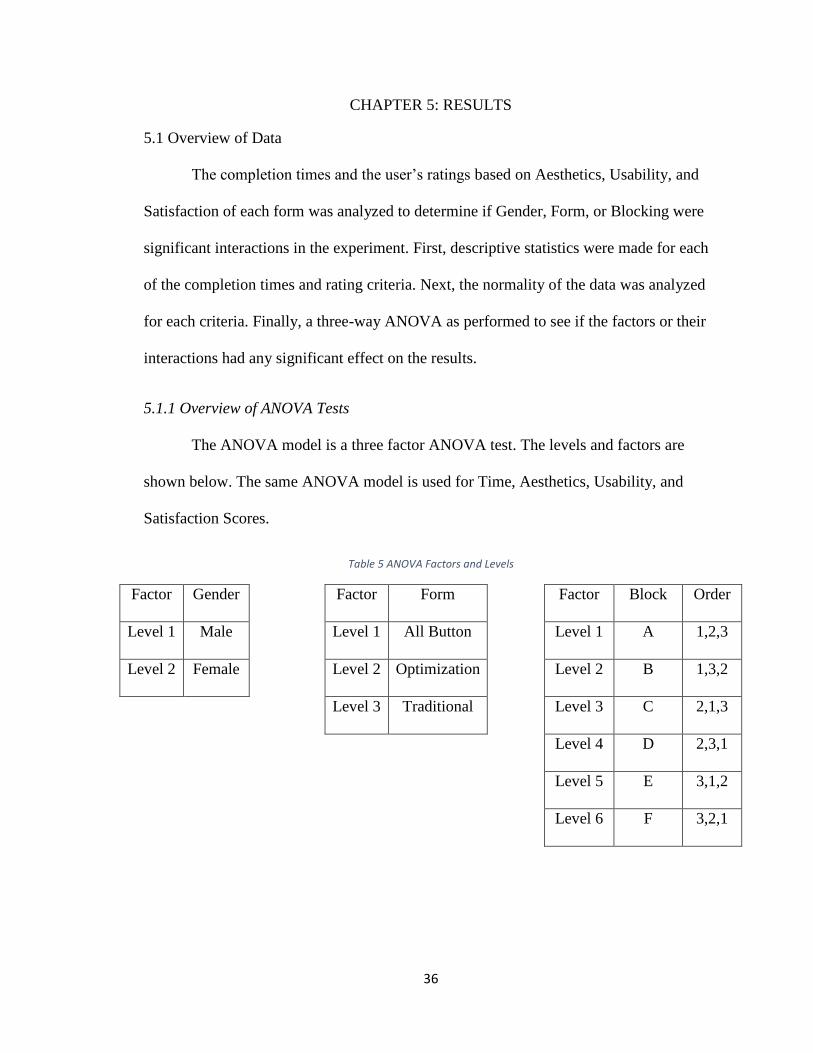
5.1.1 Overview of ANOVA Tests
The ANOVA model is a three factor ANOVA test. The levels and factors are
shown below. The same ANOVA model is used for Time, Aesthetics, Usability, and
Satisfaction Scores.
Table 5 ANOVA Factors and Levels
Factor Gender Factor Form Factor Block Order
Level 1 Male Level 1 All Button Level 1 A 1,2,3
Level 2 Female Level 2 Optimization Level 2 B 1,3,2
Level 3 Traditional Level 3 C 2,1,3
Level 4 D 2,3,1
Level 5 E 3,1,2
Level 6 F 3,2,1

37
5.2 Completion Time Score Data
5.2.1 Descriptive Statistics of Completion Times
Table 6 - Descriptive Statistics for Completion Times
Descriptive Statistics: Completion Times
N 108
Mean* 58.54
Standard Deviation* 10.83
Minimum* 36
Q1* 49.50
Median* 57.50
Q3* 65.75
Maximum* 86
Skewness 0.46
Kurtosis -0.40
*Units in seconds
The average time to complete the forms is 58.54 seconds. The fastest completed
time is 36 seconds and the slowest time is 86 seconds. The histogram of the completion
times is shown in Figure 24- Histogram of Score. The Skewness is 0.47 positive skew
and it is moderately skewed to the left. A negative Kurtotis 0.48 shows that the data is
marginally flatter than normal data.

38
Figure 24- Histogram of Score
5.2.2 Test of Normality of Time Score
The residuals was tested for normality to verify that ANOVA tests could be done.
Ryan-Joiner test of normality was chosen because it avoids rejecting normality due to
rounding. The residuals were tested for normality and has a P-Value of >0.100 shows
that the data is normal.
8070605040
25
20
15
10
5
0
Score
Fre
qu
en
cy
Histogram of Time Score

39
20100-10-20
99.9
99
95
90
80
7060504030
20
10
5
1
0.1
RESI1
Pe
rce
nt
Mean -6.57910E-17
StDev 6.402
N 108
RJ 0.997
P-Value >0.100
Probability Plot of RESI1Normal
Figure 25 - Residual Normality of Time Score
5.2.3 Time ANOVA Table
Table 7 - Time ANOVA Table
Source DF F Value P Value
Gender 1 0.22 0.641
Form 2 28.53 0.000
Block 5 2.2 0.063
Gender*Form 2 0.14 0.871
Gender*Block 5 1.78 0.128
Form*Block 10 4.83 0.000
Gender*Form*Block 10 0.82 0.613
There are two significant factors in the experiment for the time score as seen in
Table 7 - Time ANOVA Table. The interaction between Form and Block and the Form in
the experiment with P-Values of 0.000. Blocking proved to be a notable effect with a P-
Value of 0.063; however, it was above the P-Value of 0.05 so it is not significant.
40
Another notable factor was the interaction between Gender and Blocking with a P-Value
of 0.128. Gender, Gender & Form Interaction, and Gender & Form & Block interactions
were not significant with P-Values of 0.641, 0.871, and 0.613 respectively.
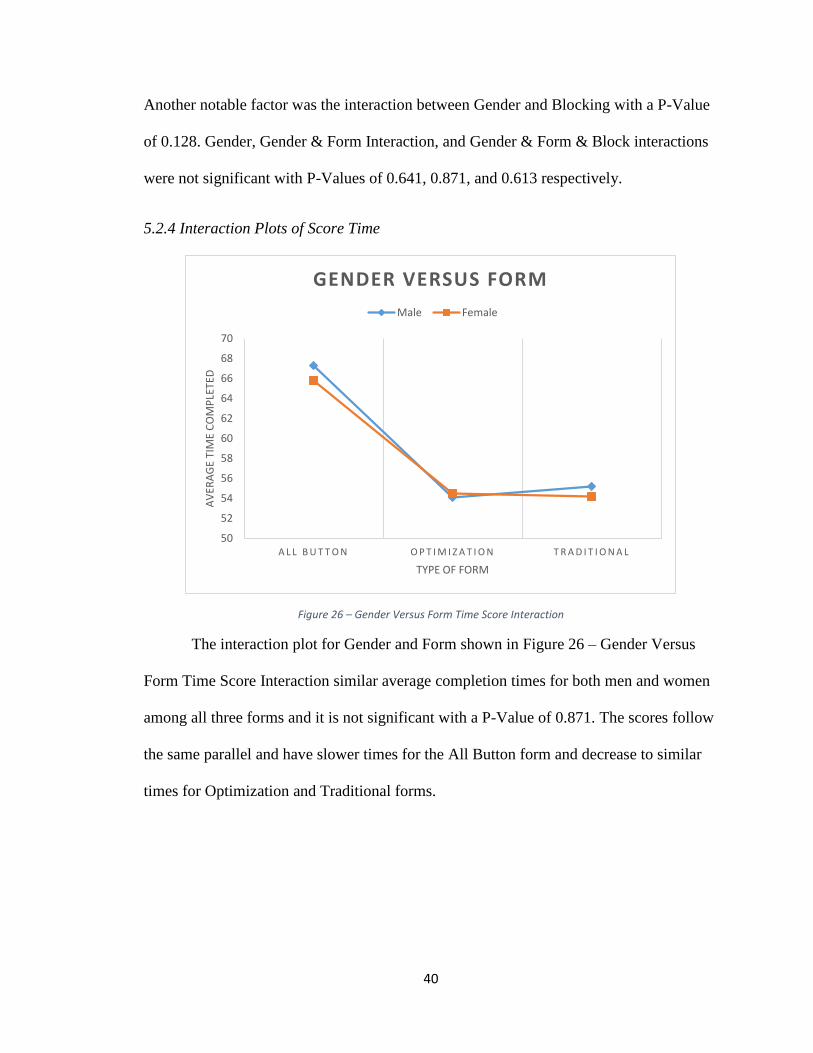
5.2.4 Interaction Plots of Score Time
Figure 26 – Gender Versus Form Time Score Interaction
The interaction plot for Gender and Form shown in Figure 26 – Gender Versus
Form Time Score Interaction similar average completion times for both men and women
among all three forms and it is not significant with a P-Value of 0.871. The scores follow
the same parallel and have slower times for the All Button form and decrease to similar
times for Optimization and Traditional forms.
50
52
54
56
58
60
62
64
66
68
70
A L L B U T T O N O P T I M I Z A T I O N T R A D I T I O N A L
AV
ERA
GE
TIM
E C
OM
PLE
TED
TYPE OF FORM
GENDER VERSUS FORM
Male Female

41
Figure 27 - Gender Versus Block Time Score Interaction
The interaction between Gender and Block (Figure 27 - Gender Versus Block
Time Score Interaction) has a larger variability of average completion times for Females
compared to Males; however, there is not a significant interaction according to the
ANOVA tests with a P-Value of 0.128. For women, the fastest average completion times
occur when the Optimization form was completed last, Blocks B & D. For men, the
Optimization form have the fastest average completion time in Block E when the
Optimization form was last, but unlike women, was slower in Block B. For women, the
slowest completion times are when the Optimization for was completed first in Blocks C
& D. For men, the slowest completion times are in Blocks B & C. Men and Women have
similar completion times in Block A and F which have the same order but reversed.
50
52
54
56
58
60
62
64
66
68
70
A B C D E F
AV
ERA
GE
TIM
E C
OM
PLE
TED
BLOCK
GENDER VERSUS BLOCK TIME SCORE
Male Female

42
Figure 28- Form Versus Block Time Score Interaction
The Form and Block has a significant interaction (Figure 28- Form Versus Block
Time Score Interaction) effect on the average completion times with a P-Value of 0.000.
The All Button Form consistently has the slowest times over the course of the
experiment. In the Blocks where the All Button Form was completed first, Blocks A & B,
the average completion time is the slowest.
The Optimization Form has the slowest completion times in Blocks C & D and
that was when the Optimization form was completed first for the subjects. Block B is
completed in a faster average time than Block A for the Optimization form. In Block B,
the Optimization form was completed last and in Block A it was completed second. The
completed times for Block B, E, and F are similar in completion time.
When the Traditional Form was completed first, Blocks E & F, the average
completion time is slowest. The average completion times is similar for Blocks A, B, C,
& D. The completion times for the Traditional Form is slower than the Optimization
Form in Blocks B, E, & F.
45
50
55
60
65
70
75
A B C D E F
AV
ERA
GE
TIM
E C
OM
PLE
TED
BLOCK
FORM VERSUS BLOCK
All Button Optimization Traditional

43
5.2.5 Comparison for Order
The slowest average time for every form occurred when the form went first for
the subject. In order to see how this effect played out throughout the experiment a
different Three-Way ANOVA model was analyzed. The normality of the residuals was
tested which has a P-Value of 0.080 as seen in Figure 29 - Probability Plot of Form and
Order showing that the data is normal.
Table 8 - Order ANOVA Design
Factor Gender Factor Form Factor Order
Level 1 Male Level 1 All Button Level 1 Completed 1st
Level 2 Female Level 2 Optimization Level 2 Completed 2nd
Level 3 Traditional Level 3 Completed 3rd
Figure 29 - Probability Plot of Form and Order
20100-10-20
99.9
99
95
90
80
7060504030
20
10
5
1
0.1
RESI1
Pe
rce
nt
Mean 5.263280E-16
StDev 7.389
N 108
RJ 0.989
P-Value 0.080
Probability Plot of RESI1Normal

44
5.2.6 Order ANOVA Table
Table 9 - Order ANOVA Table
Source DF F Value P Value
Gender 1 0.21 0.651
Form 2 26.77 0.000
Order 2 19.23 0.000
Gender*Form 2 0.13 0.879
Gender*Order 2 0.12 0.885
Form*Order 4 2.08 0.090
Gender*Form*Order 4 0.54 0.704
The Form and the Order both have a significant effect on the average completion
times with P-Values of both 0.000. The interaction between the two, while notable, is not
significant with a P-Value of 0.090. Gender, Gender*Form, Gender*Order, and
Gender*Form*order do not have a significant effects on the average completion times
with high P-Values of 0.651, 0.879, 0885, and 0.704 respectively.
45
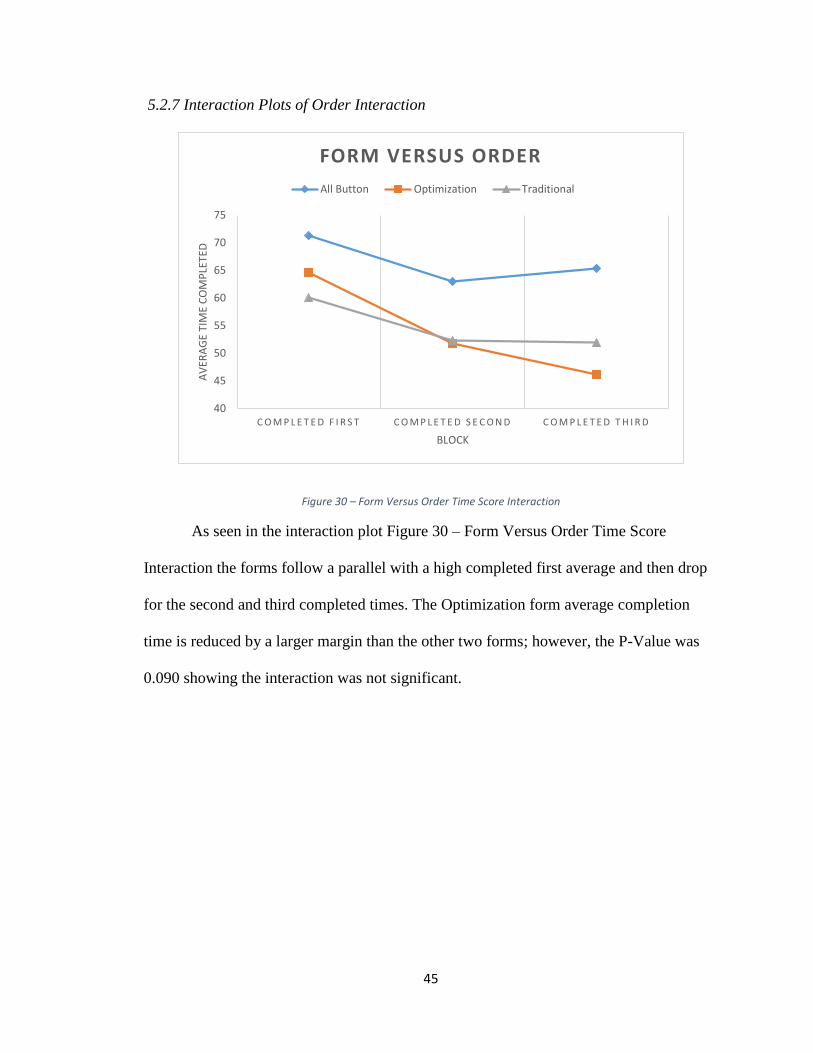
5.2.7 Interaction Plots of Order Interaction
Figure 30 – Form Versus Order Time Score Interaction
As seen in the interaction plot Figure 30 – Form Versus Order Time Score
Interaction the forms follow a parallel with a high completed first average and then drop
for the second and third completed times. The Optimization form average completion
time is reduced by a larger margin than the other two forms; however, the P-Value was
0.090 showing the interaction was not significant.
40
45
50
55
60
65
70
75
C O M P L E T E D F I R S T C O M P L E T E D S E C O N D C O M P L E T E D T H I R D
AV
ERA
GE
TIM
E C
OM
PLE
TED
BLOCK
FORM VERSUS ORDER
All Button Optimization Traditional

46
Figure 31 - Gender Versus Order Time Score Interaction
5.2.8 Tukey Tests
Table 10 - Tukey Test of Order
Form N Mean Grouping Order N Mean Grouping
All Button 36 66.56 A Completed 1st 36 65.31 A
Traditional 36 54.75 B Competed 2nd 36 55.72 B
Optimization 36 54.31 B Completed 3rd 36 54.58 B
Subjects did significantly worse on the first form they completed compared to
their second and third form as evidenced in Table 10 - Tukey Test of Order. The second
and third forms completed have similar completion times with averages of 55.72 and
54.58 respectively. The All Button form also completed significantly slower on average
compared to the other two forms with an average that is 12 seconds slower.
50
52
54
56
58
60
62
64
66
68
C O M P L E T E D F I R S T C O M P L E T E D S E C O N D C O M P L E T E D T H I R D
GENDER VERSUS ORDER
Male Female

47
5.3 Aesthetics Score Data
5.3.1 Descriptive Statistics of Aesthetics Scores
Table 11 - Descriptive Statistics for Aesthetics Scores
Descriptive Statistics: Completion Times
N 108
Mean* 4.750
Standard Deviation* 1.686
Minimum* 1.000
Q1* 4.000
Median* 5.000
Q3* 6.000
Maximum* 7.000
Skewness -0.71
Kurtosis -0.33
*Units in seconds
The average score for the form is 4.750. The lowest rating that was given is 1 and
the highest rating given is 7. The histogram of the scores given is in shown in Figure 32-
Histogram of Aesthetics Scores. The Skewness is 0.71 negative skew and it is moderately
skewed to the right. A negative Kurtotis 0.33 shows that the data is marginally flatter
than normal data.
7654321
35
30
25
20
15
10
5
0
Aesthetics
Fre
qu
en
cy
Histogram of Aesthetics
Figure 32- Histogram of Aesthetics Scores

48
5.3.2 Test of Normality for Aesthetics
The residuals was tested for normality to verify that ANOVA tests could be done.
Ryan-Joiner test of normality was chosen because it avoids rejecting normality due to
rounding. The residuals were tested for normality and has a P-Value of 0.077 shows that
the data is normal.
Figure 33 - Residual Normality of Aesthetics Score
5.3.3 ANOVA Table for Aesthetics Score
Table 12- ANOVA of Aesthetics Score
Source DF F Value P Value
Gender 1 0.01 0.924
Form 2 98.51 0.000
Block 5 0.19 0.965
Gender*Form 2 2.22 0.116
Gender*Block 5 0.95 0.456

49
Form*Block 10 1.22 0.292
Gender*Form*Block 10 0.73 0.690
There is only one significant factor (Table 12- ANOVA of Aesthetics Score)
based on an alpha of 0.05 and that is the type of Form used with a P-Value of 0.000.
Gender is not a significant effect and neither is the Block with P-Values of 0.924 and
0.965 respectively. The interaction between Gender and Form is notable, but it is not a
significant effect with a P-Value of 0.116. The other interactions (Gender*Block &
Form*Block) are not significant with P-Values of 0.456 and 0.292. Lastly, the second-
order interaction is not significant either with a P-Value of 0.690.
5.3.4 Interaction Plots of Aesthetics Score
Figure 34- Gender Versus Form Aesthetics Score Interaction
The Gender and Form interaction plot (Figure 34- Gender Versus Form
Aesthetics Score Interaction) has similar average scores for each data point by form. This
shows there is not an interaction as evidenced by the P-Value of 0.116. It is notable that
0
1
2
3
4
5
6
7
A L L B U T T O N O P T I M I Z A T I O N T R A D I T I O N A L
AV
ERA
GE
SCO
RE
TYPE OF FORM
GENDER VERSUS FORM
Male Female
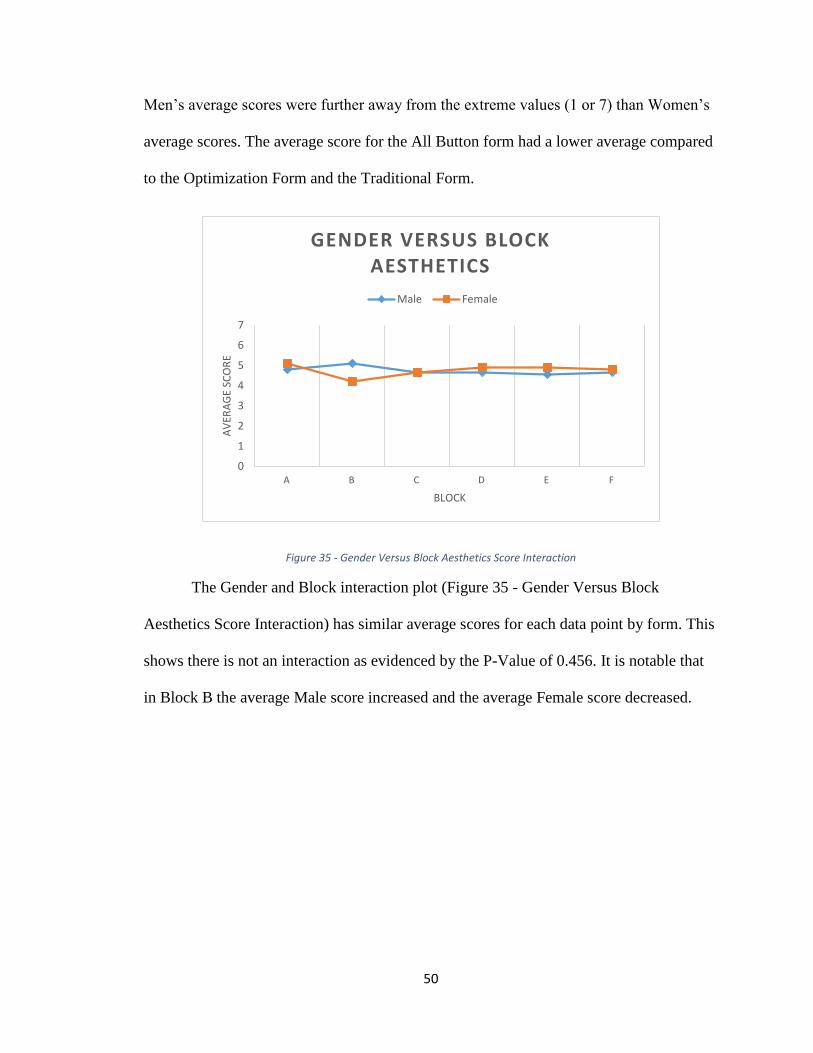
50
Men’s average scores were further away from the extreme values (1 or 7) than Women’s
average scores. The average score for the All Button form had a lower average compared
to the Optimization Form and the Traditional Form.
Figure 35 - Gender Versus Block Aesthetics Score Interaction
The Gender and Block interaction plot (Figure 35 - Gender Versus Block
Aesthetics Score Interaction) has similar average scores for each data point by form. This
shows there is not an interaction as evidenced by the P-Value of 0.456. It is notable that
in Block B the average Male score increased and the average Female score decreased.
0
1
2
3
4
5
6
7
A B C D E F
AV
ERA
GE
SCO
RE
BLOCK
GENDER VERSUS BLOCK AESTHETICS
Male Female

51
Figure 36 - Form Versus Block Aesthetics Score Interaction
The interaction between Form and Block is not significant in this experiment with
a P-Value of 0.292. The average score for Aesthetics remained the highest in all blocks
for the Optimization Model, followed by the Traditional form and then the All Button
form. In Blocks where the Optimization and Traditional Buttons were done back to back
(Block A, B, D, and F) the scores were closer in Blocks B, D, and F. The average score
for the All Button form is the highest when it was the first form completed (Blocks A &
B).
5.3.5 Tukey Results of Aesthetics Score
The type of Form used was the only significant effect discovered in the
experiment. A Tukey Test was performed on the Aesthetics scores to see the differences
in results. The results from the Tukey test showed that each of the forms are significantly
different as seen below in Table 13 - Aesthetics Tukey Results. The form with the highest
aesthetics average score was the Optimization Form with an average of 6.0278. Next was
0
1
2
3
4
5
6
7
A B C D E F
AV
ERA
GE
SCO
RE
BLOCK
FORM VERSUS BLOCK
All Button Optimization Traditional

52
the Traditional Form with an average of 5.3611, about 0.7 lower than the Optimization
Form. The All Button form had the lowest average about 2.8.
Table 13 - Aesthetics Tukey Results
Form N Mean Grouping
Optimization 36 6.0278 A
Traditional 36 5.3611 B
All Button 36 2.8611 C

53
5.4 Usability Score Data
5.4.1 Descriptive Statistics of Usability Scores
Table 14 - Descriptive Statistics for Completion Times
Descriptive Statistics: Completion Times
N 108
Mean* 4.944
Standard Deviation* 1.645
Minimum* 1
Q1* 4
Median* 5
Q3* 6
Maximum* 7
Skewness -0.73
Kurtosis 0
*Units in seconds
The average score for Usability score is 4.944 (Table 14 - Descriptive Statistics
for Completion Times), which is 0.3 points higher than the average for Aesthetics. The
lowest and highest scores are 1 and 7, the min and max allowable score. The Skewness is
negative 0.73 showing that the data is negatively skewed to right. The Kurtosis is 0
following a normal distribution.
7654321
40
30
20
10
0
Usability
Fre
qu
en
cy
Histogram of Usability
Figure 37- Histogram of Usability Scores

54
5.4.2 Test of Normality
The residuals was tested for normality to verify that ANOVA tests could be done.
Ryan-Joiner test of normality was chosen because it avoids rejecting normality due to
rounding. The residuals were tested for normality and have a P-Value of 0.040 which is
under a P-Value of 0.05; however, there has been arguments against restricting ANOVA
tests for Likert scales on normality results [17]. Thus, the ANOVA testing was done in
order to keep similar comparisons to the Aesthetics and Satisfaction instead of using a
non-parametric test, but there is an acknowledgement on the P-Value being 0.04.
Figure 38 - Residual Normality of Usability Score

55
5.4.3 ANOVA Table for Usability Score
Table 15- ANOVA of Usability Score
Source DF F Value P Value
Gender 1 2.36 0.129
Form 2 134.71 0.000
Block 5 0.46 0.803
Gender*Form 2 0.52 0.598
Gender*Block 5 1.12 0.359
Form*Block 10 1.50 0.159
Gender*Form*Block 10 0.92 0.517
There is only one significant factor based on an alpha of 0.05 and that is the type
of Form used with a P-Value of 0.000 as seen in Table 15- ANOVA of Usability Score.
Gender, while notable, is not a significant effect with a P-Value of 0.129. The Blocking is
not significant with a high P-Values of 0.803. The interaction between Gender and Form
is not significant effect with a P-Value of 0.598. The interaction between Form*Block is
notable but is not significant with a P-Value of 0.159. Lastly, the second-order interaction
is not significant either with a P-Value of 0.517.

56
5.4.4 Interaction Plots of Usability Score
Figure 39 - Gender Versus Form Usability Score Interaction
The Gender and Form interaction plot (Figure 39 - Gender Versus Form Usability
Score Interaction) has similar average scores for each data point by form. This shows
there is not an interaction as evidenced by the P-Value of 0.598. Men and women
followed the same parallel by increasing to the highest for the Optimization form and
slightly lower for the Traditional form. It is notable that Men’s average scores were
further away from the extreme values (1 or 7) than Women’s average scores similar to
the Aesthetics Score.
0
1
2
3
4
5
6
7
A L L B U T T O N O P T I M I Z A T I O N T R A D I T I O N A L
AV
ERA
GE
SCO
RE
TYPE OF FORM
GENDER VERSUS FORM
Male Female

57
Figure 40 - Gender Versus Block Usability Score Interaction
The Gender and Block interaction plot (Figure 40 - Gender Versus Block
Usability Score Interaction) has similar average scores for each data point by form. This
shows there is not an interaction as evidenced by the P-Value of 0.359. It is notable that
in Blocks where the Traditional Form was used first (Blocks E & F), women gave
marginally higher average scores than men compared to the other blocks when female’s
scores were lower.
0
1
2
3
4
5
6
7
A B C D E F
AV
ERA
GE
SCO
RE
BLOCK
GENDER VERSUS BLOCK USABILITY
Male Female

58
Figure 41 - Form Versus Block Usability Score Interaction
The interaction between Form and Block (Figure 41 - Form Versus Block
Usability Score Interaction) is not significant in this experiment with a P-Value of 0.159,
but it is notable. The average score for Usability remained the highest in all blocks for the
Optimization Model, followed by the Traditional form and then the All Button form. In
Blocks where the Optimization and Traditional Buttons were done back to back (Block
A, B, D, and F) the scores are closer in Blocks B and F, but not Blocks A and D. In
Blocks where the All Button form went last (Blocks D and F) the average score is lower
compared to going second (Blocks C and E). This same phenomena exists for the
Traditional model, but not the Optimization model.
5.4.5 Tukey Results of Usability Score
The type of Form used was the only significant effect discovered for the usability
score. The results from the Tukey test showed that each of the forms are significantly
different as seen below in Table 16 - Usability Tukey Results. The form with the highest
0
1
2
3
4
5
6
7
A B C D E F
AV
ERA
GE
SCO
RE
BLOCK
FORM VERSUS BLOCK
All Button Optimization Traditional
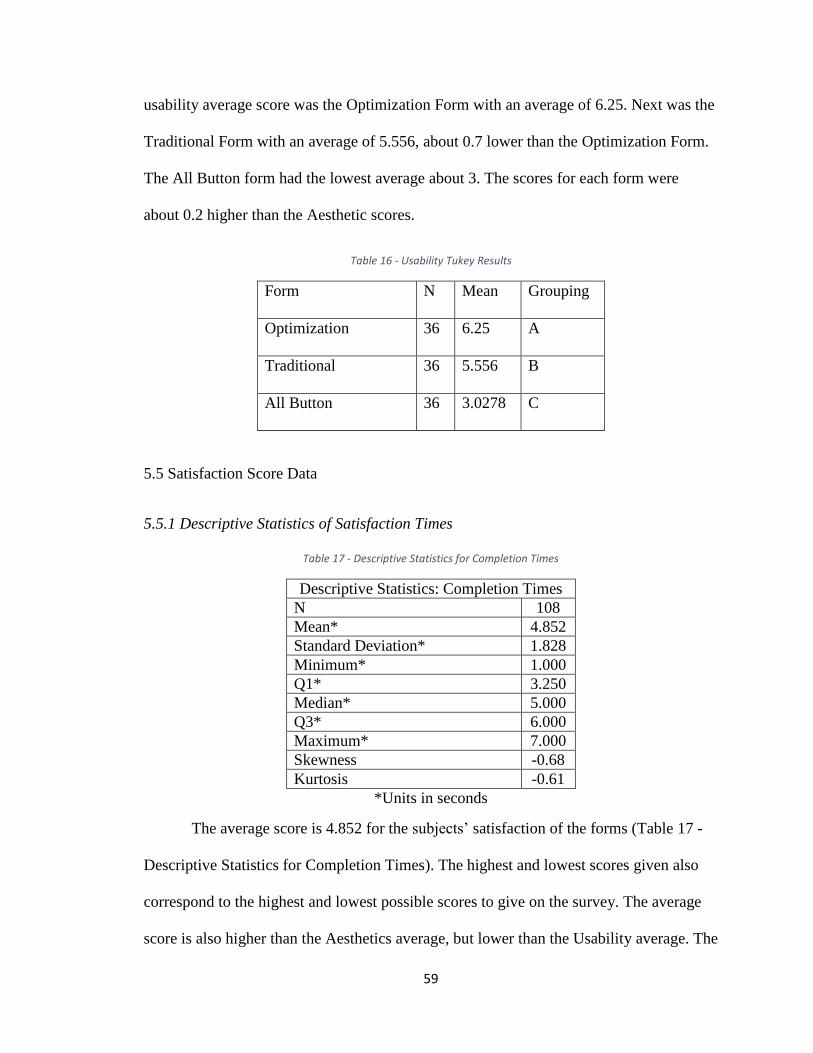
59
usability average score was the Optimization Form with an average of 6.25. Next was the
Traditional Form with an average of 5.556, about 0.7 lower than the Optimization Form.
The All Button form had the lowest average about 3. The scores for each form were
about 0.2 higher than the Aesthetic scores.
Table 16 - Usability Tukey Results
Form N Mean Grouping
Optimization 36 6.25 A
Traditional 36 5.556 B
All Button 36 3.0278 C
5.5 Satisfaction Score Data
5.5.1 Descriptive Statistics of Satisfaction Times
Table 17 - Descriptive Statistics for Completion Times
Descriptive Statistics: Completion Times
N 108
Mean* 4.852
Standard Deviation* 1.828
Minimum* 1.000
Q1* 3.250
Median* 5.000
Q3* 6.000
Maximum* 7.000
Skewness -0.68
Kurtosis -0.61
*Units in seconds
The average score is 4.852 for the subjects’ satisfaction of the forms (Table 17 -
Descriptive Statistics for Completion Times). The highest and lowest scores given also
correspond to the highest and lowest possible scores to give on the survey. The average
score is also higher than the Aesthetics average, but lower than the Usability average. The

60
Skewness is negative 0.68 showing the data is negatively skewed to the right. The
kurtosis is -0.61 showing that the data is flatter as evidence in the histogram (Figure 42 -
Histogram of Satisfaction Scores).
Figure 42 - Histogram of Satisfaction Scores
5.5.2 Test of Normality
The residuals was tested for normality to verify that ANOVA tests could be done.
Ryan-Joiner test of normality was chosen because it avoids rejecting normality due to
rounding. The residuals were tested for normality and has a P-Value of 0.082 shows that
the data is normal.
7654321
35
30
25
20
15
10
5
0
Satisfaction
Fre
qu
en
cy
Histogram of Satisfaction

61
Figure 43 - Residual Normality of Satisfaction Score
5.5.3 ANOVA Table for Satisfaction Score
Table 18- ANOVA of Usability Score
Source DF F Value P Value
Gender 1 0.03 0.854
Form 2 113.14 0.000
Block 5 0.60 0.697
Gender*Form 2 0.26 0.770
Gender*Block 5 1.03 0.406
Form*Block 10 1.53 0.145
Gender*Form*Block 10 0.50 0.887
There is only one significant factor based on an alpha of 0.05 and that is the type
of Form used with a P-Value of 0.000. Gender, is not a significant effect with a P-Value
of 0.854. The Blocking is not significant with a high P-Values of 0.697. The interaction is
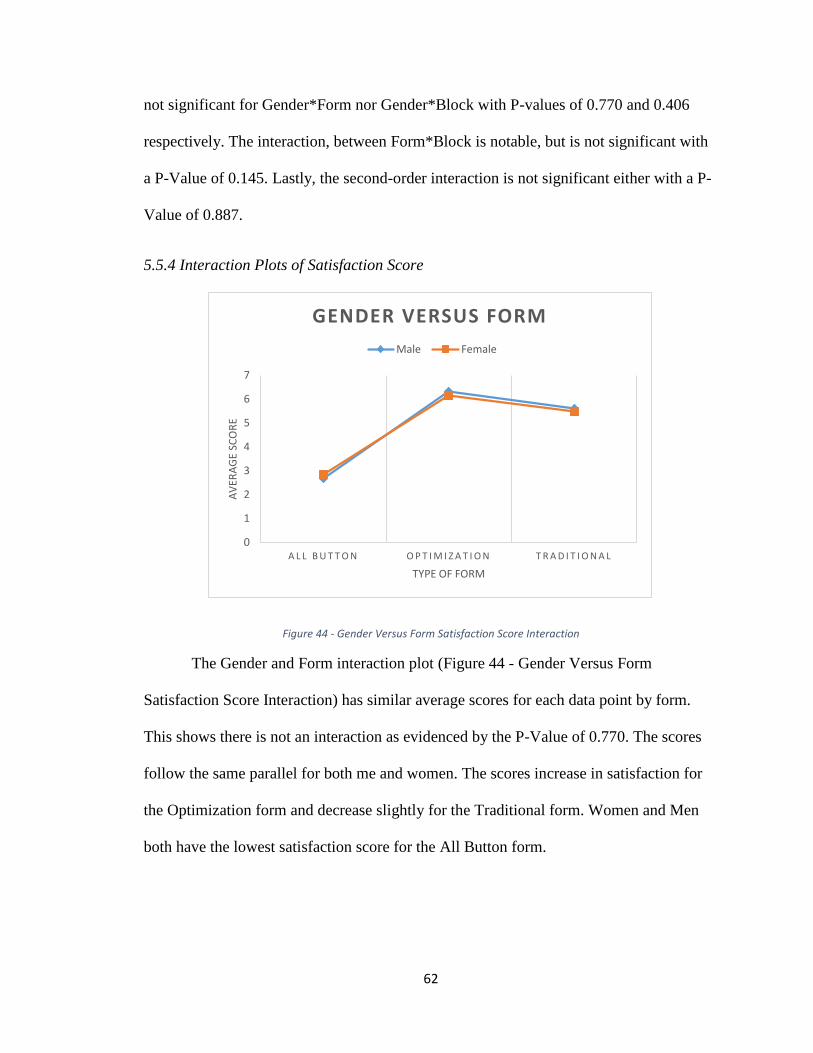
62
not significant for Gender*Form nor Gender*Block with P-values of 0.770 and 0.406
respectively. The interaction, between Form*Block is notable, but is not significant with
a P-Value of 0.145. Lastly, the second-order interaction is not significant either with a P-
Value of 0.887.
5.5.4 Interaction Plots of Satisfaction Score
Figure 44 - Gender Versus Form Satisfaction Score Interaction
The Gender and Form interaction plot (Figure 44 - Gender Versus Form
Satisfaction Score Interaction) has similar average scores for each data point by form.
This shows there is not an interaction as evidenced by the P-Value of 0.770. The scores
follow the same parallel for both me and women. The scores increase in satisfaction for
the Optimization form and decrease slightly for the Traditional form. Women and Men
both have the lowest satisfaction score for the All Button form.
0
1
2
3
4
5
6
7
A L L B U T T O N O P T I M I Z A T I O N T R A D I T I O N A L
AV
ERA
GE
SCO
RE
TYPE OF FORM
GENDER VERSUS FORM
Male Female
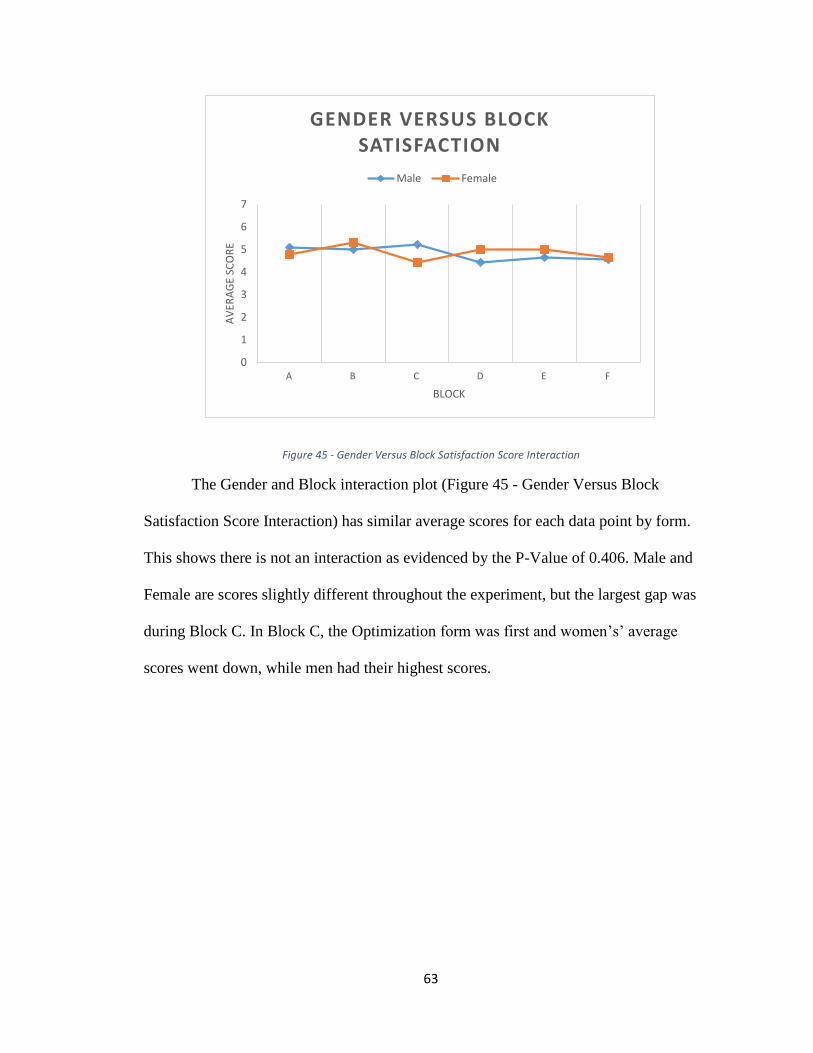
63
Figure 45 - Gender Versus Block Satisfaction Score Interaction
The Gender and Block interaction plot (Figure 45 - Gender Versus Block
Satisfaction Score Interaction) has similar average scores for each data point by form.
This shows there is not an interaction as evidenced by the P-Value of 0.406. Male and
Female are scores slightly different throughout the experiment, but the largest gap was
during Block C. In Block C, the Optimization form was first and women’s’ average
scores went down, while men had their highest scores.
0
1
2
3
4
5
6
7
A B C D E F
AV
ERA
GE
SCO
RE
BLOCK
GENDER VERSUS BLOCK SATISFACTION
Male Female

64
Figure 46 - Form Versus Block Satisfaction Score Interaction
The interaction between Form and Block (Figure 46 - Form Versus Block
Satisfaction Score Interaction) is not significant in this experiment with a P-Value of
0.145. The average score for satisfaction remained the highest in all blocks for the
Optimization Model except in Block F where Traditional scored marginally higher. The
average satisfaction score for the All Button form is higher on Blocks that it was first
(Blocks A and B). The Optimization form had lower average scores when it went last
(Block B and F).
5.5.5 Tukey Results of Aesthetics Score
The type of form used was the only significant effect discovered for the
satisfaction score. The results from the Tukey test showed that each of the forms are
significantly different as seen below in Table 19 - Satisfaction Tukey Results. The form
with the highest satisfaction average score is the Optimization Form with an average of
6.25. Next, is the Traditional form with an average of 5.556, about 0.7 lower than the
0
1
2
3
4
5
6
7
A B C D E F
AV
ERA
GE
SCO
RE
BLOCK
FORM VERSUS BLOCK
All Button Optimization Traditional

65
Optimization Research form. The All Button form has the lowest average about 3. The
scores are the same as the usability averages; however, the All Button form has a lower
average.
Table 19 - Satisfaction Tukey Results
Form N Mean Grouping
Optimization 36 6.25 A
Traditional 36 5.556 B
All Button 36 2.750 C

66
CHAPTER 6: DISCUSSION
6.1 Time Score Discussion
In order to cut back on the learning effect in this experiment a practice form was
created in order to teach the subjects how to use the interface on a tablet. The subjects
were also given every possible block combination so that the bias of the results would be
reduced. Even with these safe guards in place the interaction between blocking and form
has a significant effect on the experiment with a P-Value of 0.000. Every form in the
experiment performs the slowest in blocks where the form is set to appear first; however,
every form does not have the fastest average time when completed last (See Figure 28-
Form Versus Block Time Score Interaction). This is further shown in the second
ANOVA model that was created that looked at the order instead of the block of the
forms. The Tukey test is not able to demonstrate a significant difference in time when a
form was completed second or third, but only when a form was completed first. This
same Tukey test also demonstrates that the Optimization and the Traditional form had a
significantly faster average time than the All Button form (See Table 10 - Tukey Test of
Order).
Despite having a slower average time for the All Button form, the user had to
click on the screen less times compared to the other forms. In order to complete the
required tasks the All Button form required only 26 clicks, while the other two forms
required 33 clicks (26% increase in clicks.) Since the All Button form required less clicks
the reasons for the slower times had to be from other criteria. The All Button form has 17
buttons, the Traditional form has 8 buttons, and the Optimization form has 6 buttons on
the home screen. Many users verbally expressed their discomfort on the All Button form

67
by making comments that there were so many buttons on the screen and that it was too
confusing. This could play into the prior research about Miller’s Law and information
limits. The Optimization and Traditional form fall within the seven plus or minus two
limit while the All Button form is well outside this limit. Many subjects spent a large
amount of time scanning the interface screen in order to complete the tasks. Since there
was a large amount of buttons on the All Button screen it is possible that they were not
able to focus as well as the other forms since they were not able to store all the buttons in
their short term memory. Having the larger buttons on the Optimization form on the top
did not give a significant time difference compared to the Traditional form as evidence by
the Tukey tests.
Gender did not play a significant role on the average completion time with a P-
Value of 0.641. The interactions of Gender with Form or Block did not have a significant
effect on the completion times either. Lastly, the second order interaction did not have a
significant effect on completion times either.
Ultimately, because there is an interaction with blocking and form a definitive
conclusion cannot be drawn about which form allows users to complete tasks fastest. If
only the order of the form is taken into account, then the All Button form performed
slower on average than the other two forms which could be due to the memory limit on
people’s short terms memory.
6.2 Aesthetic Discussion
The only factor that had an impact on the Aesthetics score according to the
ANOVA test was the type of form used with a P-Value of 0.000. Gender and Block did
not have a significant effect on the aesthetic scores P-Values of 0.924 and 0.965
68
respectively. The interactions do not have an effect on the ratings either. According to the
Tukey tests each form was statistically different effect on the Aesthetic score. The
Optimization form has the highest average score, 6.028 which corresponds to “Very
Good” according to the Likert Scale chosen for the experiment. The Traditional form has
an average score of 5.361 which corresponds to “Good” on the Likert Scale. Lastly, the
All Button form had an average of 2.861, which rounds up to “Bad”.
The Optimization form was made to create symmetry and balance for the user so
that the user can easily process the buttons on the screen; however, there is less symmetry
than the Traditional form. The Optimization form had two large buttons on the top of the
form, though symmetrical vertically, it was not symmetrical horizontally like the
Traditional form. This may show that having 100% symmetry is not the only important
feature of an aesthetic menu driven interface, but can just be one factor. The
Optimization form had large easy to access buttons for components that people mostly
used an ATM form. They could have subconsciously chosen this form as the most
aesthetic because it was easy for them to focus on when doing a transaction involving
withdrawing cash or depositing money. Most users verbally responded that they liked the
visual look of the Optimization form because it was easy to read.
6.3 Usability Discussion
Same as the aesthetics, the type of form is the only factor that has a statistically
significant impact on the rating score with a P-Value of 0.000. Gender and Block did not
have a statistically significant effect on the usability score with P-Values of 0.129 and
0.803 respectively. The interactions and the second-level interaction also had no effect on
the ratings score. The Tukey test performed shows that each form is statistically different
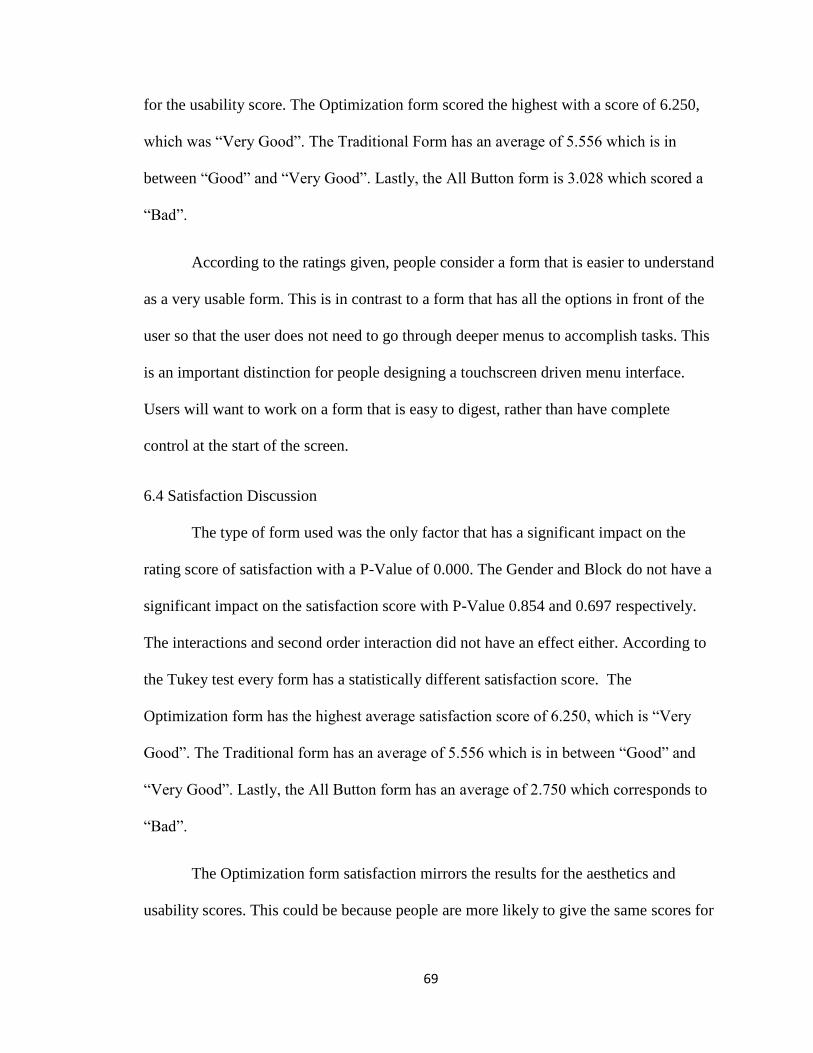
69
for the usability score. The Optimization form scored the highest with a score of 6.250,
which was “Very Good”. The Traditional Form has an average of 5.556 which is in
between “Good” and “Very Good”. Lastly, the All Button form is 3.028 which scored a
“Bad”.
According to the ratings given, people consider a form that is easier to understand
as a very usable form. This is in contrast to a form that has all the options in front of the
user so that the user does not need to go through deeper menus to accomplish tasks. This
is an important distinction for people designing a touchscreen driven menu interface.
Users will want to work on a form that is easy to digest, rather than have complete
control at the start of the screen.
6.4 Satisfaction Discussion
The type of form used was the only factor that has a significant impact on the
rating score of satisfaction with a P-Value of 0.000. The Gender and Block do not have a
significant impact on the satisfaction score with P-Value 0.854 and 0.697 respectively.
The interactions and second order interaction did not have an effect either. According to
the Tukey test every form has a statistically different satisfaction score. The
Optimization form has the highest average satisfaction score of 6.250, which is “Very
Good”. The Traditional form has an average of 5.556 which is in between “Good” and
“Very Good”. Lastly, the All Button form has an average of 2.750 which corresponds to
“Bad”.
The Optimization form satisfaction mirrors the results for the aesthetics and
usability scores. This could be because people are more likely to give the same scores for
70
each factors when they are rating a form. If a user feels that a form is aesthetic and usable
they are more likely to be satisfied with the forms that they used.
Another argument could be made that All Button form has the lowest satisfaction
scores because the subjects completed this form the slowest on average. They may not be
satisfied with a form that confuses them and takes them a long time to complete.

71
CHAPTER 7: CONCLUSION & FUTURE WORK
7.1 Conclusion
As tablets continue to grow in popularity there will be an importance in designing
interfaces that are simple for users to use, but allows them to complete all the tasks that
are needed. There are different ways to design interfaces based on many different types
of criteria. An optimization approach to designing a menu based system on tablets can be
a useful tool for companies and developers to use so that a good human computer
interaction can be achieved.
There is an interaction between blocking and the form used for how long it takes
to complete a form in this experiment. Because of this a definitive conclusion cannot be
drawn from the data achieved in this experiment on how fast a task can be completed;
however, the three ratings criteria proved to have significant effects. The Optimization
form scored the highest for aesthetics, usability, and satisfaction. This shows that by
designing an interface where the most used options with a larger “weight” and button size
users may appreciate and want to use something like this.
The experiment also showed that putting every option on a menu based system at
the front of a tablet screen can confuse users and make them more frustrated while using
a program. This can serve as a tool for programmers that they need to make sure that
having all the options directly in front of a user does not make work more efficient since
they need to scan and glance at all the buttons.

72
7.2 Future Work
In order to determine what type of form allows users to complete tasks the fastest
another experiment could be done in order to reduce the effect of blocking. A way to do
this would be to allow users to complete each form twice and only use the times from the
final run. This way they will have a chance to learn how to use the programs and there
will be less of a learning effect as there was in this experiment
There are also other criteria in GUI design that can be analyzed that was not
looked at in this experiment. Some of these factors include color, sound, and order of the
buttons on a GUI layout. This can help narrow down the scope of what creates a good
GUI and all these things can be included in an optimization model. For example, there
has been studies shown that people read websites in an “F” shape [16]. This means that
people read from top-left to top-right and then move slightly downward and read from
left to right and then continue straight down from the left side. This can be important to
give preference towards buttons being placed on these parts of the “F” and different areas
of the F can be served by different values. More factors to examine are the subjects
themselves. This experiment only looked at students who were not computer science
majors and were between the ages of 18-26. The results may be different from people
who are outside this age range.
More things to consider are different fields of work to do this testing, like on a
factory floor and workers using it. This way it can be seen if memory limits are impacted
when users are dedicated to tasks that require multitasking. Other experiments could
include ordering food from a menu based tablet system since that has been on the rising
73
in the past years and research has shown that people are willing to spend more money on
an easier to use interface [29].
Lastly, while this paper did not account for every factor in GUI design on tablets,
it can give a stepping stone in developing optimization systems to design menu based
systems in the fast growing field of tablets.
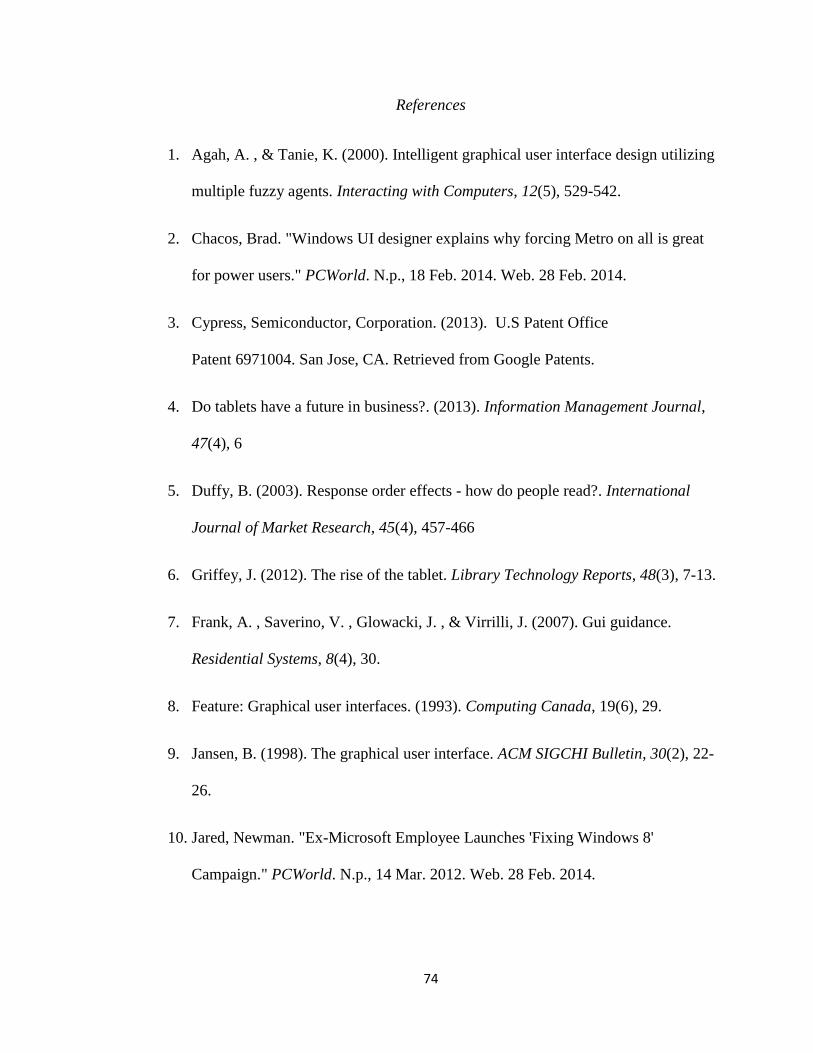
74
References
1. Agah, A. , & Tanie, K. (2000). Intelligent graphical user interface design utilizing
multiple fuzzy agents. Interacting with Computers, 12(5), 529-542.
2. Chacos, Brad. "Windows UI designer explains why forcing Metro on all is great
for power users." PCWorld. N.p., 18 Feb. 2014. Web. 28 Feb. 2014.
3. Cypress, Semiconductor, Corporation. (2013). U.S Patent Office
Patent 6971004. San Jose, CA. Retrieved from Google Patents.
4. Do tablets have a future in business?. (2013). Information Management Journal,
47(4), 6
5. Duffy, B. (2003). Response order effects - how do people read?. International
Journal of Market Research, 45(4), 457-466
6. Griffey, J. (2012). The rise of the tablet. Library Technology Reports, 48(3), 7-13.
7. Frank, A. , Saverino, V. , Glowacki, J. , & Virrilli, J. (2007). Gui guidance.
Residential Systems, 8(4), 30.
8. Feature: Graphical user interfaces. (1993). Computing Canada, 19(6), 29.
9. Jansen, B. (1998). The graphical user interface. ACM SIGCHI Bulletin, 30(2), 22-
26.
10. Jared, Newman. "Ex-Microsoft Employee Launches 'Fixing Windows 8'
Campaign." PCWorld. N.p., 14 Mar. 2012. Web. 28 Feb. 2014.
75
11. Hartley, J. (2014). Some thoughts on likert-type scales. International Journal of
Clinical and Health Psychology, 14(1), 83-86.
12. Kostaras, N. , & Xenos, M. (2011). A study on how usability flaws in gui design
increase mouse movements and consequently may affect users' health. Behaviour
& Information Technology, 30(3), 425-436.
13. Lamont, L., & Crawford, C. (2012). Touchscreen computer interfaces:
Electronics. Handbook of Visual Display Technology, 997-1008.
14. Manson, N J. "Is Operations Research Really Research?." ORiON, 22.2 (2006):
155.
15. Miller, G. (1956). The magical number seven plus or minus two: Some limits on
our capacity for processing information. Psychological Review, 63(2), 81-97.
16. Nielsen, Jakob . "Nielsen Norman Group." F-Shaped Pattern For Reading Web
Content. N.p., 17 Apr. 2006. Web. 22 Apr. 2014.
17. Norman, G. (2010). Likert scales, levels of measurement and thse "laws" of
statistics. Advances in Health Sciences Education : Theory and Practice, 15(5),
625-632.
18. Osborne, H. (1986). Symmetry as an aesthetic factor. Computers and
Mathematics with Applications, 12(1), 77-82.
19. Rhodes, G. , Proffitt, F. , Grady, J. , & Sumich, A. (1998). Facial symmetry and
the perception of beauty. Psychonomic Bulletin & Review, 5(4), 659-669.

76
20. Raymond, Eric, and Rob Landley. "The first GUIs." The first GUIs. N.p., n.d.
Web. 28 Feb. 2014.
21. Research in Motion Limited. (2013). U.S Patent and Trademark Office U.S
Patent Application No. 20130093764, Unpublished (filing date Oct. 12, 2012)
Waterloo, CA. Retrieved from Google Patents
22. Schneider, T. (1994). Tips for designing graphical interfaces. Manufacturing
Systems, 12(4), 21.
23. Sieberg, Daniel. "Comdex: Gates foresees ‘digital decade’." CNN. Cable News
Network, 12 Nov 2001. Web. 17 Feb. 2014.
24. "Tablets to make up 50% of PC market in 2014." Canalys. N.p., 26 Nov. 2013.
Web. 4 Apr. 2014.
25. Tractinsky, N. (1997). Aesthetics and apparent usability: Empirically assessing
cultural and methodological issues. Proceedings of the ACM SIGCHI Conference
on Human Factors in Computing Systems, 115-122.
26. Tractinsky, N. , Katz, A. , & Ikar, D. (2000). What is beautiful is usable.
Interacting with Computers, 13(2), 127-145.
27. Tufte, E. , & Schmieg, G. (1985). The visual display of quantitative information.
American Journal of Physics, 53(11), 1117.
28. "What is Operations Research?." INFORMS. N.p., n.d. Web. 11 Apr. 2014.
29. Wong, Venessa. "That Tablet on the Restaurant Table Will Make You Spend
More." Bloomberg Business Week. Bloomberg, 17 Sept. 2013. Web. 3 Apr. 2014.

77
30. Yang, Y. , & Klemmer, S. (2009). Aesthetics matter: Leveraging design heuristics
to synthesize visually satisfying handheld interfaces. CHI '09 Extended Abstracts
on Human Factors in Computing Systems, 4183-4188.

78
Appendix A: Images of ATM System
Practice Form
First Practice Form Page
Clicking Button 1

79
Clicking Button 2
After Clicking Button 3

80
After Clicking Button 4
After Clicking Button 5

81
All Button Form
Instructions Before All Buttons Form
Front of All Buttons Form

82
Deposit Cash Button
Fast Cash $20 Button

83
Fast Cash $40 Button
Fast Cash $60 Button

84
Fast Cash $80 Button
Fast Cash $100 Button

85
Fast Cash $200 Button
Fast Cash $300 Button

86
Deposit Check Button
Print Last 5 Deposits Button

87
Withdraw Button
After Punching $120 into ATM

88
Print Last 5 Checks
After Punching $180 into ATM

89
Fast Cash $20 Button
Fast Cash $40 Button
90
Fast Cash $60 Button
Fast Cash $80 Button

91
Fast Cash $100 Button
After Punching $100 into ATM
92
Fast Cash $200 Button
Fast Cash $300 Button

93
Fast Cash $400 Button
Print Last 5 Card Transactions

94
Payments Button
Print Last 10 Card Transactions

95
Optimization Form
Instructions Before All Buttons Form
Front of Optimization Form

96
Withdrawal Button
Fast Cash $20 Button
97
Fast Cash $40 Button
Fast Cash $60 Button
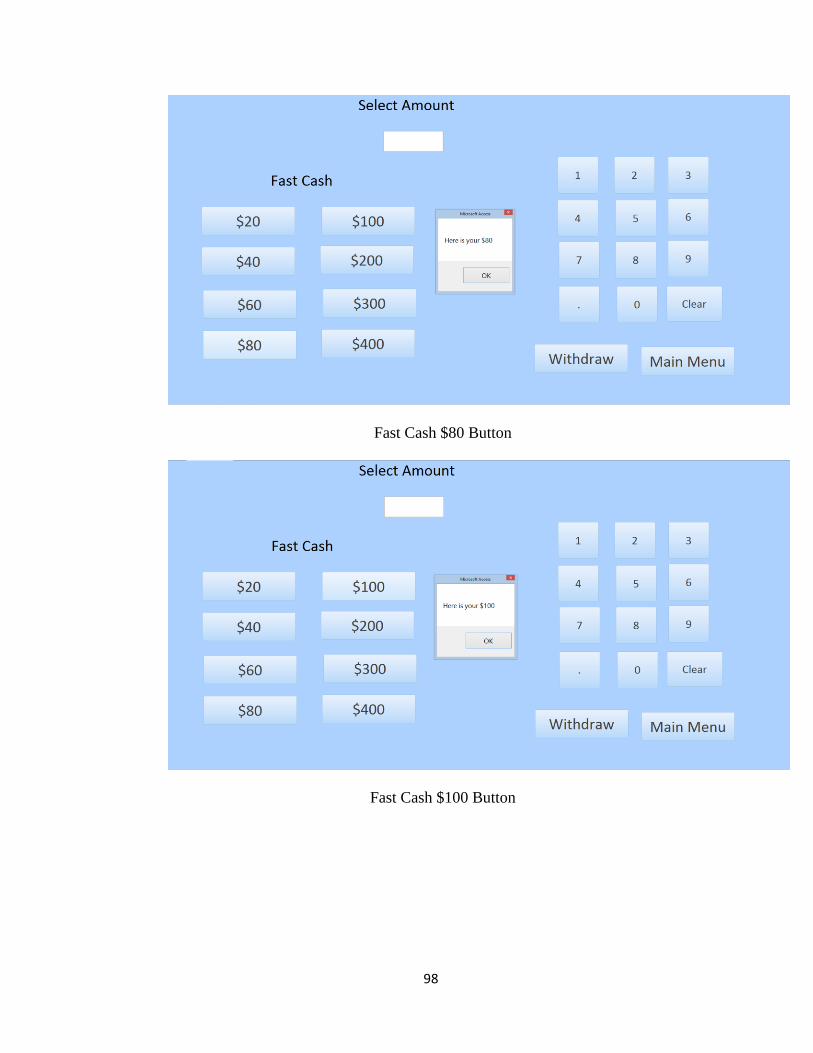
98
Fast Cash $80 Button
Fast Cash $100 Button

99
After Punching $100 into ATM
Fast Cash $200 Button

100
Fast Cash $300 Button
Fast Cash $400 Button

101
Deposit Button
Deposit Cash Button

102
Deposit Check Button
Statement Print Button

103
Last 5 Card Transactions
Last 5 Checks
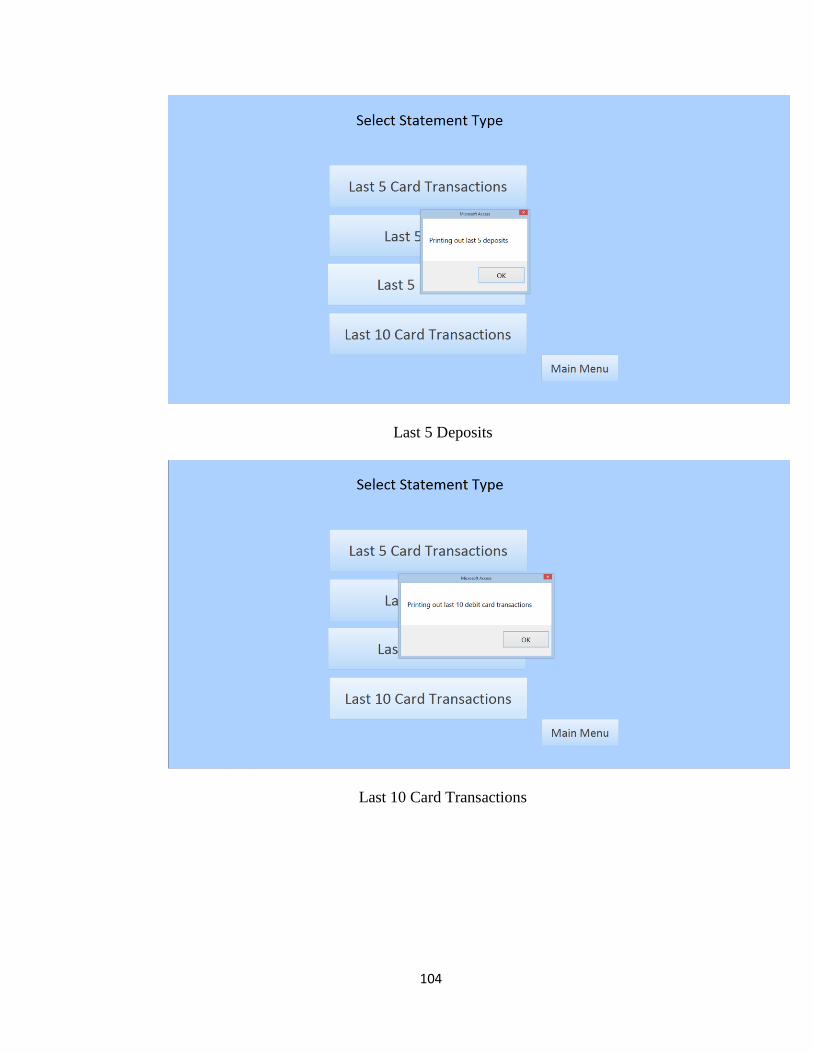
104
Last 5 Deposits
Last 10 Card Transactions

105
Additional Services

106
Traditional Form
Instructions Before All Buttons Form
Front of Traditional Form
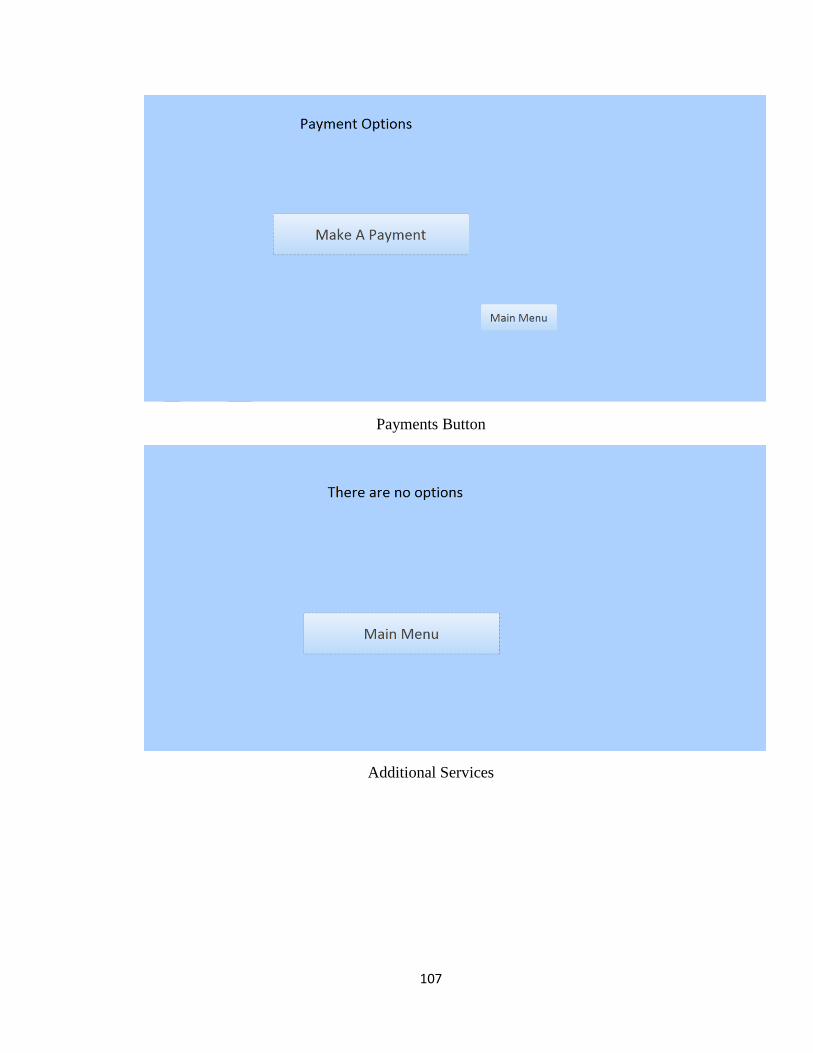
107
Payments Button
Additional Services

108
Fast Cash Button
Fast Cash $20 Button
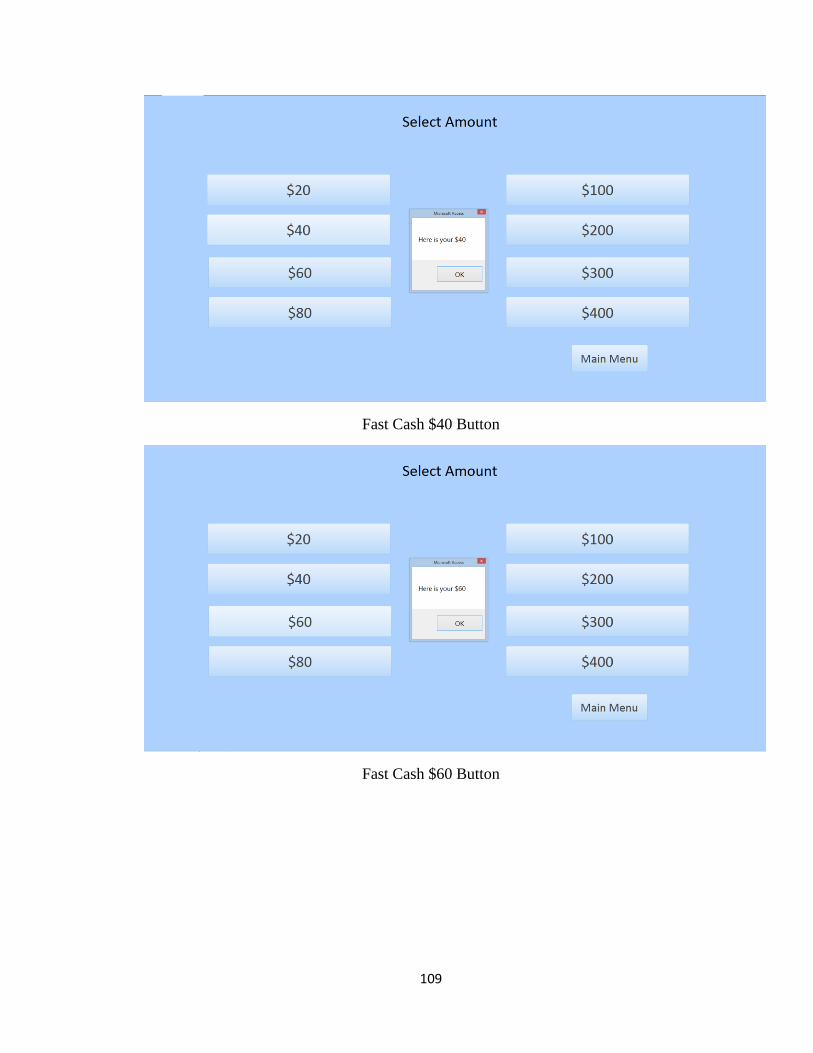
109
Fast Cash $40 Button
Fast Cash $60 Button

110
Fast Cash $80 Button
Fast Cash $100 Button

111
Fast Cash $200 Button
Fast Cash $300 Button
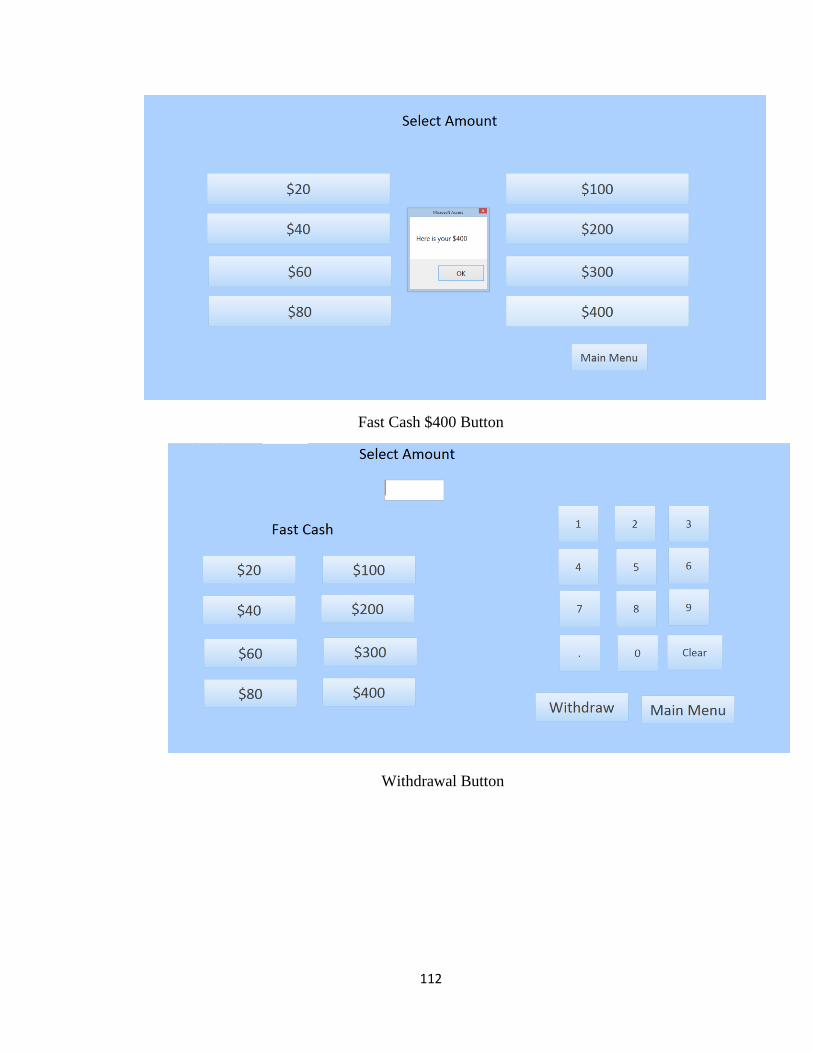
112
Fast Cash $400 Button
Withdrawal Button

113
Fast Cash $20 Button
Fast Cash $40 Button

114
Fast Cash $60 Button
Fast Cash $80 Button
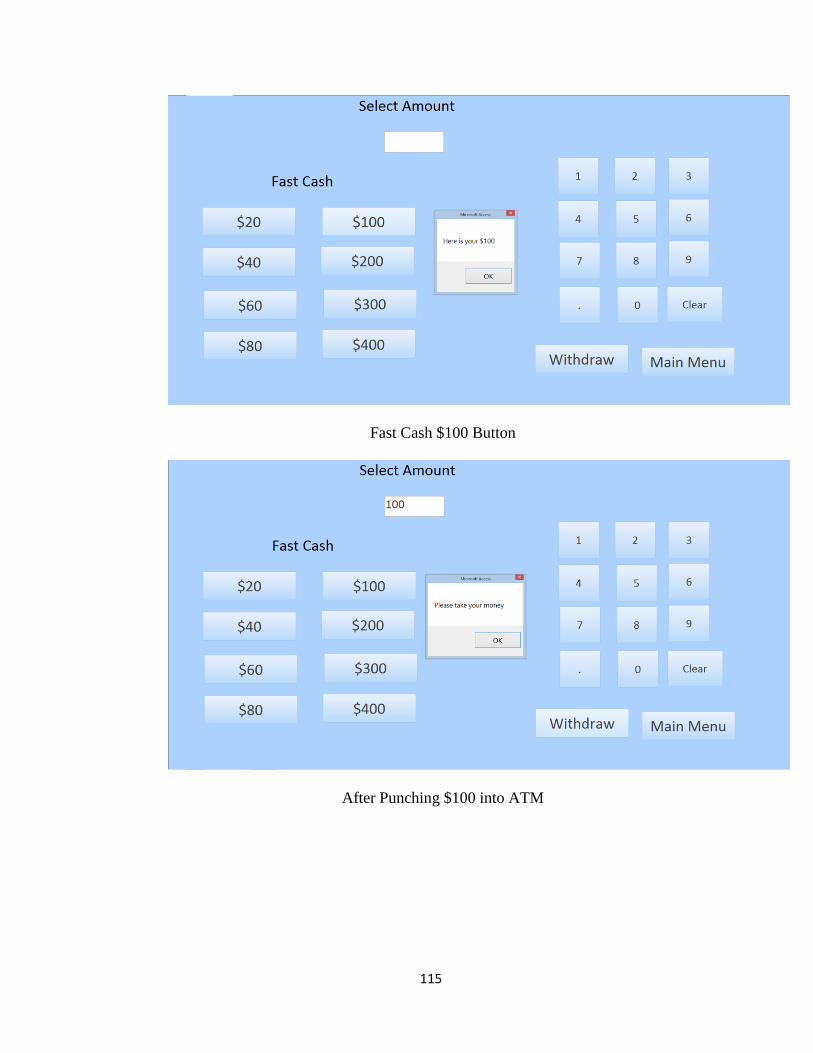
115
Fast Cash $100 Button
After Punching $100 into ATM

116
Fast Cash $200 Button
Fast Cash $300 Button

117
Fast Cash $400 Button
Deposit Button
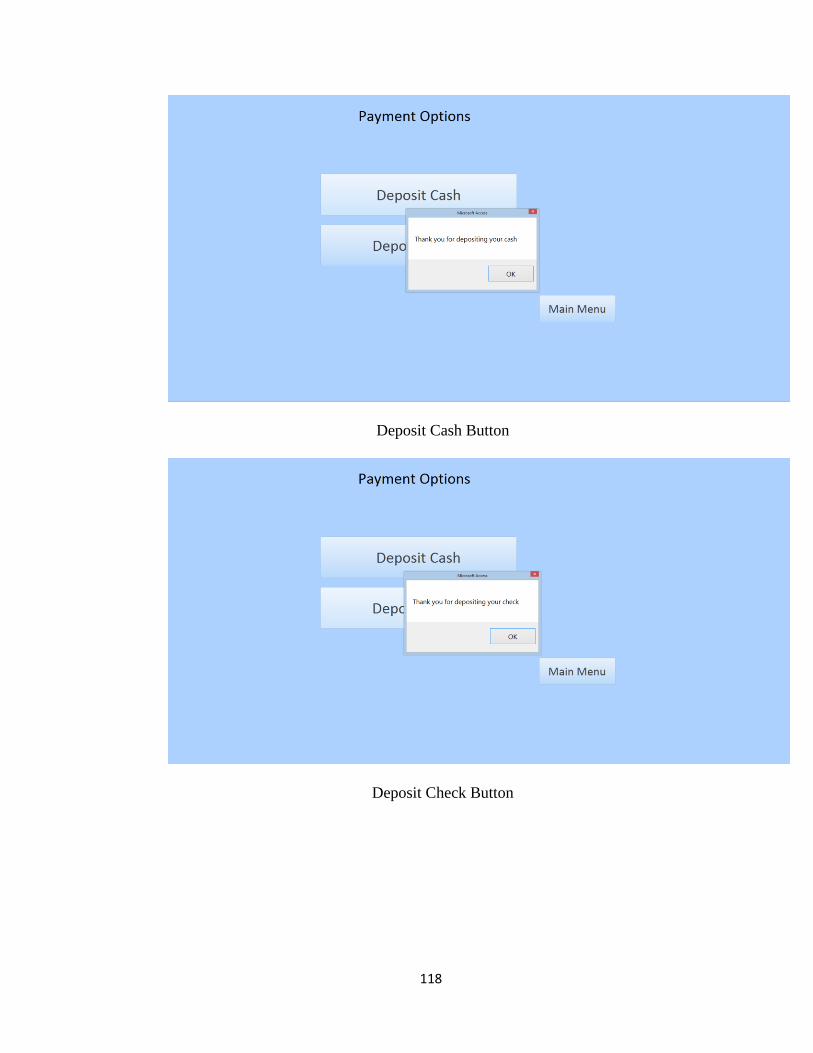
118
Deposit Cash Button
Deposit Check Button

119
Statement Print Button
Last 5 Card Transactions
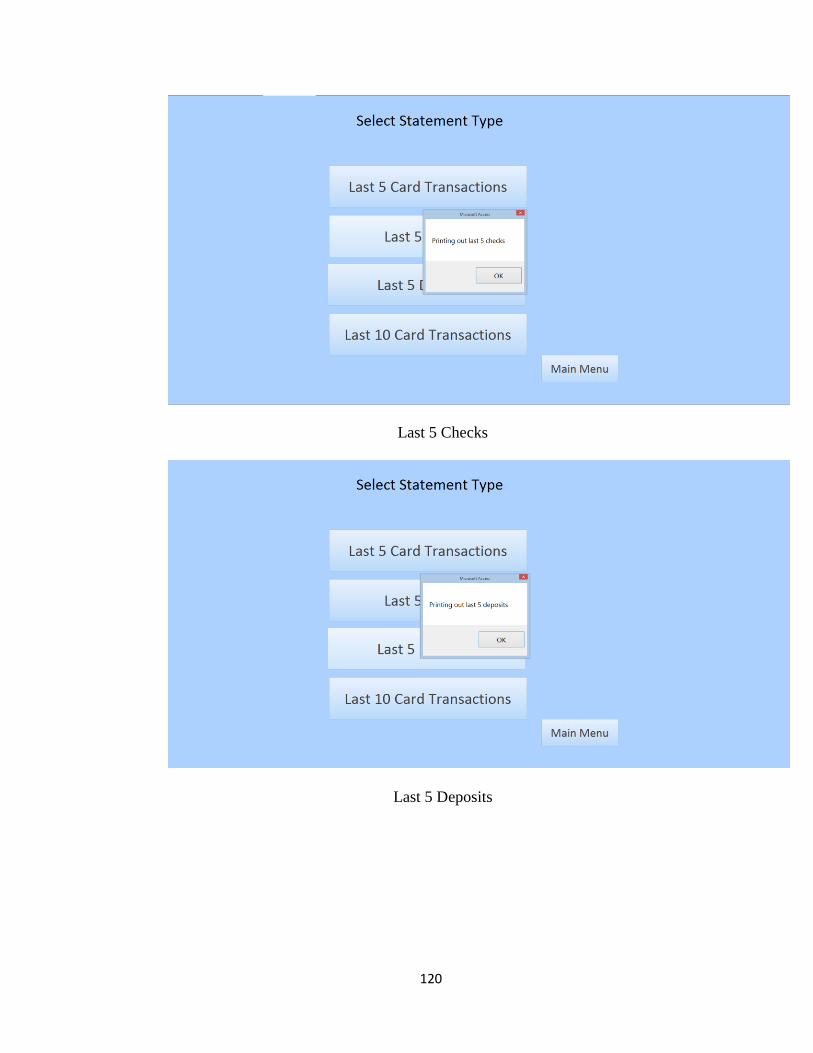
120
Last 5 Checks
Last 5 Deposits

121
Last 10 Card Transactions

122
Rating Forms
Rating Form for All Button Form
Rating Form for Optimization Button

123
Rating Form for Traditional Form

124
Appendix B: Images of Solver

125
Appendix C: Raw Data
Subject
#
Gender Form Time Block Aesthetics Usability Satisfaction
1 M 1 72 A 3 5 3
2 M 1 78 B 4 5 4
3 M 1 57 C 4 5 5
4 M 1 63 D 3 3 2
5 M 1 73 E 1 3 1
6 M 1 72 F 4 2 3
7 M 1 82 A 5 3 3
8 M 1 82 B 5 4 4
9 M 1 58 C 4 4 4
10 M 1 56 D 5 5 4
11 M 1 59 E 3 3 3
12 M 1 61 F 3 3 3
13 M 1 53 A 3 4 4
14 M 1 78 B 3 3 3
15 M 1 71 C 1 2 1
16 M 1 78 D 2 2 1
17 M 1 59 E 2 2 2
18 M 1 59 F 1 1 1
1 M 2 65 A 7 6 7
2 M 2 45 B 6 7 7
3 M 2 59 C 6 6 7
4 M 2 61 D 6 6 7
5 M 2 54 E 7 7 7
6 M 2 49 F 5 6 5
7 M 2 59 A 7 7 7
8 M 2 55 B 6 5 4
9 M 2 58 C 6 7 6
10 M 2 52 D 5 7 6
11 M 2 45 E 6 7 6
12 M 2 47 F 6 6 6
13 M 2 46 A 5 6 6
14 M 2 45 B 6 7 6
15 M 2 81 C 6 6 6
16 M 2 67 D 5 5 5
17 M 2 44 E 7 7 7
18 M 2 42 F 6 6 6

126
Subject
#
Gender Form Time Block Aesthetics Usability Satisfaction
1 M 3 60 A 3 5 4
2 M 3 51 B 5 6 6
3 M 3 52 C 6 6 7
4 M 3 48 D 5 6 6
5 M 3 61 E 6 6 6
6 M 3 75 F 6 6 6
7 M 3 49 A 6 6 7
8 M 3 61 B 5 5 5
9 M 3 60 C 5 6 6
10 M 3 48 D 5 6 5
11 M 3 56 E 4 5 5
12 M 3 54 F 5 5 5
13 M 3 36 A 4 5 5
14 M 3 54 B 6 6 6
15 M 3 57 C 4 5 5
16 M 3 53 D 6 5 4
17 M 3 55 E 5 5 5
18 M 3 65 F 6 7 6
19 F 1 72 A 3 2 3
20 F 1 72 B 4 5 6
21 F 1 71 C 4 3 3
22 F 1 76 D 2 1 2
23 F 1 53 E 3 3 3
24 F 1 71 F 1 2 1
25 F 1 64 A 3 3 4
26 F 1 66 B 3 4 4
27 F 1 56 C 2 3 2
28 F 1 73 D 1 2 2
29 F 1 58 E 4 3 3
30 F 1 55 F 4 3 3
31 F 1 75 A 4 3 4
32 F 1 61 B 1 1 1
33 F 1 86 C 2 2 1
34 F 1 54 D 3 3 3
35 F 1 55 E 1 5 2
36 F 1 67 F 2 2 1
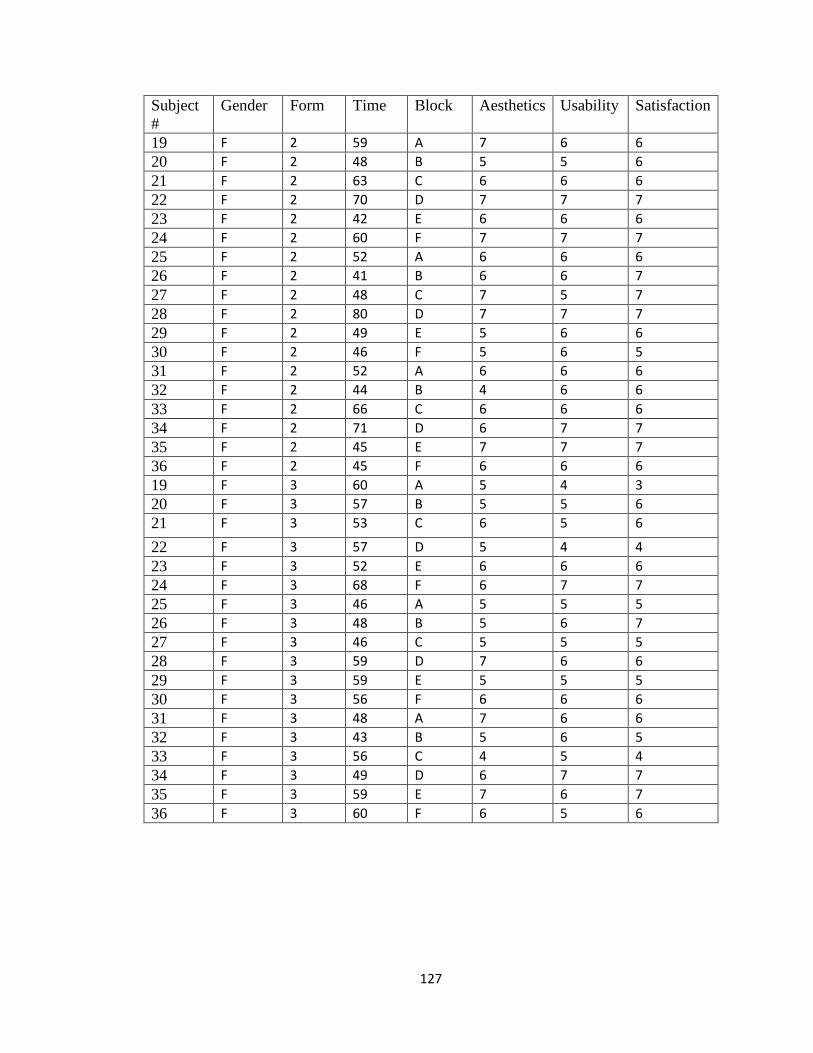
127
Subject
#
Gender Form Time Block Aesthetics Usability Satisfaction
19 F 2 59 A 7 6 6
20 F 2 48 B 5 5 6
21 F 2 63 C 6 6 6
22 F 2 70 D 7 7 7
23 F 2 42 E 6 6 6
24 F 2 60 F 7 7 7
25 F 2 52 A 6 6 6
26 F 2 41 B 6 6 7
27 F 2 48 C 7 5 7
28 F 2 80 D 7 7 7
29 F 2 49 E 5 6 6
30 F 2 46 F 5 6 5
31 F 2 52 A 6 6 6
32 F 2 44 B 4 6 6
33 F 2 66 C 6 6 6
34 F 2 71 D 6 7 7
35 F 2 45 E 7 7 7
36 F 2 45 F 6 6 6
19 F 3 60 A 5 4 3
20 F 3 57 B 5 5 6
21 F 3 53 C 6 5 6
22 F 3 57 D 5 4 4
23 F 3 52 E 6 6 6
24 F 3 68 F 6 7 7
25 F 3 46 A 5 5 5
26 F 3 48 B 5 6 7
27 F 3 46 C 5 5 5
28 F 3 59 D 7 6 6
29 F 3 59 E 5 5 5
30 F 3 56 F 6 6 6
31 F 3 48 A 7 6 6
32 F 3 43 B 5 6 5
33 F 3 56 C 4 5 4
34 F 3 49 D 6 7 7
35 F 3 59 E 7 6 7
36 F 3 60 F 6 5 6

128
Appendix D: Informed Consent Form
Informed Consent Form
INFORMED CONSENT TO PARTICIPATE IN A RESEARCH PROJECT, “Examining
the Impact of Operations Research on Graphical User Interfaces on Touchscreens.”
A research project on human computer interaction is being conducted by
Christian Royer in the Department of Industrial and Manufacturing Engineering at Cal
Poly, San Luis Obispo, under the direction of Dr. Tali Freed. The purpose of the study is
to compare the effects of different Graphical User Interfaces (GUIs) in completing tasks.
You are being asked to take part in this study by performing tasks on a tablet and
giving feedback on the design of the GUI. Your participation will take approximately
twenty minutes. Please be aware that you are not required to participate in this research
and you may discontinue your participation at any time without a loss of benefits. You
may also omit any questions you choose not to answer.
There are no risks anticipated with participation in this study. Please be aware that
you may contact Christian Royer at (408) 439-6227 for assistance.
Your confidentiality will be protected; all personal information and your
individual performance results will remain confidential. Potential benefits for yourself
associated with the study include food for participating. Other benefits possible include
better designed graphical user interfaces.
If you have questions regarding this study or would like to be informed of the
results when the study is completed, please feel free to contact Christian Royer at (408)
439-6227. If you have concerns regarding the manner in which the study is conducted,
you may contact Dr. Steve Davis, Chair of the Cal Poly Human Subjects Committee, at
(805) 756-2754, [email protected], or Dr. Dean Wendt, Interim Dean of Research, at
(805) 756-1508, [email protected].
If you agree to voluntarily participate in this research project as described, please
indicate your agreement by signing below. Please keep one copy of this form for your
reference, and thank you for your participation in this research.
____________________________________ ________________
Signature of Volunteer Date
____________________________________ ________________
Signature of Researcher Date

129
Appendix E: Experiment Form
Experiment
Thank you for participating in this experiment. You will be asked to complete the
following tasks using this tablet as an ATM as quickly as you can without making errors.
Assume that you have a $20 Bill and a $20 Check already signed.
If the ATM asks you to “Please take your money” or to “Insert Cash or Check” you may
pretend that you have done so and hit “OK” on the touchscreen, for example:
You will input commands based on the notecards that I flip over. If a task tells you to
“Withdraw” a certain amount you must draw that exact amount. For example if you are
asked to Withdraw $220, you must draw exactly that amount and not $200 and then $20.
If you have any questions please feel free to ask. The experiment begins as soon as you
touch “Begin the Experiment” on the screen.
130
Appendix F: Experiment Form
Practice
Thank you for participating in this experiment. You will be asked to complete tasks using
this tablet as an ATM as quickly as you can without making errors.
In order to learn how to use the system you will perform a practice run so you can learn
how the program works. You will input commands based on the notecards that I flip over.
This section will not be timed. If you have any questions please ask. The practice run will
begin as soon as you say “Ready.”

131
Appendix G: Survey Form
Survey
Thank you for completing the experiment. Next you will be asked what you thought about
Aesthetics, Usability, and your Satisfaction of the three ATMs. Please be honest with your
feedback. If you have any questions about the definitions please ask.


![Research Article Extending the Touchscreen Pattern Lock ...downloads.hindawi.com/journals/ahci/2016/8762892.pdf · graphical password mechanisms is provided by Biddle et al. []. e](https://img.dokumen.tips/doc/110x75/601e91b4766bd365422ec762/research-article-extending-the-touchscreen-pattern-lock-graphical-password-mechanisms.jpg)


![Graphical-based User Authentication Schemes for Mobile Devices · Graphical Passwords (GP) as an alternative Better memorability [Paivio, 2006] Ease of input (touchscreen) Higher](https://img.dokumen.tips/doc/110x75/5f1ea9da83f3625cdf74270c/graphical-based-user-authentication-schemes-for-mobile-devices-graphical-passwords.jpg)


