Embed Size (px)
Citation preview

2017ANNUAL REPORT
CAPITALAND RETAIL CHINA TRUST
OPTIMISING GROWTH
VISION
Sustainable and resilient REIT with a professionally managed portfolio of quality retail real estate across China.
MISSION
Deliver sustainable income growth to our Unitholders and value-add to the community and stakeholders by enhancing organic growth through proactive asset management; creating new value through innovative asset enhancement strategies; and capitalising on yield-accretive acquisitions growth.
OPTIMISING GROWTH At CapitaLand Retail China Trust (CRCT), we strive to enrich lives through high-
quality real estate products and services. Inspired by CapitaLand’s credo of
‘Building People. Building Communities.’, the design for this year’s annual report
employs the creative use of mosaic to recreate Rock Square – a new addition
to our portfolio. Just as different mosaic pieces come together to form a big
picture, this is symbolic of how CRCT will continue to build on our strengths to
propel our growth journey and create greater value for the future.
We continue to build on the momentum from our milestone decade of growth
by sharpening our competitiveness, extracting value and strengthening the
quality of our portfolio. Through our strategy of investing in high-quality
income-producing retail assets, coupled with proactive asset management and
disciplined capital management, we remain focused in creating sustainable
long-term value for our Unitholders.

CONTENTS
CORPORATE PROFILEFIRST CHINA SHOPPING MALL REAL ESTATE INVESTMENT TRUST IN SINGAPORECapitaLand Retail China Trust (CRCT) is the first China shopping mall real estate investment trust (REIT) in Singapore. Listed on the Singapore Exchange Securities Trading Limited (SGX-ST) on 8 December 2006, CRCT is established with the objective of investing on a long-term basis in a diversified portfolio of income-producing real estate used primarily for retail purposes and located primarily in China, Hong Kong and Macau.
As at 31 December 2017, CRCT’s geographically diversified portfolio comprises 10 quality shopping malls which are located in seven of China’s cities, with a total asset size of S$2.7 billion. The malls are CapitaMall Xizhimen, CapitaMall Wangjing, CapitaMall Grand Canyon and CapitaMall Shuangjing in Beijing; CapitaMall Xinnan in Chengdu, Sichuan Province; CapitaMall Qibao in Shanghai; CapitaMall Minzhongleyuan in Wuhan, Hubei Province; CapitaMall Erqi in Zhengzhou, Henan Province; CapitaMall Saihan in Hohhot, Inner Mongolia; and CapitaMall Wuhu in Wuhu, Anhui Province. On 31 January 2018, CRCT completed the acquisition of Rock Square in Guangzhou, Guangdong Province, in which CRCT has a 51.0% interest.
All the malls in the portfolio are positioned as one-stop family-oriented shopping, dining and entertainment destinations for the sizeable population catchment areas in which they are located, and are accessible via major transportation routes or access points. A significant portion of the properties’ tenancies consists of major international and domestic retailers which provide CRCT’s unitholders with stable and sustainable returns. The anchor tenants are complemented by popular specialty brands such as Adidas, Nanjing Impressions, Nike, Pandora, Sephora, Starbucks, UNIQLO, Xiaomi and ZARA.
CRCT is managed by an external manager, CapitaLand Retail China Trust Management Limited (CRCTML or the Manager), which is an indirect wholly owned subsidiary of CapitaLand Limited, one of Asia’s largest real estate companies headquartered and listed in Singapore.
OVERVIEWYear in Brief 2017 22017 Highlights 3Financial Highlights 45-Year Financial Highlights 5Trust Structure 6Organisation Structure 7Message to Unitholders 8Property Portfolio 14Value Creation 16
BUSINESS REVIEWOperations Review 60Financial Review 66Capital Management 71
PORTFOLIO DETAILSPortfolio Summary 74Portfolio Details 76Marketing & Promotions 86
FINANCIALS & ADDITIONALINFORMATIONFinancial Statements 88Interested Person Transactions 161Statistics of Unitholdings 162Mall Directory 165Corporate Information IBC
CORPORATE GOVERNANCE & TRANSPARENCYBoard of Directors 17Trust Management Team 23Corporate Governance 24Enterprise Risk Management 47Investor & Media Relations 50Unit Price Performance 52
SUSTAINABILITYSustainability Management 54
ANNUAL REPORT 2017
1
FINA
NC
IALS &
AD
DIT
ION
AL IN
FOR
MA
TIO
N
PO
RT
FOLIO
DE
TAILS
B
USIN
ESS R
EV
IEW
SU
STAIN
AB
ILITY
C
OR
PO
RA
TE
GO
VE
RN
AN
CE
& T
RA
NSP
AR
EN
CY
O
VE
RV
IEW

YEAR IN BRIEF 2017
JANUARY
CRCT achieved net property income of RMB669.8 million, representing a 4.1% year-on-year growth for FY 2016. In SGD terms, CRCT’s distribution per unit (DPU) was 10.05 cents.
JUNE
Participated in the “REITs Symposium 2017” jointly organised by REITAS (REIT Association of Singapore) and ShareInvestor to promote REITs as an investment option, for the third consecutive year.
MARCH
Paid a DPU of 4.73 cents to Unitholders for the period 1 July to 31 December 2016.
JULY
Announced the divestment of CapitaMall Anzhen to unlock value of the mature master-leased mall.
Announced the recovery of approximately 4,700 square metres of anchor space on level 4 of CapitaMall Wangjing in tandem with the divestment of CapitaMall Anzhen. The recovered space will be transformed to house higher-yielding specialty stores.
SEPTEMBER
Paid a DPU of 5.36 cents to Unitholders for the period 1 January to 30 June 2017.
OCTOBER
Secured the maximum aggregate principal amount of securities that may be issued under its multicurrency Medium Term Note (MTN) programme from S$500 million to S$1 billion with effect from 9 October 2017.
CapitaMall Xizhimen was awarded “Outstanding Project” at the 7th China Commercial Real Estate Annual Meeting.
NOVEMBER
Entered into an agreement for the proposed joint acquisition of Rock Square in Guangzhou, whereby CRCT would acquire 51.0% interest. The estimated aggregate consideration, subject to post-completion adjustments, is approximately RMB3,360.7 million, of which 51.0% (being RMB1,713.9 million or approximately S$351.3 million, subject to post-completion adjustments) is payable by CRCT2.
DECEMBER
Issued 64.4 million new units in relation to a private placement to part finance the acquisition of Rock Square.
Paid advanced distribution of 3.91 cents per Unit for the period from 1 July to 6 December 2017.
Mr Jason Leow Juan Thong and Mr Ng Kok Siong stepped down from the Board with effect from 1 January 2018. The Board welcomed Ms Kuan Li Li as a Non-Executive Independent Director, as well as Mr Lee Chee Koon and Mr Lim Cho Pin Andrew Geoffrey as Non-Executive Non-Independent Directors with effect from 1 January 2018.
APRIL
Mr Tony Tan Tee Hieong relinquished his role as Chief Executive Officer and was succeeded by Mr Tan Tze Wooi with effect from 1 April 2017.
Held the FY 2017 Annual General Meeting with all resolutions duly passed.
Mr Victor Liew Cheng San stepped down as Chairman of the Board and was succeeded by Mr Soh Kim Soon, who also serves as Independent Director, on 20 April 2017.
The Board welcomed Mr Neo Poh Kiat as Non-Executive Independent Director on 20 April 2017.
1 CapitaMall Anzhen was divested to Beijing Hualian Anzhen Business Development Company Ltd. via CRCT’s divestment of its entire equity interest in CapitaRetail Beijing Anzhen Real Estate Co., Ltd.. An independent valuation, carried out using the capitalisation approach and discounted cashflow analysis, valued CapitaMall Anzhen at RMB 1,000.5 million (approximately S$202.2 million) as at 30 June 2017.
2 CRCT and CapitaLand Limited (CL) completed the acquisition of 51.0% and 49.0% interest respectively in Gold Yield Pte. Ltd. (the “Target Company”), from NPF Singapore Pte. Ltd. and ASPF II Omikron GmbH, on 31 January 2018. The Target Company holds the entire equity interest of Guangzhou Starshine Properties Co., Ltd, which in turn holds Rock Square. An independent valuation, carried out using the discounted cash flow method and the capitalisation method, valued Rock Square’s open market value at RMB3,360.0 million (approximately S$688.8 million) as at 3 November 2017. Pursuant to the acquisition, CRCT and CL, each via wholly owned subsidiaries, entered into a joint venture agreement on 28 November 2017.
Completed the divestment of CapitaMall Anzhen for an aggregate consideration of approximately S$234.3 million1.
Participated in the “8th Singapore Corporate Governance Week – Statement of Support” organised by Securities Investors Association (Singapore) in demonstration of CRCT’s commitment to good corporate governance.
Completed the refurbishments of the basement and first floor of CapitaMall Xizhimen and improved the landscaped outdoor plaza of CapitaMall Grand Canyon.
CAPITALAND RETAIL CHINA TRUST
2

2017 HIGHLIGHTS
S$91.1MILLION
Distributable Income
S$149.2MILLION
Net Property Income (NPI)
95.7MILLION
Annual Shopper Traffic
2.48%Average Cost of Borrowings
95.4%Portfolio Occupancy Rate
10.10CENTS
Distribution Per Unit (DPU)
RMB1,747Tenants’ Sales
per square metre per month
S$1.62
BILLION
Market Capitalisation
28.4%Aggregate Leverage
1 Based on FY 2017 DPU of 10.10 cents and the closing price of $1.62 per Unit as at 31 December 2017.2 By reference to the closing price of $1.62 per Unit as at 31 December 2017.
* Information as at 31 December 2017 or for FY 2017.
6.2%1
Distribution Yield
ANNUAL REPORT 2017
3
FINA
NC
IALS &
AD
DIT
ION
AL IN
FOR
MA
TIO
N
PO
RT
FOLIO
DE
TAILS
B
USIN
ESS R
EV
IEW
SU
STAIN
AB
ILITY
C
OR
PO
RA
TE
GO
VE
RN
AN
CE
& T
RA
NSP
AR
EN
CY
O
VE
RV
IEW

FINANCIAL HIGHLIGHTS
2013 2014 2015 2016 2017
160.1
203.3220.3 214.4
229.2
2013 2014 2015 2016 2017
132.4
103.0
141.1 139.7149.2
2013 2014 2015 2016 2017
80.9
70.1
89.2 86.791.1
2013 2014 2015 2016 2017
9.829.02
10.6010.05 10.10
2013 2014 2015 2016 2017
1.631.48
1.771.65 1.60
Gross Revenue (S$ million)
Distributable Income (S$ million)
Net Asset Value Per Unit (S$)
Net Property Income (S$ million)
Distribution Per Unit (cents)
CAPITALAND RETAIL CHINA TRUST
4

5-YEAR FINANCIAL HIGHLIGHTS
As at 31 DecemberBalance Sheet 20131 20141 20151 20161 20171
Total Assets (S$’000) 2,184,291 2,358,062 2,570,304 2,783,467 2,668,068
Total Deposited Properties2 (S$’000) 2,155,554 2,328,008 2,544,671 2,761,930 2,648,157
Net Assets Attributable to Unitholders (S$’000) 1,186,951 1,349,738 1,490,820 1,431,811 1,548,771
Total Borrowings (S$’000) 713,458 672,893 707,092 979,246 750,000
Market Capitalisation (S$ million) 1,068 1,337 1,256 1,191 1,565
Net Asset Value Per Unit (S$) 1.48 1.63 1.77 1.65 1.60
Portfolio Property Valuation (S$’000) 2,058,094 2,250,783 2,412,626 2,628,353 2,441,0243
Financial Ratios
Earnings Per Unit (¢) 17.52 17.69 13.61 12.45 16.21
Diluted Earnings Per Unit (¢) – – – 12.39 16.14
Distribution Per Unit (¢) 9.02 9.82 10.60 10.05 10.10
Net Tangible Assets Per Unit (S$) 1.48 1.63 1.77 1.65 1.60
Aggregate Leverage4 (%) 32.6 28.7 27.7 35.3 28.4
Interest Cover (times) 8.5 5.6 6.3 6.0 5.8
Management Expense Ratio5 (%) 0.9 1.0 0.9 1.0 1.0
As at 31 December 20171
Financial Derivatives
Net Fair Value of Financial Derivatives6 (S$ million) (7.4)
Proportion of Financial Derivatives to Net Assets Attributable to Unitholders (%)7 (0.5)
Total Operating Expenses and Taxation
Total Operating Expenses8 (S$’000) 94,572
Total Operating Expenses as a percentage of Net Asset Value7 (%) 6.0
Taxation9 (S$’000) 64,214
1 CRCT’s financial year from 1 January to 31 December. 2 All the assets of CRCT (or proportional share if CRCT owns less than 100% of a Barbados Company as defined in the CRCT Prospectus dated 29 November
2006 (CRCT Prospectus) and/or a Project Company (as defined in the CRCT Prospectus)) including the properties and all the authorised investments of CRCT for the time being held or deemed to be held upon the trusts under the trust deed dated, 23 October 2006, as amended by the First Supplemental Deed dated 8 November 2006, Second Supplemental Deed dated 15 April 2010, Third Supplemental Deed dated 5 April 2012, Fourth Supplemental Deed dated 14 February 2014 and Fifth Supplemental Deed dated 6 May 2015 and a Sixth Supplemental Deed dated 29 April 2016 (collectively, the Trust Deed), and excluding undistributed income at the year end.
3 Based on valuations as at 31 December 2017. The portfolio property valuation includes the valuation of the 10 malls and the carrying amount of CapitaMall Minzhongleyuan’s three residential units. Refer to page 120 for more details.
4 The aggregate leverage is calculated based on total borrowings and deferred payments over the total assets. Total assets include effects of hedging on the net assets denominated in Renminbi (RMB).
5 Refers to the expenses of CRCT excluding property expenses and interest expenses but including the performance component of CRCTML’s management fees, expressed as a percentage of weighted average net assets.
6 Financial derivatives include non-deliverable forwards and interest rate swaps which CRCT entered into as a form of hedging against the underlying foreign currency and interest rate risks. The Net Fair Value of Financial Derivatives represented a negative 0.5% of the net assets of CRCT as at 31 December 2017.
7 Net assets attributable to Unitholders and net asset value as at 31 December 2017. 8 Total operating expenses include all fees and charges paid to the manager and interested parties.9 Taxation includes corporate taxation, withholding taxation (including taxation related to the divestment of CapitaMall Anzhen completed in 2017) and
deferred taxation.
ANNUAL REPORT 2017
5
FINA
NC
IALS &
AD
DIT
ION
AL IN
FOR
MA
TIO
N
PO
RT
FOLIO
DE
TAILS
B
USIN
ESS R
EV
IEW
SU
STAIN
AB
ILITY
C
OR
PO
RA
TE
GO
VE
RN
AN
CE
& T
RA
NSP
AR
EN
CY
O
VE
RV
IEW

CHINA
SINGAPORE/HONG KONG/BARBADOS
TRUSTSTRUCTURE
The TrusteeHSBC Institutional
Trust Services(Singapore) Limited
The ManagerCapitaLand
Retail China TrustManagement Limited
Unitholders
Singapore/Hong Kong/Barbados Companies1
Holding of Units
Management services
Dividends and Interest Income
Dividends and Interest Income
Ownership and Shareholder’s Loans
Ownership and Shareholder’s Loans
Acts on behalf of Unitholders
Managementfees
Trustee fees
Distributions
Project Companies2
Properties
The Property Managers
Net Property Income
Property Management Services
Ownership
Property Manager’s Fees
1 Interest income and shareholder’s loans from the Project Companies are payable to the Singapore/Hong Kong/Barbados Companies (where applicable). 2 Includes Project Compan(ies) which are not wholly owned by CRCT. In such instances, CRCT receives a proportionate share of dividends, interest income
and principal repayment of shareholder’s loans from the Project Company for the mall.
CAPITALAND RETAIL CHINA TRUST
6

ORGANISATION STRUCTURE
Board of Directors
Chief Executive Officer
Investment & Asset Management
Investor RelationsFinance
THE MANAGER CAPITALAND RETAIL CHINA TRUST
MANAGEMENT LIMITED
Audit Committee
ANNUAL REPORT 2017
7
FINA
NC
IALS &
AD
DIT
ION
AL IN
FOR
MA
TIO
N
PO
RT
FOLIO
DE
TAILS
B
USIN
ESS R
EV
IEW
SU
STAIN
AB
ILITY
C
OR
PO
RA
TE
GO
VE
RN
AN
CE
& T
RA
NSP
AR
EN
CY
O
VE
RV
IEW
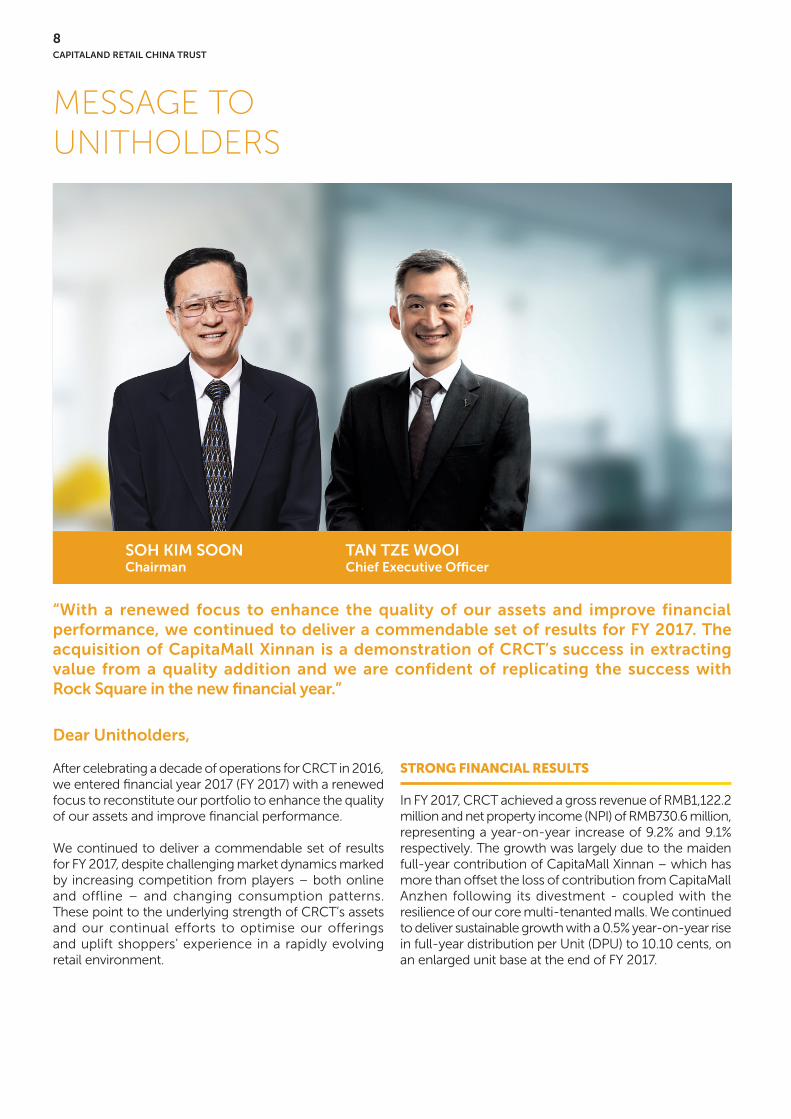
MESSAGE TOUNITHOLDERS
“With a renewed focus to enhance the quality of our assets and improve financial performance, we continued to deliver a commendable set of results for FY 2017. The acquisition of CapitaMall Xinnan is a demonstration of CRCT’s success in extracting value from a quality addition and we are confident of replicating the success with Rock Square in the new financial year.”
Dear Unitholders,
After celebrating a decade of operations for CRCT in 2016, we entered financial year 2017 (FY 2017) with a renewed focus to reconstitute our portfolio to enhance the quality of our assets and improve financial performance.
We continued to deliver a commendable set of results for FY 2017, despite challenging market dynamics marked by increasing competition from players – both online and offline – and changing consumption patterns. These point to the underlying strength of CRCT’s assets and our continual efforts to optimise our offerings and uplift shoppers’ experience in a rapidly evolving retail environment.
STRONG FINANCIAL RESULTS
In FY 2017, CRCT achieved a gross revenue of RMB1,122.2 million and net property income (NPI) of RMB730.6 million, representing a year-on-year increase of 9.2% and 9.1% respectively. The growth was largely due to the maiden full-year contribution of CapitaMall Xinnan – which has more than offset the loss of contribution from CapitaMall Anzhen following its divestment - coupled with the resilience of our core multi-tenanted malls. We continued to deliver sustainable growth with a 0.5% year-on-year rise in full-year distribution per Unit (DPU) to 10.10 cents, on an enlarged unit base at the end of FY 2017.
SOH KIM SOONChairman
TAN TZE WOOIChief Executive Officer
CAPITALAND RETAIL CHINA TRUST
8

Based on CRCT’s closing price of S$1.62 on 31 December 2017, our distribution yield of 6.2% offers an attractive yield relative to alternative investments. In FY 2017, CRCT’s unit price appreciated 18.2%, outperforming the Straits Times Index. Including the DPU declared during the year, Unitholders who have been with us since the start of FY 2017 would have enjoyed a total return of 25.6%1. This achievement is in line with our commitment to deliver sustainable income distributions and growth in total return for our Unitholders over the long term.
RESILIENT OPERATING METRICS
Despite a challenging operating environment, CRCT maintained a healthy set of operating metrics, reflecting the quality of its assets. For FY 2017, tenants’ sales and shopper traffic registered a year-on-year growth of 0.8% and 4.7% respectively, while portfolio occupancy remained high at 95.4% as at 31 December 2017. During the year, 616 new and renewed leases were signed with an average increase of 5.6% over preceeding rents. Portfolio valuation2 rose 2.2% year-on-year to RMB11,969 million.
STRENGTHENING PORTFOLIO QUALITY
During the year, we further strengthened our portfolio through proactive reconstitution. To increase our financial flexibility to seize new growth opportunities, we divested the master-leased CapitaMall Anzhen on 14 September 2017 for S$234.3 million and realised a net gain of S$37.3 million. The divestment was timely, as the mall was master-leased until 2025 with limited upside and increasing capital expenditure commitments.
On 31 January 2018, CRCT completed the acquisition of a 51.0% interest in Rock Square in Guangzhou that has stronger growth potential and a longer balance tenure, for RMB1,713.9 million3 in a 51:49 joint venture with CapitaLand. The accretive acquisition strategically diversifies CRCT’s footprint into another first-tier city and deepens our presence within the Group’s core city clusters. It also allows CRCT to leverage on CapitaLand’s established operations in Guangzhou and enjoy new leasing synergies across our portfolio.
OPTIMISING GROWTH THROUGH PROACTIVE ASSET MANAGEMENT
CRCT’s achievements in FY 2017 continued to be anchored by the sustained strong performances of its two largest core assets, CapitaMall Xizhimen and CapitaMall Wangjing, which recorded healthy growth in tenants’ sales and positive rental reversions. By staying abreast of changing consumer needs, the two malls are well-placed to serve as pioneering platforms for new lifestyle and retail concepts.
During the year, CapitaMall Xizhimen celebrated its tenth anniversary with an interior facelift of its basement and first floor that further enhanced its shopping environment. At CapitaMall Wangjing, CRCT early-recovered approximately 4,700 square metres of space on level 4 from the mall’s anchor tenant. The recovered space is being transformed into higher-yielding specialty stores with differentiated retail options, including a lifestyle book cafe, cooking studio and gourmet offerings. As at December 2017, the recovered space was more than 90% committed and on track to open progressively from the second quarter of 2018.
In Wuhan, we are continuing the revitalisation of CapitaMall Minzhongleyuan. The mall, which was impacted by a 28-month closure of Zhongshan Avenue till end-2016, registered substantial improvement in shopper traffic and tenants’ sales in FY 2017. To enhance its appeal, the mall is adding more experiential retail and entertainment concepts, as well as trendy stores and dining offerings. Our collaboration with popular coworking space operator Ucommune (formerly UrWork) has brought new office crowds to CapitaMall Minzhongleyuan and shopper traffic to the mall has seen a boost from the innovative retail initiatives and interactive content from Ucommune’s members. By extending our collaboration with Ucommune to CapitaMall Wangjing, we have further benefitted from the cross-pollination of ideas between the two markets.
In Shanghai, CapitaMall Qibao has been proactively reinforcing its position as a family-oriented retail destination. It is targeting to launch the city’s largest rooftop children’s learning playland in 2018.
1 Based on closing price of S$1.37 on 31 December 2016 and S$1.62 on 31 December 2017. 2 Excludes CapitaMall Anzhen which was divested on 14 September 2017. 3 Subject to post-completion adjustments.
ANNUAL REPORT 2017
9
FINA
NC
IALS &
AD
DIT
ION
AL IN
FOR
MA
TIO
N
PO
RT
FOLIO
DE
TAILS
B
USIN
ESS R
EV
IEW
SU
STAIN
AB
ILITY
C
OR
PO
RA
TE
GO
VE
RN
AN
CE
& T
RA
NSP
AR
EN
CY
O
VE
RV
IEW

MESSAGE TOUNITHOLDERSNEW GROWTH CATALYSTS
FY 2017 saw the first full-year contribution from CapitaMall Xinnan, which we acquired on 30 September 2016. In addition to deepening shopper engagement, we have further enhanced the trade mix by adding upmarket international brands and elevated the shopping experience by refurbishing the cinema and carpark facilities. Our proactive asset management strategy has paid off with CapitaMall Xinnan registering an improved footfall and a higher occupancy of 99.0% at the end of FY 2017. We are confident of replicating CapitaMall Xinnan’s value-added success with Rock Square in the new financial year.
PROACTIVE BALANCE SHEET MANAGEMENT
As part of our prudent capital management approach, all debts due FY 2017 amounting to S$450.5 million have either been repaid or refinanced at competitive rates, with no refinancing requirements until 2019. As at 31 December 2017, CRCT’s gearing was healthy at 28.4%, with a debt maturity of 3.37 years, and an average cost of debt of 2.48%. In managing volatility amidst a rising interest rate environment, we have also hedged 80% of our total borrowings into fixed interest rates as at 31 December 2017.
In October 2017, CRCT updated and amended its S$500 million Multicurrency Medium Term Note Programme to its S$1 billion Multicurrency Debt Issuance Programme. In December 2017, we successfully raised net proceeds of S$101.7 million from a private placement to part finance the acquisition of Rock Square. The exercise was over-subscribed and the upsized option has been exercised in full, demonstrating strong support from existing and new investors.
CRCT’s Distribution Reinvestment Plan (DRP) in FY 2017 allowed us to conserve S$41.4 million in cash on the back of our Unitholders’ strong support, whereby the cash conserved was utilised to pare down our borrowings. Established since March 2013, the plan has been well-
received with healthy take-up rates. Unitholders can enjoy benefits including electing to receive Units in lieu or part of all the cash amount of distribution, while increasing their holdings in CRCT at a discount without incurring brokerage costs or stamp duties on the new Units. The programme has also proved useful as an alternative source of funding for CRCT, while enhancing its financial flexibility.
DRIVING SUSTAINABILITY
We continue to champion sustainability through our support of charity events and green initiatives as part of our commitment to reinvesting in the communities that our malls operate in. These initiatives include “My Schoolbag”, one of CapitaLand’s key annual corporate social responsibility programmes, participation in the annual global Earth Hour movement on energy conservation, as well as wide-ranging events at our malls to support various social and charitable causes.
LOOKING AHEAD
China’s 2017 GDP grew 6.9% year-on-year to RMB82.7 trillion4, as the country continues its steady transition towards sustainable and quality growth. National retail sales grew 10.2%, while national urban disposable income and expenditure per capita grew 6.5% and 5.4% respectively4. Consumption contributed 58.8%4 to GDP growth in 2017, standing firm as a key economic growth driver. With the stable growth momentum expected to continue into 20185, CRCT’s family-oriented shopping malls are well-placed to benefit from China’s sustainable growth, as well as rising disposable income and consumer spend.
As part of our commitment to deliver sustainable value to our Unitholders, we remain focused in optimising growth and extracting operational efficiencies. Looking ahead, we will continue to adopt a disciplined approach towards capital management and actively seek acquisition opportunities to create more value for Unitholders.
4 China National Bureau of Statistics.5 Xinhua, Economists forecast stable growth for China in 2018, 7 January 2018.
CAPITALAND RETAIL CHINA TRUST
10

ACKNOWLEDGEMENTS
We would like to express our appreciation to past and present Directors, and our employees for their dedication and contributions throughout the year.
Mr Liew Cheng San Victor, who began serving on the Board since the listing of CRCT in 2006 and assumed the role of Chairman of the Board in 2009, retired on 20 April 2017 after more than a decade of service. We would like to thank Mr Liew for his dedication to CRCT and strong leadership as Chairman. We wish him well in his retirement.
Mr Tony Tan Tee Hieong stepped down as Chief Executive Officer and Executive Director on 1 April 2017. We would like to thank Mr Tan for growing CRCT from strength to strength during his seven years as Chief Executive Officer. We wish him well in his new role in the CapitaLand Group.
We would also like to express our gratitude to Mr Jason Leow Juan Thong and Mr Ng Kok Siong who stepped down from the Board on 1 January 2018.
At the same time, we would also like to warmly welcome our new Directors, who bring with them diverse and extensive experience and expertise. They are Mr Neo Poh Kiat and Ms Kuan Li Li, who joined the Board as Independent Directors on 20 April 2017 and 1 January 2018 respectively, as well as Mr Lee Chee Koon and Mr Lim Cho Pin Andrew Geoffrey, who joined the Board as Non-Independent Directors on 1 January 2018.
Last but not least, we would like to thank our Unitholders, business partners, retailers and shoppers for their continued confidence and support.
Soh Kim SoonChairman
Tan Tze WooiChief Executive Officer
27 February 2018
ANNUAL REPORT 2017
11
FINA
NC
IALS &
AD
DIT
ION
AL IN
FOR
MA
TIO
N
PO
RT
FOLIO
DE
TAILS
B
USIN
ESS R
EV
IEW
SU
STAIN
AB
ILITY
C
OR
PO
RA
TE
GO
VE
RN
AN
CE
& T
RA
NSP
AR
EN
CY
O
VE
RV
IEW
致信托单位持有人之信函
尊敬的信托单位持有人,
凯德商用中国信托于2016年庆祝10周年之后,在迈入2017财年之际,决定将焦点放至投资组合重构上,以进一步优化资产质量和提高财务业绩。
尽管面对线上与线下竞争日趋激烈以及消费模式不断变化等市场挑战,我们于2017财年仍然取得佳绩。这个成就体现了我们资产的潜在实力以及我们在快速发展的零售环境中为优化产品和提升消费者体验所做出的努力。
强劲的财务业绩
2017财年,凯德商用中国信托总收入达11.222亿人民币,房地产净收入达7.306亿人民币,分别同比增长9.2%和9.1%。增长主要归因于凯德广场•新南的首次全财年贡献——其贡献足以抵消脱售凯德MALL•安贞所失去的收入——以及我们核心多租户购物中心的韧性。根据2017财年底扩大后的单位基数,全财年每单位派息同比增加0.5%至10.10新分。
以凯德商用中国信托2017年12月31日的闭市价1.62新元计算,我们的股息收益率高达6.2%,相对其他投资选择颇具吸引力。2017财年间,凯德商用中国信托单位价格上涨 18.2%,表现优于海峡时报指数。包括年内所公布的每单位派息,自2017财年伊始便投资凯德商用中国信托的单位持有人一共获得25.6%1的总回报。这一成绩践行了我们为单位持有人提供长期可持续收益和总回报增长的承诺。
稳健的经营指标
尽管面对充满挑战的经营环境,凯德商用中国信托仍然成功维持了稳健的经营指标,这体现了我们资产的质量。2017财年,租户销售额和客流分量别同比增长0.8%和4.7%,而截至2017年12月31日的投资组合整体出租率仍高居于95.4%。 2017财年间签订的616份租约,平均租金比之前提高了 5.6%。投资组合估值2同比上涨2.2%至119.69亿人民币。
优化投资组合质量
过去一年,我们通过积极的资产重组进一步优化我们的投资组合。为了增强我们的财务弹性以抓住新增长机会,我们于2017年9月14日以2.343亿新元出售整租项目凯德MALL•安贞,实现0.373亿新元的净收益。该购物中心的租赁期截至2025年才结束,增长潜力有限而且资本支出日益增加,此时出售是个适时的决定。
随后,凯德商用中国信托于2018年1月31日与凯德集团以51:49的出资比例,用17.139亿人民币3完成了对广州乐峰广场51.0%权益的收购,该购物中心具有更强的增长潜力和更长的有效土地使用期。我们通过这一项增值性收购进军新的一线城市,扩展了凯德商用中国信托的业务覆盖范围,并进一步深化了我们在凯德集团核心城市群中的业务。同时,该收购让凯德商用中国信托获益于凯德集团在广州的现有业务网络,并加强租赁方面的协同效益。
通过积极资产管理优化增长
凯德商用中国信托在2017财年取得的佳绩依然依托其两大核心项目一如既往的出色业绩,它们分别为凯德MALL•西直门和凯德MALL•望京。这两大资产在租户销售额和续租租金方面均取得稳健增长。通过紧跟不断变化的消费者需求,这两家购物中心成功成为倡导新生活方式和零售理念的先锋平台。
凯德MALL•西直门在2017年欢庆10周年之际,为其地下层和第1层进行了内部翻修,进一步改善了购物环境。在凯德MALL•望京,凯德商用中国信托从该购物中心主要租户手中提前收回位于第4层约4,700平方米的空间。空间的改造正如火如荼进行中,将引进收益较高的特色专卖店,其中包括含咖啡馆的时尚书店、创意厨房和美食餐厅。截至2017年12月底,空间90%以上已签约租户,并按计划将于2018年第二季度逐步开业。
在武汉,我们继续重振凯德新民众乐园的业务。随着中山大道在2016年末结束长达28个月的封路,凯德新民众乐园在2017财年迎来了客流量和租户销售额的显著增长。为了提升其吸引力,该购物中心不断引进更多体验式的零售和娱乐理念,以及潮流商店和餐厅。此外,我们还与广受欢迎的联合办公空间运营商优客工场(Ucommune,前称UrWork)合作,吸引新一波办公人群入驻凯德新民众乐园,并通过优客工场成员的创新零售举措和互动进一步提高客流量。我们还将与优客工场的合作延展至凯德MALL•望京,并从这两个市场的信息交流中受益。
在上海,凯德七宝购物广场继续积极巩固其亲家庭购物中心的地位。其计划于2018年推出上海最大的屋顶儿童学习乐园。
“为优化资产质量和提高财务业绩,我们于2017 财年将焦点放在投资组合重组上,并取得佳绩。凯德广场•新南的优异表现是凯德商用中国信托从优质收购中发掘价值的又一成功案例。我们有信心在新财年为乐峰广场复制相同的成功。”
1 基于截至2016年12月31日为止的闭市价1.37新元和截至2017年12月31日为止的闭市价1.62新元。2 不包括已于2017年9月14日脱售的凯德MALL•安贞。3 收购完成后可能有所调整。
CAPITALAND RETAIL CHINA TRUST
12

4 数据源自中国国家统计局。5 新华社2018年1月7日报道“经济学家预测2018年中国稳定增长”。
新增长催化剂
于2016年9月30日收购的凯德广场•新南,首次在2017财年录得全年收益贡献。收购凯德广场•新南后,我们深化与购物者的互动,还通过引进高档国际品牌进一步增强业态组合,并通过翻新影院和停车场设施提升购物体检。我们的积极资产管理策略已在凯德广场•新南取得成效,促成客流量增加,截至2017财年底的出租率提高至99.0%。我们相信凯德广场•新南的成功增值将于2018财年在乐峰广场重现。
严谨的资本管理
作为我们审慎资本管理方式的一部分,我们为2017财年到期共计4.505亿新元债务进行偿还或以有竞争力的利率进行再融资,直至2019年无需再融资。截至2017年12月31日,凯德商用中国信托的负债比率稳定在28.4%,还贷期限延长至3.37年,平均债务成本为2.48%。为了在不断上涨的利率环境中拥有更高的确定性,我们将截至2017年12月31日总贷款的80%对冲为固定利率贷款。
2017年10月,凯德商用中国信托将其价值5亿新元的多元货币中期票据计划更新和修正为价值10亿新元的多元货币债务发行计划。2017年12月,我们成功通过私募筹资净额1.017亿新元,为收购乐峰广场提供部分资金。该私募发售被超额认购且已全额行使增发权,证明了现有和新投资者的强大支持力。
凯德商用中国信托在2017财年继续实施配售再投资计划,在单位持有人慷慨支持下,保留了0.414亿新元现金,用于偿还贷款。该计划自2013年3月成立以来一直获得单位持有人的良好反应。计划提供的好处,包括让单位持有人选择获得单位替代全部或部分配售现金,和以折价增持单位,增持单位无需支付经纪人手续费或印花税。同时,该计划为凯德商用中国信托提供有效的替代筹资源,增强其财务弹性。
推动可持续发展
为实践凯德商用中国信托对购物中心所在社区的再投资承诺,我们一如既往通过支持慈善和环保活动提倡可持续发展。这些活动包括凯德集团的标志性年度企业社会责任项目之一“凯德•我的第一个书包”和一年一度的“地球一小时”全球性节能活动。我们的购物中心也继续举办广泛活动以支持不同的社会公益与慈善事业。
展望未来
2017年,中国GDP同比增长6.9%,达82.7万亿人民币4,这得益于持续向高质量、可持续发展的平稳过渡。社会消费品零售总额增长10.2%,城镇人均可支配收入与支出分
别增长了6.5%和5.4%4。2017年,消费支出依旧是中国经济增长的主要动力,对中国GDP增长的贡献率达58.8%4。中国稳定的增长势头预计将在2018年持续5,凯德商用中国信托以家庭为导向的购物中心将受益于中国的可持续增长以及日益增加的可支配收入和消费性开支。
我们致力于为单位持有人提供可持续的价值,为此,我们将一如既往地专注于优化增长和改进经营效率。展望未来,我们将继续采用严谨的资本管理方式,积极寻找收购机会,为单位持有人创造更多价值。
致谢
我们要借此机会向历届和现任董事以及公司员工在2017年的敬业奉献表示衷心的感谢。
廖青山先生自凯德商用中国信托于2006年上市开始任职董事会,于2009年接任董事会主席一职,为公司鞠躬尽瘁贡献十多年之后,于2017年4月20日光荣退休。在此,我们想感谢廖先生为凯德商用中国信托作出的巨大奉献及其作为董事会主席的出色领导力。我们祝愿他退休之后一切安好。
陈智雄先生于2017年4月1日卸任首席执行官兼执行董事。我们想借此机会感谢陈先生在其任职首席执行官的7年期间,带领凯德商用中国信托日益壮大。我们祝愿他在凯德集团的新岗位上一切顺利。
另外,我们还要感谢已于2018年1月1日卸任董事会的廖茸桐先生和黄国祥先生。
同时,我们热烈欢迎四位新董事,粱宝吉先生、范丽丽女士、李志勤先生和林卓斌先生,他们将为我们带来丰富的经验和专业知识。粱宝吉先生和范丽丽女士,分别于2017年4月20日和2018年1月1日,作为独立董事加入董事会,李志勤先生和林卓斌 先生于2018年1月1日作为非独立董事加入董事会。
最后,我们要感谢单位持有人、商业伙伴、零售商和购物者对我们的坚定支持和信任。
苏锦春主席
陈子威 首席执行官
2018年2月27日
ANNUAL REPORT 2017
13
FINA
NC
IALS &
AD
DIT
ION
AL IN
FOR
MA
TIO
N
PO
RT
FOLIO
DE
TAILS
B
USIN
ESS R
EV
IEW
SU
STAIN
AB
ILITY
C
OR
PO
RA
TE
GO
VE
RN
AN
CE
& T
RA
NSP
AR
EN
CY
O
VE
RV
IEW

PROPERTY PORTFOLIO
B
E A
F
DG
C
A. BEIJING1. CapitaMall Xizhimen2. CapitaMall Wangjing3. CapitaMall Grand Canyon4. CapitaMall Shuangjing
B. CHENGDU5. CapitaMall Xinnan
C. SHANGHAI6. CapitaMall Qibao
D. WUHAN7. CapitaMall Minzhongleyuan
E. HOHHOT8. CapitaMall Saihan
F. ZHENGZHOU9. CapitaMall Erqi
G. WUHU10. CapitaMall Wuhu
CRCT’s Properties in China
3. CapitaMall Grand Canyon
4. CapitaMall Shuangjing2. CapitaMall Wangjing
1. CapitaMall Xizhimen
CAPITALAND RETAIL CHINA TRUST
14

5. CapitaMall Xinnan
6. CapitaMall Qibao
7. CapitaMall Minzhongleyuan
10. CapitaMall Wuhu8. CapitaMall Saihan
9. CapitaMall Erqi
CRCT’s geographically diversified portfolio of quality shopping malls is located in seven of China’s cities. The malls are positioned as one-stop family-oriented shopping, dining and entertainment destinations for the sizeable population catchment areas in which they are located, and are accessible via major transportation routes or access points.
7 CITIES
>1,300leases
RMB11,969MILLION10 properties
Portfolio Property Valuation>610,000sq m of gross rentable area
in China
* Information as at 31 December 2017.
ANNUAL REPORT 2017
15
FINA
NC
IALS &
AD
DIT
ION
AL IN
FOR
MA
TIO
N
PO
RT
FOLIO
DE
TAILS
B
USIN
ESS R
EV
IEW
SU
STAIN
AB
ILITY
C
OR
PO
RA
TE
GO
VE
RN
AN
CE
& T
RA
NSP
AR
EN
CY
O
VE
RV
IEW
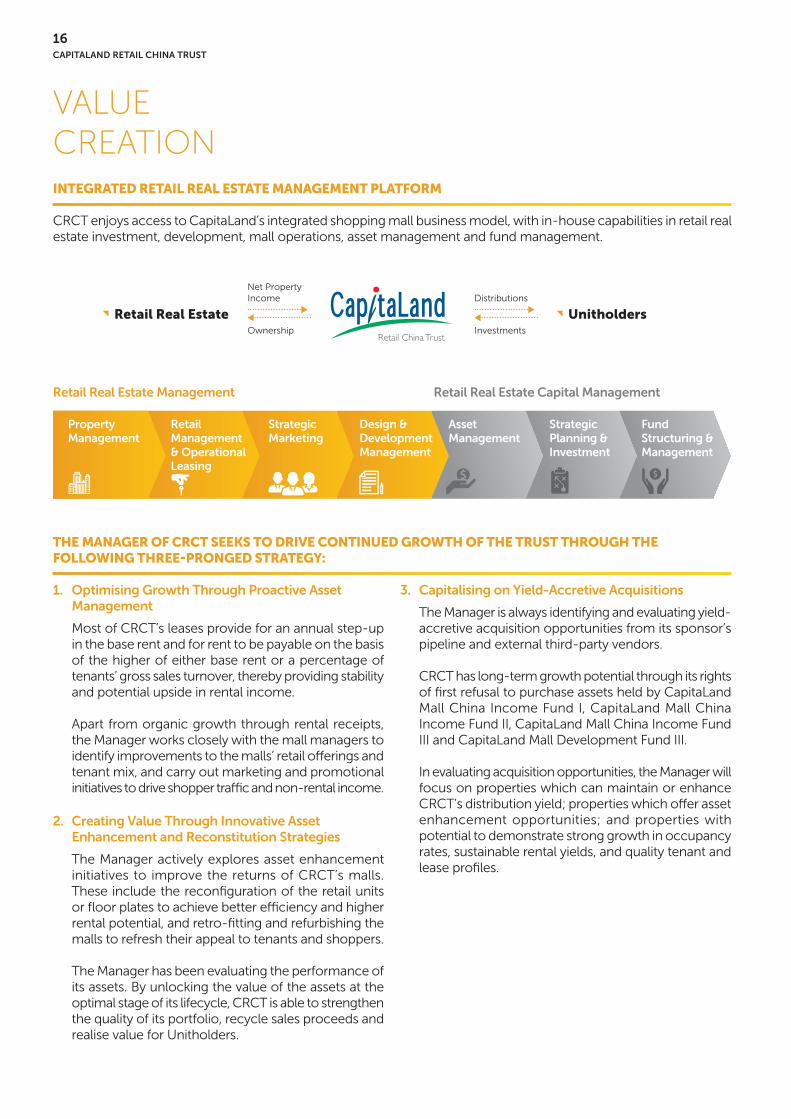
VALUE CREATION
THE MANAGER OF CRCT SEEKS TO DRIVE CONTINUED GROWTH OF THE TRUST THROUGH THE FOLLOWING THREE-PRONGED STRATEGY:
1. Optimising Growth Through Proactive Asset Management
Most of CRCT’s leases provide for an annual step-up in the base rent and for rent to be payable on the basis of the higher of either base rent or a percentage of tenants’ gross sales turnover, thereby providing stability and potential upside in rental income.
Apart from organic growth through rental receipts, the Manager works closely with the mall managers to identify improvements to the malls’ retail offerings and tenant mix, and carry out marketing and promotional initiatives to drive shopper traffic and non-rental income.
2. Creating Value Through Innovative Asset Enhancement and Reconstitution Strategies
The Manager actively explores asset enhancement initiatives to improve the returns of CRCT’s malls. These include the reconfiguration of the retail units or floor plates to achieve better efficiency and higher rental potential, and retro-fitting and refurbishing the malls to refresh their appeal to tenants and shoppers.
The Manager has been evaluating the performance of its assets. By unlocking the value of the assets at the optimal stage of its lifecycle, CRCT is able to strengthen the quality of its portfolio, recycle sales proceeds and realise value for Unitholders.
3. Capitalising on Yield-Accretive Acquisitions
The Manager is always identifying and evaluating yield-accretive acquisition opportunities from its sponsor’s pipeline and external third-party vendors.
CRCT has long-term growth potential through its rights of first refusal to purchase assets held by CapitaLand Mall China Income Fund I, CapitaLand Mall China Income Fund II, CapitaLand Mall China Income Fund III and CapitaLand Mall Development Fund III.
In evaluating acquisition opportunities, the Manager will focus on properties which can maintain or enhance CRCT’s distribution yield; properties which offer asset enhancement opportunities; and properties with potential to demonstrate strong growth in occupancy rates, sustainable rental yields, and quality tenant and lease profiles.
INTEGRATED RETAIL REAL ESTATE MANAGEMENT PLATFORM
CRCT enjoys access to CapitaLand’s integrated shopping mall business model, with in-house capabilities in retail real estate investment, development, mall operations, asset management and fund management.
Retail Real Estate Management Retail Real Estate Capital Management
PropertyManagement
RetailManagement& OperationalLeasing
StrategicMarketing
Design &DevelopmentManagement
AssetManagement
StrategicPlanning &Investment
FundStructuring &Management
Distributions
Investments
Net Property Income
Ownership
UnitholdersRetail Real Estate
CAPITALAND RETAIL CHINA TRUST
16
BOARD OF DIRECTORS
Tan Tze WooiChief Executive OfficerExecutive Non-Independent Director
Christopher Gee Kok AunNon-Executive Independent Director
Kuan Li LiNon-Executive Independent Director
Fong Heng BooNon-Executive Independent Director
Neo Poh KiatNon-Executive Independent Director
Professor Tan Kong YamNon-Executive Independent Director
Soh Kim SoonChairmanNon-Executive Independent Director
Lim Ming YanDeputy ChairmanNon-Executive Non-Independent Director
Lee Chee KoonNon-Executive Non-Independent Director
Lim Cho Pin Andrew GeoffreyNon-Executive Non-Independent Director
FIN
AN
CIA
LS & A
DD
ITIO
NA
L INFO
RM
AT
ION
P
OR
TFO
LIO D
ETA
ILS
BU
SINE
SS RE
VIE
W
SUSTA
INA
BILIT
Y
CO
RP
OR
AT
E G
OV
ER
NA
NC
E &
TR
AN
SP
AR
EN
CY
O
VE
RV
IEW
ANNUAL REPORT 2017
17
BOARD OF DIRECTORSSOH KIM SOON, 72ChairmanNon-Executive Independent DirectorBachelor of Arts (Honours), University of SingaporeAssociate, Chartered Institute of Bankers
Date of first appointment as a director:20 April 2017Date of appointment as Chairman:20 April 2017Length of service as a director (as at 31 December 2017):8 months
Board committee served on Corporate Disclosure Committee (Chairman)
Present principal commitments ORIX Investment and Management Private Limited
(Chairman) ORIX Leasing Singapore Limited (Chairman)
Past directorships in other listed company held over the preceding three years Engro Corporation Limited Frasers Centrepoint Asset Management Ltd. (manager of
Frasers Centrepoint Trust)
Background and working experience Senior Managing Director of DBS Bank Ltd (was with DBS
Bank Ltd from 1971 to 2000 where he held various senior management positions)
Awards Public Service Medal (2007) May Day Award (Friend of Labour) (2012)
LIM MING YAN, 55Deputy ChairmanNon-Executive Non-Independent DirectorBachelor of Engineering (Mechanical) and Economics (First Class Honours), University of Birmingham, UK
Date of first appointment as a director:1 January 2013Date of appointment as Deputy Chairman:1 January 2013Length of service as a director (as at 31 December 2017):5 years
Board committees served on Corporate Disclosure Committee (Member) Executive Committee (Chairman)
Present directorships in other listed companies Ascott Residence Trust Management Limited (manager
of Ascott Residence Trust) (Deputy Chairman) CapitaLand Commercial Trust Management Limited
(manager of CapitaLand Commercial Trust) (Deputy Chairman)
CapitaLand Limited CapitaLand Mall Trust Management Limited (manager of
CapitaLand Mall Trust) (Deputy Chairman)
Present principal commitments(other than directorships in other listed companies) Business China (Director) Future Economy Council (Member) Shanghai YiDian Holding (Group) Company (Director) Singapore Tourism Board (Member of the Board) Workforce Singapore Agency (Chairman)
Background and working experience Chief Operating Officer of CapitaLand Limited (From May
2011 to December 2012) CEO of The Ascott Limited (From July 2009 to
February 2012) CEO of CapitaLand China Holdings Pte Ltd (From July
2000 to June 2009)
Awards Outstanding Chief Executive (Overseas) at the Singapore
Business Awards 2006 Magnolia Award by the Shanghai Municipal Government in
2003 and 2005
18CAPITALAND RETAIL CHINA TRUST

TAN TZE WOOI, 45Chief Executive OfficerExecutive Non-Independent DirectorBachelor of Accountancy (Honours), Nanyang Technological University of SingaporeChartered Financial Analyst® and Member, CFA Institute
Date of first appointment as a director:1 April 2017Length of service as a director (as at 31 December 2017):9 months
Board committee served on Executive Committee (Member)
Background and working experience Chief Executive Officer (Designate) of CapitaLand Retail
China Trust Management Limited (March 2017) Deputy Chief Executive Officer of CapitaLand Retail China
Trust Management Limited (From December 2016 to February 2017)
Regional General Manager, North China of CapitaMalls Asia Limited (From March 2014 to February 2017)
Regional Deputy General Manager, North China of CapitaMalls Asia Limited (From July 2013 to February 2014)
General Manager, Investment & Asset Management, North China of CapitaMalls Asia Limited (From September 2011 to July 2013)
Deputy Head, Investment & Asset Management of CapitaMalls Asia Limited (From April 2010 to September 2011)
Vice President, Investment & Asset Management of CapitaRetail China Trust Management Limited (From October 2008 to December 2014)
Senior Manager of CapitaRetail China Trust Management Limited (From January 2007 to September 2008)
FONG HENG BOO, 68Non-Executive Independent DirectorBachelor of Accountancy (Honours), University of Singapore
Date of first appointment as a director:1 January 2013Length of service as a director (as at 31 December 2017):5 years
Board committee served on Audit Committee (Chairman)
Present directorships in other listed companies Asian American Medical Group Limited Colex Holdings Limited TA Corporation Ltd
Present principal commitments(other than directorships in other listed companies) CapitaLand Township Development Fund Pte. Ltd.
(Director) CapitaLand Township Development Fund II Pte. Ltd.
(Director) Certis CISCO Security Pte. Ltd. (Director) Singapore Turf Club (Member, Management Committee) Surbana Jurong Private Limited (Director) Singapore Health Services Pte Ltd (Director)
Past directorship in other listed company held over the preceding three years Pteris Global Limited Sapphire Corporation Limited
Background and working experience Director, Special Duties of Singapore Totalisator Board
(From July 2004 to December 2014) Senior Vice President, Corporate Services of Singapore Turf
Club (From May 2000 to June 2004) Deputy General Manager, Corporate Services of Singapore
Turf Club (From May 1998 to May 2000) Chief Financial Officer of Easycall International Pte Ltd/
Matrix Telecommunications Ltd (From June 1996 to April 1998)
General Manager, Corporate Services of Amcol Holdings Limited (From October 1993 to May 1996)
Assistant Auditor-General of Auditor-General’s Office (From February 1987 to September 1993)
Divisional Director of Auditor-General’s Office (From May 1980 to January 1987)
Auditor of Auditor-General’s Office (From November 1975 to April 1979)
Award Institute of Certified Public Accountants of Singapore Silver
Medal (1999)
FIN
AN
CIA
LS & A
DD
ITIO
NA
L INFO
RM
AT
ION
P
OR
TFO
LIO D
ETA
ILS
BU
SINE
SS RE
VIE
W
SUSTA
INA
BILIT
Y
CO
RP
OR
AT
E G
OV
ER
NA
NC
E &
TR
AN
SP
AR
EN
CY
O
VE
RV
IEW
ANNUAL REPORT 2017
19
BOARD OF DIRECTORSCHRISTOPHER GEE KOK AUN, 49Non-Executive Independent DirectorBachelor of Arts in Law (Honours), University of Nottingham, UKChartered Financial Analyst® and Member, CFA Institute
Date of first appointment as a director:24 January 2014Length of service as a director (as at 31 December 2017):3 years 11 months
Board committee served on Audit Committee (Member)
Present principal commitments Institute of Policy Studies, Lee Kuan Yew School of
Public Policy, National University of Singapore (Senior Research Fellow)
Institute of Real Estate Studies, National University of Singapore (Senior Research Fellow)
Department of Real Estate, National University of Singapore (Senior Research Fellow)
Manas Asian Equities Value Fund (Director)
Background and working experience Head, Singapore Equities Research of J.P. Morgan
Securities Singapore Private Limited (From July 2002 to February 2012)
Head, Asia Real Estate Equities Research of J.P. Morgan Securities Singapore Private Limited (From September 2006 to February 2012)
Head, Singapore and Malaysia Equities Research of ING Barings Securities (From June 2000 to June 2002)
Head, Malaysia Equities Research and Investment Analyst of ING Barings Securities Malaysia Sdn. Bhd. (From June 1994 to June 2000)
Audit and Corporate Recovery of Price Waterhouse, London (From September 1990 to March 1994)
PROFESSOR TAN KONG YAM, 62Non-Executive Independent DirectorBachelor in Economics, Princeton UniversityPhD in Economics, Stanford University
Date of first appointment as a director:31 October 2014Length of service as a director (as at 31 December 2017):3 years 2 months
Board committee served on Audit Committee (Member)
Present principal commitments APS Asset Management Pte Ltd (Director) Ascendas-Singbridge Pte. Ltd. (Director) Changi Airport Group (Singapore) Pte. Ltd. (Director) EMR Capital Investment (No. 3B) Pte. Ltd. (Director) EMR Capital Investment (No. 4B) Pte. Ltd. (Director) Nanyang Technological University of Singapore (Professor
of Economics) Surbana Jurong Private Limited (Director)
Background and working experience Senior Economist, Beijing Office of World Bank (From July
2002 to July 2005) Member, Expert Group on the 11th Five Year Plan of World
Bank (2004) Chief Economist of The Ministry of Trade and Industry
(From July 1999 to June 2002) Head, Department of Business Policy at NUS Business
School of National University of Singapore (From 1988 to 1999)
20CAPITALAND RETAIL CHINA TRUST

NEO POH KIAT, 67Non-Executive Independent DirectorBachelor of Commerce (Honours), Nanyang University
Date of first appointment as a director:20 April 2017Length of service as a director (as at 31 December 2017):8 months
Present directorship in other listed company China Yuchai International Limited (NYSE)
Present principal commitment(other than directorship in other listed company) Octagon Advisors Pte. Ltd. (Managing Director, Advisory
Services)
Background and working experience Country Officer (China) and Head, Corporate Banking
(Greater China) of United Overseas Bank Ltd (From July 2001 to January 2005)
General Manager (Leasing and Corporate Services) of Sino Land Co Ltd (From January 1994 to August 1996)
A Managing Director of DBS Bank (Was with DBS Bank group of companies from January 1976 to December 1993 and from August 1996 to July 2001 where he held various senior management positions)
KUAN LI LI, 54Non-Executive Independent DirectorBachelor of Economics, University of SydneyBachelor of Laws, University of Sydney
Date of first appointment as a director:1 January 2018
Present principal commitment ABB Pte. Ltd. (Chief Financial Officer) WWF-World Wide Fund for Nature (Singapore) Limited
(Audit Committee)
Background and working experience Chief Executive Officer of Barclays Merchant Bank
(Singapore) Ltd (From June 2014 to December 2017) Chief Executive Officer of Barclays Capital Futures
(Singapore) Private Limited (From June 2014 to December 2017)
Country Head and Chief Operating Officer of Barclays Bank PLC (From April 2014 to December 2017)
Head of Tax, Asia Pacific of Barclays Capital Services Limited Singapore Branch (From October 2004 to March 2014)
FIN
AN
CIA
LS & A
DD
ITIO
NA
L INFO
RM
AT
ION
P
OR
TFO
LIO D
ETA
ILS
BU
SINE
SS RE
VIE
W
SUSTA
INA
BILIT
Y
CO
RP
OR
AT
E G
OV
ER
NA
NC
E &
TR
AN
SP
AR
EN
CY
O
VE
RV
IEW
ANNUAL REPORT 2017
21

BOARD OF DIRECTORS
LEE CHEE KOON, 43Non-Executive Non-Independent DirectorBachelor of Science in Mechanical Engineering (First Class Honours), National University of SingaporeMaster of Science in Mechanical Engineering (Distinction), Imperial College London, UK
Date of first appointment as a director:1 January 2018
Board committee served on Executive Committee (Member)
Present directorships in other listed companies CapitaLand Commercial Trust Management Limited
(manager of CapitaLand Commercial Trust) Ascott Residence Trust Management Limited (manager of
Ascott Residence Trust)
Present principal commitments(other than directorships in other listed companies) CapitaLand Limited (Group Chief Investment Officer) Lifelong Learning Institute Pte Ltd (Director) National University of Singapore – Institute of Real Estate
Studies (Member of the Management Board) Temasek Foundation Nurtures CLG Limited (Director)
Background and working experience CEO of The Ascott Limited (From June 2013 to
December 2017) Deputy CEO of The Ascott Limited (From February 2012 to
May 2013) Managing Director, North Asia of The Ascott Limited (From
July 2009 to May 2013) Vice President, Office of the President of CapitaLand
Limited (From February 2007 to June 2009) Head, International Relations & Economic Strategy
of Ministry of Finance (From November 2003 to January 2007)
Assistant Director of Ministry of Trade and Industry (From November 2001 to November 2003)
Award National Order of Merit (Chevalier de l’Ordre National
du Mérite) in 2016
LIM CHO PIN ANDREW GEOFFREY, 48Non-Executive Non-Independent DirectorBachelor of Commerce (Economics), University of TorontoChartered Financial Analyst® and Member, CFA Institute Master in Business Administration, Rotman School of Business, University of Toronto
Date of first appointment as a director:1 January 2018
Board committees served on Audit Committee (Member) Corporate Disclosure Committee (Member) Executive Committee (Member)
Present directorships in other listed companies CapitaLand Commercial Trust Management Limited
(manager of CapitaLand Commercial Trust) CapitaLand Mall Trust Management Limited (manager of
CapitaLand Mall Trust) Ascott Residence Trust Management Limited (manager of
Ascott Residence Trust)
Present principal commitment(other than directorships in other listed companies) CapitaLand Limited (Group Chief Financial Officer)
Background and working experience Group Chief Financial Officer (Designate) of CapitaLand
Limited (From 25 November 2016 to 31 December 2016) Managing Director and Head of SEA Coverage Advisory
of HSBC Global Banking (From January 2016 to December 2016)
Managing Director and Head of SEA Real Estate of HSBC Global Banking (From January 2015 to December 2015)
Managing Director, SEA Investment Banking of HSBC Global Banking (From April 2013 to December 2014)
Director, SEA Investment Banking of HSBC Global Banking (From April 2010 to March 2013)
Associate Director, Investment Banking of HSBC Global Banking (From April 2007 to March 2010)
Associate, Investment Banking of HSBC Global Banking (From July 2004 to March 2007)
22CAPITALAND RETAIL CHINA TRUST
TAN TZE WOOIChief Executive Officer & Executive Non-Independent Director
Refer to the description under the section on Board of Directors.
TRUST MANAGEMENT TEAM (CRCTML)
The Investment and Asset Management (IAM) Team is responsible for identifying and evaluating potential acquisitions and investments, as well as formulating business and enhancement plans for CRCT’s assets. They work closely with the property managers as well as the shopping malls’ centre management to ensure that the plans are diligently implemented.
PAULINE YEHVice President, Investment and Asset Management
Pauline leads the IAM function for CRCTML. She has over 20 years of experience in the real estate industry in Singapore, Indonesia and China. She was an Asset Manager in Singapore for CapitaLand Mall Trust and Centre Manager in Singapore and China for CMA prior to joining CRCTML. She holds a Bachelor of Science (Honours) in Estate Management from National University of Singapore.
INVESTMENT AND ASSET MANAGEMENT TEAM
The Finance Team is responsible for all finance-related functions, including the preparation of statutory accounts, budgeting, sourcing and management of funds, management of treasury and tax affairs, compliance, liaison with external audit, and all other finance-related matters.
JOANNE TAN SIEW BEEHead, Finance
Joanne has over 17 years of finance and accounting experience. She holds a professional degree with the Association of Chartered Certified Accountants (ACCA) and is a Chartered Accountant (CA) of Singapore.
FINANCE TEAM
The Investor Relations Team is responsible for maintaining transparent communications with Unitholders, potential investors and analysts through communication channels such as annual reports, press releases, presentations, roadshows and CRCT’s website.
DELPHINE SZEManager, Investor Relations
Delphine has over 10 years of experience in investor relations and communications. She holds a Bachelor of Arts in Communications and Media Management from University of South Australia, and she has obtained the International Certificate in Investor Relations (ICIR).
INVESTOR RELATIONS TEAM
FIN
AN
CIA
LS & A
DD
ITIO
NA
L INFO
RM
AT
ION
P
OR
TFO
LIO D
ETA
ILS
BU
SINE
SS RE
VIE
W
SUSTA
INA
BILIT
Y
CO
RP
OR
AT
E G
OV
ER
NA
NC
E &
TR
AN
SP
AR
EN
CY
O
VE
RV
IEW
ANNUAL REPORT 2017
23

CORPORATE GOVERNANCEOUR ROLE
Our primary role as the manager of CRCT (Manager) is to set the strategic direction of CRCT and make recommendations to HSBC Institutional Trust Services (Singapore) Limited, in its capacity as trustee of CRCT (Trustee), on any investment or divestment opportunities for CRCT and the enhancement of the assets of CRCT in accordance with the stated investment strategy for CRCT. The research, evaluation and analysis required for this purpose are coordinated and carried out by us as the Manager.
As the Manager, we have general powers of management over the assets of CRCT. Our primary responsibility is to manage the assets and liabilities of CRCT for the benefit of the unitholders of CRCT (Unitholders). We do this with a focus on generating rental income and enhancing asset value over time so as to maximise returns from the investments, and ultimately the distributions and total returns to Unitholders.
Our other functions and responsibilities as the Manager include:
(a) using our best endeavours to conduct CRCT’s business in a proper and efficient manner;(b) preparing annual business plans for review by the directors of the Manager (Directors), including forecasts on
revenue, net income and capital expenditure, explanations on major variances to previous years’ financial results, written commentaries on key issues and underlying assumptions on rental rates, operating expenses and any other relevant assumptions;
(c) ensuring compliance with relevant laws and regulations, including the Listing Manual of Singapore Exchange Securities Trading Limited (SGX-ST) (Listing Manual), the Code on Collective Investment Schemes (CIS Code) issued by the Monetary Authority of Singapore (MAS) (including Appendix 6 of CIS Code (Property Funds Appendix)), the Securities and Futures Act (Chapter 289 of Singapore), written directions, notices, codes and other guidelines that MAS may issue from time to time, and the tax rulings issued by the Inland Revenue Authority of Singapore on the taxation of CRCT and Unitholders;
(d) attending to all regular communications with Unitholders; and(e) supervising CapitaLand Retail (Shanghai) Management & Consulting Co., Ltd. and its branches (Property Managers),
the property manager which performs the day-to-day property management functions (including leasing, marketing, promotion, operations coordination and other property management activities) for CRCT’s malls.
The Manager also considers sustainability issues (including environmental and social factors) as part of its responsibilities. CRCT’s environmental sustainability and community outreach programmes are set out on pages 54 to 59 of this Annual Report.
CRCT, constituted as a trust, is externally managed by the Manager. The Manager appoints experienced and well qualified personnel to run its day-to-day operations.
The Manager was appointed in accordance with the terms of the trust deed constituting CRCT dated 23 October 2006 (as amended, varied or supplemented from time to time) (Trust Deed). The Trust Deed outlines certain circumstances under which the Manager can be removed, including by notice in writing given by the Trustee upon the occurrence of certain events, or by resolution passed by a simple majority of Unitholders present and voting at a meeting of Unitholders duly convened and held in accordance with the provisions of the Trust Deed.
The Manager is a wholly owned subsidiary of CapitaLand Limited (CL) which holds a significant unitholding interest in CRCT. CL is a long-term real estate developer and investor, with a vested interest in the long-term performance of CRCT. CL’s significant unitholding in CRCT demonstrates its commitment to CRCT and as a result, CL’s interest is aligned with that of other Unitholders. The Manager’s association with CL provides the following benefits, among other things, to CRCT:
(a) a stable pipeline of property assets through CL’s development activities;(b) wider and better access to banking and capital markets on favourable terms;(c) fund raising and treasury support; and(d) access to a bench of experienced management talent.
24CAPITALAND RETAIL CHINA TRUST

OV
ER
VIE
WC
OR
PO
RA
TE
GO
VE
RN
AN
CE
& T
RA
NS
PA
RE
NC
YSU
STAIN
AB
ILITY
BU
SINE
SS RE
VIE
WP
OR
TFO
LIO D
ETA
ILSFIN
AN
CIA
LS & A
DD
ITIO
NA
L INFO
RM
AT
ION
OUR CORPORATE GOVERNANCE CULTURE
The Manager aspires to the highest standards of corporate governance. The Manager is committed to continuous improvement in corporate governance. It has developed and, on an ongoing basis, maintains sound and transparent policies and practices to meet the specific business needs of CRCT and to provide a firm foundation for a trusted and respected business enterprise. The Manager remains focused on complying with the substance and spirit of the principles of the Code of Corporate Governance 2012 (Code) while achieving operational excellence and delivering CRCT’s long-term strategic objectives. The Board of Directors (Board) is responsible for the Manager’s corporate governance standards and policies, underscoring their importance to the Manager.
This corporate governance report (Report) sets out the corporate governance practices for financial year (FY) 2017 with reference to the principles of the Code. For FY 2017, save as stated in this Report, CRCT has complied in all material aspects with the principles and guidelines in the Code. Where there are deviations from any of the guidelines of the Code, an explanation has been provided within this Report.
(A) BOARD MATTERS
The Board’s Conduct of AffairsPrinciple 1:Every company should be headed by an effective Board to lead and control the company. The Board is collectively responsible for the long-term success of the company. The Board works with Management to achieve this objective and Management remains accountable to the Board.
The Manager is led by the Board which presently comprises a majority of non-executive independent directors (IDs). This exceeds the recommendations in the Code. The Board has diversity of skills and knowledge, experience, educational background and gender. Each Director brings to the Board skills, experience, insights and sound judgement which, together with his or her strategic networking relationships, serves to further the interests of CRCT.
The Board oversees the affairs of the Manager, in furtherance of the Manager’s primary responsibility to manage the assets and liabilities of CRCT for the benefit of Unitholders. The Board provides leadership to the Chief Executive Officer (CEO) and the management team (Management) and sets the strategic vision, direction and long-term objectives for CRCT. The CEO, assisted by Management, is responsible for the execution of the strategy for CRCT and the day-to-day operations of CRCT’s business.
The Board provides leadership to Management, sets strategic directions and oversees the management of CRCT. The Board establishes goals for Management and monitors the achievement of these goals. It ensures that proper and effective controls are in place to assess and manage business risks and compliance with requirements under the Listing Manual, the Property Funds Appendix, as well as any other applicable guidelines prescribed by the SGX-ST, MAS or other relevant authorities, and applicable laws. It also sets the disclosure and transparency standards for CRCT and ensures that obligations to Unitholders and other stakeholders are understood and met.
The Board has reserved authority to approve certain matters and these include:
(a) material acquisitions, investments and divestments;(b) issue of new units in CRCT (Units);(c) income distributions and other returns to Unitholders; and(d) matters which involve a conflict of interest for a controlling Unitholder or a Director.
The Board has established various Board Committees to assist it in the discharge of its functions. These Board Committees are the Audit Committee (AC), the Corporate Disclosure Committee (CDC) and the Executive Committee (EC). Each of these Board Committees operates under authority delegated from the Board, with the Board retaining overall oversight, and has its own terms of reference. The composition of the various Board Committees is set out on page 46 of this Annual Report.
FIN
AN
CIA
LS & A
DD
ITIO
NA
L INFO
RM
AT
ION
P
OR
TFO
LIO D
ETA
ILS
BU
SINE
SS RE
VIE
W
SUSTA
INA
BILIT
Y
CO
RP
OR
AT
E G
OV
ER
NA
NC
E &
TR
AN
SP
AR
EN
CY
O
VE
RV
IEW
ANNUAL REPORT 2017
25

CORPORATE GOVERNANCEThe Board may form other Board Committees as dictated by business imperatives. Membership of the various Board Committees is managed to ensure an equitable distribution of responsibilities among Board members, to maximise the effectiveness of the Board and to foster active participation and contribution from Board members. Diversity of experience and appropriate skills are considered in the composition of the respective Board Committees.
The Board has adopted a set of internal controls which establishes approval limits for capital expenditure, investments, divestments, bank borrowings and issuance of debt instruments. Apart from matters that specifically require the Board’s approval, the Board delegates authority for transactions below those limits to Board Committees and Management.
The Board meets at least once every quarter, and as required by business imperatives. Board and Board Committee meetings are scheduled prior to the start of each financial year. Where exigencies prevent a Director from attending a Board meeting in person, the Constitution of the Manager permits the Director to participate via audio or video conference. The Board and Board Committees may also make decisions by way of resolutions in writing. In each meeting where matters requiring the Board’s approval are to be considered, all members of the Board participate in the discussions and deliberations; and resolutions in writing are circulated to all Directors for their consideration and approval. The exception is where a Director has a conflict of interest in a particular matter, in which case he or she will be required to recuse himself or herself from the deliberations and abstain from voting on the matter. This principle of collective decisions adopted by the Board ensures that no individual influences or dominates the decision making process.
During Board meetings, non-executive Directors review the performance of Management in meeting agreed goals and objectives and monitor the reporting of performance. During the Board meeting to discuss strategies, non-executive Directors constructively challenge and help develop proposals on strategy.
A total of four Board meetings were held in FY 2017. A record of the Directors’ attendance at Board and Board Committees’ meetings in FY 2017 is set out on page 46 of this Annual Report. The Manager believes in the manifest contributions of its Directors beyond attendance at formal Board and Board Committee meetings. To judge a Director’s contributions based on his or her attendance at formal meetings alone would not do justice to his or her overall contributions, which include being accessible to Management for guidance or exchange of views outside the formal environment of Board and Board Committee meetings.
In view of the increasingly demanding, complex and multi-dimensional role of a director, the Board recognises the importance of continual training and development for its Directors so as to equip them to discharge the responsibilities of their office as Directors to the best of their abilities. The Manager has in place a training framework to guide and support the Manager towards meeting the objective of having a Board which comprises individuals who are competent and possess up-to-date knowledge and skills necessary to discharge their responsibilities. The Manager also maintains a training record to track the Directors’ attendance at training and professional development courses. The costs of training are borne by the Manager. Upon appointment, each Director is provided with a formal letter of appointment and a copy of the Director’s Manual (which includes information on a broad range of matters relating to the role and responsibilities of a director). All Directors, upon appointment, also undergo an induction programme which focuses on orientating the Director to CRCT’s business, operations, strategy, organisational structure, responsibilities of key management personnel, and financial and governance practices.
Following their appointment, Directors are provided with opportunities for continuing education in areas such as directors’ duties and responsibilities, changes to regulations and accounting standards, and industry-related matters, so as to be updated on matters that affect or may enhance their performance as Directors or Board Committee members. Directors may contribute by highlighting relevant areas of interest. Directors also receive on-the-job training through being engaged in actual Board work. In FY 2017, the training and professional development programmes for Directors included forums and dialogues with experts and senior business leaders on issues facing boards and board practices.
Board Composition and GuidancePrinciple 2:There should be a strong and independent element on the Board, which is able to exercise objective judgement on corporate affairs independently, in particular, from Management and 10% shareholders. No individual or small group of individuals should be allowed to dominate the Board’s decision making.
26CAPITALAND RETAIL CHINA TRUST

The Board reviews from time to time the size and composition of the Board, with a view to ensuring that the size of the Board is appropriate in facilitating effective decision making, taking into account the scope and nature of the operations of CRCT and its subsidiaries (CRCT Group), and that the Board has a strong independent element.
The Board presently comprises 10 Directors, six of whom (including the Chairman) are IDs. Profiles of the Directors are provided on pages 18 to 22 of this Annual Report. The recommendation in the Code for the appointment of a lead ID does not apply to the Manager as the Chairman is an ID, and he and the CEO are separate individuals, and they are not related to each other.
The Board assesses the independence of each Director in accordance with the guidance in the Code and the Securities and Futures (Licensing and Conduct of Business) Regulations (SFR). An ID is one who has no relationship with the Manager, its related corporations and its shareholders who hold 10% or more of the voting shares of the Manager, or Unitholders who hold 10% or more of the Units in issue, or its officers that could interfere, or be reasonably perceived to interfere, with the exercise of his or her independent business judgement; and is independent from any management and business relationship with the Manager and CRCT, the substantial shareholder of the Manager and the substantial unitholder of CRCT and has not served on the Board for a continuous period of nine years or longer.
The Board has established a process for assessing the independence of its Directors. As part of the process, each of the relevant non-executive Directors is required to confirm upon appointment, as well as on an annual basis, that there are no material relationships which would render him or her non-independent. The confirmations are reviewed by the Board during which the Board also considers the Directors’ respective contributions at Board meetings.
The Board has carried out the assessment of each of its Directors for FY 2017 as well as Ms Kuan Li Li who was appointed on 1 January 2018. The paragraphs below set out the outcome of the assessment.
Each of Mr Fong Heng Boo, Professor Tan Kong Yam and Mr Neo Poh Kiat is a non-executive director of a few subsidiaries and/or associated corporations of Temasek Holdings (Private) Limited (Temasek). Temasek is deemed to be a substantial Unitholder through its direct and indirect interest in CL, which is a substantial Unitholder of CRCT. Each of Mr Fong, Professor Tan and Mr Neo’s role in these organisations is non-executive in nature and is not involved in the day-to-day conduct of the business of these organisations. These roles also do not pose any conflict of interest issues for Mr Fong, Professor Tan and Mr Neo. The Board therefore considers that the relationships set out above did not impair their independence and objectivity.
The Board also considered whether each of Mr Fong Heng Boo, Professor Tan Kong Yam and Mr Neo Poh Kiat had demonstrated independence of character and judgement in the discharge of his responsibilities as a Director in FY 2017, and is satisfied that each of Mr Fong, Professor Tan and Mr Neo had acted with independent judgement.
With respect to Mr Soh Kim Soon, Mr Christopher Gee Kok Aun and Mr Liew Cheng San Victor, the Board also considered whether each of them had demonstrated independence of character and judgement in the discharge of his responsibilities as a Director in FY 2017, and is also satisfied that each of Mr Soh, Mr Gee and Mr Liew had acted with independent judgement. Mr Liew stepped down as a Director and Chairman with effect from 20 April 2017.
It is noted that all of the current Directors have served on the Board for fewer than nine years.
On the bases of the declarations of independence provided by the relevant non-executive Directors and the guidance in the Code and the SFR, the Board has determined that Mr Soh, Mr Fong, Mr Gee, Professor Tan, Mr Neo, Ms Kuan and Mr Liew are independent directors. Each of them had recused himself or herself from the Board’s deliberations respectively on his or her own independence.
At all times, the Directors are collectively and individually obliged to act honestly and with diligence, and in the best interests of CRCT. The Manager has established a policy that its Directors disclose their interests in transactions and any conflicts of interests, and recuse themselves from any discussions concerning a matter in which they may be in a conflict of interest situation. Each of the Directors has complied with this policy. Compliance by the Directors is duly minuted.
FIN
AN
CIA
LS & A
DD
ITIO
NA
L INFO
RM
AT
ION
P
OR
TFO
LIO D
ETA
ILS
BU
SINE
SS RE
VIE
W
SUSTA
INA
BILIT
Y
CO
RP
OR
AT
E G
OV
ER
NA
NC
E &
TR
AN
SP
AR
EN
CY
O
VE
RV
IEW
ANNUAL REPORT 2017
27

CORPORATE GOVERNANCEChairman and Chief Executive OfficerPrinciple 3:There should be a clear division of responsibilities between the leadership of the Board and the executives responsible for managing the company’s business. No one individual should represent a considerable concentration of power.
To maintain an appropriate balance of power, increased accountability and greater capacity of the Board for independent decision making, the roles and responsibilities of the Chairman and the CEO are held by separate individuals.
The non-executive independent Chairman, Mr Soh Kim Soon, is responsible for leading the Board and ensuring that the Board is effective in all aspects of its role. The CEO, Mr Tan Tze Wooi, has full executive responsibilities over the business directions and operational decisions of CRCT and is responsible for implementing CRCT’s strategies and policies and conducting CRCT’s business.
The Chairman is responsible for leadership of the Board and for facilitating the conditions for the overall effectiveness of the Board, Board Committees and individual Directors. This includes setting the agenda of the Board in consultation with the CEO and promoting constructive engagement among the Directors as well as between the Board and the CEO on strategic issues. The Chairman plays a significant leadership role by providing clear oversight, direction, advice and guidance to the CEO and Management on strategies.
The Chairman and the CEO are not immediate family members. The separation of the roles of the Chairman and the CEO and the resulting clarity of roles provide a healthy professional relationship between the Board and Management, and facilitate robust deliberations on the business activities of CRCT and the exchange of ideas and views to help shape CRCT’s strategic process. Given that the roles of the Chairman and CEO are held by separate individuals and the Chairman is an ID, no Lead ID is required to be appointed.
Board MembershipPrinciple 4:There should be a formal and transparent process for the appointment and re-appointment of directors to the Board.
The Board undertakes the functions of a nominating committee and therefore, the Manager does not have a nominating committee. The Board performs the functions that such a committee would otherwise perform, namely, it administers nominations to the Board, reviews the structure, size and composition of the Board, and reviews the performance and independence of Board members. The Board seeks to ensure that the composition of the Board provides an appropriate balance and diversity of skills, experience and knowledge of the industry and that the Directors, as a group, have the necessary core competencies relevant to CRCT’s business.
The current Board comprises individuals who are business leaders and professionals with financial, banking, real estate, legal, investment and accounting backgrounds. The Board recognises the benefits of having a diverse Board. Diversity in the Board’s composition not only contributes to the quality of its decision making through diversity of perspectives in its boardroom deliberations, it also enables Management to benefit from their respective expertise and diverse backgrounds. The Board also considers gender an important aspect of diversity alongside factors such as the age, ethnicity and educational background of its members. The Board is committed to diversity and will continue to consider the differences in the skillsets, gender, age, ethnicity and educational, business and professional background in determining the optimal composition of the Board in its Board renewal process.
In the year under review, no alternate directors were appointed. In keeping with the principle that a Director must be able to commit time to the affairs of the Manager, the Board will, generally, not approve the appointment of alternate directors.
28CAPITALAND RETAIL CHINA TRUST

The Board is able to undertake the functions of a nominating committee because:
(a) the Manager is a dedicated manager to CRCT and in general, REITs (including CRCT) have a more focused scope and scale of business compared to those of listed companies. For this reason, the Board’s capacity would not be unduly stretched if the responsibilities of a nominating committee were also undertaken by the Board as the Board would be able to give adequate attention to such issues;
(b) the focused scope of the business of CRCT also means a manageable competency requirement for the Board such that the Board is able to manage the duties of a nominating committee; and
(c) IDs form at least half of the Board and the Chairman is an ID, which demonstrates that the IDs play a substantive role, and assures the objectivity and independence of the decision making process concerning nomination. This also mitigates any concerns of conflict which can be managed by having the conflicted Directors abstain from the decision making process. Further, conflict situations are less likely to arise in matters of nomination.
The Board has adopted the following criteria and process for selecting, appointing and reappointing Directors and for reviewing the performance of Directors:
(a) The Board, on an annual basis, carries out a review of the Board composition as well as on each occasion when an existing ID gives notice of his or her intention to retire or resign. The review includes assessing the collective skills, knowledge and experience of Directors represented on the Board to determine whether the Board, as a whole, has the skills, knowledge and experience required to achieve the Manager’s objectives for CRCT. In carrying out this review, the Board considers the need for the Board composition to reflect balance in matters such as skills representation, tenure, experience, age spread and diversity (including gender diversity), taking into account benchmarking within the industry as appropriate.
(b) The Board reviews the suitability of any candidates put forward by any Director for appointment, having regard to the skills required and the skills represented on the Board and whether a candidate’s skills, knowledge and experience will complement the existing Board and whether he or she has sufficient time available to commit to his or her responsibilities as a director, and whether he or she is a fit and proper person for the office in accordance with the Guidelines on Fit and Proper Criteria issued by MAS (which require the candidate to be, among other things, competent, honest, to have integrity and be financially sound).
(c) External consultants may be engaged from time to time to access a wide base of potential directors.(d) No member of the Board is involved in any decision of the Board relating to his or her own appointment,
reappointment or assessment of independence.(e) A newly appointed Director receives a formal appointment letter and a copy of the Director’s Manual (which
includes information on a broad range of matters relating to the role and responsibilities of a director).(f) All Directors undergo an induction programme on appointment to help familiarise them with matters relating to
CRCT’s business and the Manager’s strategy for CRCT.(g) The performance of the Board, Board Committees and directors is reviewed annually.(h) The Board proactively addresses any issues identified in the board performance evaluation.
The adopted process takes into account the requirements in the Code that the composition of the Board, including the selection of candidates for new appointments to the Board as part of the Board’s renewal process, be determined using the following principles:
(a) the Board should comprise Directors with a broad range of commercial experience, including expertise in funds management, the property industry, banking, finance and legal fields; and
(b) at least one-third of the Board should comprise IDs. Where, among other things, the Chairman of the Board is not an ID, at least half of the Board should comprise IDs.
As at least half of the Board comprises IDs, the Manager will not be voluntarily subjecting any appointment or reappointment of directors to voting by Unitholders. The Chairman of the Board is presently an ID. The Board intends to continue to keep to the principle that at least half of the Board shall comprise IDs.
FIN
AN
CIA
LS & A
DD
ITIO
NA
L INFO
RM
AT
ION
P
OR
TFO
LIO D
ETA
ILS
BU
SINE
SS RE
VIE
W
SUSTA
INA
BILIT
Y
CO
RP
OR
AT
E G
OV
ER
NA
NC
E &
TR
AN
SP
AR
EN
CY
O
VE
RV
IEW
ANNUAL REPORT 2017
29

CORPORATE GOVERNANCEThe Board seeks to refresh Board membership progressively and in an orderly manner. In this regard, board succession planning is carried out through the annual review of Board composition as well as when an existing ID gives notice of his or her intention to retire or resign. On the issue of Board renewal, the Manager believes that Board renewal is a necessary and continual process, for good governance and ensuring that the Board has the skills, expertise and experience which are relevant to the evolving needs of CRCT’s business; renewal or replacement of a Director therefore does not necessarily reflect his or her performance or contributions to date.
Guideline 4.4 of the Code recommends that the Board determine the maximum number of listed company board appointments which any director may hold and disclose this in the annual report. In view of the responsibilities of a director, the Board is cognisant of the need for Directors to be able to devote sufficient time and attention to adequately perform their roles. However, the Board has not imposed any limit as it has taken the view that, the limit on the number of listed company directorships that an individual may hold should be considered on a case-by-case basis, as a person’s available time and attention may be affected by many different factors, such as whether he is in full-time employment and the nature of his or her other responsibilities. A Director with multiple directorships is expected to ensure that sufficient attention can be and is given to the affairs of the Manager in managing the assets and liabilities of CRCT for the benefit of Unitholders. The Board believes that each Director is best placed to determine and ensure that he is able to devote sufficient time and attention to discharge his or her duties and responsibilities as a director of the Manager, bearing in mind his or her other commitments. In considering the nomination of any individual for appointment, and in its annual review of each Director’s ability to commit time to the affairs of the Manager, the Board takes into account, among other things, the attendance record of the Directors at meetings of the Board and Board Committees, the competing time commitments faced by any such individual with multiple Board memberships as well as his or her other principal commitments. All Directors had confirmed that notwithstanding the number of their individual listed company board appointments and other principal commitments, which each of them held, they were able to devote sufficient time and attention to the affairs of the Manager in managing the assets and liabilities of CRCT for the benefit of Unitholders. The CEO, who is also a Director, is fully committed to the day-to-day operations of the Manager. The Board also notes that, as at the date of this Report, none of the IDs serves on more than three listed company boards. Taking into account also the attendance record of the Directors at meetings of the Board and Board Committees in FY 2017 (set out on page 46 of this Annual Report) and contributions to the Board’s deliberations as well as availability outside formal Board and Board Committee meetings, the Board is of the view that the current commitments of each of its Directors are reasonable and each of the Directors is able to and has been adequately carrying out his or her duties.
Board PerformancePrinciple 5:There should be a formal annual assessment of the effectiveness of the Board as a whole and its board committees and the contribution by each director to the effectiveness of the Board.
The Manager believes that oversight from a strong and effective board goes a long way towards guiding a business enterprise to achieving success.
The Board strives to ensure that there is an optimal blend in the Board of backgrounds, experience and knowledge in business and general management, expertise relevant to CRCT’s business and track record, and that each Director can bring to the Board an independent and objective perspective to enable balanced and well-considered decisions to be made in the interests of CRCT.
Whilst board performance is ultimately reflected in the long-term performance of CRCT, the Board believes that engaging in a regular process of self-assessment and evaluation of board performance in order to identify key strengths and areas for improvement is essential to effective stewardship and to attaining success for CRCT.
As part of the Manager’s commitment towards improving corporate governance, the Board has approved and implemented a process to evaluate the effectiveness of the Board as a whole and the Board Committees on an annual basis. As part of the process, questionnaires were sent to the Directors, and the results were aggregated and reported to the Chairman of the Board. The areas of evaluation covered in the survey questionnaire included Board composition, Board processes, strategy, performance and governance, access to information and Board Committee effectiveness. As part of the survey questionnaire, the Board also considers whether the creation of value for Unitholders
30CAPITALAND RETAIL CHINA TRUST

has been taken into account in the decision making process. The results of the survey were deliberated upon by the Board, and the necessary follow up action will be taken with a view to enhancing the effectiveness of the Board in the discharge of its duties and responsibilities. The outcome of the evaluation was satisfactory with positive ratings received for all the attributes in the evaluation categories.
The Board was also able to assess the Board Committees through their regular reports to the Board on their activities. In respect of individual Directors, their contributions can take different forms including providing objective perspectives on issues, facilitating business opportunities and strategic relationships, and accessibility to Management outside of the formal environment of Board and/or Board Committee meetings.
The Manager also believes that the collective Board performance and the contributions of individual Board members are also reflected in, and evidenced by, the synergistic performance of the Board in discharging its responsibilities as a whole by providing proper guidance, diligent oversight and able leadership, and lending support to Management in steering CRCT in the appropriate direction, as well as the long-term performance of CRCT whether under favourable or challenging market conditions.
Access to InformationPrinciple 6:In order to fulfil their responsibilities, directors should be provided with complete, adequate and timely information prior to board meetings and on an on going basis so as to enable them to make informed decisions to discharge their duties and responsibilities.
An effective and robust Board, whose members engage in open and constructive debate to develop and refine proposals on strategy, is fundamental to good corporate governance. In this regard, the Board must be kept well-informed of CRCT Group’s business and affairs and the industry in which CRCT Group operates. The Manager recognises the importance of providing the Board with relevant information on a timely basis prior to Board meetings and on an ongoing basis, to enable the Directors to make informed decisions to discharge their duties and responsibilities. Reports on CRCT’s performance are also provided to the Board on a regular basis.
The Board meets regularly and Board meetings, in general, last up to half a day. At each Board meeting, the CEO provides updates on CRCT’s business and operations, as well as financial performance. Presentations in relation to specific business areas are also made by key executives and external consultants or experts; this allows the Board to develop a good understanding of the progress of CRCT’s business and also promotes active engagement between the Board and the key executives of the Manager.
As a general rule, Board papers are sent to Board members at least five working days prior to each Board meeting, to allow members of the Board to prepare for the Board meetings and to enable discussions to focus on any questions that they may have.
In line with the Manager’s ongoing commitment to limit paper waste and reduce its carbon footprint, the Manager does not provide printed copies of Board papers. Instead, Directors are provided with tablet devices to enable them to access and read Board and Board Committee papers prior to and in meetings. This initiative also enhances information security as the papers are downloaded to the tablet devices through an encrypted channel.
In addition to providing complete, adequate and timely information to the Board on Board affairs and issues requiring the Board’s decision, Management also provides ongoing reports relating to the operational and financial performance of CRCT, such as monthly management reports.
Where appropriate, informal meetings are also held for Management to brief Directors on prospective transactions and potential developments in the early stages before formal Board approval is sought.
The Board has separate and independent access to Management, including the company secretary of the Manager (Company Secretary), at all times. The Company Secretary attends to corporate secretarial administration matters and is the corporate governance advisor on corporate matters to the Board and Management. The Company Secretary attends all Board meetings and assists the Chairman in ensuring that Board procedures are followed. The
FIN
AN
CIA
LS & A
DD
ITIO
NA
L INFO
RM
AT
ION
P
OR
TFO
LIO D
ETA
ILS
BU
SINE
SS RE
VIE
W
SUSTA
INA
BILIT
Y
CO
RP
OR
AT
E G
OV
ER
NA
NC
E &
TR
AN
SP
AR
EN
CY
O
VE
RV
IEW
ANNUAL REPORT 2017
31

CORPORATE GOVERNANCEappointment and the removal of the Company Secretary is subject to the Board’s approval. The Board, whether as an individual Director or as a group, is also entitled to have access to independent professional advice where required, with expenses borne by the Manager.
There were no meetings of the IDs without the presence of other Directors in FY 2017 because no Lead ID is required to be appointed.
The AC also meets the internal and external auditors separately at least once a year, without the presence of the CEO and Management. The Board has unfettered access to any Management staff for any information that it may require.
Through the training framework adopted for the professional development of the Directors, Directors also receive on a regular basis, reading materials on topical matters or subjects and regulatory updates and implications. Where appropriate, Management will also arrange for briefings by industry players or consultants.
(A) REMUNERATION MATTERS
Procedures for Developing Remuneration PoliciesPrinciple 7:There should be a formal and transparent procedure for developing policy on executive remuneration and for fixing the remuneration packages of individual directors. No director should be involved in deciding his own remuneration.
Level and Mix of RemunerationPrinciple 8:The level and structure of remuneration should be aligned with the long-term interest and risk policies of the company, and should be appropriate to attract, retain and motivate (a) the directors to provide good stewardship of the company, and (b) key management personnel to successfully manage the company. However, companies should avoid paying more than is necessary for this purpose.
Disclosure on RemunerationPrinciple 9:Every company should provide clear disclosure of its remuneration policies, level and mix of remuneration, and the procedure for setting remuneration, in the company’s Annual Report. It should provide disclosure in relation to its remuneration policies to enable investors to understand the link between remuneration paid to directors and key management personnel, and performance.
The Board is able to undertake the functions of a remuneration committee because:
(a) the Manager is a dedicated manager to only CRCT and in general, REITs (including CRCT) have a more focused scope and scale of business compared to those of listed companies. For this reason, the Board’s capacity would not be unduly stretched by reason of it undertaking the responsibilities of a remuneration committee and the Board would be able to give adequate attention to such issues relating to remuneration matters; and
(b) the IDs form at least half of the Board and the Chairman is an ID, which demonstrates that the IDs play a substantive role and assures the objectivity and independence of the decision making process concerning remuneration. This also mitigates any concerns of conflict which can be managed by having the conflicted directors abstain from the decision making process. Further, conflict situations are less likely to arise in matters of remuneration.
In undertaking this functions, the Board oversees the design and implementation of the remuneration policy and the specific remuneration packages for each Director and senior executives including the CEO. No member of the Board, however, will be involved in any decision of the Board relating to his or her own remuneration.
The Board sets the remuneration policies in line with CRCT Group’s business strategy and approves the executive compensation framework based on the key principle of linking pay to performance. The Board has access to independent remuneration consultants to advise as required.
32CAPITALAND RETAIL CHINA TRUST

In terms of the process adopted by the Manager for developing policies on remuneration and determining the remuneration packages for Directors and executive officers, the Manager, through an independent remuneration consultant, takes into account compensation benchmarks within the industry, as appropriate. It also considers the compensation framework of CL as a point of reference. The Manager is a subsidiary of CL which also holds a significant stake in CRCT. The association with the CL group puts the Manager in a better position to attract and retain better qualified management talent; it provides an intangible benefit to the Manager such that it allows its employees to associate themselves with an established corporate group which can offer them the depth and breadth of experience and enhanced career development opportunities. In FY 2017, an independent remuneration consultant, Mercer (Singapore) Pte Ltd (Mercer), was appointed to provide professional advice on Board and executive remuneration. Mercer is a global consulting leader in talent, health, retirement and investments with operations in more than 130 countries and employs more than 22,000 people globally. The consultant is not related to the Manager, its controlling shareholder, its related corporations or any of its Directors.
The principles governing the Manager’s key management personnel remuneration policy are as follows:
Business Alignment Focus on generating rental income and enhancing asset value over time so as to maximise returns from investments
and ultimately the distributions and total returns to Unitholders Provide sound, structured funding to ensure affordability and cost-effectiveness in line with performance goals Enhance retention of key talents to build strong organisational capabilities
Motivate Right Behaviour Pay for performance - align, differentiate and balance rewards according to multiple dimensions of performance Strengthen line-of-sight linking rewards and performance goals
Fair & Appropriate Ensure competitive remuneration relative to the appropriate external talent markets Manage internal equity such that remuneration systems are viewed as fair Significant and appropriate portion of pay-at-risk, taking into account risk policies of CRCT Group, symmetrical
with risk outcomes and sensitive to the risk time horizon
Effective Implementation Maintain rigorous corporate governance standards Exercise appropriate flexibility to meet strategic business needs and practical implementation considerations Facilitate employee understanding to maximise the value of the remuneration programmes
Remuneration for Key Management PersonnelRemuneration for key management personnel comprises fixed components, variable cash components, Unit-based components and employee benefits:
A. Fixed Components The fixed components comprise the base salary, fixed allowances and compulsory employer contribution to an
employee’s Central Provident Fund.
B. Variable Cash Components The variable cash components comprise the Balanced Scorecard Bonus Plan (BSBP) that is linked to the
achievement of annual performance targets for each key management personnel as agreed at the beginning of the financial year with the Board.
Under the Balanced Scorecard framework, CRCT Group’s strategy and goals are translated to performance outcomes comprising both qualitative and quantitative targets in the dimensions of Financial, Execution, Growth and People; these are cascaded down throughout the organisation, thereby creating alignment across the CRCT Group.
FIN
AN
CIA
LS & A
DD
ITIO
NA
L INFO
RM
AT
ION
P
OR
TFO
LIO D
ETA
ILS
BU
SINE
SS RE
VIE
W
SUSTA
INA
BILIT
Y
CO
RP
OR
AT
E G
OV
ER
NA
NC
E &
TR
AN
SP
AR
EN
CY
O
VE
RV
IEW
ANNUAL REPORT 2017
33

CORPORATE GOVERNANCE
After the close of each year, the Board reviews CRCT Group’s achievements against the targets set in the Balanced Scorecard, determines the overall performance taking into consideration qualitative factors such as the business environment, regulatory landscape and industry trends and approves a bonus pool that is commensurate with the performance achieved.
In determining the payout quantum for each key management personnel under the plan, the Board considers the overall business performance and individual performance as well as affordability.
C. Unit-based Components Unit awards were granted in FY 2017 pursuant to the CapitaLand Retail China Trust Management Limited
Performance Unit Plan (PUP) and CapitaLand Retail China Trust Management Limited Restricted Unit Plan (RUP) (together, the Unit Plans), approved by the Board.
The obligation to deliver the Units is expected to be satisfied out of the Units held by the Manager.
CapitaLand Retail China Trust Management Limited Performance Unit Plan In FY 2017, the Board granted awards which are conditional on targets set for a performance period, currently prescribed to be a three-year performance period. A specified number of Units will only be released to the recipient at the end of the qualifying performance period, provided that minimally the threshold targets are achieved. An initial number of Units (baseline award) is allocated according to the Relative Total Unitholder Return (TUR) of CRCT Group measured as a percentile ranking of CRCT Group’s TUR against the REITs in the FTSE ST REIT Index.
The above performance measure has been selected as a key measure of wealth creation for Unitholders. The final number of Units to be released will depend on the achievement of pre-determined targets over the three-year qualifying performance period. No Units will be released if the threshold targets are not met at the end of the qualifying performance period. On the other hand, if superior targets are met, more Units than the baseline award can be released up to a maximum of 200% of the baseline award. Recipients will receive fully paid Units at no cost.
In respect of the Unit awards granted in FY 2016 and FY 2017, the respective qualifying periods have not ended as at the date of this Report.
CapitaLand Retail China Trust Management Limited Restricted Unit Plan In FY 2017, the Board granted awards which are conditional on targets set for a qualifying period, currently prescribed to be a one-year performance period. A specific number of Units will only be released to the recipients at the end of the qualifying performance period, provided that minimally the threshold targets are achieved. An initial number of Units (baseline award) is allocated according to the following performance conditions:
Net property income of CRCT Group Distribution per Unit of CRCT Group
The above performance measures have been selected as they are the key drivers of business performance and are aligned to unitholder value. The final number of Units to be released will depend on the achievement of pre-determined targets at the end of the one-year qualifying performance period and the release will be over a vesting period of three years. No Units will be released if the threshold targets are not met at the end of the qualifying performance period. On the other hand, if superior targets are met, more Units than the baseline award can be delivered up to a maximum of 150% of the baseline award. Recipients can receive fully paid Units, their equivalent cash value or combinations thereof, at no cost.
34CAPITALAND RETAIL CHINA TRUST

In respect of the award granted in FY 2017, based on the Board’s assessment that the performance achieved by the CRCT Group has met the pre-determined performance targets for the qualifying performance period of FY 2017, the resulting number of units released has been adjusted accordingly to reflect the performance level.
To further promote alignment of Management’s interests with that of Unitholders, the Board has approved unit ownership guidelines for senior management to instill stronger identification by senior executives with the longer term performance and growth of CRCT Group. Under these guidelines, senior management participants are required to retain a prescribed proportion of CRCT’s units received under the Unit Plans.
D. Employee Benefits The benefits provided are comparable with local market practices.
The remuneration for the CEO in bands of S$250,000, and a breakdown of the remuneration of the CEO and all of the key management personnel of the Manager in percentage terms, are provided in the Key Management Personnel’s Remuneration Table on page 46 of this Annual Report.
At present, there are only three key management personnel of the Manager (including the CEO). The Manager outsources various other services to a wholly owned subsidiary of CL (CL Subsidiary). CL Subsidiary provides the services through its employees (Outsourced Personnel). This arrangement is put in place so as to provide flexibility and maximise efficiency in resource management to match the needs of CRCT from time to time, as well as to leverage on economies of scale and tap on the management talent of an established corporate group which can offer enhanced depth and breadth of experience. However, notwithstanding the outsourcing arrangement, the responsibility for due diligence, oversight and accountability continues to reside with the Board and Management. In this regard, the remuneration of such Outsourced Personnel, being employees of CL Subsidiary, is not included as part of the disclosure of remuneration of key management personnel of the Manager in this Report.
The Manager has decided (a) to disclose the CEO’s remuneration in bands of S$250,000 (instead of on a quantum basis), and (b) not to disclose the remuneration of the other key management personnel of the Manager (whether in bands of S$250,000 or otherwise). In arriving at its decision, it took into account the commercial sensitivity and confidential nature of remuneration matters. The Manager is of the view that disclosure in such manner is not prejudicial to the interests of Unitholders as the indicative range for the CEO’s remuneration, as well as the total remuneration for the CEO and other key management personnel of the Manager, is made known to Unitholders, and sufficient information is provided on the Manager’s remuneration framework to enable Unitholders to understand the link between CRCT’s performance and the remuneration of the CEO and other key management personnel. In addition, the remuneration of the CEO and other key management personnel of the Manager is paid out of the fees (the quantum and basis of which have been disclosed) that the Manager receives, rather than borne by CRCT.
The Board seeks to ensure that the remuneration paid to the CEO and key management personnel of the Manager are strongly linked to the achievement of business and individual performance targets. The performance targets approved by the Board are set at realistic yet stretched levels each year to motivate a high degree of business performance with emphasis on both short- and longer-term quantifiable objectives.
In FY 2017, there were no termination, retirement or post-employment benefits granted to Directors, the CEO and key management personnel of the Manager. There was also no special retirement plan, ‘golden parachute’ or special severance package for any of the key management personnel of the Manager.
There were no employees of the Manager who were immediate family members of a Director or the CEO in FY 2017. “Immediate family member” refers to the spouse, child, adopted child, step-child, sibling or parent of the individual.
FIN
AN
CIA
LS & A
DD
ITIO
NA
L INFO
RM
AT
ION
P
OR
TFO
LIO D
ETA
ILS
BU
SINE
SS RE
VIE
W
SUSTA
INA
BILIT
Y
CO
RP
OR
AT
E G
OV
ER
NA
NC
E &
TR
AN
SP
AR
EN
CY
O
VE
RV
IEW
ANNUAL REPORT 2017
35
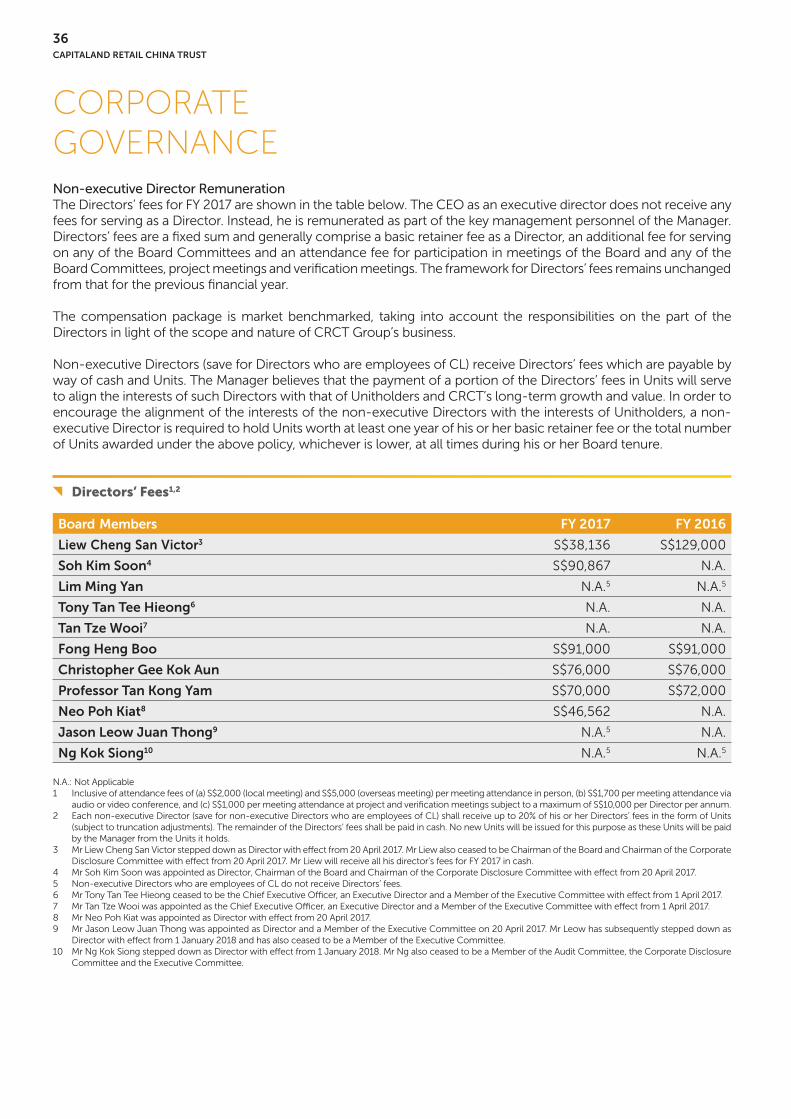
CORPORATE GOVERNANCENon-executive Director RemunerationThe Directors’ fees for FY 2017 are shown in the table below. The CEO as an executive director does not receive any fees for serving as a Director. Instead, he is remunerated as part of the key management personnel of the Manager. Directors’ fees are a fixed sum and generally comprise a basic retainer fee as a Director, an additional fee for serving on any of the Board Committees and an attendance fee for participation in meetings of the Board and any of the Board Committees, project meetings and verification meetings. The framework for Directors’ fees remains unchanged from that for the previous financial year.
The compensation package is market benchmarked, taking into account the responsibilities on the part of the Directors in light of the scope and nature of CRCT Group’s business.
Non-executive Directors (save for Directors who are employees of CL) receive Directors’ fees which are payable by way of cash and Units. The Manager believes that the payment of a portion of the Directors’ fees in Units will serve to align the interests of such Directors with that of Unitholders and CRCT’s long-term growth and value. In order to encourage the alignment of the interests of the non-executive Directors with the interests of Unitholders, a non-executive Director is required to hold Units worth at least one year of his or her basic retainer fee or the total number of Units awarded under the above policy, whichever is lower, at all times during his or her Board tenure.
Directors’ Fees1,2
Board Members FY 2017 FY 2016
Liew Cheng San Victor3 S$38,136 S$129,000
Soh Kim Soon4 S$90,867 N.A.
Lim Ming Yan N.A.5 N.A.5
Tony Tan Tee Hieong6 N.A. N.A.
Tan Tze Wooi7 N.A. N.A.
Fong Heng Boo S$91,000 S$91,000
Christopher Gee Kok Aun S$76,000 S$76,000
Professor Tan Kong Yam S$70,000 S$72,000
Neo Poh Kiat8 S$46,562 N.A.
Jason Leow Juan Thong9 N.A.5 N.A.
Ng Kok Siong10 N.A.5 N.A.5
N.A.: Not Applicable1 Inclusive of attendance fees of (a) S$2,000 (local meeting) and S$5,000 (overseas meeting) per meeting attendance in person, (b) S$1,700 per meeting attendance via
audio or video conference, and (c) S$1,000 per meeting attendance at project and verification meetings subject to a maximum of S$10,000 per Director per annum.2 Each non-executive Director (save for non-executive Directors who are employees of CL) shall receive up to 20% of his or her Directors’ fees in the form of Units
(subject to truncation adjustments). The remainder of the Directors’ fees shall be paid in cash. No new Units will be issued for this purpose as these Units will be paid by the Manager from the Units it holds.
3 Mr Liew Cheng San Victor stepped down as Director with effect from 20 April 2017. Mr Liew also ceased to be Chairman of the Board and Chairman of the Corporate Disclosure Committee with effect from 20 April 2017. Mr Liew will receive all his director’s fees for FY 2017 in cash.
4 Mr Soh Kim Soon was appointed as Director, Chairman of the Board and Chairman of the Corporate Disclosure Committee with effect from 20 April 2017.5 Non-executive Directors who are employees of CL do not receive Directors’ fees.6 Mr Tony Tan Tee Hieong ceased to be the Chief Executive Officer, an Executive Director and a Member of the Executive Committee with effect from 1 April 2017. 7 Mr Tan Tze Wooi was appointed as the Chief Executive Officer, an Executive Director and a Member of the Executive Committee with effect from 1 April 2017.8 Mr Neo Poh Kiat was appointed as Director with effect from 20 April 2017.9 Mr Jason Leow Juan Thong was appointed as Director and a Member of the Executive Committee on 20 April 2017. Mr Leow has subsequently stepped down as
Director with effect from 1 January 2018 and has also ceased to be a Member of the Executive Committee.10 Mr Ng Kok Siong stepped down as Director with effect from 1 January 2018. Mr Ng also ceased to be a Member of the Audit Committee, the Corporate Disclosure
Committee and the Executive Committee.
36CAPITALAND RETAIL CHINA TRUST

(C) ACCOUNTABILITY AND AUDIT
AccountabilityPrinciple 10:The Board should present a balanced and understandable assessment of the company’s performance, position and prospects.
The Manager provides Unitholders with quarterly and annual financial statements within the relevant periods prescribed by the Listing Manual after they are reviewed by the AC and approved by the Board. These financial statements are accompanied by news releases issued to the media and which are also posted on the SGXNet. In presenting the quarterly and annual financial statements to Unitholders, the Board aims to provide Unitholders with a balanced, clear and understandable assessment of CRCT’s performance, position and prospects. In order to achieve this, Management provides the Board with management accounts on a monthly basis and such explanation and information as any Director may require, to enable the Directors to keep abreast, and make a balanced and informed assessment, of CRCT’s financial performance, position and prospects.
In addition, the Manager also keeps the Unitholders, stakeholders and analysts informed of the performance and changes in CRCT or its business which would be likely to materially affect the price or value of the Units on a timely and consistent basis, so as to assist Unitholders and investors in their investment decisions.
The Manager believes in conducting itself in ways that seek to deliver maximum sustainable value to Unitholders. Best practices are promoted as a means to build an excellent business for Unitholders and the Manager is accountable to Unitholders for CRCT’s performance. Prompt fulfilment of statutory and regulatory reporting requirements is but one way to maintain Unitholders’ confidence and trust in the capability and integrity of the Manager.
Risk Management and Internal ControlsPrinciple 11:The Board is responsible for the governance of risk. The Board should ensure that Management maintains a sound system of risk management and internal controls to safeguard shareholders’ interests and the company’s assets, and should determine the nature and extent of the significant risks which the Board is willing to take in achieving its strategic objectives.
The Manager has in place an adequate and effective system of risk management and internal controls addressing material financial, operational, compliance and information technology (IT) risks to safeguard Unitholders’ interests and CRCT’s assets.
The Board has overall responsibility for the governance of risk and oversees the Manager in the design, implementation and monitoring of the risk management and internal controls systems. The AC assists the Board in carrying out the Board’s responsibility of overseeing the risk management framework and policies for CRCT Group.
Under its terms of reference, the AC’s scope of duties and responsibilities is as follows:
(a) makes recommendations to the Board on Risk Appetite Statement (RAS) for CRCT Group;(b) assesses the adequacy and effectiveness of the risk management and internal controls systems established by the
Manager to manage risks;(c) oversees Management in the formulation, updating and maintenance of an adequate and effective risk management
framework, policies and strategies for managing risks that are consistent with CRCT Group’s risk appetite and reports to the Board on its decisions on any material matters concerning the aforementioned;
(d) makes the necessary recommendations to the Board such that an opinion relating to the adequacy and effectiveness of the risk management and internal controls systems can be made by the Board in the annual report of CRCT in accordance with the Listing Manual and the Code; and
(e) considers and advises on risk matters referred to it by Management or the Board including reviewing and reporting to the Board on any material breaches of the RAS, any material non-compliance with the approved framework and policies and the adequacy of any proposed action.
FIN
AN
CIA
LS & A
DD
ITIO
NA
L INFO
RM
AT
ION
P
OR
TFO
LIO D
ETA
ILS
BU
SINE
SS RE
VIE
W
SUSTA
INA
BILIT
Y
CO
RP
OR
AT
E G
OV
ER
NA
NC
E &
TR
AN
SP
AR
EN
CY
O
VE
RV
IEW
ANNUAL REPORT 2017
37
CORPORATE GOVERNANCEThe Manager adopts an Enterprise Risk Management (ERM) Framework which sets out the required environmental and organisational components for managing risk in an integrated, systematic and consistent manner. The ERM Framework and related policies are reviewed annually.
The Manager consistently seeks to improve and strengthen its ERM Framework. As part of the ERM Framework, the Manager, among other things, undertakes and performs a Risk and Control Self-Assessment (RCSA) annually. As a result of the RCSA, the Manager produces and maintains a risk register which identifies the material risks the CRCT Group faces and the corresponding internal controls it has in place to mitigate those risks. The material risks are reviewed annually by the AC and the Board. The AC also reviews the approach of identifying and assessing risks and internal controls in the risk register. The system of risk management and internal controls is reviewed and, where appropriate, refined regularly by the Manager, the AC and the Board. Where relevant, reference is made to the best practices and guidance in the Risk Governance Guidance for Listed Boards issued by the Corporate Governance Council.
The Manager has established an approach on how risk appetite is defined, monitored and reviewed for CRCT Group. Approved by the Board, CRCT Group’s RAS addresses the management of material risks faced by CRCT Group. Alignment of CRCT Group’s risk profile to the RAS is achieved through various communication and monitoring mechanisms put in place across the various functions within the Manager.
More information on the Manager’s ERM Framework can be found in the Enterprise Risk Management section on pages 47 to 49 of this Annual Report.
The internal and external auditors conduct reviews that involve testing the effectiveness of the material internal controls addressing financial, operational, compliance and IT risks. This includes testing, where practicable, material internal controls in areas managed by external service providers. Any material non-compliance or lapses in internal controls together with corrective measures recommended by the internal and external auditors are reported to and reviewed by the AC. The adequacy and effectiveness of the measures taken by the Manager in response to the recommendations made by the internal and external auditors are also reviewed by the AC.
The Board has received assurance from the CEO and the Head, Finance of the Manager that:
(a) the financial records of CRCT Group have been properly maintained and the financial statements for FY 2017 give a true and fair view of CRCT Group’s operations and finances; and
(b) the system of risk management and internal controls in place for CRCT Group is adequate and effective to address the financial, operational, compliance and IT risks which the Manager considers relevant and material to the current business environment.
The CEO and the Head, Finance of the Manager have obtained similar assurance from the respective risk and control owners.
In addition, in FY 2017, the Board has received quarterly certification by Management on the integrity of financial reporting and the Board has provided a negative assurance confirmation to Unitholders as required by the Listing Manual.
Based on the ERM Framework established and the reviews conducted by Management and both the internal and external auditors, as well as the assurance from the CEO and the Head, Finance of the Manager, the Board concurs with the recommendation of the AC and is of the opinion, that CRCT Group’s system of risk management and internal controls is adequate and effective to address the financial, operational, compliance and IT risks which the Manager considers relevant and material to the current business environment as at 31 December 2017.
The Board notes that the system of risk management and internal controls established by the Manager provides reasonable assurance that CRCT Group, as it strives to achieve its business objectives, will not be significantly affected by any event that can be reasonably foreseen or anticipated. However, the Board also notes that no system of risk management and internal controls can provide absolute assurance in this regard, or absolute assurance against poor judgement in decision making, human error, losses, fraud or other irregularities.
38CAPITALAND RETAIL CHINA TRUST

Audit CommitteePrinciple 12:The Board should establish an Audit Committee with written terms of reference which clearly set out its authority and duties.
At present, the AC comprises four non-executive Directors, the majority of whom (including the Chairman of the AC) are IDs. The members bring with them invaluable recent and relevant managerial and professional expertise in accounting and related financial management domains. None of the AC members was previously a partner of the incumbent external auditors, KPMG LLP (KPMG), within the previous 12 months, nor does any of the AC members hold any financial interest in KPMG.
The AC has explicit authority to investigate any matter within its terms of reference. Management is required to provide the fullest co-operation in providing information and resources, and in implementing or carrying out all requests made by the AC. The AC has direct access to the internal and external auditors and full discretion to invite any Director or executive officer to attend its meetings. Similarly, both the internal and external auditors are given unrestricted access to the AC.
Under its terms of reference, the AC’s scope of duties and responsibilities is as follows:
(a) reviews the significant financial reporting issues and judgements so as to ensure the integrity of the financial statements of CRCT Group, and any announcements relating to CRCT Group’s financial performance;
(b) reviews and reports to the Board at least annually the adequacy and effectiveness of the Manager’s internal controls, including financial, operational, compliance and IT controls, and risk management systems;
(c) reviews the adequacy and effectiveness of the Manager’s internal audit and compliance functions;(d) reviews the scope and results of the external audit and independence and objectivity of the external auditors;(e) makes recommendations to the Board on the proposals to Unitholders on the appointment, reappointment and
removal of the external auditors, and approving the remuneration of the external auditors;(f) reviews and approves processes to regulate transactions involving an Interested Person (as defined in Chapter 9
of the Listing Manual) and/or Interested Party (as defined in the Property Funds Appendix) (each, an Interested Person) and CRCT and/or its subsidiaries (Interested Person Transactions), to ensure compliance with the applicable regulations. The regulations include the requirement that Interested Person Transactions are on normal commercial terms and are not prejudicial to the interests of CRCT and its minority Unitholders. In respect of any property management agreement which is an Interested Person Transaction, the AC also carries out reviews at appropriate intervals to satisfy itself that the Manager has reviewed the Property Managers’ compliance with the terms of the property management agreement and has taken remedial actions where necessary; and
(g) reviews the whistle-blowing policy and arrangements by which employees of the Manager and any other persons may, in confidence, report suspected fraud or irregularity or suspected infringement of any laws or regulations or rules, or raise concerns about possible improprieties in matters of financial reporting or other matters with a view to ensuring that arrangements are in place for such concerns to be raised and independently investigated, and for appropriate follow-up action to be taken.
The AC has reviewed the nature and extent of non-audit services provided by the external auditors in FY 2017 and the fees paid for such services. The AC is satisfied that the independence of the external auditors has not been impaired by the provision of those services. The external auditors have also provided confirmation of their independence to the AC. The aggregate amount of fees paid and payable to the external auditors for FY 2017 was S$463,000, of which audit and audit-related fees amounted to S$453,000 and non-audit fees amounted to S$10,000.
In FY 2017, the AC also met with the internal and external auditors, without Management’s presence, to discuss the reasonableness of the financial reporting process, the system of internal controls, and the significant comments and recommendations by the auditors. Where relevant, the AC makes reference to best practices and guidance for Audit Committees in Singapore including practice directions issued from time to time in relation to the Financial Reporting Surveillance Programme administered by the Accounting and Corporate Regulatory Authority of Singapore.
FIN
AN
CIA
LS & A
DD
ITIO
NA
L INFO
RM
AT
ION
P
OR
TFO
LIO D
ETA
ILS
BU
SINE
SS RE
VIE
W
SUSTA
INA
BILIT
Y
CO
RP
OR
AT
E G
OV
ER
NA
NC
E &
TR
AN
SP
AR
EN
CY
O
VE
RV
IEW
ANNUAL REPORT 2017
39

CORPORATE GOVERNANCEIn its review of the financial statements of CRCT Group for FY 2017, the AC had discussed with Management the accounting principles that were applied and their judgement of items that might affect the integrity of the financial statements and also considered the clarity of key disclosures in the financial statements. The AC reviewed, among other matters, the following key audit matters as reported by the external auditors for the financial year ended 31 December 2017.
Key audit matter How these issues were addressed by AC
Valuation of investment properties
The AC reviewed the outcomes of the half-yearly valuation process and discussed the details of the valuation with Management, focusing on properties which registered higher fair value gains/losses during the period under review.
The AC considered the findings of the external auditors, including their assessment of the appropriateness of valuation methodologies and the underlying key assumptions applied in the valuation of investment properties.
The AC was satisfied with the valuation process, the methodologies used and the valuation for investment properties as adopted and disclosed in the financial statements.
Changes to the accounting standards and accounting issues which have a direct impact on the financial statements were reported to and discussed with the AC at its meetings.
The Manager confirms, on behalf of CRCT, that CRCT complies with Rule 712 and 715 of the Listing Manual.
Internal AuditPrinciple 13:The company should establish an effective internal audit function that is adequately resourced and independent of the activities it audits.
The Manager has in place an internal audit function supported by CL’s Internal Audit Department (CL IA) which reports directly to the AC and administratively to the CEO. The AC is of the view that the internal audit function performed by CL IA is adequately resourced and has appropriate standing within CRCT Group. CL IA plans its internal audit schedules in consultation with, but independently of, Management and its plan is submitted to the AC for approval prior to the beginning of each year. The AC also meets with CL IA at least once a year without the presence of Management. CL IA has unfettered access to the Manager’s documents, records, properties and employees, including access to the AC.
CL IA is a corporate member of the Singapore branch of the Institute of Internal Auditors Inc. (IIA), which has its headquarters in the United States of America (USA). CL IA subscribes to, and is guided by, the International Standards for the Professional Practice of Internal Auditing (Standards) developed by the IIA, and has incorporated these Standards into its audit practices. With respect to FY 2017, the AC has reviewed and is satisfied as to the adequacy and effectiveness of the IA function.
To ensure that internal audits are performed by competent professionals, CL IA recruits and employs suitably qualified professional staff with the requisite skill sets and experience. For instance, CL IA staff who are involved in IT audits are Certified Information System Auditors and members of the Information System Audit and Control Association (ISACA) in the USA. The ISACA Information System Auditing Standards provide guidance on the standards and procedures to be applied in IT audits.
CL IA identifies and provides training and development opportunities for its staff to ensure that their technical knowledge and skill sets remain current and relevant.
(D) SHAREHOLDER RIGHTS AND RESPONSIBILITIES
Shareholder RightsPrinciple 14:Companies should treat all shareholders fairly and equitably, and should recognise, protect and facilitate the exercise of shareholders’ rights, and continually review and update such governance arrangements.
40CAPITALAND RETAIL CHINA TRUST
The Manager is committed to treating all Unitholders fairly and equitably. All Unitholders enjoy specific rights under the Trust Deed and the relevant laws and regulations. These rights include, among other things, the right to participate in profit distributions. They are also entitled to attend general meetings and are accorded the opportunity to participate effectively and vote at general meetings (including through appointment of up to two proxies, if they are unable to attend in person or in the case of a corporate Unitholder, through its appointed representative). Unitholders such as nominee companies which provide custodial services for securities are not constrained by the two proxy limitation, and are able to appoint more than two proxies to attend, speak and vote at general meetings of CRCT.
More information on Unitholder participation in general meetings can be found in the section on Principle 16: Conduct of Shareholder Meetings of this Report.
Communication with ShareholdersPrinciple 15:Companies should actively engage their shareholders and put in place an investor relations policy to promote regular, effective and fair communication with shareholders.
The Manager is committed to keeping all Unitholders and other stakeholders and analysts informed of the performance and changes in CRCT or its business which would be likely to materially affect the price or value of the Units, on a timely and consistent basis, so as to assist Unitholders and investors in their investment decisions.
The Manager has in place an Investor Relations and Group Communications team which facilitates effective communication with Unitholders, analysts, fund managers and the media.
The Manager actively engages with Unitholders and has put in place a Unitholders’ Communication and Investor Relations Policy (Policy) to promote regular, effective and fair communications with Unitholders. The Policy is available on CRCT’s website at www.crct.com.sg.
The Board has established the CDC which assists the Board in the discharge of its function to meet the obligations arising under the laws and regulations of Singapore relating to and to conform to best practices in the corporate disclosure and compliance process. The views and approvals of the CDC were sought throughout the year through emails on various announcements and news releases.
More information on the Manager’s investor and media relations with Unitholders can be found in the Investor & Media Relations section on pages 50 to 51 of this Annual Report and the Policy, which is available on CRCT’s website.
CRCT’s distribution policy is to distribute at least 90.0% of its taxable income (other than gains from the sale of real estate properties by CRCT which are determined to be trading gains), with the actual level of distribution to be determined at the Manager’s discretion. Distributions are generally paid within 35 market days after the relevant book closure date.
Conduct of Shareholder MeetingsPrinciple 16:Companies should encourage greater shareholder participation at general meetings of shareholders, and allow shareholders the opportunity to communicate their views on various matters affecting the company.
The Manager supports the principle of encouraging Unitholders’ participation and voting at general meetings. Unitholders receive a CD-ROM containing the CRCT annual report (printed copies are available upon request) and notice of the general meeting. Notices of the general meetings are also advertised in the press and issued on SGXNet. The requisite notice period for a general meeting is adhered to. All Unitholders are given the opportunity to participate effectively in and vote at general meetings.
At general meetings, Unitholders are encouraged to communicate their views and discuss with the Board and Management matters affecting CRCT. Representatives of the Trustee, Directors (including the chairpersons of the Board and the AC), the Manager’s senior management and the external auditors of CRCT, would usually be present at general meetings to address any queries from Unitholders. All the Directors attended the last general meeting. A record of the Directors’ attendance at the general meeting can be found in the records of their attendance at meetings set out at page 46 of this Annual Report.
FIN
AN
CIA
LS & A
DD
ITIO
NA
L INFO
RM
AT
ION
P
OR
TFO
LIO D
ETA
ILS
BU
SINE
SS RE
VIE
W
SUSTA
INA
BILIT
Y
CO
RP
OR
AT
E G
OV
ER
NA
NC
E &
TR
AN
SP
AR
EN
CY
O
VE
RV
IEW
ANNUAL REPORT 2017
41

CORPORATE GOVERNANCETo safeguard Unitholders’ interests and rights, a separate resolution is proposed for each substantially separate issue at general meetings. To ensure transparency in the voting process and better reflect Unitholders’ interests, the Manager conducts electronic poll voting for all the resolutions proposed at the general meetings. Voting procedures are explained and vote tabulations are disclosed at the general meetings. An independent scrutineer is also appointed to validate the vote tabulation procedures. Votes cast, for or against and the respective percentages, on each resolution are tallied and displayed ‘live’ on-screen to Unitholders immediately at the general meetings. The total number of votes cast for or against the resolutions and the respective percentages are also announced on SGXNet after the general meetings. Voting in absentia and by email, which are currently not permitted may only be possible following careful study to ensure that the integrity of information and authentication of the identity of Unitholders through the web are not compromised, and legislative changes are effected to recognise remote voting.
Minutes of the general meetings, recording the substantial and relevant comments made and questions raised by Unitholders are prepared and are available to Unitholders for their inspection upon request. Minutes of the annual general meetings are also available on CRCT’s website at www.crct.com.sg.
Unitholders also have the opportunity to communicate their views and discuss with the Board and Management matters affecting CRCT after the general meetings.
(E) ADDITIONAL INFORMATION
Executive Committee
Apart from the AC and CDC, the Board has also established an EC.
The EC oversees the day-to-day activities of the Manager and that of CRCT, on behalf of the Board. The EC is guided by its terms of reference. In particular, the EC:
(a) approves specific budgets for capital expenditure on development projects, acquisitions and enhancements/upgrading of properties within its approved financial limits;
(b) reviews management reports and operating budgets; and(c) awards contracts for development projects.
The members of the EC also meet informally during the course of the year.
Dealings with Interested PersonsReview Procedures for Interested Person Transactions
The Manager has established internal control procedures to ensure that all Interested Person Transactions are undertaken on an arm’s length basis and on normal commercial terms, which are generally no more favourable than those extended to unrelated third parties, and are not prejudicial to the interests of CRCT and Unitholders. In respect of such transactions, the Manager would have to demonstrate to the AC that such transactions are undertaken on normal commercial terms and are not prejudicial to the interests of CRCT and Unitholders which may include obtaining (where practicable) third party quotations or obtaining valuations from independent valuers (in accordance with applicable provisions of the Listing Manual and the Property Funds Appendix). The internal control procedures also ensure compliance with Chapter 9 of the Listing Manual and the Property Funds Appendix.
In particular, the procedures in place include the following:
Interested Person Transactions1
Approving Authority,
Procedures and Disclosure
Below S$100,000 per transaction Trustee
S$100,000 and above per transaction (which singly, or when aggregated with other transactions2 with the same Interested Person in the same financial year is less than 3.0% of CRCT’s latest audited net tangible assets/net asset value)
Trustee Audit Committee
42CAPITALAND RETAIL CHINA TRUST

Interested Person Transactions1
Approving Authority,
Procedures and Disclosure
Transaction2 which:(a) is equal to or exceeds 3.0% of CRCT’s latest audited net tangible
assets/net asset value; or(b) when aggregated with other transactions2 with the same Interested
Person in the same financial year is equal to or exceeds 3.0% of CRCT’s latest audited net tangible assets/net asset value)
Trustee Audit Committee Immediate announcement
Transaction2 which:(a) is equal to or exceeds 5.0% of CRCT’s latest audited net tangible
assets/net asset value; or(b) when aggregated with other transactions2,3 with the same Interested
Person in the same financial year is equal to or exceeds 5.0% of CRCT’s latest audited net tangible assets/net asset value
Trustee Audit Committee Immediate announcement Unitholders3
1 This table does not include the procedures applicable to Interested Person Transactions falling under the exceptions set out in Rules 915 and 916 of the Listing Manual.
2 Any transaction of less than S$100,000 in value is disregarded.3 In relation to approval by Unitholders for transactions that are equal to or exceed 5.0% of CRCT’s latest audited net tangible assets/net asset value (whether singly
or aggregated), any transaction which has been approved by Unitholders, or is the subject of aggregation with another transaction that has been approved by Unitholders, need not be included in any subsequent aggregation.
Role of the Audit Committee for Interested Person TransactionsThe Manager’s internal control procedures are intended to ensure that Interested Person Transactions are conducted at arm’s length and on normal commercial terms, and are not prejudicial to CRCT and Unitholders’ interests.
The Manager maintains a register to record all Interested Person Transactions which are entered into by CRCT (and the basis on which they are entered into, including the quotations obtained to support such basis). All Interested Person Transactions are subject to regular periodic reviews by the AC, which in turn obtains advice from CL IA, to ascertain that the guidelines and procedures established to monitor Interested Person Transactions, including the relevant provisions of the Listing Manual and the Property Funds Appendix, as well as any other guidelines which may from time to time be prescribed by the SGX-ST, MAS or other relevant authorities, have been complied with. The review includes an examination of the nature of the transaction and its supporting documents or such other information deemed necessary by the AC. If a member of the AC has an interest in a transaction, he is to abstain from participating in the review and approval process in relation to that transaction. In addition, the Trustee also reviews such audit reports to ascertain that the Listing Manual and the Property Funds Appendix have been complied with.
Details of all Interested Person Transactions (equal to or exceeding S$100,000 each in value) entered into by CRCT in FY 2017 are disclosed on page 161 of this Annual Report.
Dealing with Conflicts of InterestThe following principles and procedures have been established to deal with potential conflicts of interest which the Manager (including its Directors, executive officers and employees) may encounter in managing CRCT:
(a) the Manager is a dedicated manager for CRCT and will not manage any other REIT or be involved in any other real property business;
(b) all resolutions at meetings of the Board in relation to matters concerning CRCT must be decided by a majority vote of the Directors, including at least one ID;
(c) in respect of matters in which CL and/or its subsidiaries have an interest, whether direct or indirect, any nominees appointed by CL and/or its subsidiaries to the Board will abstain from voting. In such matters, the quorum must comprise a majority of IDs and shall exclude such nominee Directors of CL and/or its subsidiaries;
(d) in respect of matters in which a Director or his or her associates have an interest, whether direct or indirect, such interested Director will abstain from voting. In such matters, the quorum must comprise a majority of the Directors and shall exclude such interested Director(s);
FIN
AN
CIA
LS & A
DD
ITIO
NA
L INFO
RM
AT
ION
P
OR
TFO
LIO D
ETA
ILS
BU
SINE
SS RE
VIE
W
SUSTA
INA
BILIT
Y
CO
RP
OR
AT
E G
OV
ER
NA
NC
E &
TR
AN
SP
AR
EN
CY
O
VE
RV
IEW
ANNUAL REPORT 2017
43

CORPORATE GOVERNANCE(e) if the Manager is required to decide whether or not to take any action against any person in relation to any breach of
any agreement entered into by the Trustee for and on behalf of CRCT with an affiliate of the Manager, the Manager is obliged to consult with a reputable law firm (acceptable to the Trustee) which shall provide legal advice on the matter. If the said law firm is of the opinion that the Trustee, on behalf of CRCT, has a prima facie case against the party allegedly in breach under such agreement, the Manager is obliged to pursue the appropriate remedies under such agreement; and
(f) at least one-third of the Board shall comprise IDs.
In respect of voting rights where the Manager would face a conflict between its own interests and that of Unitholders, the Manager shall cause such voting rights to be exercised according to the discretion of the Trustee.
Dealings in SecuritiesThe Manager has devised and adopted a securities dealing policy for the Manager’s officers and employees which applies the best practice recommendations in the Listing Manual. To this end, the Manager has issued guidelines to its Directors and employees as well as certain relevant executives of the CL group, which set out prohibitions against dealings in CRCT Group’s securities (i) while in possession of material unpublished price sensitive information, (ii) during the two weeks immediately preceding, and up to the time of the announcement of, CRCT’s financial statements for each of the first three quarters of CRCT’s financial year, and (iii) during the one month immediately preceding, and up to the time of the announcement of, CRCT’s financial statements for the full financial year. Prior to the commencement of each relevant period, an email would be sent out to all Directors and employees of the Manager as well as certain relevant executives of the CL group to inform them of the duration of the period. The Manager will also not deal in CRCT Group’s securities during the same period. In addition, employees and Capital Markets Services Licence Appointed Representatives of the Manager are required to give pre-trading notification to the CEO and Compliance department before any dealing in CRCT Group’s securities.
Directors and employees of the Manager as well as certain relevant executives of the CL group are also prohibited from dealing in securities of CRCT Group if they are in possession of unpublished price-sensitive information of CRCT Group by virtue of their status as Directors and/or employees. As and when appropriate, they would be issued an advisory to refrain from dealing in CRCT Group’s securities.
Under the policy, Directors and employees of the Manager as well as certain relevant executives of the CL group are also discouraged from trading on short-term or speculative considerations. They are also prohibited from using any information with respect to other companies or entities obtained in the course of their employment in connection with securities transactions of such companies or entities.
(F) CODE OF BUSINESS CONDUCT
The Manager adheres to an ethics and code of business conduct policy which deals with issues such as confidentiality, conduct and work discipline, corporate gifts and concessionary offers. Clear policies and guidelines on how to handle workplace harassment and grievances are also in place.
The policies and guidelines are published on CL’s Intranet, which is accessible by all employees of the Manager.
The policies that the Manager has implemented aim to help to detect and prevent occupational fraud in mainly three ways.
First, the Manager offers fair compensation packages, based on practices of pay-for-performance and promotion based on merit to its employees. The Manager also provides various healthcare subsidies and financial assistance schemes to alleviate the common financial pressures its employees face.
44CAPITALAND RETAIL CHINA TRUST

Second, clearly documented policies and work procedures incorporate internal controls which ensure that adequate checks and balances are in place. Periodic audits are also conducted to evaluate the efficacy of these internal controls.
Finally, the Manager seeks to build and maintain the right organisational culture through its core values, educating its employees on good business conduct and ethical values.
Bribery and Corruption Prevention PolicyThe Manager adopts a strong stance against bribery and corruption. In addition to clear guidelines and procedures for the giving and receipt of corporate gifts and concessionary offers, all employees of the Manager are required to make a declaration on an annual basis where they pledge to uphold the Manager’s core values and not to engage in any corrupt or unethical practices. This serves as a reminder to all employees to maintain the highest standards of integrity in their work and business dealings.
The Manager’s zero tolerance policy towards bribery and corruption extends to its business dealings with third parties. Pursuant to this policy, the Manager requires that certain agreements incorporate anti-bribery and anti-corruption provisions.
Whistle-Blowing PolicyA whistle-blowing policy and other procedures are put in place to provide employees of the Manager and parties who have dealings with the Manager with well defined, accessible and trusted channels to report suspected fraud, corruption, dishonest practices or other improprieties in the workplace, and for the independent investigation of any reported incidents and appropriate follow up action. The objective of the whistle-blowing policy is to encourage the reporting of such matters so that employees or external parties making any reports in good faith will be able to do so with the confidence that they will be treated fairly and, to the extent possible, be protected from reprisal.
Anti-Money Laundering and Countering the Financing of Terrorism MeasuresAs a holder of a Capital Markets Services licence issued by MAS, the Manager abides by the MAS’ guidelines on the prevention of money laundering and countering the financing of terrorism. Under these guidelines, the main obligations of the Manager are:
(a) evaluation of risk;(b) customer due diligence;(c) suspicious transaction reporting;(d) record keeping;(e) employee screening and representative screening; and(f) training.
The Manager has developed and implemented a policy on the prevention of money laundering and terrorist financing and is alert at all times to suspicious transactions. Where there is a suspicion of money laundering or terrorist financing, the Manager performs due diligence checks on its counterparties in order to ensure that it does not enter into business transactions with terrorist suspects or other high risk persons or entities. Suspicious transactions are also reported to the Suspicious Transaction Reporting Office of the Commercial Affairs Department.
Under this policy, the Manager must retain all relevant records or documents relating to business relations with its customers or transactions entered into for a period of at least five years following the termination of such business relations or the completion of such transactions.
All prospective employees, officers and representatives of the Manager are also screened against various lists of terrorist suspects issued by MAS. Periodic training is provided by the Manager to its Directors, employees and representatives to ensure that they are updated and aware of applicable anti-money laundering and terrorist financing regulations, the prevailing techniques and trends in money laundering and terrorist financing and the measures adopted by the Manager to combat money laundering and terrorist financing.
FIN
AN
CIA
LS & A
DD
ITIO
NA
L INFO
RM
AT
ION
P
OR
TFO
LIO D
ETA
ILS
BU
SINE
SS RE
VIE
W
SUSTA
INA
BILIT
Y
CO
RP
OR
AT
E G
OV
ER
NA
NC
E &
TR
AN
SP
AR
EN
CY
O
VE
RV
IEW
ANNUAL REPORT 2017
45

CORPORATE GOVERNANCE
Composition and Attendance Record of Meetings
Board Members
CompositionAttendance Record of Meetings
in FY 2017
Audit Committee
Corporate Disclosure Committee
Executive Committee
BoardAudit
CommitteeGeneral Meeting
Number of Meetings Held: 4
Number of Meetings Held: 4
Number of Meeting Held: 1
Liew Cheng San Victor1 - Chairman - 1 out of 4 N.A. 1 out of 1Soh Kim Soon2 - Chairman - 3 out of 4 N.A. N.A.Lim Ming Yan - Member Chairman 4 out of 4 N.A. 1 out of 1Tony Tan Tee Hieong3 - - Member 1 out of 4 N.A. N.A.Tan Tze Wooi4 - - Member 3 out of 4 N.A. 1 out of 1Fong Heng Boo Chairman - - 4 out of 4 4 out of 4 1 out of 1Christopher Gee Kok Aun Member - - 4 out of 4 4 out of 4 1 out of 1Professor Tan Kong Yam Member - - 3 out of 4 2 out of 4 1 out of 1Neo Poh Kiat5 - - - 3 out of 4 N.A. N.A.Jason Leow Juan Thong6 - - Member 3 out of 4 N.A. 1 out of 1Ng Kok Siong7 Member Member Member 4 out of 4 4 out of 4 1 out of 1
N.A.: Not Applicable.1 Mr Liew Cheng San Victor stepped down as Director and ceased to be Chairman of the Board and Chairman of the Corporate Disclosure Committee with effect
from 20 April 2017.2 Mr Soh Kim Soon was appointed as Director, Chairman of the Board and Chairman of the Corporate Disclosure Committee with effect from 20 April 2017.3 Mr Tony Tan Tee Hieong ceased to be the Chief Executive Officer, Executive Director and a Member of the Executive Committee with effect from 1 April 2017.4 Mr Tan Tze Wooi was appointed as the Chief Executive Officer, Executive Director and a Member of the Executive Committee with effect from 1 April 2017.5 Mr Neo Poh Kiat was appointed as Director with effect from 20 April 2017.6 Mr Jason Leow Juan Thong was appointed as Director and a Member of the Executive Committee with effect from 20 April 2017. Mr Leow has subsequently stepped
down as Director with effect from 1 January 2018 and has also ceased to be a member of the Executive Committee.7 Mr Ng Kok Siong stepped down as Director and ceased to be a Member of the Audit Committee, the Corporate Disclosure Committee and the Executive Committee
with effect from 1 January 2018.
Key Management Personnel’s Remuneration Table for the Financial Year Ended 31 December 2017
Total Remuneration Bands
Salary inclusive of AWS and
employer’s CPF
Bonus and Other Benefits inclusive
of employer’s CPF1
Award of Units2 Total
Above S$500,000 to S$750,000Tan Tze Wooi3,4
(for the period from 1 April 2017 to 31 December 2017)34% 34% 32% 100%
Below S$250,000Tony Tan Tee Hieong(for the period from 1 January 2017 to 31 March 2017)
50% 50% 0% 100%
Key Officers5
Joanne Tan Siew Bee
Leng Tong Yan (for the period from 1 January 2017 to 14 October 2017)
Delphine Sze Li Xin (for the period from 2 October 2017 to 31 December 2017)
54% 34% 12% 100%
Total for CEO and Key Officers S$1,385,4871 The amounts disclosed include bonuses earned and the other incentive plans which have been accrued for in FY 2017.2 The proportion of value of Unit awards is based on the fair value of the Units comprised in the contingent awards under the CapitaLand Retail China Trust Management
Limited Restricted Unit Plan (RUP) and the CapitaLand Retail China Trust Management Limited Performance Unit Plan (PUP) at the time of grant in FY 2017. The final number of Units released under the contingent awards of Units for the RUP and PUP will depend on the achievement of pre-determined targets and subject to the respective vesting period under the RUP and PUP.
3 The amount disclosed excludes overseas posting allowances and benefits that have since ceased as at the end of FY 2017.4 Mr Tan Tze Wooi was appointed as Deputy CEO on 1 December 2016. He was appointed as CEO Designate with effect from 1 March 2017 before he assumed the
role of CEO of the Manager on 1 April 2017. The remuneration of Mr Tan for the period from 1 January 2017 to 31 March 2017 was borne by CapitaLand Limited and/or its subsidiaries (other than the Manager).
5 The remuneration of Ms Pauline Yeh as Vice President, Investment and Asset Management, was borne by CapitaLand Limited and/or its subsidiaries (other than the Manager), to which the Manager outsources the Investment and Asset Management functions, among others.
46CAPITALAND RETAIL CHINA TRUST

ENTERPRISE RISK MANAGEMENTRisk management is an integral part of CapitaLand Retail China Trust and its subsidiaries’ (CRCT Group) business at both the strategic and operational levels. A proactive approach towards risk management supports the attainment of the Group’s business objective and corporate strategy, thereby creating and preserving value.
The manager of CRCT Group (Manager) recognises that risk management is just as much about opportunities as it is about threats. To capitalise on opportunities, the Manager has to take measured risks. Risk management is not about pursuing risk minimisation as a goal, but rather optimising the risk-reward relationship within known and agreed risk appetite levels. The Manager therefore takes risks in a prudent manner for justifiable business reasons.
The Board of Directors of the Manager (Board) is responsible for the governance of risk across CRCT Group. The responsibilities include determining CRCT Group’s risk appetite; overseeing the Manager’s Enterprise Risk Management (ERM) Framework; regularly reviewing CRCT Group’s risk profile, material risks and mitigation strategies;
and ensuring the adequacy and effectiveness of the risk management framework and policies. For these purposes, it is assisted by the Audit Committee (AC), which provides dedicated oversight of risk management at the Board level.
The AC currently comprises three Independent Board members and one Non-Independent member and meets quarterly . The meetings are attended by the Chief Executive Officer (CEO) as well as other key management staff of the Manager.
The Board approves CRCT Group’s risk appetite, which determines the nature and extent of material risks that CRCT Group is willing to take to achieve its strategic and business objectives. CRCT Group’s Risk Appetite Statement (RAS) is expressed via formal, high-level and overarching statements and accompanying risk limits which determine specific risk boundaries established at an operational level. Having considered key stakeholders’ interests, the RAS sets out explicit and forward-looking views of CRCT Group’s desired risk profile and ensures it is aligned with CRCT Group’s strategy and business plans.
ENTERPRISE RISK MANAGEMENT FRAMEWORK
Risk Strategy
Inte
rnal
Co
ntr
ol S
yste
m
Ind
epen
den
t R
evie
w &
Au
dit
Board Oversight & Senior Management Involvement
ERM Framework
Risk-Aware Culture
Key Risk Indicators Quarterly Risk
Reporting Portfolio Monitoring
of Financial Risks e.g. Country Concentration, Foreign Exchange, etc
Risk Monitoring & Reporting
Risk Response
Accept Avoid Mitigate e.g. Business
Continuity Management Transfer e.g. Contractual
Risk Management & Insurance
Risk Identification & Assessment
Risk Appetite Risk & Control
Self-Assessment Investment Risk
Evaluation Quantitative Analysis Scenario Analysis Whistle-blowing/
Business Malpractice
FIN
AN
CIA
LS & A
DD
ITIO
NA
L INFO
RM
AT
ION
P
OR
TFO
LIO D
ETA
ILS
BU
SINE
SS RE
VIE
W
SUSTA
INA
BILIT
Y
CO
RP
OR
AT
E G
OV
ER
NA
NC
E &
TR
AN
SP
AR
EN
CY
O
VE
RV
IEW
ANNUAL REPORT 2017
47
ENTERPRISE RISK MANAGEMENTThe Manager’s ERM Framework is adapted from the International Organization for Standardization (ISO) 31000 International Risk Management Standards, and makes reference to the Committee of Sponsoring Organizations of the Treadway Commission (COSO) Internal Control-Integrated Framework and other relevant best practices and guidelines. It sets out the required environmental and organisational components which enable CRCT Group to manage risks in an integrated, systematic and consistent manner. The ERM Framework and related risk management policies are reviewed annually and have been validated by external consultants.
A robust internal control system and an effective, independent review and audit process are the twin pillars that underpin CRCT Group’s ERM Framework. While the line management is responsible for the design and implementation of effective internal controls using a risk-based approach, the Internal Audit function reviews such design and implementation to provide reasonable assurance to the Audit Committee (AC) on the adequacy and effectiveness of the internal control system.
The Manager believes that having the right risk culture and people with the right attitude, values and knowledge are fundamental to CRCT Group’s success of ERM. Therefore, the Manager works closely with CapitaLand’s Risk Assessment Group (RAG) to proactively enhance risk management knowledge by conducting regular workshops for all levels and functions, and to promote a culture of risk awareness which embeds risk management principles in decision-making and business processes.
Annually, the Manager facilitates and coordinates CRCT Group’s Risk and Control Self-Assessment (RCSA) exercise that requires the respective risk owners to proactively identify, assess and document material risks as well as the corresponding key controls and mitigating measures needed to address them. Material risks and their associated controls are consolidated and reviewed at the Manager’s level before they are presented to the AC and the Board.
MANAGING MATERIAL RISKS
The Manager undertakes an iterative and comprehensive approach to identifying, managing, monitoring and reporting material risks across CRCT Group. Such material risks include:
Business Interruption RiskCRCT Group is exposed to business interruption risk arising from sudden and major disaster events such as fire, prolonged power outages or other major infrastructure or equipment failures which may significantly disrupt operations at the malls. The Manager manages such risks through proactive facilities management (e.g. routine inspection and scheduled maintenance) and having crisis management standard operating procedures at each property.
Competition Risk CRCT Group faces keen competition from established players and new market entrants in the real estate industry. It adopts a relentless approach to strengthening its competitiveness through high-quality products and services, product differentiation, pricing, asset enhancement initiatives (AEIs) and branding. CRCT Group also promotes tenant and customer loyalty through customer-centric initiatives and shopper loyalty programmes. A team of in-house experts provides regular analysis on market trends. Innovation workshops are conducted regularly to brainstorm ideas to anticipate as well as react to these trends.
Economic Risk CRCT Group is exposed to developments in major economies and key financial and property markets. These developments may reduce revenue, increase costs and result in downward revaluation of our assets. Market illiquidity during a financial crisis makes asset divestment challenging and this can affect CRCT Group’s investment and strategic objectives. The Manager manages this by adopting a disciplined approach to financial management, and maintaining a balanced portfolio. In addition, the Manager adopts a proactive asset management policy (e.g. AEIs and close monitoring of tenant mix and tenants’ sales etc) to maintain the attractiveness of the properties and generate sustainable demand.
48CAPITALAND RETAIL CHINA TRUST

Information Security Risk With increased reliance on Information Technology (IT) as a business enabler, the outsourced IT team from CapitaLand has put in place policies and procedures which set out the governance and controls of IT risks, including cyber risks. Appropriate measures are in place to ensure the confidentiality, integrity, and availability of CapitaLand Group’s information assets. This includes implementing access controls; building up data security; raising staff’s IT Security awareness through activities such as phishing campaigns, and conducting IT disaster recovery exercise annually to ensure business recovery objectives are met.
Political & Policy Risk CRCT Group may be exposed to various levels of political and policy risks such as political leadership uncertainty, inconsistency in public policies, social unrest, change in property-related regulations etc. Such risks may threaten the economic and sociopolitical environment which may, in turn, affect the financial viability of the CRCT Group’s businesses. To mitigate these risks, the Manager keeps abreast of regular updates on economic news and market trends. Malls are managed by experienced managers and teams who are familiar with the local conditions and cultures, and have insights on political situations and policy changes.
Acts Of God and PandemicNatural disasters, catastrophes and pandemic events are beyond the Manager’s control. Such events may significantly damage CRCT Group’s properties or disrupt operations and reduce shopper traffic. This could lead to loss of income for our tenants and possibly defaults on lease payments, resulting in adverse effect on CRCT Group’s business and financial conditions. The Manager manages such risks through procuring adequate insurance cover and establishing crisis management standard operating procedures at each property.
Foreign Exchange RiskCRCT Group is exposed to Chinese Renminbi (RMB) fluctuation against the Singapore Dollar which is the distribution pay out currency. Where possible, CRCT Group adopts a natural hedging by borrowing in RMB which matches the revenue stream generated from its investments. Non-RMB denominated term loans are hedged via non-deliverable forwards so as to match its underlying assets which are denominated in RMB. In
relation to CRCT Group’s overseas investments in foreign subsidiaries whose net assets are exposed to currency translation risk and are held for long term investment purposes, the differences arising from such translation are captured under foreign currency translation reserve which are reviewed and monitored on a regular basis.
Interest Rate RiskSome of CRCT Group’s existing debts carry floating interest rates, and consequently, the interest cost to CRCT Group for such loans will be subject to fluctuations in interest rates. As part of CRCT Group’s active capital management strategies, the Manager enters into hedging transactions to partially mitigate the risk of such interest rate fluctuations through the use of interest rate swaps and/or fixed rate borrowings. The exposure to interest rate risk is further managed through regular reviews with senior management on the optimal mix of fixed and floating rate borrowings. In addition, debt portfolio is reviewed on an on-going basis, taking into account the investment holding period and nature of the assets.
Liquidity RiskThe Manager actively monitors CRCT Group’s debt maturity profile, operating cash flows and the availability of funding so as to ensure sufficient funds are available to meet CRCT Group’s capital, refinancing and operating needs. To manage liquidity risk, the Manager maintains adequate levels of liquid resources to cover CRCT Group’s working capital obligations. Moreover, CRCT Group has access to the debt market through its Medium Term Note (MTN) Programme to raise funds for acquisition, development and/ or refinance maturing debt. CRCT Group’s ability to raise funds from both banks and capital markets has enabled it to diversify its sources of funding to avoid over-reliance on any single source of funding.
Regulatory and Compliance RiskCRCT Group is required to comply with the relevant legislation and regulations that include the Listing Manual of the Singapore Exchange Securities Trading Limited, the Code on Collective Investment Schemes issued by the Monetary Authority of Singapore and the tax rulings by the Inland Revenue Authority of Singapore. The Manager has established relevant policies and procedures to ensure CRCT Group’s compliance with applicable legislation and regulations.
FIN
AN
CIA
LS & A
DD
ITIO
NA
L INFO
RM
AT
ION
P
OR
TFO
LIO D
ETA
ILS
BU
SINE
SS RE
VIE
W
SUSTA
INA
BILIT
Y
CO
RP
OR
AT
E G
OV
ER
NA
NC
E &
TR
AN
SP
AR
EN
CY
O
VE
RV
IEW
ANNUAL REPORT 2017
49
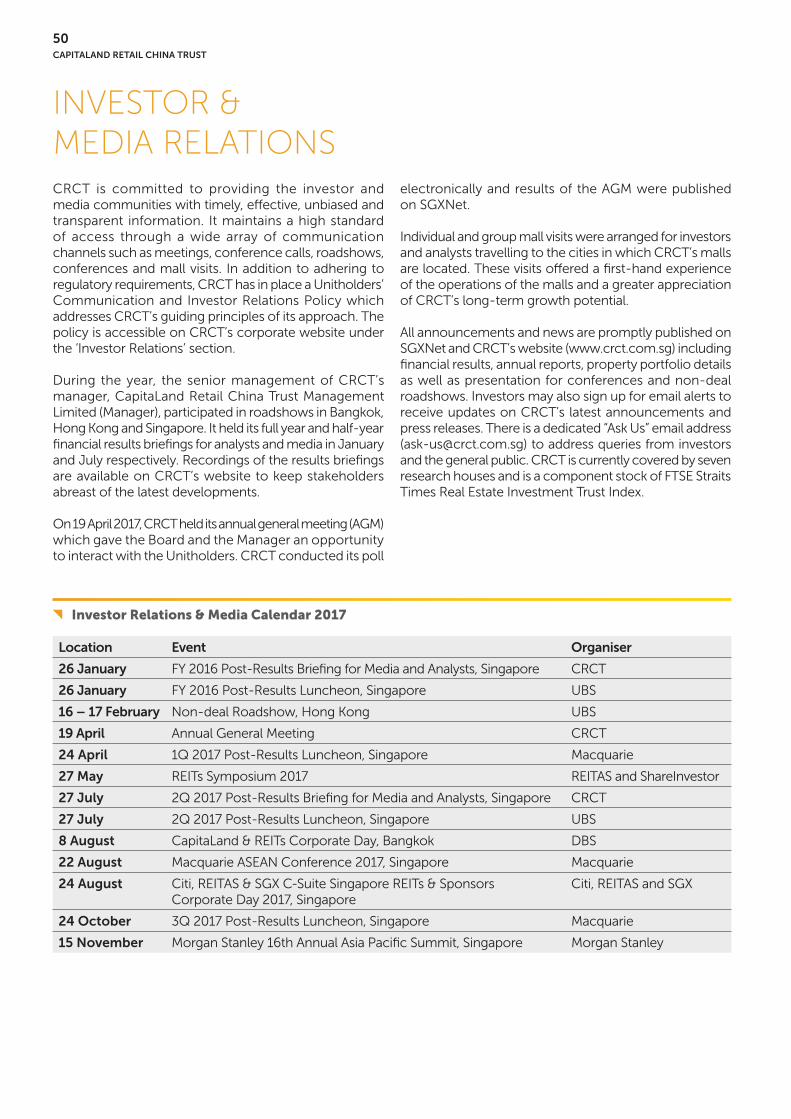
INVESTOR & MEDIA RELATIONSCRCT is committed to providing the investor and media communities with timely, effective, unbiased and transparent information. It maintains a high standard of access through a wide array of communication channels such as meetings, conference calls, roadshows, conferences and mall visits. In addition to adhering to regulatory requirements, CRCT has in place a Unitholders’ Communication and Investor Relations Policy which addresses CRCT’s guiding principles of its approach. The policy is accessible on CRCT’s corporate website under the ‘Investor Relations’ section.
During the year, the senior management of CRCT’s manager, CapitaLand Retail China Trust Management Limited (Manager), participated in roadshows in Bangkok, Hong Kong and Singapore. It held its full year and half-year financial results briefings for analysts and media in January and July respectively. Recordings of the results briefings are available on CRCT’s website to keep stakeholders abreast of the latest developments.
On 19 April 2017, CRCT held its annual general meeting (AGM) which gave the Board and the Manager an opportunity to interact with the Unitholders. CRCT conducted its poll
electronically and results of the AGM were published on SGXNet.
Individual and group mall visits were arranged for investors and analysts travelling to the cities in which CRCT’s malls are located. These visits offered a first-hand experience of the operations of the malls and a greater appreciation of CRCT’s long-term growth potential.
All announcements and news are promptly published on SGXNet and CRCT’s website (www.crct.com.sg) including financial results, annual reports, property portfolio details as well as presentation for conferences and non-deal roadshows. Investors may also sign up for email alerts to receive updates on CRCT’s latest announcements and press releases. There is a dedicated “Ask Us” email address ([email protected]) to address queries from investors and the general public. CRCT is currently covered by seven research houses and is a component stock of FTSE Straits Times Real Estate Investment Trust Index.
Investor Relations & Media Calendar 2017
Location Event Organiser
26 January FY 2016 Post-Results Briefing for Media and Analysts, Singapore CRCT
26 January FY 2016 Post-Results Luncheon, Singapore UBS
16 – 17 February Non-deal Roadshow, Hong Kong UBS
19 April Annual General Meeting CRCT
24 April 1Q 2017 Post-Results Luncheon, Singapore Macquarie
27 May REITs Symposium 2017 REITAS and ShareInvestor
27 July 2Q 2017 Post-Results Briefing for Media and Analysts, Singapore CRCT
27 July 2Q 2017 Post-Results Luncheon, Singapore UBS
8 August CapitaLand & REITs Corporate Day, Bangkok DBS
22 August Macquarie ASEAN Conference 2017, Singapore Macquarie
24 August Citi, REITAS & SGX C-Suite Singapore REITs & Sponsors Corporate Day 2017, Singapore
Citi, REITAS and SGX
24 October 3Q 2017 Post-Results Luncheon, Singapore Macquarie
15 November Morgan Stanley 16th Annual Asia Pacific Summit, Singapore Morgan Stanley
50CAPITALAND RETAIL CHINA TRUST

Daiwa Capital Markets DBS Bank J.P. Morgan Securities Macquarie Capital Securities
OCBC Investment Research Phillip Securities Research UBS Securities
ANALYST COVERAGE (AS AT 26 FEBRUARY 2018)
UNITHOLDER & MEDIA ENQUIRIES
If you have any enquiries or would like to find out more about CRCT, please contact:
The ManagerMs Delphine SzeInvestor Relations
Ms Chia Pei SiangGroup Communications
Tel : +65 6713 2888Fax : +65 6713 2999Email : [email protected] : www.crct.com.sg
For depository-related matters such as change of details pertaining to Unitholders’ investment records, please contact:
The Central Depository (Pte) Limited9 North Buona Vista Drive#01-19/20 The MetropolisSingapore 138588
Tel : +65 6535 7511Email : [email protected] : www.sgx.com/cdp
Unit RegistrarBoardroom Corporate & Advisory Services Pte. Ltd.50 Raffles Place#32-01 Singapore Land TowerSingapore 048623
Tel : +65 6536 5355Fax : +65 6536 1360Website : www.boardroomlimited.com
Financial Calendar 2018 - 2019 (tentative)
April 2018 First Quarter Results Announcement
April 2018 Annual General Meeting
July 2018 Second Quarter Results Announcement
September 2018 First Half Distribution to Unitholders
October 2018 Third Quarter Results Announcement
January 2019 Full Year Results Announcement
March 2019 Second Half Distribution to Unitholders
FIN
AN
CIA
LS & A
DD
ITIO
NA
L INFO
RM
AT
ION
P
OR
TFO
LIO D
ETA
ILS
BU
SINE
SS RE
VIE
W
SUSTA
INA
BILIT
Y
CO
RP
OR
AT
E G
OV
ER
NA
NC
E &
TR
AN
SP
AR
EN
CY
O
VE
RV
IEW
ANNUAL REPORT 2017
51

Feb Aug
26.9
1.425
18.4
1.480
19.9
1.590
23.0
1.555
31.7
1.640
31.9
1.660
19.9
1.595
28.2
1.605
21.7
1.660
24.0
1.640
28.8
1.620
Mar SepJan Jul
13.3
1.420
Apr OctMay NovJun Dec
UNIT PRICE PERFORMANCE
Trading Volume (million units)Unit Price (S$) as at the last trading day of the month
1 Based on distribution per Unit of 10.10 cents for FY 2017 and the closing Unit price of S$1.62 on 31 December 2017.
CRCT Distribution Yield1
FTSE ST REIT Index 12-month Dividend Yield
FTSE ST Real Estate Index 12-month Dividend Yield
STI 12-month Dividend Yield
China 10-year Government Bond Yield
Singapore 10-year Government Bond Yield
CPF Ordinary Account Interest Rate
12-month Fixed (S$) Deposit Rate
6.2%
5.3%
4.0%
3.1%
3.9%
2.0%
2.5%
0.3%
Source: Bloomberg, CRCTML, Central Provident Fund (CPF) Board, Monetary Authority of Singapore.
CRCT Trading Data in FY 2017
Highest Unit Price (S$) 1.685
Lowest Unit Price (S$) 1.365
Average Closing Unit Price (S$) 1.558
Opening Unit Price on 3 January 2017 1.375
Closing Unit Price on 31 December 2017 1.620
Turnover (million units) 287.6
CRCT Monthly Trading Performance in FY 2017
Comparative Yields (%) (As at 31 December 2017)
52CAPITALAND RETAIL CHINA TRUST

CRCT FTSE ST REIT IndexStraits Times Index Shanghai Exchange Composite IndexFTSE ST Real Estate Index
128%
124%
120%
116%
112%
108%
104%
100%
96%
Dec 2016
Jan 2017
Feb 2017
Mar 2017
Sep 2017
Apr 2017
Oct 2017
Aug 2017
May 2017
Nov 2017
Jun 2017
Dec 2017
Jul 2017
Comparative Trading Performance for FY 2017
CRCT FTSE ST REIT IndexStraits Times Index Shanghai Exchange Composite IndexFTSE ST Real Estate Index
Dec 2014
Dec 2015
250%
200%
150%
100%
50%
0%
Dec 2012
Dec 2013
Dec 2016
Dec 2017
Comparative Trading Performance for FY 2013 - FY 2017
FIN
AN
CIA
LS & A
DD
ITIO
NA
L INFO
RM
AT
ION
P
OR
TFO
LIO D
ETA
ILS
BU
SINE
SS RE
VIE
W
SUSTA
INA
BILIT
Y
CO
RP
OR
AT
E G
OV
ER
NA
NC
E &
TR
AN
SP
AR
EN
CY
O
VE
RV
IEW
ANNUAL REPORT 2017
53

54CAPITALAND RETAIL CHINA TRUST
SUSTAINABILITY MANAGEMENTSUSTAINABILITY COMMITMENT
As a CapitaLand-sponsored REIT, CRCT is managed by wholly owned subsidiaries of CapitaLand which include the Manager as well as Property Managers which oversee daily property operations for the portfolio of malls. The Manager and Property Managers are responsible for the property operations across CRCT’s portfolio, and abide by CapitaLand sustainability framework, policies, guidelines, as well as ethics and code of business conduct.
CRCT’s sustainability strategies and objectives are aligned to the Group’s credo of ‘Building People. Building Communities’. The Group is committed to improving the economic and social well-being of its stakeholders through the development of its projects and management of its operations. In a rapidly changing business landscape, it actively embraces innovation to ensure commercial viability without compromising the environment for future generations.
The Group upholds high standards of corporate governance and transparency to safeguard shareholders’ interests. It has in place an adequate and effective Enterprise Risk Management framework to enhance its business resilience and agility. The Group’s proactive approach towards environmental, health and safety (EHS) management, which incorporates universal design into its developments, ensures that its properties are future-proof and sustainable. Policies and guidelines are put in place to ensure the efficient use of energy, water and other resources.
The Group’s integrated human capital strategy aims to recruit, develop and motivate employees to drive growth. Community development is also an important component of the Group’s commitment to sustainability. It focuses on providing support to enhance the lives of underprivileged children through corporate philanthropy and employee volunteerism.
CapitaLand is one of the first companies in Singapore to voluntarily publish its annual Sustainability Report and externally assure the entire report. Benchmarking against an international standard and framework that is externally validated helps the Group overcome the
challenges to sustainability reporting that arise from its diversified asset types and geographical presence. CapitaLand is also a signatory to the UN Global Compact and its Global Sustainability Report serves as its Communication on Progress, which will be made available at www.unglobalcompact.org when published. Some of CapitaLand’s key efforts and programmes in relation to UN Sustainable Development Goals (SDGs) will be included in the annual Sustainability Report 2017 when published.
For its efforts, CapitaLand is listed in the Sustainability Yearbook, Dow Jones Sustainability World Index and Asia Pacific Index, Global Real Estate Sustainability Benchmark (Regional Sector Leader for Asia, Diversified), FTSE4Good Index Series, MSCI Global Sustainability Indexes, Euronext VigeoEiris Indices World 120, STOXX® Global ESG Leaders Indices, and SGX Sustainability Indices.
CapitaDNA (Vision, Mission, Credo and Core Values)
People (Staff)
Develop a high performance culture that embraces diversity and teamwork
Investors (Including business partners)
Deliver sustainable shareholder returns
Customers (Tenants, shoppers, home owners, residents)
Create great customer value and experiences through high-quality products and services
Communities (Suppliers/contractors, government agencies/NGOs, environment, community)
Contribute positively to the economic, environmental and social development of communities
Respect at all levels
Pu
rsu
e E
xcel
len
ce
Integ
rity at all levels
Creativity to enhance value

ANNUAL REPORT 2017
55
The CapitaLand Global Sustainability Report 2017 will be published by end-May 2018 and will cover the Group’s portfolio and employees, including its listed real estate investment trusts CapitaLand Mall Trust, CapitaLand Commercial Trust, Ascott Residence Trust, CapitaLand Retail China Trust and CapitaLand Malaysia Mall Trust, unless otherwise indicated. The report will be externally assured to AA1000 Assurance Standard.
This sustainability chapter references selected GRI Standards1 to report specific information. It covers CRCT’s properties from 1 January to 31 December 2017 unless otherwise stated. The teams behind the Manager and Property Manager responsible for property and portfolio operations are identified as employees of the Trust.
BOARD STATEMENT
CRCT is committed to sustainability and incorporates the key principles of environment, social and governance in setting out its business strategies and operations.
The Board sets CRCT’s risk appetite, which determines the nature and extent of material risks that CRCT is willing to take to achieve its strategic and business objectives. The risk appetite incorporates ESG factors such as fraud, corruption and bribery, environment, health and safety.
The Board also approves the executive compensation framework based on the principle of linking pay to performance. CRCT’s business plans are translated to both quantitative and qualitative performance targets including sustainable corporate practices and are cascaded throughout the organisation.
Sustainability Management Structure
Sustainability Council
Sustainability Steering Committee
All Staff
Social Sustainability
Work Team
Environment Sustainability
Work Team
Board of Directors
Sustainability Council
Sustainability Steering Committee
TOP MANAGEMENT COMMITMENT AND STAFF INVOLVEMENT
The Group’s Sustainability Management comes under the purview of its Sustainability Council, comprising the Group’s top management. It is supported by a Sustainability Steering Committee which oversees two work teams to ensure the Group’s continued progress and improvement in the areas of ESG. The Sustainability Steering Committee and work teams comprise representatives from all business units. The CapitaLand Board of Directors is updated regularly through the Risk Committee and Audit Committee on matters relating to sustainability risks and business malpractice incidents if any. The Board is also updated on the sustainability management performance of the Group, key material issues identified by stakeholders and the planned measures for follow up.
1 This material references Disclosure 302-1 from GRI 302: Energy 2016, Disclosure 303-1 from GRI 303: Water 2016, Disclosure 305-1 and Disclosure 305-2 from GRI 305: Emissions 2016, Disclosure 205-1 and Disclosure 205-2 from GRI 205: Anti-Corruption 2016, Disclosure 403-1 from GRI 403: Occupational health & injury 2016 and Disclosure 405-1 from GRI 405: Diversity 2016.
FIN
AN
CIA
LS & A
DD
ITIO
NA
L INFO
RM
AT
ION
P
OR
TFO
LIO D
ETA
ILS
BU
SINE
SS RE
VIE
W
SU
ST
AIN
AB
ILITY
C
OR
PO
RA
TE
GO
VE
RN
AN
CE
& T
RA
NSP
AR
EN
CY
O
VE
RV
IEW
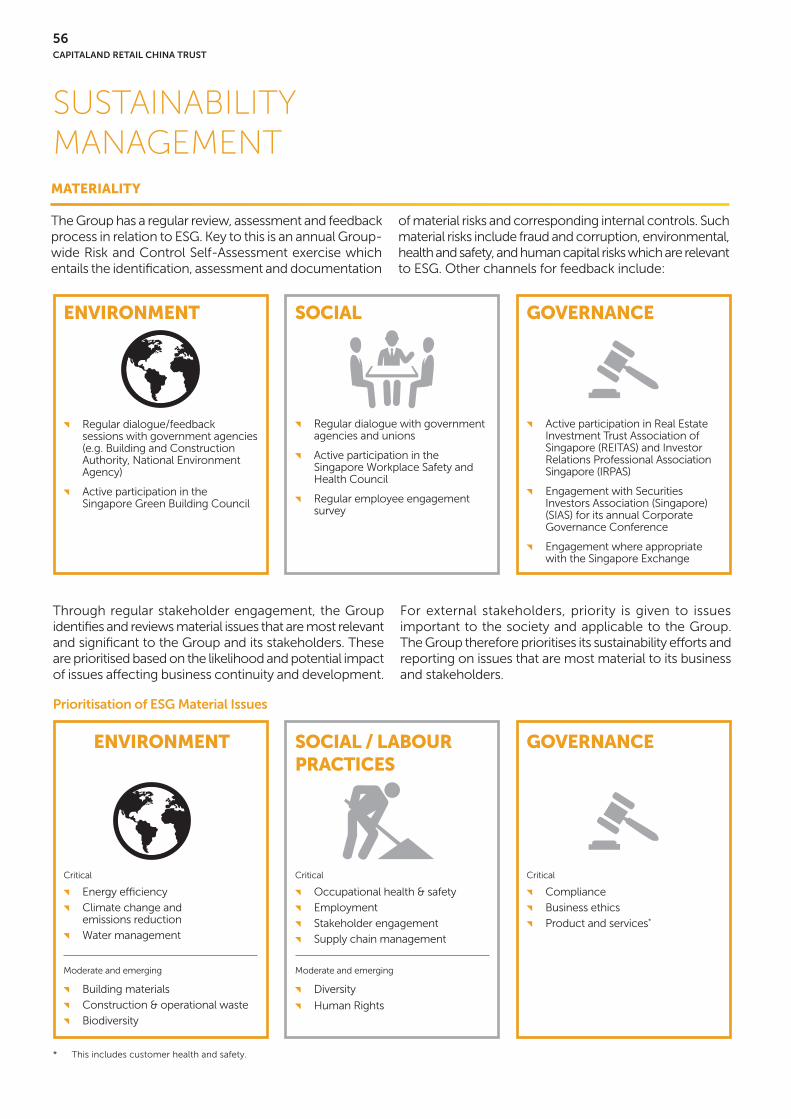
56CAPITALAND RETAIL CHINA TRUST
SUSTAINABILITY MANAGEMENT
Prioritisation of ESG Material Issues
ENVIRONMENT GOVERNANCESOCIAL / LABOUR PRACTICES
Energy efficiency
Climate change and emissions reduction
Water management
Compliance
Business ethics
Product and services*
Occupational health & safety
Employment
Stakeholder engagement
Supply chain management
Critical CriticalCritical
Moderate and emerging Moderate and emerging
Building materials
Construction & operational waste
Biodiversity
Diversity
Human Rights
Through regular stakeholder engagement, the Group identifies and reviews material issues that are most relevant and significant to the Group and its stakeholders. These are prioritised based on the likelihood and potential impact of issues affecting business continuity and development.
For external stakeholders, priority is given to issues important to the society and applicable to the Group. The Group therefore prioritises its sustainability efforts and reporting on issues that are most material to its business and stakeholders.
* This includes customer health and safety.
MATERIALITY
The Group has a regular review, assessment and feedback process in relation to ESG. Key to this is an annual Group-wide Risk and Control Self-Assessment exercise which entails the identification, assessment and documentation
of material risks and corresponding internal controls. Such material risks include fraud and corruption, environmental, health and safety, and human capital risks which are relevant to ESG. Other channels for feedback include:
Regular dialogue/feedback sessions with government agencies (e.g. Building and Construction Authority, National Environment Agency)
Active participation in the Singapore Green Building Council
Active participation in Real Estate Investment Trust Association of Singapore (REITAS) and Investor Relations Professional Association Singapore (IRPAS)
Engagement with Securities Investors Association (Singapore) (SIAS) for its annual Corporate Governance Conference
Engagement where appropriate with the Singapore Exchange
Regular dialogue with government agencies and unions
Active participation in the Singapore Workplace Safety and Health Council
Regular employee engagement survey
ENVIRONMENT GOVERNANCESOCIAL
STAKEHOLDER ENGAGEMENT
EmployeesThe Group actively engages its employees through various avenues, including regular communication sessions held by senior management, for effective flow of information and alignment of business goals and objectives across all levels of its workforce. CustomersThe Group conducts regular resident satisfaction surveys in all its serviced residences and tenant surveys in its shopping malls and office buildings. The feedback obtained is reviewed and relevant follow-up actions are taken to improve residents’ experience and service levels to tenants. Supply ChainThe Group proactively engages contractors and suppliers on areas relating to quality of work and commitment to EHS. For more information, please refer to the sub-section on EHS. The Group also adopts a strong stance against bribery and corruption. Third-party service providers and contractors can provide feedback via a dedicated email address, in addition to the regular feedback channels. Investors and MediaUnderlying CRCT’s investor and analyst communications is its Unitholders’ Communications and Investor Relations (IR) policy which is available at www.crct.com.sg/ir_policy. Please refer to the section on Investor and Media Relations on pages 50 to 51 of this Annual Report. Government Agencies and RegulatorsCapitaLand participates in stakeholder consultations organised by key government agencies so as to furnish feedback on proposed regulatory changes that impact the company’s business. It enables CapitaLand to be aware of industry challenges, placing the company in a better position to leverage existing and future opportunities for growth.
HUMAN CAPITAL
As an externally managed REIT, CRCT has no employees and is managed by the Manager and Property Managers, which are indirect wholly owned subsidiaries of the Group. The employees of the Manager and Property Managers form part of the headcount of the Group. CRCT leverages on the Group’s integrated human capital strategy to recruit, develop and engage employees.
The Group is committed to be a workplace of choice for its employees and has an integrated human capital strategy to recruit, develop and motivate employees. The Group upholds the spirit of international human rights conventions, such as the Universal Declaration of Human Rights and the International Labour Organisation (ILO) Conventions, against coerced labour and discrimination in any form. In 2017, there was no reported incident relating to discrimination, child labour or forced labour in CapitaLand.
CRCT has maintained a diverse workforce in terms of age, gender and skill sets. The teams behind the Manager and Property Manager consist of more than 300 employees, and are responsible for the property and portfolio operations in China. New hires represented 25% of the total headcount in 2017. Our workforce comprises an almost equal proportion of males and females, at a ratio of 60:40. The company’s female employees are well-represented at the middle and senior management level. About 44% of the managerial employees were female. 77% of our workforce is aged 30 to 50. In 2017, we had no employee below the age of 16.
The Group adheres to an ethics and code of business conduct policy which deals with issues such as confidentiality, conduct and work discipline, corporate gifts and concessionary offers. Clear policies and guidelines on how to handle workplace harassment and grievances are also in place. The Group adopts a strong stance against bribery and corruption. All employees of the Group are required to make a declaration on an annual basis when they pledge to uphold the Group’s core values and not to engage in any corrupt or unethical practices. This serves as a reminder to all employees to maintain the highest standards of integrity in their work and business dealings.
A whistle-blowing policy and other procedures are in place to provide the Group’s employees and parties who have dealings with the Group with well-defined, accessible and trusted channels to report suspected fraud, corruption, dishonest practices or other improprieties in the workplace. It also allows for the independent investigation of any reported incidents and appropriate actions for follow up. Substantiated business malpractice incidents are reported quarterly to the CapitaLand Audit Committee and shared with the Risk Champions regularly. Actions taken may include the termination of employment contracts, and/or reporting to the appropriate external authorities.
Employees are provided with suitable training to be better equipped and so as to contribute effectively to the Group’s performance. For continuous upskilling and improvement, at least 95% of employees are required to attend at least one learning event per year. In 2017, 3% of CRCT’s annual
FIN
AN
CIA
LS & A
DD
ITIO
NA
L INFO
RM
AT
ION
P
OR
TFO
LIO D
ETA
ILS
BU
SIN
ES
S R
EV
IEW
SU
STAIN
AB
ILITY
C
OR
PO
RA
TE
GO
VE
RN
AN
CE
& T
RA
NSP
AR
EN
CY
O
VE
RV
IEW
ANNUAL REPORT 2017
57
58CAPITALAND RETAIL CHINA TRUST
SUSTAINABILITY MANAGEMENT
2 Computation of energy, water and carbon intensities excludes new properties which have been in operation for less than 12 months, master-leased properties and properties undergoing asset enhancement initiatives (AEI). Computation of indicators considers only properties managed by the Group.
payroll was set aside for employees to attend learning and development programmes and the average number of training hours completed by each employee for the year was more than 80 hours, well above the recommended industry guide of 40 hours per annum.
A total well-being programme has been put in place in CapitaLand to promote personal development, healthy living and work-life harmony which are essential to attract, motivate and retain talent. Initiatives include a flexible medical and benefits plan, flexible work arrangements and employee engagement initiatives.
COMMUNITY DEVELOPMENT INVESTMENT AND VALUE
Community development is a key focus of CapitaLand’s sustainability strategy. This has generated strong social capital and goodwill for the Group in the communities it operates in. It supports various stakeholder engagement activities which include environmental sustainability, health and safety, social integration as well as helping underprivileged children.
CRCT is committed to corporate philanthropy and takes pride in supporting employee volunteerism initiatives that contribute to the well-being of the communities served by its malls. CRCT malls also organised a wide variety of community events in support of various causes.
In September 2017, staff from CRCT malls took part in “My Schoolbag” – CapitaLand’s key annual corporate social responsibility programme, which took place for the eighth consecutive year in China. Staff volunteers helped to distribute new schoolbags and stationery to about 18,000 first grade pupils from 220 schools, including 22 CapitaLand Hope Schools. They also visited selected schools to help refurbish ageing facilities and interact with the children.
During the year-end festivities celebrations, CRCT malls organised Christmas charity bazaars whereby proceeds from the sale of festive items such as toys, books and handicrafts were donated to underprivileged children. To raise funds for CapitaLand Hope Schools, CapitaMall Qibao also held a charity carnival which roped in kindergarten children and their families to manage fun fair stalls. These heartwarming events seek to bring hope to the less fortunate while inculcating kindness in the next generation.
A registered charity in Singapore, the philanthropic arm of CapitaLand, CapitaLand Hope Foundation (CHF) invests
in the fundamental needs of education, healthcare and shelter of underprivileged children to relieve them of hardship and help them to eventually break the poverty cycle. Every year, the Group allocates up to 0.5% of its net profit to CHF and supports its day-to-day operations with staff from the various functional departments within the company.
CRCT is committed to providing a vibrant and accessible environment that offers convenience for the community that it serves. CRCT’s social integration criteria include ensuring accessibility for people of different age groups and varying mobility, enhancing connectivity to public transportation and roads. Most of our malls are fitted with accessible toilets to cater to people with disabilities, while accessible parking lots are available at CapitaMall Wangjing, CapitaMall Grand Canyon and CapitaMall Xinnan. There are also dedicated nursing rooms in some of CRCT’s malls, to meet the needs of shoppers with young children.
The Group is a strong advocate of volunteerism and was one of the first companies to formalise three days of Volunteer Service Leave (VSL) for its staff.
ENVIRONMENT, HEALTH AND SAFETY (EHS)
The Group is committed to protecting the environment and upholding the occupational health and safety of its employees and ensuring a safe and healthy environment for the users of its properties. The CapitaLand EHS Management System is externally audited to achieve the International Organization for Standardization (ISO) 14001 and Occupational Health and Safety Assessment Series (OHSAS) 18001 certification across 15 countries. CEOs are accountable for the EHS performance of their strategic business units (SBUs). All staff assume personal responsibility towards occupational health and safety (OHS). They are also encouraged to report all OHS-related incidents, including non-compliances and non-conformities to the relevant business unit management representatives. The CapitaLand EHS policy can be found at https://www.capitaland.com/international/en/about-capitaland/sustainability.html. The Group has incorporated EHS key performance indicators linked to the remuneration of all staff, as well as top management.
The Group has incorporated EHS key performance indicators linked to the remuneration of all staff, as well as top management. These include:
Energy and Water Usage Reduction2: In 2017, the reduction in energy usage in CRCT malls in KWh/m2/month was 36.8% and the reduction in
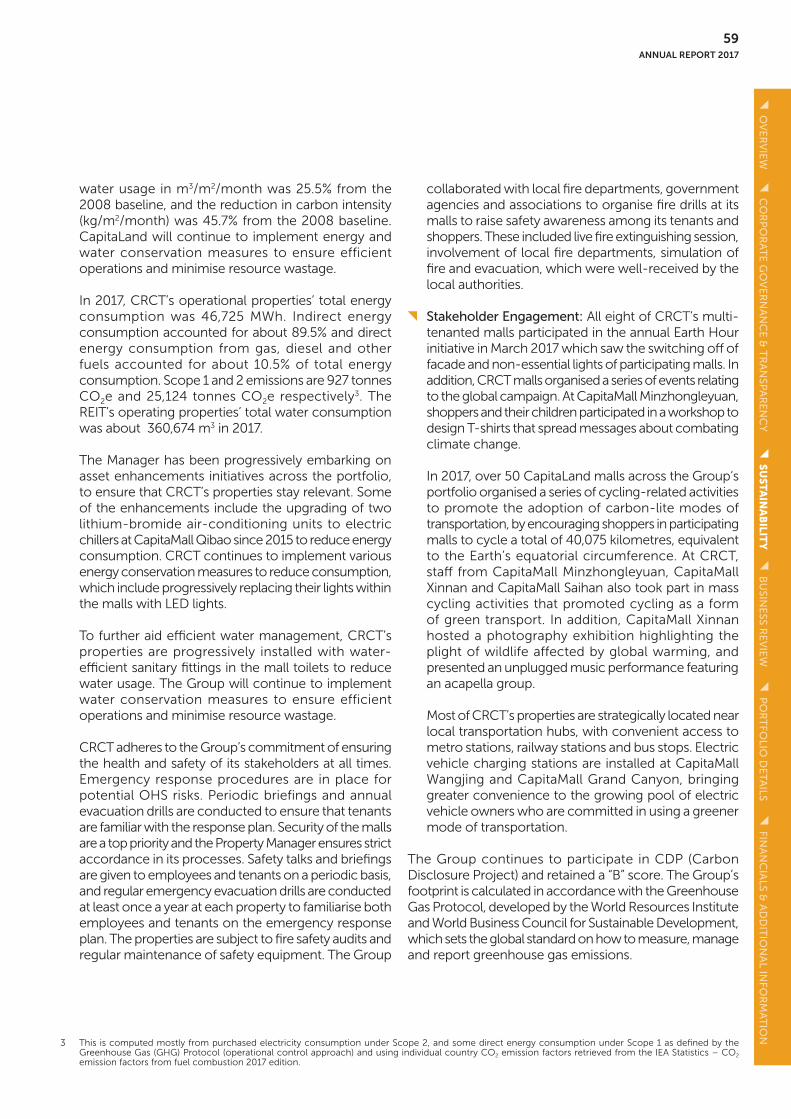
ANNUAL REPORT 2017
59
3 This is computed mostly from purchased electricity consumption under Scope 2, and some direct energy consumption under Scope 1 as defined by the Greenhouse Gas (GHG) Protocol (operational control approach) and using individual country CO2 emission factors retrieved from the IEA Statistics – CO2
emission factors from fuel combustion 2017 edition.
water usage in m3/m2/month was 25.5% from the 2008 baseline, and the reduction in carbon intensity (kg/m2/month) was 45.7% from the 2008 baseline. CapitaLand will continue to implement energy and water conservation measures to ensure efficient operations and minimise resource wastage.
In 2017, CRCT’s operational properties’ total energy consumption was 46,725 MWh. Indirect energy consumption accounted for about 89.5% and direct energy consumption from gas, diesel and other fuels accounted for about 10.5% of total energy consumption. Scope 1 and 2 emissions are 927 tonnes CO2e and 25,124 tonnes CO2e respectively3. The REIT’s operating properties’ total water consumption was about 360,674 m3 in 2017.
The Manager has been progressively embarking on asset enhancements initiatives across the portfolio, to ensure that CRCT’s properties stay relevant. Some of the enhancements include the upgrading of two lithium-bromide air-conditioning units to electric chillers at CapitaMall Qibao since 2015 to reduce energy consumption. CRCT continues to implement various energy conservation measures to reduce consumption, which include progressively replacing their lights within the malls with LED lights.
To further aid efficient water management, CRCT’s properties are progressively installed with water- efficient sanitary fittings in the mall toilets to reduce water usage. The Group will continue to implement water conservation measures to ensure efficient operations and minimise resource wastage.
CRCT adheres to the Group’s commitment of ensuring the health and safety of its stakeholders at all times. Emergency response procedures are in place for potential OHS risks. Periodic briefings and annual evacuation drills are conducted to ensure that tenants are familiar with the response plan. Security of the malls are a top priority and the Property Manager ensures strict accordance in its processes. Safety talks and briefings are given to employees and tenants on a periodic basis, and regular emergency evacuation drills are conducted at least once a year at each property to familiarise both employees and tenants on the emergency response plan. The properties are subject to fire safety audits and regular maintenance of safety equipment. The Group
collaborated with local fire departments, government agencies and associations to organise fire drills at its malls to raise safety awareness among its tenants and shoppers. These included live fire extinguishing session, involvement of local fire departments, simulation of fire and evacuation, which were well-received by the local authorities.
Stakeholder Engagement: All eight of CRCT’s multi-tenanted malls participated in the annual Earth Hour initiative in March 2017 which saw the switching off of facade and non-essential lights of participating malls. In addition, CRCT malls organised a series of events relating to the global campaign. At CapitaMall Minzhongleyuan, shoppers and their children participated in a workshop to design T-shirts that spread messages about combating climate change.
In 2017, over 50 CapitaLand malls across the Group‘s portfolio organised a series of cycling-related activities to promote the adoption of carbon-lite modes of transportation, by encouraging shoppers in participating malls to cycle a total of 40,075 kilometres, equivalent to the Earth’s equatorial circumference. At CRCT, staff from CapitaMall Minzhongleyuan, CapitaMall Xinnan and CapitaMall Saihan also took part in mass cycling activities that promoted cycling as a form of green transport. In addition, CapitaMall Xinnan hosted a photography exhibition highlighting the plight of wildlife affected by global warming, and presented an unplugged music performance featuring an acapella group.
Most of CRCT’s properties are strategically located near local transportation hubs, with convenient access to metro stations, railway stations and bus stops. Electric vehicle charging stations are installed at CapitaMall Wangjing and CapitaMall Grand Canyon, bringing greater convenience to the growing pool of electric vehicle owners who are committed in using a greener mode of transportation.
The Group continues to participate in CDP (Carbon Disclosure Project) and retained a “B” score. The Group’s footprint is calculated in accordance with the Greenhouse Gas Protocol, developed by the World Resources Institute and World Business Council for Sustainable Development, which sets the global standard on how to measure, manage and report greenhouse gas emissions.
FIN
AN
CIA
LS & A
DD
ITIO
NA
L INFO
RM
AT
ION
P
OR
TFO
LIO D
ETA
ILS
BU
SINE
SS RE
VIE
W
SU
ST
AIN
AB
ILITY
C
OR
PO
RA
TE
GO
VE
RN
AN
CE
& T
RA
NSP
AR
EN
CY
O
VE
RV
IEW

OPERATIONS REVIEW
Committed Occupancy Rates
As at 31 December 20171
%As at 31 December 20161
%
Multi-Tenanted Malls
CapitaMall Xizhimen 98.2 97.8
CapitaMall Wangjing 98.4 99.6
CapitaMall Grand Canyon 98.5 96.6
CapitaMall Xinnan 99.0 98.2
CapitaMall Qibao 94.6 94.1
CapitaMall Saihan 99.9 100.0
Malls under Stabilisation2
CapitaMall Minzhongleyuan 78.0 93.6
CapitaMall Wuhu 69.7 64.4
Master-Leased Malls
CapitaMall Erqi 100.0 100.0
CapitaMall Shuangjing 100.0 100.0
CRCT Portfolio 95.4 95.9
1 Based on committed leases.2 Impacted by ongoing tenant mix adjustments.
Shopper Traffic1
2017Million
2016Million
Multi-Tenanted Malls
CapitaMall Xizhimen 35.0 38.5
CapitaMall Wangjing 11.6 11.1
CapitaMall Grand Canyon 10.3 10.5
CapitaMall Xinnan2 8.5 1.3
CapitaMall Qibao 13.3 15.1
CapitaMall Saihan 9.4 9.3
Malls under Stabilisation
CapitaMall Minzhongleyuan 5.0 2.6
CapitaMall Wuhu 2.6 2.9
CRCT Portfolio 95.7 91.3
1 Master-leased malls CapitaMall Erqi and CapitaMall Shuangjing do not have traffic counters.2 Traffic figures for CapitaMall Xinnan in 2016 have been restated for comparative purposes.
60CAPITALAND RETAIL CHINA TRUST

Lease Expiry ProfileCapitaMall Erqi and the majority of the Gross Rentable Area (GRA) of CapitaMall Shuangjing are let out under master leases. The master leases are long-term with a typical tenure of 20 years which help to ensure stable cash flows. For tenants which are not under master leases, the typical lease term is 15 to 20 years for anchor tenants, five
to seven years for mini-anchor tenants and up to three years for specialty tenants. For new and renewed leases which commenced in FY 2017, the weighted average lease expiry based on the date of commencement of the leases is 3.28 years (by total rental income) and accounts for 37% of the total rental income for the month of December 2017.
Number ofNew Leases/Renewals in
FY2017 1, 2
VarianceOver
PrecedingRental 3, 4
%
CapitaMall Xizhimen 120 7.7
CapitaMall Wangjing 85 6.5
CapitaMall Grand Canyon 97 (2.6)5
CapitaMall Xinnan 101 3.1
CapitaMall Qibao 64 4.6
CapitaMall Saihan 123 10.2
CapitaMall Minzhongleyuan 25 22.5
CRCT Portfolio6 616 5.6
1 Excludes new leases at newly created units, short term renewals (<1 year), units vacant for >= 1 year and pre-terminated leases.2 Includes reconfigured units.3 Excludes turnover rent component.4 Majority of leases have rental escalation clauses.5 Due to a strategic lease initiative entered in 1Q 2017. Excluding this initiative, rental reversion of CapitaMall Grand Canyon in FY 2017 would have increased 0.7%
and portfolio rental reversion would have increased 6.1%.6 Includes the lease of a small unit (20 sq m) at CapitaMall Wuhu.
New Leases and Renewals
1,7131,746
1,836 1,839
1,733 1,7471,7421,708
1Q 2Q 4Q3Q Full Year
1,7111,671
Portfolio Tenants’ Sales (RMB per square metre per month)1
2016 2017
1 Based on tenants’ sales (excluding Department Stores and Supermarkets) from CapitaMall Xizhimen, CapitaMall Wangjing, CapitaMall Grand Canyon, CapitaMall Qibao, CapitaMall Xinnan, CapitaMall Saihan, CapitaMall Minzhongleyuan and CapitaMall Wuhu. Prior year’s numbers have been restated for comparative purposes.
FIN
AN
CIA
LS & A
DD
ITIO
NA
L INFO
RM
AT
ION
P
OR
TFO
LIO D
ETA
ILS
BU
SIN
ES
S R
EV
IEW
SU
STAIN
AB
ILITY
C
OR
PO
RA
TE
GO
VE
RN
AN
CE
& T
RA
NSP
AR
EN
CY
O
VE
RV
IEW
ANNUAL REPORT 2017
61

OPERATIONS REVIEW
Weighted Average Lease Expiry by Mall (As at 31 December 2017)
Weighted Expiry(by Total Rental Income)
Years
Weighted Expiry(by Net Lettable Area (NLA))
Years
CapitaMall Xizhimen 2.1 4.2
CapitaMall Wangjing 2.5 5.3
CapitaMall Grand Canyon 3.8 7.2
CapitaMall Xinnan 2.3 3.4
CapitaMall Qibao 2.3 3.7
CapitaMall Saihan 2.5 5.2
CapitaMall Minzhongleyuan 2.7 3.2
CapitaMall Wuhu 2.4 2.5
CapitaMall Erqi 8.9 8.9
CapitaMall Shuangjing 5.5 6.1
CRCT Portfolio 3.0 5.5
Lease Expiry Profile For 2018 By Mall (As at 31 December 2017)
No. of leases1
NLA Total Rental Income/month
sq m % of Total2 RMB'000 % of Total3
CapitaMall Xizhimen 132 11,526 22.8 8,863 38.6
CapitaMall Wangjing 106 8,052 15.6 6,068 32.5
CapitaMall Grand Canyon 59 5,722 12.5 2,374 23.1
CapitaMall Xinnan 74 7,031 19.5 2,716 26.9
CapitaMall Qibao 75 6,980 13.6 2,504 32.2
CapitaMall Saihan 125 8,012 25.8 2,386 48.7
CapitaMall Minzhongleyuan 97 9,178 39.4 1,064 50.1
CapitaMall Wuhu 35 4,061 11.3 121 18.7
CapitaMall Shuangjing 2 507 1.0 288 7.5
1 Based on all committed leases as at 31 December 2017. 2 As a percentage of each mall’s total net lettable area as at 31 December 2017. 3 As a percentage of total rental income of each mall for the month of December 2017.
2018 2019 2021 2022 Beyond 20222020
23.6
6.4 4.1
18.616.4
30.9
Portfolio Lease Expiry Profile (%) (As at 31 December 2017)
% of Total Committed NLA as at 31 December 2017% of Total Income for the month of December 2017
9.1 7.8 3.6
56.8
9.013.7
62CAPITALAND RETAIL CHINA TRUST

Turnover RentCRCT’s favourable lease structure provides Unitholders with a stable and growing rental cash flow. Most of the leases for the anchor, mini-anchor and specialty tenants have an annual step-up in the base rent. In addition, most of the leases also contain provisions for rent to be payable at the applicable base rent or at a percentage of sales turnover, whichever is higher. The combination of direct point-of-sales systems and system link-up with tenants’
point-of-sales at CRCT’s malls allows tracking of tenants’ sales. The long-term master leases at CapitaMall Erqi and CapitaMall Shuangjing contain provisions for upside in rental through step-ups in the base rent. In addition, the master leases at CapitaMall Erqi provide further potential upside through a percentage of tenants’ sales turnover if the turnover exceeds an agreed threshold.
Trade Sector By Committed NLA (%) By Total Rental Income (%)
Fashion & Accessories 14.1 31.2 Food & Beverage 12.9 25.5 Supermarket 27.8 7.6 Beauty & Healthcare 3.5 7.2 Department Store 21.3 6.0 Education 3.1 3.4 Sundry & Services 2.3 3.4 Shoes & Bags 1.1 3.3 Sporting Goods & Apparel 1.8 2.9 Houseware & Furnishings 4.5 2.7 Leisure & Entertainment 5.8 2.6 Jewellery / Watches / Pens 0.4 1.7 Others 1.0 1.4 Information & Technology 0.4 1.1
% of Committed Leases with Turnover Rent Provisions by Total Rental Income (As at 31 December 2017)
% of committed leases with turnover rent provisions 85.8% % of committed leases without turnover rent provisions 14.2%
% of Committed Leases with Turnover Rent Provisions by NLA (As at 31 December 2017)
% of committed leases with turnover rent provisions 68.1% % of committed leases without turnover rent provisions 31.9%
Trade Sector Analysis (As at 31 December 2017)
By Committed NLA By Total Rental Income
FIN
AN
CIA
LS & A
DD
ITIO
NA
L INFO
RM
AT
ION
P
OR
TFO
LIO D
ETA
ILS
BU
SIN
ES
S R
EV
IEW
SU
STAIN
AB
ILITY
C
OR
PO
RA
TE
GO
VE
RN
AN
CE
& T
RA
NSP
AR
EN
CY
O
VE
RV
IEW
ANNUAL REPORT 2017
63

OPERATIONS REVIEW
1 Tenants that are under the same group of companies are listed together.2 Some of the tenants have signed more than one tenancy agreement, hence the different lease expiry dates.
OPERATIONS REVIEW
Tenant1 Brand Name Trade SectorLease
Expiry2
NLAsq m
Committed NLA
%
Total Rental
Income%
BHG(北京)百货有限公司 Beijing Hualian Department Store
Department Store
Nov/2026Sep/2028Jun/2029
137,093 30.6 10.6
北京华联综合超市股份有限公司
北京华联呼和浩特金宇综合超市有限公司
Beijing Hualian Supermarket
Supermarket
华联咖世家(北京)餐饮管理有限公司
Costa Coffee Food & Beverage
Dec/2018Oct/2019Sep/2020
北京家乐福商业有限公司 Carrefour Supermarket Jan/2024Mar/2024Dec/2030
60,077 13.4 4.9
上海联家超市有限公司
绫致时装(天津)有限公司 Only Jack & Jones Vero ModaSelected
Fashion & Accessories
Mar/2018Apr/2018Oct/2018Nov/2018Dec/2018Jan/2019Apr/2019
May/2019Aug/2019Jan/2020Jun/2020May/2023
5,658 1.3 4.0
TOP 10 TENANTS (Based on percentage of Total Rental Income in the month of December 2017)
The portfolio's biggest tenant is the Beijing Hualian Group (BHG) which operates the master-leased Beijing Hualian Department Store at CapitaMall Erqi. It is also the anchor tenant at CapitaMall Xizhimen, CapitaMall Wangjing and CapitaMall Saihan.
64CAPITALAND RETAIL CHINA TRUST

TOP 10 TENANTS (Based on percentage of Total Rental Income in the month of December 2017)
Tenant1 Brand Name Trade SectorLease
Expiry2
NLAsq m
Committed NLA
%
Total Rental
Income%
优衣库商贸有限公司 UNIQLO Fashion & Accessories
Nov/2018Mar/2019 Aug/2020Apr/2021
Aug/2023May/2024
7,680 1.7 2.4
迅销(中国)商贸有限公司
北京百安居装饰建材有限公司 B&Q Houseware & Furnishings
Apr/2024 17,395 3.9 1.6
北京为之味餐饮有限公司 夹拣成厨麻辣烫川成元麻辣香锅金汤玉线寻味香港姑姑家宴姑姑宴
Food & Beverage
Mar/2018Sep/2018Oct/2018Nov/2018 Aug/2019Oct/2019
May/2020Nov/2021 May/2022
1,979 0.4 1.5
富迪康(北京)餐饮管理有限 公司
北京崇德商贸有限公司 BeLLE(百丽)STACCATO(思加图)Bell/teemix
Shoes & Bags Mar/2018Apr/2019Jun/2019
1,665 0.4 1.1
adidas Aug/2019May/2020
Sporting Goods & Apparel
北京尚品宅配家居用品有限 公司
尚品宅配 Houseware & Furnishings
Feb/2018Dec/2018Apr/2020Sep/2020
1,502 0.3 0.9
上海尚东家居用品有限公司
北京联郡餐饮管理有限公司 南京大牌档 Food & Beverage
Feb/2023Jun/2024Oct/2024
3,043 0.7 0.9
北京尚岑服饰有限公司 ochirly(欧时力)FIVE PLUS(5+)
Fashion & Accessories
Oct/2018Nov/2018
774 0.2 0.9
FIN
AN
CIA
LS & A
DD
ITIO
NA
L INFO
RM
AT
ION
P
OR
TFO
LIO D
ETA
ILS
BU
SIN
ES
S R
EV
IEW
SU
STAIN
AB
ILITY
C
OR
PO
RA
TE
GO
VE
RN
AN
CE
& T
RA
NSP
AR
EN
CY
O
VE
RV
IEW
ANNUAL REPORT 2017
65

FINANCIAL REVIEWIn RMB terms, FY 2017’s gross revenue for the portfolio was RMB1.1 billion, an increase of 9.2% over FY 2016. This was mainly due to the full year contribution from CapitaMall Xinnan in FY 2017 and rental growth from most of the multi-tenanted malls. This was partially offset by the
loss of contribution from CapitaMall Anzhen with effect from 1 July 2017. In SGD terms, FY 2017’s gross revenue increased by S$14.8 million, or 6.9%. The increase is lower than in RMB terms due to stronger average SGD against RMB during the financial year.
Gross Revenue by Property FY 20171 FY 20162 % FY 20171 FY 20162 %
S$'000 S$'000 Change RMB'000 RMB'000 Change
Multi-Tenanted Malls
CapitaMall Xizhimen 58,800 58,343 0.8 287,911 279,633 3.0
CapitaMall Wangjing 45,851 44,642 2.7 224,505 213,969 4.9
CapitaMall Grand Canyon 29,534 29,161 1.3 144,612 139,768 3.5
CapitaMall Xinnan3 26,765 5,747 N.M. 131,053 27,545 N.M.
CapitaMall Qibao 20,348 21,990 (7.5) 99,631 105,395 (5.5)
CapitaMall Saihan 13,083 13,076 0.1 64,061 62,670 2.2
Subtotal 194,381 172,959 12.4 951,773 828,980 14.8
Malls under Stabilisation4
CapitaMall Minzhongleyuan 5,440 2,571 N.M. 26,638 12,324 N.M.
CapitaMall Wuhu 1,783 1,954 (8.8) 8,732 9,367 (6.8)
Total 201,604 177,484 13.6 987,143 850,671 16.0
Master-Leased Malls
CapitaMall Anzhen5 8,149 16,945 (51.9) 39,849 81,218 (50.9)
CapitaMall Erqi 10,088 10,437 (3.3) 49,397 50,021 (1.2)
CapitaMall Shuangjing 9,349 9,506 (1.7) 45,775 45,563 0.5
Total 27,586 36,888 (25.2) 135,021 176,802 (23.6)
Total Gross Revenue 229,190 214,372 6.9 1,122,164 1,027,473 9.2
66CAPITALAND RETAIL CHINA TRUST

Gross Revenue Contribution by Property FY 20171 FY 20162
% %
Multi-Tenanted Malls
CapitaMall Xizhimen 25.6 27.2
CapitaMall Wangjing 20.0 20.8
CapitaMall Grand Canyon 12.9 13.6
CapitaMall Xinnan3 11.7 2.7
CapitaMall Qibao 8.9 10.3
CapitaMall Saihan 5.7 6.1
Malls under Stabilisation
CapitaMall Minzhongleyuan 2.4 1.2
CapitaMall Wuhu 0.8 0.9
Master-Leased Malls
CapitaMall Anzhen 3.5 7.9
CapitaMall Erqi 4.4 4.9
CapitaMall Shuangjing 4.1 4.4
1 The financial year from 1 January 2017 to 31 December 2017. 2 The financial year from 1 January 2016 to 31 December 2016. 3 Includes contribution from CapitaMall Xinnan with effect from 1 October 2016.4 Impacted by ongoing tenant mix adjustments.5 Excludes contribution from CapitaMall Anzhen with effect from 1 July 2017 following the announcement on 27 July 2017 of the disposal of equity interest in
CapitaRetail Beijing Anzhen Real Estate Co., Ltd (“Anzhen SPV”) which held CapitaMall Anzhen.N.M. - not meaningful
FIN
AN
CIA
LS & A
DD
ITIO
NA
L INFO
RM
AT
ION
P
OR
TFO
LIO D
ETA
ILS
BU
SIN
ES
S R
EV
IEW
SU
STAIN
AB
ILITY
C
OR
PO
RA
TE
GO
VE
RN
AN
CE
& T
RA
NSP
AR
EN
CY
O
VE
RV
IEW
ANNUAL REPORT 2017
67

FINANCIAL REVIEWIn RMB terms, FY 2017’s NPI for the portfolio was RMB730.6 million, an increase of 9.1% over FY 2016. This was mainly due to the full year contribution from CapitaMall Xinnan and NPI growth from the multi-tenanted malls. This was partially offset by the loss of contribution from CapitaMall
Anzhen with effect from 1 July 2017. In SGD terms, FY 2017’s NPI increased by S$9.5 million, or 6.8%. The increase is lower than in RMB terms due to stronger average SGD against RMB during the financial year.
NPI by Property FY 20171 FY 20162 % FY 20171 FY 20162 %
S$'000 S$'000 Change RMB'000 RMB'000 Change
Multi-Tenanted Malls
CapitaMall Xizhimen 41,005 40,859 0.4 200,779 195,837 2.5
CapitaMall Wangjing 32,363 31,991 1.2 158,465 153,330 3.3
CapitMall Grand Canyon 18,591 18,657 (0.4) 91,029 89,420 1.8
CapitaMall Xinnan3 18,327 3,168 N.M. 89,738 15,185 N.M.
CapitaMall Qibao 9,294 10,587 (12.2) 45,506 50,744 (10.3)
CapitaMall Saihan 7,910 7,470 5.9 38,730 35,805 8.2
Subtotal 127,490 112,732 13.1 624,247 540,321 15.5
Malls under Stabilisation4
CapitaMall Minzhongleyuan 263 (1,881) N.M. 1,286 (9,015) N.M.
CapitaMall Wuhu (1,374) (1,360) (1.0) (6,724) (6,520) (3.1)
Total 126,379 109,491 15.4 618,809 524,786 17.9
Master-Leased Malls
CapitaMall Anzhen5 6,710 13,919 (51.8) 32,813 66,713 (50.8)
CapitaMall Erqi 8,614 8,663 (0.6) 42,177 41,522 1.6
CapitaMall Shuangjing 7,509 7,665 (2.0) 36,768 36,738 0.1
Total 22,833 30,247 (24.5) 111,758 144,973 (22.9)
Total 149,212 139,738 6.8 730,567 669,759 9.1
68CAPITALAND RETAIL CHINA TRUST

NPI Contribution by Property FY 20171 FY 20162
% %
Multi-Tenanted Malls
CapitaMall Xizhimen 27.4 29.2
CapitaMall Wangjing 21.7 22.9
CapitaMall Grand Canyon 12.5 13.4
CapitaMall Xinnan3 12.3 2.3
CapitaMall Qibao 6.2 7.5
CapitaMall Saihan 5.3 5.3
Malls under Stabilisation
CapitaMall Minzhongleyuan 0.2 (1.3)
CapitaMall Wuhu (0.9) (1.0)
Master-Leased Malls
CapitaMall Anzhen 4.5 10.0
CapitaMall Erqi 5.8 6.2
CapitaMall Shuangjing 5.0 5.5
1 The financial year from 1 January 2017 to 31 December 2017. 2 The financial year from 1 January 2016 to 31 December 2016. 3 Includes contribution from CapitaMall Xinnan with effect from 1 October 2016.4 Impacted by ongoing tenant mix adjustments.5 Excludes contribution from CapitaMall Anzhen with effect from 1 July 2017 following the announcement on 27 July 2017 of the disposal of equity interest in
Anzhen SPV which held CapitaMall Anzhen.N.M. - not meaningful
FIN
AN
CIA
LS & A
DD
ITIO
NA
L INFO
RM
AT
ION
P
OR
TFO
LIO D
ETA
ILS
BU
SIN
ES
S R
EV
IEW
SU
STAIN
AB
ILITY
C
OR
PO
RA
TE
GO
VE
RN
AN
CE
& T
RA
NSP
AR
EN
CY
O
VE
RV
IEW
ANNUAL REPORT 2017
69

FINANCIAL REVIEW
VALUATION AND PROPERTY YIELD OF PORTFOLIO
Valuation 20171
Valuation 2016
Valuation 2017
Property Yield 20171
Valuation 2017
Valuation 2016
(in per sq m of GRA)
RMB Million
RMB Million
RMB % S$ Million
S$ Million
Multi-Tenanted Malls
CapitaMall Xizhimen 3,075 2,951 37,015 6.5 627.1 610.3
CapitaMall Wangjing 2,375 2,285 34,921 6.7 484.3 472.6
CapitaMall Grand Canyon 2,090 2,068 29,871 4.4 426.2 427.7
CapitaMall Xinnan 1,536 1,527 28,647 5.8 313.2 315.8
CapitaMall Qibao 495 495 6,806 9.2 100.9 102.4
CapitaMall Saihan 456 445 10,873 8.5 93.0 92.0
Malls under Stabilisation
CapitaMall Minzhongleyuan 528 525 14,091 0.2 107.7 108.6
CapitaMall Wuhu2 193 207 4,229 N.M. 39.4 42.8
Master-Leased Malls
CapitaMall Anzhen - 1,001 - - - 206.9
CapitaMall Erqi 638 631 6,908 6.6 130.1 130.5
CapitaMall Shuangjing 583 573 11,787 6.3 118.9 118.5
Total 11,969 12,708 6.02 2,440.8 2,628.1
1 Property yield is calculated based on NPI for FY 2017 and the valuation as at 31 December 2017. 2 Excludes CapitaMall Wuhu’s yield as the mall operated at negative NPI in FY 2017 as it was currently undergoing tenant mix adjustments.N.M. - not meaningful
S$'000
Investment Properties as at 31 December 2017 2,441,0241
Increase in valuation for FY 2017 41,457
1 The carrying amount of the investment properties includes the valuation of the 10 retail malls and the carrying amount of CapitaMall Minzhongleyuan’s three residential units, and excludes CapitaMall Anzhen which was divested with effect from 1 July 2017.
70CAPITALAND RETAIL CHINA TRUST

CAPITALMANAGEMENTAs at 31 December 2017, CRCT maintains the following debt facilities:
S$ Denominated Facilities S$151.0 million money market line facilities S$100.0 million three-year trust term loan facilities S$250.0 million four-year trust term loan facilities S$400.0 million five-year trust term loan facilities
US$ Denominated Facilities US$70.0 million money market line facilities
Multicurrency Medium Term Notes (MTN) S$1.0 billion multicurrency MTN programme
CRCT has sufficient untapped facilities which include S$1.0 billion from the MTN Programme and money market line facilities of S$151.0 million and US$70.0 million. Current aggregate leverage for CRCT is at 28.4% (below the Monetary Authority of Singapore’s (“MAS”) requirement of 45% with effect from 1 January 2016) with a total outstanding debt of S$750.0 million.
CRCT’s effective capital management includes hedging of its currency and interest rate risk exposures. Other than the natural hedge where loans were borrowed in RMB, CRCT also hedges its non-RMB denominated loans. This provides a currency match against CRCT’s assets which are predominately denominated in RMB. However, CRCT does not hedge the equity largely denominated in RMB as it is of the view that such equity investments are long term. CRCT will hedge the RMB cash flow from
operations if it can be determined with certainty the exact timing in which they will be remitted back to Singapore for distribution purpose. As at 31 December 2017, CRCT hedged 50.0% of its non-RMB denominated term loans through non-deliverable forwards (“NDF”) with notional amount of S$375.0 million.
The fair value derivatives as at 31 December 2017, which were included as financial derivatives in total assets and total liabilities were S$0.4 million and S$7.8 million respectively. This net amount represented a negative 0.5% of the net assets of CRCT as at 31 December 2017.
In September 2017, CRCT successfully refinanced the term loans matured in 2017 and kept the overall average cost of debt at 2.48%.
FIN
AN
CIA
LS & A
DD
ITIO
NA
L INFO
RM
AT
ION
P
OR
TFO
LIO D
ETA
ILS
BU
SIN
ES
S R
EV
IEW
SU
STAIN
AB
ILITY
C
OR
PO
RA
TE
GO
VE
RN
AN
CE
& T
RA
NSP
AR
EN
CY
O
VE
RV
IEW
ANNUAL REPORT 2017
71

CAPITAL MANAGEMENTDebt maturity each year as a percentage of total outstanding debt as at 31 December 2017 is as follows:
Debt Maturity Profile (S$ million) (As at 31 December 2017)
Total Debt1 (S$million)
% of Outstanding Debt
There is no loan due for refinancing in FY 2018.
1 Total debt excluding interest and upfront fees.2 Comprises multiple term loans drawn in Singapore at the Trust level, these include fixed and/or floating term loan facilities.
2019
150.0
20.0%
2020
100.0
13.3%
Total Debt
750.0
100.0%
800
700
600
500
400
300
200
100
0
2021
200.0
26.7%
2022
100.0
13.3%
2023
200.0
26.7%
Fixed RateVariable RateTrust - Unsecured Offshore Term Loan2
20.0%
80.0%
150.0100.0 100.0
200.0 200.0
Cash Flows and LiquidityCRCT takes a proactive role in monitoring its cash and liquid reserves to ensure adequate funding is available for distributions to the Unitholders as well as to meet any short-term liabilities.
Operating Activities Operating net cash flow for the FY 2017 was S$116.3 million, a decrease of S$3.6 million over the operating cash flow of S$119.9 million in the preceding financial year.
Investing Activities CRCT adheres to stringent criteria when evaluating potential acquisitions. This involves a thorough review of risks and returns and to overall add value to the existing portfolio and future growth expectations. CRCT will constantly look out for new acquisition opportunities.
72CAPITALAND RETAIL CHINA TRUST

Financing Activities CRCT continues to adopt a prudent and proactive approach in monitoring the cash position and level of borrowings to ensure a healthy cash position to finance its operations. CRCT can tap on its current available debt headroom or new capital market to facilitate any new acquisitions.
Cash and Cash Equivalents As at 31 December 2017, the value of the cash and cash equivalents at CRCT stood at S$186.5 million compared with S$136.1 million as at 31 December 2016. The increase is mainly due to higher operating profits from the malls during the year.
During the year, S$41.4 million of the cash retained from our distributions through the distribution reinvestment plan on 23 March 2017 and 20 September 2017 were used to repay CapitaMall Grand Canyon’s RMB denominated and the Trust’s interest bearing borrowings. On 7 December 2017, 98.8% of the net proceeds of $101.7 million received from the private placement were used as follows: (i) $25.5 million (25.1% of the net proceeds) to pay CRCT’s 51.0% share of the initial deposit for the joint acquisition of Rock Square in Guangzhou, China; and (ii) $75 million (73.7% of the net proceeds) to repay the Trust’s interest bearing borrowings1. Such use is in accordance with the stated use and allocation of proceeds in the announcement dated 29 November 2017.
Unencumbered Assets as % of Total Assets 100.0%
Aggregate Leverage2 28.4%
Net Debt / EBITDA (times)3 5.5
Interest Coverage (times)4 5.8
Average Term to Maturity (Years) 3.37
Average Cost of Debt5 2.48%
1 These funds were subsequently fully applied towards completion of the joint acquisition of Rock Square, as announced on 31 January 2018.2 Aggregate Leverage is calculated based on total outstanding debts over the total assets. Total assets included the hedging effects on the net assets
denominated in Renminbi (“RMB”).3 Net Debt comprises gross debt less transaction costs and EBITDA refers to earnings before interest, tax, depreciation and amorisation excluding change in
fair value of financial derivatives, investment properties and unrealised foreign exchange gain or loss.4 Ratio of net income before change in fair value of financial derivative, investment properties and unrealised foreign exchange gain or loss at CRCT Group over
interest expense from FY 2017.5 Total interest expense over weighted average borrowings.
Key Financial Indicators (As at 31 December 2017)
FIN
AN
CIA
LS & A
DD
ITIO
NA
L INFO
RM
AT
ION
P
OR
TFO
LIO D
ETA
ILS
BU
SIN
ES
S R
EV
IEW
SU
STAIN
AB
ILITY
C
OR
PO
RA
TE
GO
VE
RN
AN
CE
& T
RA
NSP
AR
EN
CY
O
VE
RV
IEW
ANNUAL REPORT 2017
73

PORTFOLIO SUMMARY
1 Independent valuations of CapitaMall Xizhimen and CapitaMall Minzhongleyuan were conducted by Colliers International (Hong Kong) Limited. Independent valuations of CapitaMall Wangjing and CapitaMall Erqi were conducted by Cushman & Wakefield International Property Advisers. Independent valuations of CapitaMall Grand Canyon, CapitaMall Xinnan, CapitaMall Qibao and CapitaMall Wuhu were conducted by Savills Valuation &
Professional Services (S) Pte Ltd. Independent valuation of CapitaMall Shuangjing was conducted by Knight Frank Petty Limited. Independent valuation of CapitaMall Saihan was conducted by CBRE Limited.2 Refers to the completion of the acquisition of the special purpose vehicles which own the properties.3 Master-leased malls CapitaMall Erqi and CapitaMall Shuangjing do not have traffic counters. 4 CapitaMall Qibao is indirectly held by CRCT under a master lease with Shanghai Jin Qiu (Group) Co., Ltd, the legal owner of Qibao Mall. The master lease
expires in January 2024, with the right to renew for a further term of 19 years and two months. Accordingly, the land use right is owned by the legal owner.
Name Address
GFA(sq m)
(as at 31 December
2017)
GRA(sq m)
(as at 31 December
2017)
NLA(sq m)
(as at 31 December
2017)
Number of Leases
(as at 31 December
2017)Land Use
Right Expiry
Market Valuation1
(as at 31 December
2017)(RMB Million)
Purchase Price (RMB
Million) Acquisition Date2
Committed Occupancy Rate
(as at 31 December
2017)
Shopper Traffic
for 20173
(Million) Major Tenants
Gross Revenue for 2017
(RMB Million)
NPI for 2017 (RMB
Million)
CapitaMall Xizhimen凯德MALL•西直门
No. 1 Xizhimenwai Road, Xicheng District, Beijing
83,075 83,075 50,452 247 23 August 204423 August 2054
3,075.0 1,851.4 Phase 1:5 February 2008
Phase 2:29 September 2008
98.2% 35.0 Beijing Hualian Supermarket, Costa Coffee, Vero Moda, Only, Selected, Jack & Jones, UNIQLO, 为之味(夹拣成厨麻辣烫, 金汤玉线, "川成元"麻辣香锅, 姑姑家宴), GAP, 南京大牌档, 绿茶
287.9 200.8
CapitaMall Wangjing凯德MALL•望京
No. 33 Guangshun North Road, Chaoyang District, Beijing
83,768 68,010 51,554 217 15 May 204315 May 2053
2,375.0 1,102.0 1 December 2006 98.4% 11.6 Beijing Hualian Group (Department Store & Supermarket), UNIQLO, Vero Moda, Only, Selected, Jack & Jones, 为之味(夹拣成厨麻辣烫, 金汤玉线, 川成元麻辣香锅, 姑姑宴), ZARA, 南京大牌档
224.5 158.5
CapitaMall Grand Canyon凯德MALL• 大峡谷
No. 16 South Third Ring West Road, Fengtai District, Beijing
92,918 69,967 45,805 151 29 Aug 204429 Aug 2054
2,090.0 1,740.0 30 December 2013 98.5% 10.3 Carrefour, Poly Cinema, H&M, GAP, Vero Moda, Only, Selected, Jack & Jones, 南京大牌档
144.6 91.0
CapitaMall Xinnan凯德广场•新南
No. 99, Shenghe Yi Road, Gaoxin District, Chengdu, Sichuan Province
91,816 53,619 36,074 209 17 October 2047 1,536.0 1,500.0 30 September 2016 99.0% 8.5 Golden Harvest Cinema, UNIQLO, H&M, ZARA, Selected, Jack & Jones, Swarovski, Sephora
131.1 89.7
CapitaMall Qibao凯德七宝购物广场
No. 3655, Qixin Road, Minhang District, Shanghai
83,986 72,729 51,243 162 10 March 20434 495.0 264.0 8 November 2006 94.6% 13.3 七宝大光明影城 (Cinema), Carrefour, UNIQLO, Bao Da Xiang Shopping For Kids, Haoledi (KTV)
99.6 45.5
CapitaMall Saihan凯德MALL•赛罕
No. 26 Ordos Street, Saihan District, Hohhot, Inner Mongolia Autonomous Region
41,938 41,938 31,032 193 11 March 204120 March 2041
456.0 315.0 1 December 2006 99.9% 9.4 Beijing Hualian Supermarket, Jinyi Cinema, Nike, UNIQLO, Vero Moda, Only, Jack & Jones, BreadTalk
64.1 38.7
CapitaMall Minzhongleyuan6
凯德新民众乐园
No. 704 Zhongshan Avenue, Jianghan District, Wuhan, Hubei Province
41,717 37,472 23,318 116 30 June 20445
15 Sep 2045 528.0 395.0 30 June 2011 78.0% 5.0 UA Cinemas, UCommune, innisfree,
Starbucks, adidas Originals, Swatch26.6 1.3
CapitaMall Wuhu6
凯德广场•芜湖
No. 37 Zhongshan North Road, Jinghu District, Wuhu, Anhui Province
59,624 45,634 35,826 51 29 May 2044 193.0 130.0 8 November 2006 69.7% 2.6 Wal-Mart, KFC 8.7 (6.7)
CapitaMall Erqi凯德广场•二七
No. 3 Minzhu Road, Erqi District, Zhengzhou, Henan Province
92,356 92,356 92,356 2 31 May 2042 638.0 454.0 1 December 2006 100.0% - Beijing Hualian Department Store, Beijing Hualian Supermarket
49.4 42.2
CapitaMall Shuangjing凯德MALL•双井
No. 31 Guangqu Road, Chaoyang District, Beijing
49,463 49,463 51,1937 9 10 July 2042 583.0 414.0 1 December 2006 100.0% - Carrefour, B&Q, Paris Baguette 45.8 36.8
CapitaMall Anzhen8
凯德MALL•安贞
Building 4, Zone 5, Anzhenxili, Chaoyang District, Beijing
NA NA NA NA 7 October 20345 March 2042
3 June 2042
NA 772.0 8 November 2006 NA - Beijing Hualian Department Store 39.8 32.89
74CAPITALAND RETAIL CHINA TRUST

5 The conserved building is under a lease from the Wuhan Cultural Bureau.6 CapitaMall Minzhongleyuan and CapitaMall Wuhu are impacted by ongoing tenant mix adjustments. 7 Includes the area zoned for civil defense but is certified for commercial use.8 CapitaMall Anzhen was divested on 14 September 2017.9 Excludes contribution from CapitaMall Anzhen with effect from 1 July 2017 following the announcement on 27 July 2017 of the disposal of equity interest
in Anzhen SPV which held CapitaMall Anzhen. NA - Not applicable
Name Address
GFA(sq m)
(as at 31 December
2017)
GRA(sq m)
(as at 31 December
2017)
NLA(sq m)
(as at 31 December
2017)
Number of Leases
(as at 31 December
2017)Land Use
Right Expiry
Market Valuation1
(as at 31 December
2017)(RMB Million)
Purchase Price (RMB
Million) Acquisition Date2
Committed Occupancy Rate
(as at 31 December
2017)
Shopper Traffic
for 20173
(Million) Major Tenants
Gross Revenue for 2017
(RMB Million)
NPI for 2017 (RMB
Million)
CapitaMall Xizhimen凯德MALL•西直门
No. 1 Xizhimenwai Road, Xicheng District, Beijing
83,075 83,075 50,452 247 23 August 204423 August 2054
3,075.0 1,851.4 Phase 1:5 February 2008
Phase 2:29 September 2008
98.2% 35.0 Beijing Hualian Supermarket, Costa Coffee, Vero Moda, Only, Selected, Jack & Jones, UNIQLO, 为之味(夹拣成厨麻辣烫, 金汤玉线, "川成元"麻辣香锅, 姑姑家宴), GAP, 南京大牌档, 绿茶
287.9 200.8
CapitaMall Wangjing凯德MALL•望京
No. 33 Guangshun North Road, Chaoyang District, Beijing
83,768 68,010 51,554 217 15 May 204315 May 2053
2,375.0 1,102.0 1 December 2006 98.4% 11.6 Beijing Hualian Group (Department Store & Supermarket), UNIQLO, Vero Moda, Only, Selected, Jack & Jones, 为之味(夹拣成厨麻辣烫, 金汤玉线, 川成元麻辣香锅, 姑姑宴), ZARA, 南京大牌档
224.5 158.5
CapitaMall Grand Canyon凯德MALL• 大峡谷
No. 16 South Third Ring West Road, Fengtai District, Beijing
92,918 69,967 45,805 151 29 Aug 204429 Aug 2054
2,090.0 1,740.0 30 December 2013 98.5% 10.3 Carrefour, Poly Cinema, H&M, GAP, Vero Moda, Only, Selected, Jack & Jones, 南京大牌档
144.6 91.0
CapitaMall Xinnan凯德广场•新南
No. 99, Shenghe Yi Road, Gaoxin District, Chengdu, Sichuan Province
91,816 53,619 36,074 209 17 October 2047 1,536.0 1,500.0 30 September 2016 99.0% 8.5 Golden Harvest Cinema, UNIQLO, H&M, ZARA, Selected, Jack & Jones, Swarovski, Sephora
131.1 89.7
CapitaMall Qibao凯德七宝购物广场
No. 3655, Qixin Road, Minhang District, Shanghai
83,986 72,729 51,243 162 10 March 20434 495.0 264.0 8 November 2006 94.6% 13.3 七宝大光明影城 (Cinema), Carrefour, UNIQLO, Bao Da Xiang Shopping For Kids, Haoledi (KTV)
99.6 45.5
CapitaMall Saihan凯德MALL•赛罕
No. 26 Ordos Street, Saihan District, Hohhot, Inner Mongolia Autonomous Region
41,938 41,938 31,032 193 11 March 204120 March 2041
456.0 315.0 1 December 2006 99.9% 9.4 Beijing Hualian Supermarket, Jinyi Cinema, Nike, UNIQLO, Vero Moda, Only, Jack & Jones, BreadTalk
64.1 38.7
CapitaMall Minzhongleyuan6
凯德新民众乐园
No. 704 Zhongshan Avenue, Jianghan District, Wuhan, Hubei Province
41,717 37,472 23,318 116 30 June 20445
15 Sep 2045 528.0 395.0 30 June 2011 78.0% 5.0 UA Cinemas, UCommune, innisfree,
Starbucks, adidas Originals, Swatch26.6 1.3
CapitaMall Wuhu6
凯德广场•芜湖
No. 37 Zhongshan North Road, Jinghu District, Wuhu, Anhui Province
59,624 45,634 35,826 51 29 May 2044 193.0 130.0 8 November 2006 69.7% 2.6 Wal-Mart, KFC 8.7 (6.7)
CapitaMall Erqi凯德广场•二七
No. 3 Minzhu Road, Erqi District, Zhengzhou, Henan Province
92,356 92,356 92,356 2 31 May 2042 638.0 454.0 1 December 2006 100.0% - Beijing Hualian Department Store, Beijing Hualian Supermarket
49.4 42.2
CapitaMall Shuangjing凯德MALL•双井
No. 31 Guangqu Road, Chaoyang District, Beijing
49,463 49,463 51,1937 9 10 July 2042 583.0 414.0 1 December 2006 100.0% - Carrefour, B&Q, Paris Baguette 45.8 36.8
CapitaMall Anzhen8
凯德MALL•安贞
Building 4, Zone 5, Anzhenxili, Chaoyang District, Beijing
NA NA NA NA 7 October 20345 March 2042
3 June 2042
NA 772.0 8 November 2006 NA - Beijing Hualian Department Store 39.8 32.89
FIN
AN
CIA
LS & A
DD
ITIO
NA
L INFO
RM
AT
ION
P
OR
TFO
LIO D
ET
AILS
B
USIN
ESS R
EV
IEW
SU
STAIN
AB
ILITY
C
OR
PO
RA
TE
GO
VE
RN
AN
CE
& T
RA
NSP
AR
EN
CY
O
VE
RV
IEW
ANNUAL REPORT 2017
75

G6
Jing
zang
Exp
y
N 3
rd R
ing
Rd
W
N 3rd Ring Rd Middle
Xitu
chen
g R
d
Xizh
imen
N St
W 4
th R
ing
Rd
N
N 4th Ring Rd W
N 2nd Ring Rd
Xizhimen Metro
Beijing Zoo Metro
Beijing Aquarium
Beijing Zoo
Beijing Jiaotong
University
Renmin University of China
Central University of Finance and
Economics
Weigongcun Metro
Maples International Shopping Center
Beijing North Railway
CAPITAMALL XIZHIMEN
Qinghuayuan Railway
Metro Line 2 Metro Line 4
Metro Line 5 Metro Line 8
Metro Line 9 Metro Line 10
Metro Line 13
PORTFOLIO DETAILSCAPITAMALL XIZHIMEN
CapitaMall Xizhimen is located at Xizhimen transportation hub which is well-served by Beijing’s metro lines 2, 4 and 13, as well as the Beijing North Railway Station. The mall enjoys a strategic location next to the Second Ring Road, and is well-supported by a large catchment of commuters passing through the busy transportation hub and middle-income residents within the vicinity. Positioned as a shopping destination for young and trendy fashionistas, the mall attracts working professionals and students from the nearby Beijing Financial Street, universities and technological zones of Zhongguancun District.
Map not drawn to scale
2019
15.2
23.5 22.5
19.6
9.2 9.2
3.1 3.1
26.1
6.0
20202018
23.9
38.6
2021 2022 Beyond 2022
Trade Sector
By Committed
NLA (%)
By Total RentalIncome (%)
Fashion & Accessories 25.5 37.3 Food & Beverage 30.9 31.3 Beauty & Healthcare 6.7 10.3 Education 7.2 4.4 Shoes & Bags 1.6 3.6 Supermarket 21.0 3.4 Sundry & Services 1.5 2.5 Jewellery / Watches / Pens 0.6 2.0 Others 1.7 1.7 Sporting Goods & Apparel 1.2 1.6 Houseware & Furnishings 1.0 1.0 Information & Technology 0.3 0.7 Leisure & Entertainment 0.8 0.2
By Committed NLA By Total Rental Income
Lease Expiry Profile (%) (As at 31 December 2017)
Trade Sector Analysis (For the month of December 2017)
% of Total Committed NLA% of Total Rental Income
76CAPITALAND RETAIL CHINA TRUST

CAPITAMALL WANGJING
Located in the densely populated residential suburb of Wangjing within Beijing’s Chaoyang District, CapitaMall Wangjing is a leading shopping mall catering to working professionals as well as the expatriate community. The mall is located next to Futong station which is served by metro Line 14, and in close proximity to Wangjing station which is the interchange station for metro lines 14 and 15. It is also easily accessible by key highways and well-served by numerous bus routes. A popular one-stop shopping, dining and entertainment destination in Wangjing, its stable of international tenants include Armani Exchange, Aigle, Calvin Klein, Miss Sixty, Pandora, Swarovski, Tommy Hilfiger, UNIQLO and ZARA.
Metro Line 14 Metro Line 15
Map not drawn to scale
2019
17.0
30.5
6.8
15.4
5.8 6.54.7
3.3
11.8
20202018
16.6
32.5
2021 2022 Beyond 2022
Trade Sector
By Committed
NLA (%)
By Total RentalIncome (%)
Fashion & Accessories 16.3 32.7 Food & Beverage 17.5 29.5 Beauty & Healthcare 6.8 8.8 Department Stores 29.3 8.3 Sundry & Services 4.6 5.7 Supermarket 18.1 2.7 Education 2.4 2.4 Jewellery / Watches / Pens 0.5 2.4 Others 1.9 2.1 Houseware & Furnishings 1.0 1.5 Shoes & Bags 0.5 1.5 Information & Technology 0.5 1.1 Leisure & Entertainment 0.4 0.7 Sporting Goods & Apparel 0.2 0.6
By Committed NLA By Total Rental Income
Beixiao River
Beixiao River
Beixiao R
iver
CAPITAMALL WANGJING
Futong Metro
Wangjing Metro
Wangjing Soho
Daimler Tower
Microsoft Tower
Beijing South Korea International
School
Wangjing Science and Technology Park
Lease Expiry Profile (%) (As at 31 December 2017)
Trade Sector Analysis (For the month of December 2017)
% of Total Committed NLA% of Total Rental Income
49.1
FIN
AN
CIA
LS & A
DD
ITIO
NA
L INFO
RM
AT
ION
P
OR
TFO
LIO D
ET
AILS
B
USIN
ESS R
EV
IEW
SU
STAIN
AB
ILITY
C
OR
PO
RA
TE
GO
VE
RN
AN
CE
& T
RA
NSP
AR
EN
CY
O
VE
RV
IEW
ANNUAL REPORT 2017
77

PORTFOLIO DETAILSCAPITAMALL GRAND CANYON
One of the pioneer shopping malls in South Beijing, CapitaMall Grand Canyon is located in Bejing’s Fengtai District. Facing the busy South Third Ring West road, the shopping mall is easily accessible from Majiapu station and Beijing South Railway Station. Well-established among the local community comprising offices and residences with its comprehensive offerings. Popular tenants include Carrefour, GAP, H&M, Nanjing Impressions, Poly Cinema and Xiaomi.
S 3rd Ring Rd W
S 3rd Ring Rd W
CAPITAMALL GRAND CANYON
Business Center
Residences
Beijing South Railway
Majiapu Metro
Cai
hu
yin
g S
Rd
Wanfangting Park
SchoolSchool
Capital Medical University
Hospital
Metro Line 4 Map not drawn to scale
2019
11.8
23.8
12.2
22.1
3.9 3.15.1 6.1
20202018
13.0
23.0
2021 2022 Beyond 2022
Trade Sector
By Committed
NLA (%)
By Total RentalIncome (%)
Fashion & Accessories 20.9 29.8 Food & Beverage 18.3 25.3 Supermarket 32.3 10.3 Leisure & Entertainment 12.7 6.8 Education 5.8 6.4 Sporting Goods & Apparel 3.3 6.2 Beauty & Healthcare 2.4 5.3 Shoes & Bags 1.2 3.1 Houseware & Furnishings 0.8 2.0 Information & Technology 0.9 2.0 Sundry & Services 0.5 1.7 Jewellery / Watches / Pens 0.3 0.6 Others 0.6 0.5
By Committed NLA By Total Rental Income
Lease Expiry Profile (%) (As at 31 December 2017)
Trade Sector Analysis (For the month of December 2017)
% of Total Committed NLA% of Total Rental Income
54.0
21.9
78CAPITALAND RETAIL CHINA TRUST

Trade Sector
By Committed
NLA (%)
By Total RentalIncome (%)
Fashion & Accessories 43.3 47.7 Food & Beverage 25.5 23.1 Shoes & Bags 2.7 6.5 Beauty & Healthcare 3.6 6.0 Sporting Goods & Apparel 5.9 5.4 Leisure & Entertainment 13.1 4.0 Jewellery / Watches / Pens 0.8 2.4 Others 3.2 2.3 Information & Technology 1.0 1.1 Sundry & Services 0.4 1.1 Education 0.5 0.3 Houseware & Furnishings1 0.0 0.1
CAPITAMALL XINNAN
The mall is located in Xinnan Tiandi retail precinct, one of the most established shopping belts in Chengdu. It also enjoys convenient access by key highways. CapitaMall Xinnan is in close proximity to a transportation hub and Chengdu South Railway Station, which is the interchange station for metro lines 1 and 7. Strategically situated in a mid-to high-end residential locality of Gaoxin District in the south of Chengdu, CapitaMall Xinnan appeals to urban young families and the growing affluent. Positioned as a trendy retail destination offering a wide range of fashion, F&B and entertainment options, the six-storey mall houses well-known international brands including Golden Harvest cinema, H&M, Sephora, Swarovski, UNIQLO and ZARA.
PO
RT
FOLIO
DE
TA
ILSP
OR
TFO
LIO D
ETA
ILS
Metro Line 1 Metro Line 7
Map not drawn to scale
Taihe 2nd St
Shenghe 3rd
Rd
Shenghe 2nd Rd Shenghe 1st Rd
Taihe 1st St
Ch
enghan N Rd Guanghe 2nd St Guanghe 1st St
Yizh
ou
Ave N
orth
Section
Tian
he W
est 2nd
St
Tian
hexi 1st St
S6 C
heng
du A
irport
Expy
(Toll r
oad)
S6 Chengdu Airport Expy (Toll road)
S 3rd Ring Rd 4th Section
S 3rd Ring Rd 4th Section
Middle Ring Rd Zirui Ave Section
Tian
fu A
ve No
rth Sectio
n
Du
hu
i Rd
Renaissance Chengdu
Hi-tech Sports Park Nanzhan Park
Ch
eng
han
N R
d
Xinle Rd
Xintiandi Retail Precinct
CAPITAMALL XINNAN
South Railway Metro
IKEA Decathlon
2019
23.4
31.3
19.5
23.9
4.35.1
8.76.6
24.1
6.2
20202018
20.0
26.9
2021 2022 Beyond 2022
By Committed NLA By Total Rental Income
Lease Expiry Profile (%) (As at 31 December 2017)
Trade Sector Analysis (For the month of December 2017)
% of Total Committed NLA% of Total Rental Income
1 Consists of a 10 sq m lease which accounts for 0.03% of the mall‘s total NLA.
FIN
AN
CIA
LS & A
DD
ITIO
NA
L INFO
RM
AT
ION
P
OR
TFO
LIO D
ET
AILS
B
USIN
ESS R
EV
IEW
SU
STAIN
AB
ILITY
C
OR
PO
RA
TE
GO
VE
RN
AN
CE
& T
RA
NSP
AR
EN
CY
O
VE
RV
IEW
ANNUAL REPORT 2017
79

Metro Line 2 Metro Line 9
Metro Line 10
PORTFOLIO DETAILSCAPITAMALL QIBAO
Located in Shanghai’s Minhang District near Hongqiao transport hub, CapitaMall Qibao is situated in a growing mid- to high-end residential locality to the west of the city’s Central Business District. The mall is positioned as a one-stop family shopping destination providing shopping, dining and entertainment for residents, as well as children’s edutainment facilities including the opening of the city’s largest rooftop children’s playland in 2018. The mall also houses the first duplex Uniqlo store in the Minhang district and other international brands including Carrefour, Miniso, Jack & Jones and a myriad of dining and entertainment options.
Map not drawn to scale
2019
12.4
24.3
15.7 16.6
10.6
7.7
11.79.9
34.6
9.3
20202018
15.0
32.2
2021 2022 Beyond 2022
Trade Sector
By Committed
NLA (%)
By Total RentalIncome (%)
Food & Beverage 18.0 35.1 Fashion & Accessories 16.4 25.3 Education 8.4 8.3 Leisure & Entertainment 11.8 7.0 Supermarket 31.2 6.2 Beauty & Healthcare 4.4 5.6 Sundry & Services 4.2 4.4 Houseware & Furnishings 1.1 2.4 Shoes & Bags 0.5 1.7 Sporting Goods & Apparel 2.5 1.4 Others 1.1 1.2 Jewellery / Watches / Pens 0.2 0.7 Information & Technology 0.2 0.7
By Committed NLA By Total Rental Income
Lease Expiry Profile (%) (As at 31 December 2017)
Trade Sector Analysis (For the month of December 2017)
Jiamin Elevated Rd
Yan’an Elevated Rd
G50 Huyu
Expy
S20
Outer Ring Expy
Hongyu Elevated Rd
Wuzhong RdHuxing Rd
Zhongchun Rd
Jianh
e R
d
Hongzhong Rd
Xinzhen Rd
SHANGHAI HONGQIAO TRANSPORTATION HUB
(AIRPORT & RAILWAY STATION)
Shanghai Hongqiao International Airport
CAPITAMALL QIBAO
Shanghai Zoo
Qibao Metro
Hangzhong Road Metro
Longxi Road Metro
Hongqiao Airport
Terminal 1 Metro
Ziteng Road Metro
Hongqiao Road Metro
Longbaixincun Metro
Xingzhong Metro
Zhongchun Metro
Hongqiao Airport
Terminal 2 Metro
% of Total Committed NLA% of Total Rental Income
80CAPITALAND RETAIL CHINA TRUST
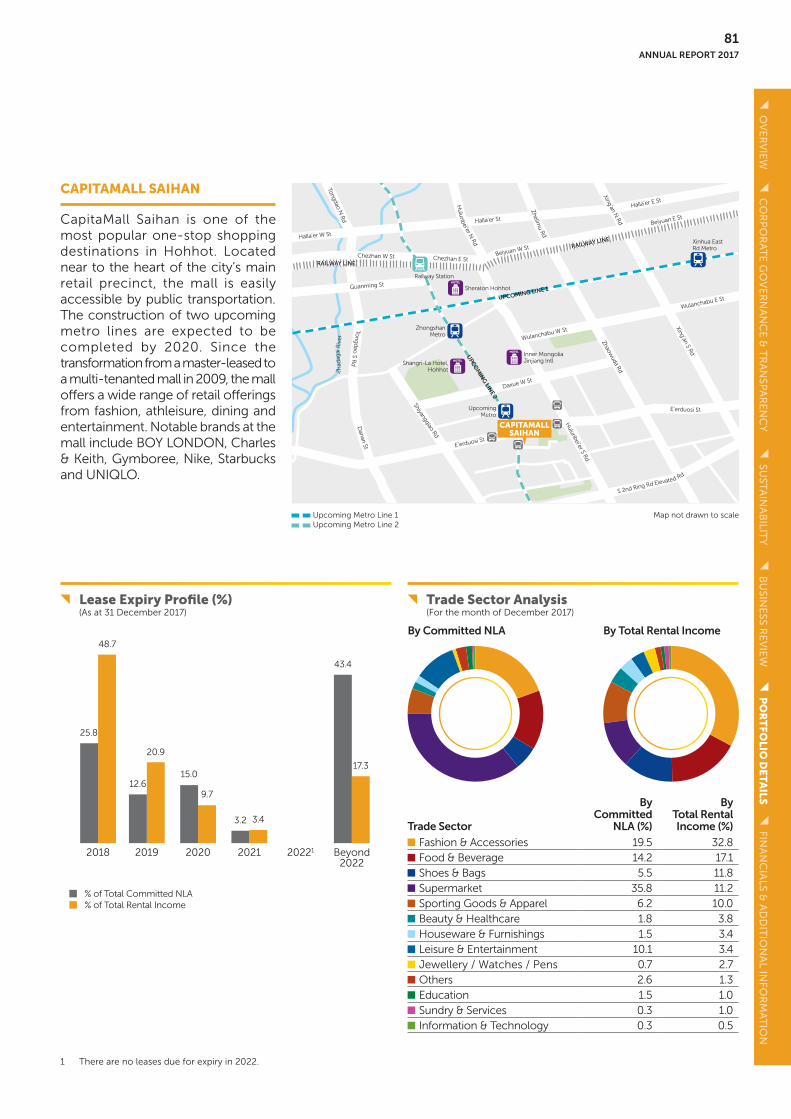
Upcoming Metro Line 1 Upcoming Metro Line 2
CAPITAMALL SAIHAN
CapitaMall Saihan is one of the most popular one-stop shopping destinations in Hohhot. Located near to the heart of the city’s main retail precinct, the mall is easily accessible by public transportation. The construction of two upcoming metro lines are expected to be completed by 2020. Since the transformation from a master-leased to a multi-tenanted mall in 2009, the mall offers a wide range of retail offerings from fashion, athleisure, dining and entertainment. Notable brands at the mall include BOY LONDON, Charles & Keith, Gymboree, Nike, Starbucks and UNIQLO.
PO
RT
FOLIO
DE
TA
ILSP
OR
TFO
LIO D
ETA
ILS
Map not drawn to scale
2019
12.6
20.9
15.0
9.7
3.2 3.4
43.4
17.3
20202018
25.8
48.7
2021 20221 Beyond 2022
Trade Sector
By Committed
NLA (%)
By Total RentalIncome (%)
Fashion & Accessories 19.5 32.8 Food & Beverage 14.2 17.1 Shoes & Bags 5.5 11.8 Supermarket 35.8 11.2 Sporting Goods & Apparel 6.2 10.0 Beauty & Healthcare 1.8 3.8 Houseware & Furnishings 1.5 3.4 Leisure & Entertainment 10.1 3.4 Jewellery / Watches / Pens 0.7 2.7 Others 2.6 1.3 Education 1.5 1.0 Sundry & Services 0.3 1.0 Information & Technology 0.3 0.5
By Committed NLA By Total Rental Income
Lease Expiry Profile (%) (As at 31 December 2017)
Trade Sector Analysis (For the month of December 2017)
Zh
adag
ai R
ive
r
Halla’er W St
Halla’er St
Halla’er E St
Chezhan W St Chezhan E St Beiyuan W St
Beiyuan E St
Tongdao N R
d
Ton
gd
ao S R
d
Danan St E’erduosi St
E’erduosi St
Daxue W StShiyangqiao Rd
Hu
lun
bei’er N Rd
Hulunbei’er S Rd
Zhelimu
Rd
Zhaowuda Rd
S 2nd Ring Rd Elevated Rd
Wulanchabu W St
Wulanchabu E St
Guanming St
Xing’an N Rd
Xing’an S Rd
UPCOMING LINE 1
UPC
OM
ING
LINE 2
Upcoming Metro
RAILWAY LINE
RAILWAY LINE
CAPITAMALL SAIHAN
Shangri-La Hotel, Hohhot
Inner Mongolia Jinjiang Intl
Zhongshan Metro
Xinhua East Rd Metro
Railway Station
Sheraton Hohhot
% of Total Committed NLA% of Total Rental Income
1 There are no leases due for expiry in 2022.
FIN
AN
CIA
LS & A
DD
ITIO
NA
L INFO
RM
AT
ION
P
OR
TFO
LIO D
ET
AILS
B
USIN
ESS R
EV
IEW
SU
STAIN
AB
ILITY
C
OR
PO
RA
TE
GO
VE
RN
AN
CE
& T
RA
NSP
AR
EN
CY
O
VE
RV
IEW
ANNUAL REPORT 2017
81

Metro Line 1 Metro Line 2
Metro Line 6
PORTFOLIO DETAILSCAPITAMALL MINZHONGLEYUAN
CapitaMall Minzhongleyuan is located along Wuhan’s main shopping and entertainment belt Zhongshan Avenue. CapitaMall Minzhongleyuan enjoys pedestrian flow from Jianghanlu pedestrian street located nearby, and is well-served by metro Lines 1 and 2, as well as metro Line 6 which commenced operations in late 2016. In line with the revitalisation of Zhongshan Avenue, the mall has been refreshing its tenant mix with popular brands such as adidas Originals, Onitsuka Tiger, Starbucks, Studio City (Wuhan) and UCommune, a leading coworking space provider.
Map not drawn to scale
Qingnian Metro
Zhongshan Park Metro
Xunlimen Metro
Jianghan Metro
YouyiMetro
LijibeiMetro
Youyi R
d
Xin
Hua R
d
Zhongshan Ave
Shundao St
Jinghan Ave
Jingh
an A
ve
Jiefang Ave
Jief
ang
Ave
Zizhi St
Liji E St
Minyi Upper St
Min
zhu
1st S
t
Zhongshan Ave
IKEA
Qianjin 2nd Rd
Qianjin 4th Rd
Minsheng Rd
Liji N St
CAPITAMALL MINZHONGLEYUAN
Wal-Mart
Residential District
Residential District
Residential District
Residential District
2019
7.5
17.2
3.1
8.1
1.4 1.6
32.5
20202018
55.5
50.1
2021 20221 Beyond 2022
Trade Sector
By Committed
NLA (%)
By Total RentalIncome (%)
Fashion & Accessories 16.1 23.3 Food & Beverage 9.4 19.4 Sundry & Services 26.3 19.4 Beauty & Healthcare 8.5 11.5 Sporting Goods & Apparel 3.4 10.8 Leisure & Entertainment 32.3 10.0 Jewellery / Watches / Pens 1.6 3.2 Shoes & Bags 0.9 1.2 Houseware & Furnishings 0.9 0.6 Others 0.5 0.5 Information & Technology 0.1 0.1
By Committed NLA By Total Rental Income
Lease Expiry Profile (%) (As at 31 December 2017)
Trade Sector Analysis (For the month of December 2017)
% of Total Committed NLA% of Total Rental Income
23.0
1 There are no leases due for expiry in 2022.
82CAPITALAND RETAIL CHINA TRUST

Proposed Metro Line 1
CAPITAMALL WUHU
Located near to Wuhu’s Central Business District and Anhui Education University, CapitaMall Wuhu is anchored by Walmart. The mall enjoys shopper traffic from the residences, university and college located within the vicinity.
PO
RT
FOLIO
DE
TA
ILSP
OR
TFO
LIO D
ETA
ILS
Map not drawn to scale
2019
1.9 1.75.5 5.5
75.974.1
20202018
16.7 18.7
2021 20221 Beyond 20221
Trade Sector
By Committed
NLA (%)
By Total RentalIncome (%)
Supermarket 75.8 74.4 Food & Beverage 5.5 11.0 Education 6.9 4.9 Sundry & Services 1.6 3.6 Beauty & Healthcare 2.5 2.1 Fashion & Accessories 3.0 1.3 Sporting Goods & Apparel 0.4 1.3 Jewellery / Watches / Pens 0.4 0.8 Shoes & Bags 0.8 0.4 Leisure & Entertainment 2.8 0.1 Others 0.3 0.1
By Committed NLA By Total Rental Income
Lease Expiry Profile (%) (As at 31 December 2017)
Trade Sector Analysis (For the month of December 2017)
Jiu
hu
a M
idd
le R
d
Beijing W Rd
Beijing Middle Rd
Beijin
g E
Rd
Zheshan West Rd
Zheshan Middle Rd
Yijia
ng M
iddl
e Rd
Yiji
ang
N R
d
Ch
ang
jian
g S
Rd
Cha
ng
jian
g M
idd
le R
d
Huangshan Middle Rd Huangshan E Rd
Zh
on
gsha
n S
Rd
Beijing Middle Rd
Limin Rd Limin Rd
Zheshan Park
Qingyi River
UPCO
MIN
G L
INE
1
RA
ILWA
Y LIN
E
CAPITAMALL WUHU
Zhongshan North Metro
Zheshan Park Metro
Beijing Road Metro
Huancheng North Road Metro
Limin Road Metro
Wuhu Railway Station
Wannan Medical College
Anhui Education University
% of Total Committed NLA% of Total Rental Income
1 There are no leases due for expiry after 2021.
FIN
AN
CIA
LS & A
DD
ITIO
NA
L INFO
RM
AT
ION
P
OR
TFO
LIO D
ET
AILS
B
USIN
ESS R
EV
IEW
SU
STAIN
AB
ILITY
C
OR
PO
RA
TE
GO
VE
RN
AN
CE
& T
RA
NSP
AR
EN
CY
O
VE
RV
IEW
ANNUAL REPORT 2017
83

PORTFOLIO DETAILSCAPITAMALL SHUANGJING
CapitaMall Shuangjing is located in Beijing’s Chaoyang district, and is situated close to an international school. The mall is well-served by public bus routes and is near to Jiulongshan metro station. The mall’s major tenants, supermarket anchor Carrefour and homewares store B&Q, draw significant shopper traffic from surrounding local and expatriate residential catchment, as well as office workers from nearby commercial centres.
Metro Line 1 Metro Line 7
Metro Line 10 Metro Line 14
Map not drawn to scale
2019
0.85.6 3.2 2.4
95.0
84.5
202012018
1.0
7.5
20211 2022 Beyond 2022
Trade Sector
By Committed
NLA (%)
By Total RentalIncome (%)
Supermarket 61.1 54.0 Houseware & Furnishings 34.0 30.4 Information & Technology 0.8 5.2 Beauty & Healthcare 0.3 4.5 Food & Beverage 0.6 3.5 Sundry & Services 3.2 2.4
By Committed NLA By Total Rental Income
Lease Expiry Profile (%) (As at 31 December 2017)
Trade Sector Analysis (For the month of December 2017)
Tonghui River Tonghui River
Jinsong Rd Nanmofang Rd Nanmofang Rd
Carrefour
CAPITAMALL SHUANGJING
Beijing City International
School
Shuangjing Residential
District
Jinsong Residential District
Dajiaoting Metro
Jiulongshan Metro
Shuangjing Metro
E 4
th R
ing
Rd
Mid
dle
E 4
th R
ing
Rd
Mid
dle
Baiziwan N Rd Baiziwan N Rd Baiziwan N Rd
Tianli StBaiziwan South 2nd Rd
E
2n
d R
ing
Rd
To
ngh
uihe
N R
d
Tonghuihe N Rd
W D
awan
g R
dW
Daw
ang
Rd
% of Total Committed NLA% of Total Rental Income
1. There are no leases due for expiry in 2020 and 2021.
84CAPITALAND RETAIL CHINA TRUST

CAPITAMALL ERQI
Located in the heart of Zhengzhou’s premier shopping precinct in the city’s Central Business District, CapitaMall Erqi is master-leased to Beijing Hualian Department Store. Positioned as a one-stop retail destination, the mall attracts repeat shoppers who are mainly residents and office workers in the vicinity, as well as visitors to the province.
Map not drawn to scale
Jinshui R
iver
Jinshui River
Xiong’er RiverJingguang Expy
jingguang Expy
Longhai Expy
Longhai ExpyBax
ue
Rd
Jinshui Rd
Hu
ayuan
Rd
Z
ijing
shan
Rd
Fushou St
Nanyang Rd
Zhongyuan E Rd
Songshan N Rd
Son
gsh
an S R
d
Zhengxing Rd
Renmin Rd
Jianshe E Rd Jiefang Rd
RA
ILWAY LIN
E
RA
ILWAY LIN
ECAPITAMALL
ERQI
Zhengzhou Zijingshan Park (North Gate) Park
Zhengzhou People’s Park
Zhengzhou Railway Station
Zhengzhou University
Zhengzhou ErqiMemorial Hall
2KM Catchment
Children’s Hospital
Zhengzhou Chinese Medicine Hospital
The Government of Zhengzhou
FIN
AN
CIA
LS & A
DD
ITIO
NA
L INFO
RM
AT
ION
P
OR
TFO
LIO D
ET
AILS
B
USIN
ESS R
EV
IEW
SU
STAIN
AB
ILITY
C
OR
PO
RA
TE
GO
VE
RN
AN
CE
& T
RA
NSP
AR
EN
CY
O
VE
RV
IEW
ANNUAL REPORT 2017
85

MARKETING & PROMOTIONS
CapitaMall Xizhimen celebrated its tenth anniversary with ten year awards for its 23 loyal tenants who have been with the mall since its opening in 2007.
At CapitaMall Saihan, the rooftop of the mall was creatively converted into an outdoor event area.
With scare actors spread across haunted zones, CapitaMall Saihan treated shoppers and thrill-seekers to a good scare over the Halloween weekend.
CapitaMall Minzhongleyuan held a fun-filled carnival to celebrate the new year with shoppers and tenants.
At CapitaMall Wangjing, shoppers enjoyed an enriching experience creating their own crafts through do-it-yourself workshops and events.
During the financial year, we have rolled out a series of promotional events as we enliven our assets to create memorable experiences and bring people together. Our portfolio of properties forms an integral part of the community, serving the people who live and work in and around our assets who form the core of our catchment.
86CAPITALAND RETAIL CHINA TRUST

CapitaMall Wuhu organised water themed activities for the children at the mall’s outdoor event plaza.
CapitaMall Qibao held a children’s party with characters from the popular children’s video, Mole’s World.
Creating enriching experiences at CapitaMall Wangjing through unique do-it-yourself craft activities.
CapitaMall Xizhimen and CapitaMall Wangjing held sporting and cycling activities in support of ECO FIT, CapitaLand’s group-wide event to promote healthy living.
At CapitaMall Xinnan, a formerly underutilised outdoor area of the mall was transformed into a trendy photo-taking destination with a coat of pink drawing shopper traffic and raising the mall’s social media presence.
FIN
AN
CIA
LS & A
DD
ITIO
NA
L INFO
RM
AT
ION
P
OR
TFO
LIO D
ET
AILS
B
USIN
ESS R
EV
IEW
SU
STAIN
AB
ILITY
C
OR
PO
RA
TE
GO
VE
RN
AN
CE
& T
RA
NSP
AR
EN
CY
O
VE
RV
IEW
ANNUAL REPORT 2017
87

Report of the Trustee 89
Statement by the Manager 90
Independent Auditors’ Report 91
Statements of Financial Position 94
Statements of Total Return 95
Distribution Statements 96
Statements of Movements 98
in Unitholders’ Funds
Portfolio Statement 99
Consolidated Statement of Cash Flows 101
Notes to the Financial Statements 104
FINANCIAL STATEMENTS
CAPITALAND RETAIL CHINA TRUST
88

REPORT OFTHE TRUSTEEYear ended 31 December 2017
HSBC Institutional Trust Services (Singapore) Limited (the “Trustee”) is under a duty to take into custody and hold the assets of CapitaLand Retail China Trust (the “Trust”) in trust for the Unitholders. In accordance with the Securities and Futures Act (Cap. 289), its subsidiary legislation and the Code on Collective Investment Schemes, the Trustee shall monitor the activities of CapitaLand Retail China Trust Management Limited (the “Manager”) for compliance with the limitations imposed on the investment and borrowing powers as set out in the Trust Deed dated 23 October 2006 (as amended by a first supplemental deed dated 8 November 2006, a second supplemental deed dated 15 April 2010, a third supplemental deed dated 5 April 2012, a fourth supplemental deed dated 14 February 2014, a fifth supplemental deed dated 6 May 2015 and a sixth supplemental deed dated 29 April 2016) (collectively the “Trust Deed”) between the Manager and the Trustee in each annual accounting period and report thereon to Unitholders in an annual report.
To the best knowledge of the Trustee, the Manager has, in all material respects, managed the Trust during the year covered by these financial statements, set out on pages 94 to 160, in accordance with the limitations imposed on the investment and borrowing powers set out in the Trust Deed.
For and on behalf of the Trustee,HSBC Institutional Trust Services (Singapore) Limited
Esther FongAuthorised Signatory
Singapore27 February 2018
ANNUAL REPORT 2017
89
FINA
NC
IALS
& A
DD
ITIO
NA
L INFO
RM
AT
ION
P
OR
TFO
LIO D
ETA
ILS
BU
SINE
SS RE
VIE
W
SUSTA
INA
BILIT
Y
CO
RP
OR
AT
E G
OV
ER
NA
NC
E &
TR
AN
SPA
RE
NC
Y
OV
ER
VIE
W

STATEMENT BYTHE MANAGERYear ended 31 December 2017
In the opinion of the directors of CapitaLand Retail China Trust Management Limited (the “Manager”), the accompanying financial statements set out on pages 94 to 160 comprising the statements of financial position, statements of total return, distribution statements and statements of movements in Unitholders’ funds of the CapitaLand Retail China Trust (the “Trust”) and its subsidiaries (the “Group”) and of the Trust, the portfolio statement and statement of cash flows of the Group and a summary of significant accounting policies and other explanatory information, are drawn up so as to present fairly, in all material respects, the financial position of the Group and of the Trust and the portfolio of the Group as at 31 December 2017, the total return, distributable income and movements in Unitholders’ funds of the Group and of the Trust and cash flows of the Group for the year ended on that date in accordance with the recommendations of Statement of Recommended Accounting Practice 7 “Reporting Framework for Unit Trusts” issued by the Institute of Singapore Chartered Accountants and the provisions of the Trust Deed. At the date of this statement, there are reasonable grounds to believe that the Group will be able to meet its financial obligations as and when they materialise.
For and on behalf of the Manager,CapitaLand Retail China Trust Management Limited
Tan Tze WooiDirector
Singapore27 February 2018
CAPITALAND RETAIL CHINA TRUST
90

Report on the audit of the financial statements
Opinion
We have audited the financial statements of CapitaLand Retail China Trust (the “Trust”) and its subsidiaries (the “Group”), which comprise the consolidated statement of financial position and consolidated portfolio statement of the Group and the statement of financial position of the Trust as at 31 December 2017, the consolidated statement of total return, consolidated distribution statement, consolidated statement of movements in Unitholders’ funds and consolidated statement of cash flows of the Group and the statement of total return, distribution statement and statement of movements in Unitholders’ funds of the Trust for the year then ended, and notes to the financial statements, including a summary of significant accounting policies, as set out on pages 94 to 160.
In our opinion, the accompanying consolidated financial statements of the Group and the statement of financial position, statement of total return, distribution statement and statement of movements in Unitholders’ funds of the Trust present fairly, in all material respects, the consolidated financial position and the portfolio holdings of the Group and the financial position of the Trust as at 31 December 2017 and the consolidated total return, consolidated distributable income, consolidated movements in Unitholders’ funds and consolidated cash flows of the Group and the total return, distributable income, and movements in Unitholders’ funds of the Trust for the year then ended in accordance with the recommendations of Statement of Recommended Accounting Practice 7 “Reporting Framework for Unit Trusts” (“RAP 7”) issued by the Institute of Singapore Chartered Accountants.
Basis for opinion
We conducted our audit in accordance with Singapore Standards on Auditing (“SSAs”). Our responsibilities under those standards are further described in the ‘Auditors’ responsibilities for the audit of the financial statements’ section of our report. We are independent of the Group in accordance with the Accounting and Corporate Regulatory Authority Code of Professional Conduct and Ethics for Public Accountants and Accounting Entities (“ACRA Code”) together with the ethical requirements that are relevant to our audit of the financial statements in Singapore, and we have fulfilled our other ethical responsibilities in accordance with these requirements and the ACRA Code. We believe that the audit evidence we have obtained is sufficient and appropriate to provide a basis for our opinion.
Key audit matters
Key audit matters are those matters that, in our professional judgement, were of most significance in our audit of the financial statements of the current period. These matters were addressed in the context of our audit of the financial statements as a whole, and in forming our opinion thereon, and we do not provide a separate opinion on these matters.
Valuation of investment properties(Refer to Portfolio Statement and Note 4 to the financial statements)
Risk
The Group owns and invests in a portfolio of 10 shopping malls located in 7 cities in China. Investment properties represent the largest asset item on the consolidated statement of financial position, at S$2.44 billion as at 31 December 2017.
The investment properties are stated at their fair value based on independent external valuations. The valuation process involves significant judgement in determining the appropriate valuation methodologies and in estimating the underlying assumptions to be applied in the valuations. Any changes in the key assumptions applied could result in a material impact to the financial statements.
INDEPENDENTAUDITORS’ REPORT Unitholders of CapitaLand Retail China Trust (Constituted under a trust deed dated 23 October 2006 (as amended) in the Republic of Singapore)
ANNUAL REPORT 2017
91
FINA
NC
IALS
& A
DD
ITIO
NA
L INFO
RM
AT
ION
P
OR
TFO
LIO D
ETA
ILS
BU
SINE
SS RE
VIE
W
SUSTA
INA
BILIT
Y
CO
RP
OR
AT
E G
OV
ER
NA
NC
E &
TR
AN
SPA
RE
NC
Y
OV
ER
VIE
W

Our response
We evaluated the objectivity, qualifications and competence of the external valuers and discussed with the valuers to understand their valuation approaches, assumptions used and bases of valuations. We considered the valuation methodologies against those applied by other valuers for similar property types.
We compared the projected cash flows used in the valuations to lease agreements and other supporting documents. We evaluated the appropriateness of the discount, capitalisation and terminal yield rates used in the valuation by comparing these against historical trends and available industry data, taking into consideration comparability and market factors. Where the rates were outside the expected ranges, we undertook further procedures to understand the effect of additional factors and, when necessary, held further discussions with the valuers.
Our findings
The Group has a structured process in appointing external valuers and in reviewing, challenging and accepting their valuations. The valuers are members of generally-recognised professional bodies for valuers. The valuation methodologies used are in line with generally accepted market practices and the key assumptions used are supported by market data.
Other information
CapitaLand Retail China Trust Management Limited, the Manager of the Trust (the “Manager”), is responsible for the other information contained in the annual report. Other information is defined as all information in the annual report other than the financial statements and our auditors’ report thereon.
We have obtained all other information prior to the date of this auditors’ report.
Our opinion on the financial statements does not cover the other information and we do not express any form of assurance conclusion thereon.
In connection with our audit of the financial statements, our responsibility is to read the other information and, in doing so, consider whether the other information is materially inconsistent with the financial statements or our knowledge obtained in the audit or otherwise appears to be materially misstated. If, based on the work we have performed, we conclude that there is a material misstatement of this other information, we are required to report that fact. We have nothing to report in this regard.
Responsibility of the Manager for the financial statements
The Manager is responsible for the preparation and fair presentation of these financial statements in accordance with the recommendations of RAP 7 issued by the Institute of Singapore Chartered Accountants, and for such internal control as the Manager determines is necessary to enable the preparation of financial statements that are free from material misstatement, whether due to fraud or error.
In preparing the financial statements, the Manager is responsible for assessing the Group’s ability to continue as a going concern, disclosing, as applicable, matters related to going concern and using the going concern basis of accounting unless the Manager either intends to terminate the Group or to cease operations, or has no realistic alternative but to do so.
The Manager’s responsibilities include overseeing the Group’s financial reporting process.
Auditors’ responsibility for the audit of the financial statements
Our objectives are to obtain reasonable assurance about whether the financial statements as a whole are free from material misstatement, whether due to fraud or error, and to issue an auditors’ report that includes our opinion. Reasonable assurance is a high level of assurance, but is not a guarantee that an audit conducted in accordance with SSAs will always detect a material misstatement when it exists. Misstatements can arise from fraud or error and are considered material if, individually or in the aggregate, they could reasonably be expected to influence the economic decisions of users taken on the basis of these financial statements.
INDEPENDENTAUDITORS’ REPORT Unitholders of CapitaLand Retail China Trust (Constituted under a trust deed dated 23 October 2006 (as amended) in the Republic of Singapore)
CAPITALAND RETAIL CHINA TRUST
92
As part of an audit in accordance with SSAs, we exercise professional judgement and maintain professional scepticism throughout the audit. We also:
• Identify and assess the risks of material misstatement of the financial statements, whether due to fraud or error, design and perform audit procedures responsive to those risks, and obtain audit evidence that is sufficient and appropriate to provide a basis for our opinion. The risk of not detecting a material misstatement resulting from fraud is higher than for one resulting from error, as fraud may involve collusion, forgery, intentional omissions, misrepresentations, or the override of internal controls.
• Obtain an understanding of internal controls relevant to the audit in order to design audit procedures that are appropriate in the circumstances, but not for the purpose of expressing an opinion on the effectiveness of the Group’s internal controls.
• Evaluate the appropriateness of accounting policies used and the reasonableness of accounting estimates and related disclosures made by the Manager.
• Conclude on the appropriateness of the Manager’s use of the going concern basis of accounting and, based on the audit evidence obtained, whether a material uncertainty exists related to events or conditions that may cast significant doubt on the Group’s ability to continue as a going concern. If we conclude that a material uncertainty exists, we are required to draw attention in our auditors’ report to the related disclosures in the financial statements or, if such disclosures are inadequate, to modify our opinion. Our conclusions are based on the audit evidence obtained up to the date of our auditors’ report. However, future events or conditions may cause the Group to cease to continue as a going concern.
• Evaluate the overall presentation, structure and content of the financial statements, including the disclosures, and whether the financial statements represent the underlying transactions and events in a manner that achieves fair presentation.
• Obtain sufficient appropriate audit evidence regarding the financial information of the entities or business activities within the Group to express an opinion on the consolidated financial statements. We are responsible for the direction, supervision and performance of the group audit. We remain solely responsible for our audit opinion.
We communicate with the Manager regarding, among other matters, the planned scope and timing of the audit and significant audit findings, including any significant deficiencies in internal controls that we identify during our audit.
We also provide the Manager with a statement that we have complied with relevant ethical requirements regarding independence, and communicate with them all relationships and other matters that may reasonably be thought to bear on our independence, and where applicable, related safeguards.
From the matters communicated with the Manager, we determine those matters that were of most significance in the audit of the financial statements of the current period and are therefore the key audit matters. We describe these matters in our auditors’ report unless the law or regulations preclude public disclosure about the matter or when, in extremely rare circumstances, we determine that a matter should not be communicated in our report because the adverse consequences of doing so would reasonably be expected to outweigh the public interest benefits of such communication.
The engagement partner on the audit resulting in this independent auditors’ report is Lim Pang Yew, Victor.
KPMG LLPPublic Accountants andChartered Accountants
Singapore27 February 2018
INDEPENDENTAUDITORS’ REPORT Unitholders of CapitaLand Retail China Trust (Constituted under a trust deed dated 23 October 2006 (as amended) in the Republic of Singapore)
ANNUAL REPORT 2017
93
FINA
NC
IALS
& A
DD
ITIO
NA
L INFO
RM
AT
ION
P
OR
TFO
LIO D
ETA
ILS
BU
SINE
SS RE
VIE
W
SUSTA
INA
BILIT
Y
CO
RP
OR
AT
E G
OV
ER
NA
NC
E &
TR
AN
SPA
RE
NC
Y
OV
ER
VIE
W

Group TrustNote 2017 2016 2017 2016
$’000 $’000 $’000 $’000
AssetsInvestment properties 4 2,441,024 2,628,353 – –Plant and equipment 5 2,962 4,034 – –Interests in subsidiaries 6 – – 1,326,045 1,416,194Trade and other receivables 7 37,131 12,829 25,562 360Financial derivatives 11 436 2,114 436 2,114Cash and cash equivalents 8 186,515 136,137 9,630 1,661
2,668,068 2,783,467 1,361,673 1,420,329
Less:LiabilitiesTrade and other payables 9 59,563 64,527 4,964 9,387Security deposits 50,818 48,769 – –Interest-bearing borrowings 10 747,507 977,751 747,507 918,808Financial derivatives 11 7,803 2,165 7,803 2,165Deferred tax liabilities 12 227,734 236,426 – –Provision for taxation 6,555 2,139 7 –
1,099,980 1,331,777 760,281 930,360
Net assets 1,568,088 1,451,690 601,392 489,969
Represented by:Unitholders’ funds 13 1,548,771 1,431,811 601,392 489,969Non-controlling interest 14 19,317 19,879 – –
1,568,088 1,451,690 601,392 489,969Units in issue (’000) 15 966,226 869,680 966,226 869,680
Net asset value per Unit attributable to Unitholders ($) 1.60 1.65 0.62 0.56
STATEMENTS OFFINANCIAL POSITIONAs at 31 December 2017
The accompanying notes form an integral part of these financial statements.
CAPITALAND RETAIL CHINA TRUST
94
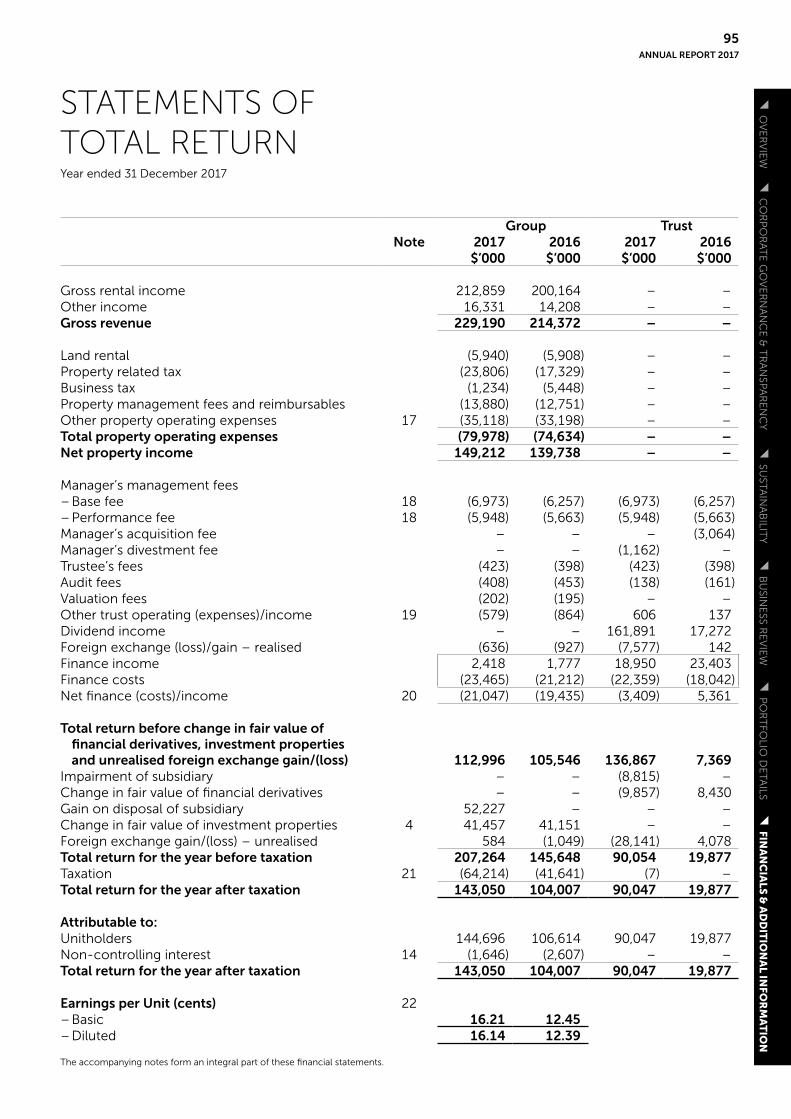
Group TrustNote 2017 2016 2017 2016
$’000 $’000 $’000 $’000
Gross rental income 212,859 200,164 – –Other income 16,331 14,208 – –Gross revenue 229,190 214,372 – –
Land rental (5,940) (5,908) – –Property related tax (23,806) (17,329) – –Business tax (1,234) (5,448) – –Property management fees and reimbursables (13,880) (12,751) – –Other property operating expenses 17 (35,118) (33,198) – –Total property operating expenses (79,978) (74,634) – –Net property income 149,212 139,738 – –
Manager’s management fees – Base fee 18 (6,973) (6,257) (6,973) (6,257)– Performance fee 18 (5,948) (5,663) (5,948) (5,663)Manager’s acquisition fee – – – (3,064)Manager’s divestment fee – – (1,162) –Trustee’s fees (423) (398) (423) (398)Audit fees (408) (453) (138) (161)Valuation fees (202) (195) – –Other trust operating (expenses)/income 19 (579) (864) 606 137Dividend income – – 161,891 17,272Foreign exchange (loss)/gain – realised (636) (927) (7,577) 142Finance income 2,418 1,777 18,950 23,403Finance costs (23,465) (21,212) (22,359) (18,042)Net finance (costs)/income 20 (21,047) (19,435) (3,409) 5,361
Total return before change in fair value of financial derivatives, investment properties and unrealised foreign exchange gain/(loss) 112,996 105,546 136,867 7,369
Impairment of subsidiary – – (8,815) –Change in fair value of financial derivatives – – (9,857) 8,430Gain on disposal of subsidiary 52,227 – – –Change in fair value of investment properties 4 41,457 41,151 – –Foreign exchange gain/(loss) – unrealised 584 (1,049) (28,141) 4,078Total return for the year before taxation 207,264 145,648 90,054 19,877Taxation 21 (64,214) (41,641) (7) –Total return for the year after taxation 143,050 104,007 90,047 19,877
Attributable to:Unitholders 144,696 106,614 90,047 19,877Non-controlling interest 14 (1,646) (2,607) – –Total return for the year after taxation 143,050 104,007 90,047 19,877
Earnings per Unit (cents) 22– Basic 16.21 12.45– Diluted 16.14 12.39
The accompanying notes form an integral part of these financial statements.
STATEMENTS OFTOTAL RETURNYear ended 31 December 2017
ANNUAL REPORT 2017
95
FINA
NC
IALS
& A
DD
ITIO
NA
L INFO
RM
AT
ION
P
OR
TFO
LIO D
ETA
ILS
BU
SINE
SS RE
VIE
W
SUSTA
INA
BILIT
Y
CO
RP
OR
AT
E G
OV
ER
NA
NC
E &
TR
AN
SPA
RE
NC
Y
OV
ER
VIE
W
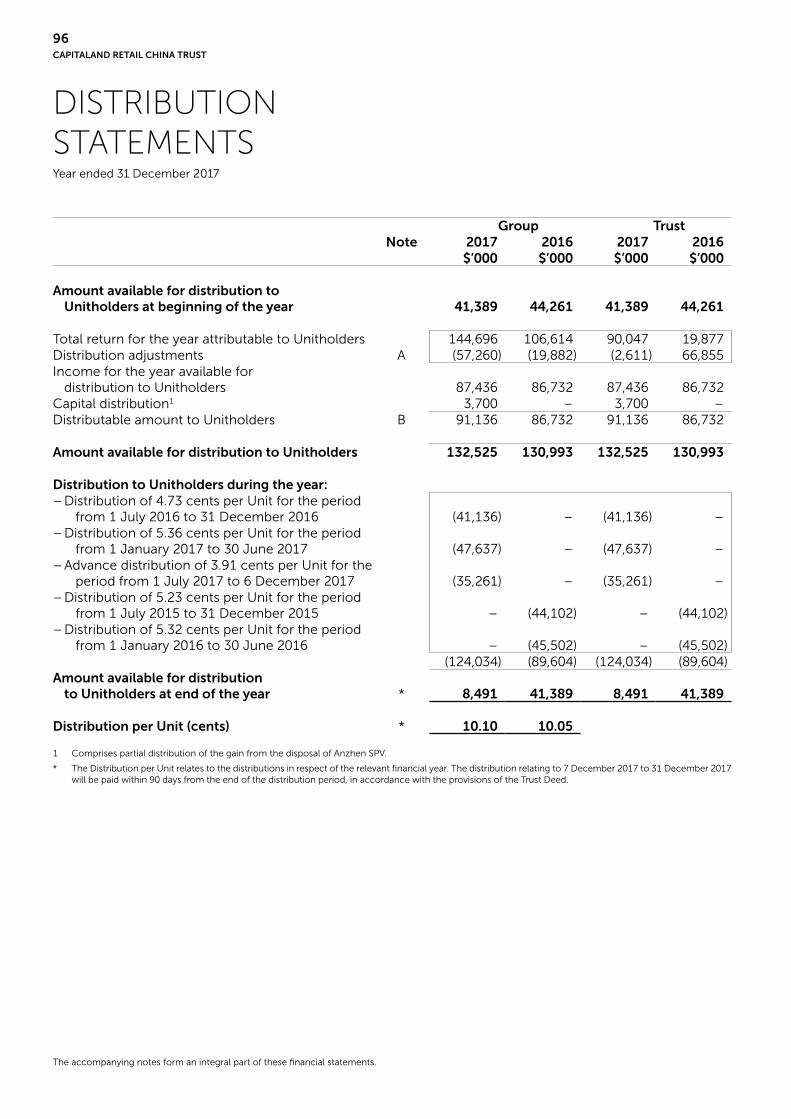
Group TrustNote 2017 2016 2017 2016
$’000 $’000 $’000 $’000
Amount available for distribution to Unitholders at beginning of the year 41,389 44,261 41,389 44,261
Total return for the year attributable to Unitholders 144,696 106,614 90,047 19,877Distribution adjustments A (57,260) (19,882) (2,611) 66,855Income for the year available for
distribution to Unitholders 87,436 86,732 87,436 86,732Capital distribution1 3,700 – 3,700 –Distributable amount to Unitholders B 91,136 86,732 91,136 86,732
Amount available for distribution to Unitholders 132,525 130,993 132,525 130,993
Distribution to Unitholders during the year:– Distribution of 4.73 cents per Unit for the period
from 1 July 2016 to 31 December 2016 (41,136) – (41,136) –– Distribution of 5.36 cents per Unit for the period
from 1 January 2017 to 30 June 2017 (47,637) – (47,637) –– Advance distribution of 3.91 cents per Unit for the
period from 1 July 2017 to 6 December 2017 (35,261) – (35,261) –– Distribution of 5.23 cents per Unit for the period
from 1 July 2015 to 31 December 2015 – (44,102) – (44,102)– Distribution of 5.32 cents per Unit for the period
from 1 January 2016 to 30 June 2016 – (45,502) – (45,502)(124,034) (89,604) (124,034) (89,604)
Amount available for distribution to Unitholders at end of the year * 8,491 41,389 8,491 41,389
Distribution per Unit (cents) * 10.10 10.05
1 Comprises partial distribution of the gain from the disposal of Anzhen SPV.
* The Distribution per Unit relates to the distributions in respect of the relevant financial year. The distribution relating to 7 December 2017 to 31 December 2017 will be paid within 90 days from the end of the distribution period, in accordance with the provisions of the Trust Deed.
The accompanying notes form an integral part of these financial statements.
DISTRIBUTIONSTATEMENTSYear ended 31 December 2017
CAPITALAND RETAIL CHINA TRUST
96

Note A – Distribution adjustments
Group Trust2017 2016 2017 2016$’000 $’000 $’000 $’000
Distribution adjustment items:– Gain on disposal of subsidiary, net of tax (37,314) – – –– Foreign exchange capital loss-realised 851 – 156 –– Manager’s management fees
(performance component paid/payable in Units) 5,995 5,663 5,995 5,663– Change in fair value of financial derivatives – – 9,857 (8,430)– Change in fair value of investment properties1 (43,247) (42,739) – –– Deferred taxation1 21,129 19,357 – –– Transfer to general reserve (6,086) (4,986) – –– Unrealised foreign exchange loss/(gain)1 (317) 652 28,141 (4,078)– Other adjustments1 1,729 2,171 – –– Net overseas income (distributed)/not distributed
to the Trust – – (46,760) 73,700Net effect of distribution adjustments (57,260) (19,882) (2,611) 66,855
1 Excludes non-controlling interest’s share.
Note B – Distributable amount to Unitholders
Group TrustNote 2017 2016 2017 2016
$’000 $’000 $’000 $’000
Comprises:– from operations 87,436 13,032 87,436 13,032– from Unitholders’ contribution – 73,700 – 73,700
87,436 86,732 87,436 86,732– from capital distribution 3,700 – 3,700 –Total Unitholders’ distribution 16 91,136 86,732 91,136 86,732
DISTRIBUTIONSTATEMENTSYear ended 31 December 2017
The accompanying notes form an integral part of these financial statements.
ANNUAL REPORT 2017
97
FINA
NC
IALS
& A
DD
ITIO
NA
L INFO
RM
AT
ION
P
OR
TFO
LIO D
ETA
ILS
BU
SINE
SS RE
VIE
W
SUSTA
INA
BILIT
Y
CO
RP
OR
AT
E G
OV
ER
NA
NC
E &
TR
AN
SPA
RE
NC
Y
OV
ER
VIE
W

Group Trust2017 2016 2017 2016$’000 $’000 $’000 $’000
OperationsUnitholders’ funds as at beginning of the year 1,431,811 1,490,820 489,969 522,814Change in Unitholders’ funds resulting
from operations 144,696 106,614 90,047 19,877Transfer to general reserve (6,086) (4,986) – –Net increase in net assets resulting
from operations 138,610 101,628 90,047 19,877
Movements in hedging reserveEffective portion of changes in
fair value of cash flow hedges (3,704) (5,923) (3,704) (5,923)
Movements in foreign currency translation reserveTranslation differences from
financial statements of foreign operations (6,917) (104,764) – –Exchange differences on monetary items forming
part of net investment in foreign operations (32,337) (16,567) – –Exchange differences on hedges of
net investment in foreign operations (9,858) 8,430 – –Net loss recognised directly in Unitholders’ funds (52,816) (118,824) (3,704) (5,923)
Movement in general reserve 6,086 4,986 – –
Unitholders’ transactionsNew Units issued 103,800 – 103,800 –Creation of Units paid/payable to manager– Units issued and to be issued as satisfaction of
the portion of Manager’s management fees payable in Units 5,995 5,663 5,995 5,663
Units issued in respect of the distribution reinvestment plan 41,419 37,142 41,419 37,142
151,214 42,805 151,214 42,805Distributions to Unitholders (124,034) (89,604) (124,034) (89,604)Equity issue expenses (2,100) – (2,100) –Net increase/(decrease) in net assets resulting
from Unitholders’ transactions 25,080 (46,799) 25,080 (46,799)
Unitholders’ funds as at end of the year 1,548,771 1,431,811 601,392 489,969
STATEMENTS OFMOVEMENTS IN UNITHOLDERS’ FUNDSYear ended 31 December 2017
The accompanying notes form an integral part of these financial statements.
CAPITALAND RETAIL CHINA TRUST
98
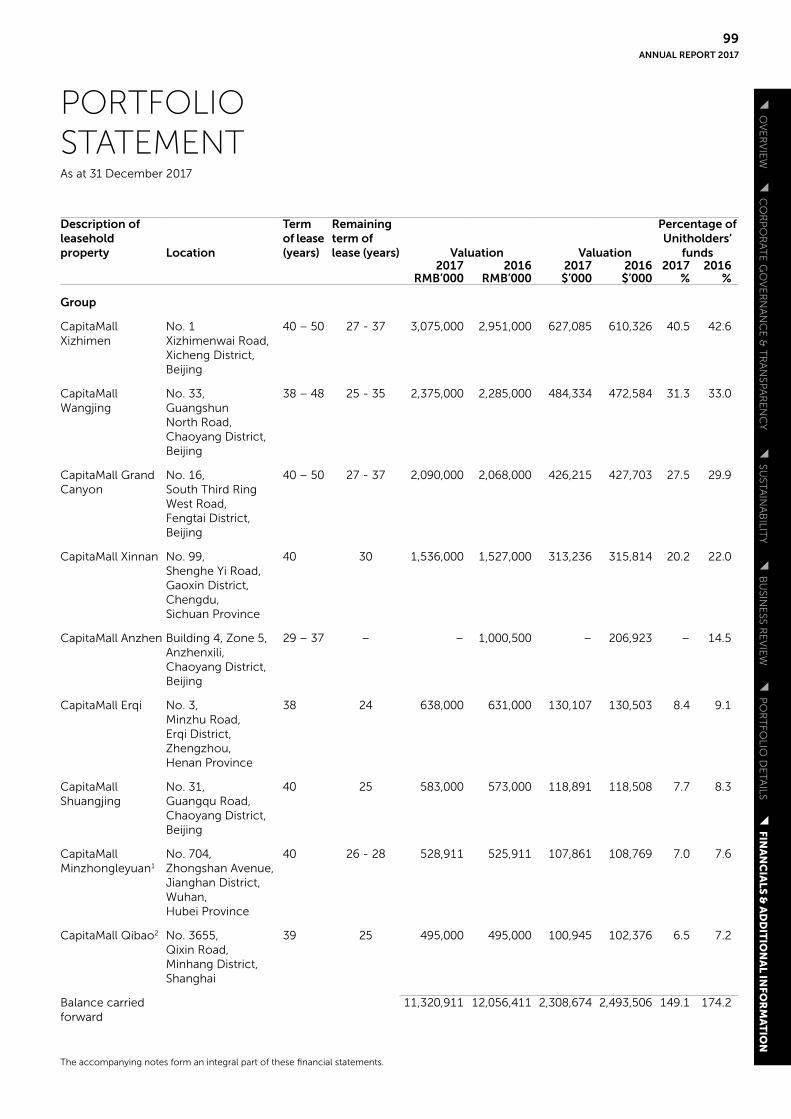
Description of leasehold property Location
Termof lease(years)
Remainingterm oflease (years) Valuation Valuation
Percentage ofUnitholders’
funds2017 2016 2017 2016 2017 2016
RMB’000 RMB’000 $’000 $’000 % %
Group
CapitaMallXizhimen
No. 1Xizhimenwai Road,Xicheng District,Beijing
40 – 50 27 - 37 3,075,000 2,951,000 627,085 610,326 40.5 42.6
CapitaMallWangjing
No. 33,GuangshunNorth Road,Chaoyang District,Beijing
38 – 48 25 - 35 2,375,000 2,285,000 484,334 472,584 31.3 33.0
CapitaMall Grand Canyon
No. 16,South Third RingWest Road,Fengtai District,Beijing
40 – 50 27 - 37 2,090,000 2,068,000 426,215 427,703 27.5 29.9
CapitaMall Xinnan No. 99, Shenghe Yi Road,Gaoxin District,Chengdu,Sichuan Province
40 30 1,536,000 1,527,000 313,236 315,814 20.2 22.0
CapitaMall Anzhen Building 4, Zone 5,Anzhenxili,Chaoyang District,Beijing
29 – 37 – – 1,000,500 – 206,923 – 14.5
CapitaMall Erqi No. 3, Minzhu Road,Erqi District,Zhengzhou,Henan Province
38 24 638,000 631,000 130,107 130,503 8.4 9.1
CapitaMall Shuangjing
No. 31,Guangqu Road,Chaoyang District,Beijing
40 25 583,000 573,000 118,891 118,508 7.7 8.3
CapitaMall Minzhongleyuan1
No. 704,Zhongshan Avenue,Jianghan District,Wuhan,Hubei Province
40 26 - 28 528,911 525,911 107,861 108,769 7.0 7.6
CapitaMall Qibao2 No. 3655,Qixin Road,Minhang District,Shanghai
39 25 495,000 495,000 100,945 102,376 6.5 7.2
Balance carried forward
11,320,911 12,056,411 2,308,674 2,493,506 149.1 174.2
PORTFOLIOSTATEMENTAs at 31 December 2017
The accompanying notes form an integral part of these financial statements.
ANNUAL REPORT 2017
99
FINA
NC
IALS
& A
DD
ITIO
NA
L INFO
RM
AT
ION
P
OR
TFO
LIO D
ETA
ILS
BU
SINE
SS RE
VIE
W
SUSTA
INA
BILIT
Y
CO
RP
OR
AT
E G
OV
ER
NA
NC
E &
TR
AN
SPA
RE
NC
Y
OV
ER
VIE
W

Description ofleasehold property Location
Termof lease(years)
Remainingterm oflease (years Valuation Valuation
Percentage ofUnitholders’
funds2017 2016 2017 2016 2017 2016
RMB’000 RMB’000 $’000 $’000 % %
Group
Balance brought forward 11,320,911 12,056,411 2,308,674 2,493,506 149.1 174.2
CapitaMallSaihan
No. 26,Ordos Street,Saihan District,Hohhot,Inner MongoliaAutonomousRegion
35 23 456,000 445,000 92,992 92,035 6.0 6.4
CapitaMallWuhu
No. 37,ZhongshanNorth Road,Jinghu District,Wuhu,Anhui Province
40 26 193,000 207,000 39,358 42,812 2.5 3.0
Investment properties, at valuation 11,969,911 12,708,411 2,441,024 2,628,353 157.6 183.6Other assets and liabilities (net) (872,936) (1,176,663) (56.4) (82.2)
1,568,088 1,451,690 101.2 101.4Net assets attributable to non-controlling interests (19,317) (19,879) (1.2) (1.4)Net assets attributable to Unitholders 1,548,771 1,431,811 100.0 100.0
Notes:
1 The carrying amount of CapitaMall Minzhongleyuan includes the valuation of the retail mall and carrying amount of three residential units.
2 CapitaMall Qibao is held under a master lease by CapitaRetail Dragon Mall (Shanghai) Co., Ltd, a subsidiary of CapitaRetail China Investments (B) Alpha Pte. Ltd. The master lease was entered with Shanghai Jin Qiu (Group) Co., Ltd (“Jin Qiu”), the legal owner of CapitaMall Qibao and expires in January 2024, with the right to renew for a further term of 19 years and two months from January 2024 at the option of the Group. Accordingly, the land use rights is held by Jin Qiu.
PORTFOLIOSTATEMENTAs at 31 December 2017
The accompanying notes form an integral part of these financial statements.
CAPITALAND RETAIL CHINA TRUST
100

GroupNote 2017 2016
$’000 $’000
Operating activitiesTotal return for the year after taxation 143,050 104,007Adjustments for:Finance income (2,418) (1,777)Finance costs 23,465 21,212Depreciation and amortisation 1,727 2,147Taxation 64,214 41,641Manager’s management fees payable in Units A(i) 5,995 5,663Plant and equipment written off 47 89Change in fair value of investment properties (41,457) (41,151)Gain on disposal of subsidiary (52,227) –Impairment losses on trade receivables, net 131 143Operating income before working capital changes 142,527 131,974
Changes in working capital:Trade and other receivables (1,247) 302Trade and other payables 2,247 6,322Cash generated from operating activities 143,527 138,598Income tax paid (27,267) (18,668)Net cash from operating activities 116,260 119,930
Investing activitiesInterest received 2,418 1,777Deposit paid for the acquisition of joint venture (25,525) –Proceeds from disposal of subsidiary, net of tax C 216,754 –Capital expenditure on investment properties A(ii) (14,146) (20,775)Proceeds from disposal of plant and equipment – 3Net cash outflow on acquisition of subsidiaries B (3,510) (293,729)Purchase of plant and equipment (999) (318)Net cash from/(used in) investing activities 174,992 (313,042)
Financing activitiesProceeds from issuance of new Units 103,800 –Distribution to Unitholders (82,615) (52,462)Payment of equity issue expenses (1,535) (14)Payment of financing expenses (2,005) (1,050)Proceeds from draw down of interest–bearing borrowings 517,900 517,781Repayment of interest–bearing borrowings (745,969) (240,861)Settlement of derivative contracts (6,246) 8,030Interest paid (22,132) (20,433)Net cash (used in)/from financing activities (238,802) 210,991
Increase in cash and cash equivalents 52,450 17,879Cash and cash equivalents at 1 January 136,137 126,322Effect of foreign exchange rate changes on cash balances (2,072) (8,064)Cash and cash equivalents at 31 December 8 186,515 136,137
CONSOLIDATED STATEMENT OFCASH FLOWSYear ended 31 December 2017
The accompanying notes form an integral part of these financial statements.
ANNUAL REPORT 2017
101
FINA
NC
IALS
& A
DD
ITIO
NA
L INFO
RM
AT
ION
P
OR
TFO
LIO D
ETA
ILS
BU
SINE
SS RE
VIE
W
SUSTA
INA
BILIT
Y
CO
RP
OR
AT
E G
OV
ER
NA
NC
E &
TR
AN
SPA
RE
NC
Y
OV
ER
VIE
W
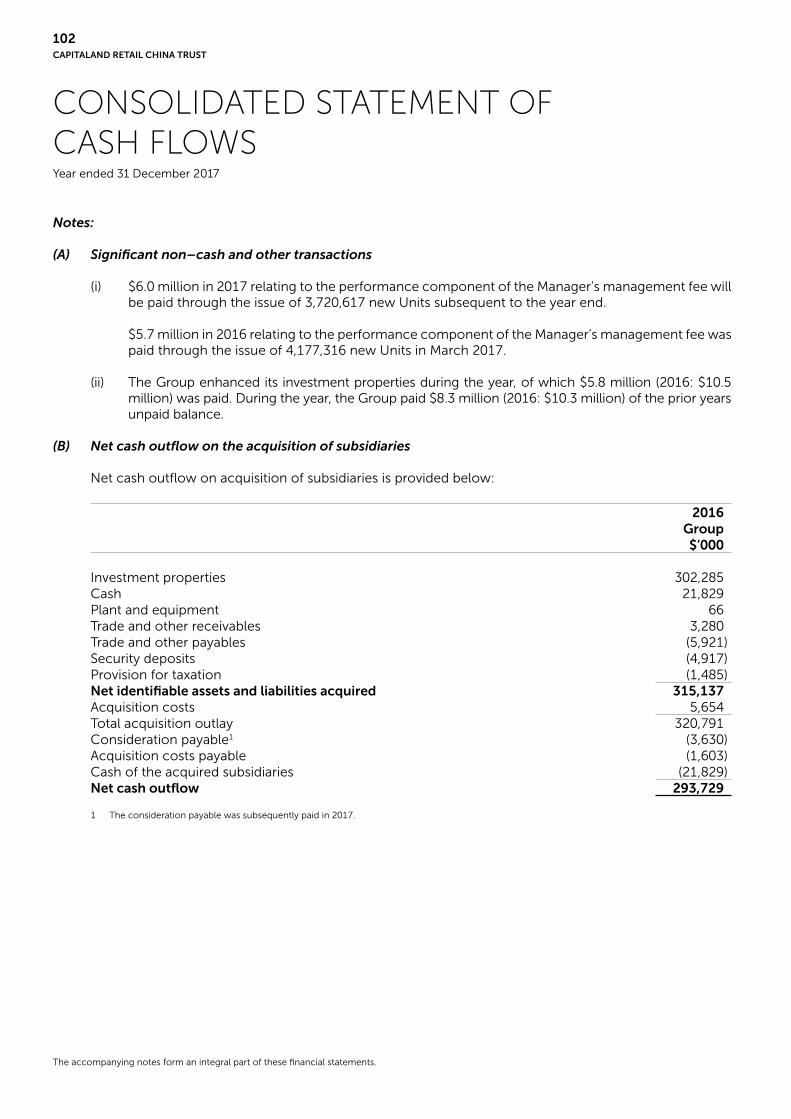
Notes:
(A) Significant non–cash and other transactions
(i) $6.0 million in 2017 relating to the performance component of the Manager’s management fee will be paid through the issue of 3,720,617 new Units subsequent to the year end.
$5.7 million in 2016 relating to the performance component of the Manager’s management fee was paid through the issue of 4,177,316 new Units in March 2017.
(ii) The Group enhanced its investment properties during the year, of which $5.8 million (2016: $10.5 million) was paid. During the year, the Group paid $8.3 million (2016: $10.3 million) of the prior years unpaid balance.
(B) Net cash outflow on the acquisition of subsidiaries
Net cash outflow on acquisition of subsidiaries is provided below:
2016Group$’000
Investment properties 302,285Cash 21,829Plant and equipment 66Trade and other receivables 3,280Trade and other payables (5,921)Security deposits (4,917)Provision for taxation (1,485)Net identifiable assets and liabilities acquired 315,137Acquisition costs 5,654Total acquisition outlay 320,791Consideration payable1 (3,630)Acquisition costs payable (1,603)Cash of the acquired subsidiaries (21,829)Net cash outflow 293,729
1 The consideration payable was subsequently paid in 2017.
CONSOLIDATED STATEMENT OFCASH FLOWSYear ended 31 December 2017
The accompanying notes form an integral part of these financial statements.
CAPITALAND RETAIL CHINA TRUST
102

Notes:
(C) Net cash inflow on the divestment of subsidiary
Net cash inflow on divestment of subsidiary is provided below:
2017Group$’000
Investment properties 202,161Cash 2,676Trade and other receivables 4,227Trade and other payables (637)Deferred tax liabilities (25,782)Provision for taxation (529)Net identifiable assets and liabilities divested 182,116Gain on disposal of subsidiary 52,227Sale consideration 234,343Tax paid (14,913)Cash of subsidiary divested (2,676)Net cash inflow 216,754
CONSOLIDATED STATEMENT OFCASH FLOWSYear ended 31 December 2017
The accompanying notes form an integral part of these financial statements.
ANNUAL REPORT 2017
103
FINA
NC
IALS
& A
DD
ITIO
NA
L INFO
RM
AT
ION
P
OR
TFO
LIO D
ETA
ILS
BU
SINE
SS RE
VIE
W
SUSTA
INA
BILIT
Y
CO
RP
OR
AT
E G
OV
ER
NA
NC
E &
TR
AN
SPA
RE
NC
Y
OV
ER
VIE
W

NOTES TO THEFINANCIAL STATEMENTSYear ended 31 December 2017
These notes form an integral part of the financial statements.
The financial statements were authorised for issue by the Manager and the Trustee on 27 February 2018.
1. GENERAL
CapitaLand Retail China Trust (the “Trust”) is a Singapore–domiciled unit trust constituted pursuant to the trust deed dated 23 October 2006 (as amended by a first supplemental deed dated 8 November 2006, a second supplemental deed dated 15 April 2010, a third supplemental deed dated 5 April 2012, a fourth supplemental deed dated 14 February 2014, a fifth supplemental deed dated 6 May 2015 and a sixth supplemental deed dated 29 April 2016) (collectively the “Trust Deed”) between CapitaLand Retail China Trust Management Limited (the “Manager”) and HSBC Institutional Trust Services (Singapore) Limited (the “Trustee”). The Trust Deed is governed by the laws of the Republic of Singapore. The Trustee is under a duty to take into custody and hold the assets of the Trust held by it or through its subsidiaries (the “Group”) in trust for the holders (“Unitholders”) of Units in the Trust (the “Units”).
The Trust was formally admitted to the Official List of the Singapore Exchange Securities Trading Limited (the “SGX-ST”) on 8 December 2006 (the “Listing Date”) and was included under the Central Provident Fund (“CPF”) Investment Scheme on 8 December 2006.
For financial reporting purposes, the Group is regarded as a subsidiary of CapitaLand Mall Asia Limited. Accordingly, the ultimate holding Company is CapitaLand Limited. The immediate and ultimate holding companies are incorporated in the Republic of Singapore.
The principal activities of the Trust are those relating to investment in a diversified portfolio of income–producing properties located primarily in the People’s Republic of China (“China”), Hong Kong and Macau and used primarily for retail purposes.
The principal activities of the subsidiaries are those of investment holding of properties located in China and used for retail purposes.
The Group has entered into several service agreements in relation to the management of the Trust and its property operations. The fee structures for these services are as follows:
(a) Trustee’s fees
Pursuant to Clause 14.3 of the Trust Deed, the Trustee’s fee shall not exceed 0.03% per annum of the value of all the assets of the Group (“Deposited Property”), subject to a minimum of $15,000 per month, excluding out-of-pocket expenses and Goods and Service Tax.
(b) Manager’s management fees
The Manager is entitled under Clauses 14.1.3, 14.1.4 and 14.1.6 of the Trust Deed to the following management fees:
• a base fee of 0.25% per annum of the value of the Deposited Property;
• a performance fee of 4.0% per annum of the net property income in the relevant financial year (calculated before accounting for the performance fee in that financial year); and
CAPITALAND RETAIL CHINA TRUST
104

NOTES TO THEFINANCIAL STATEMENTSYear ended 31 December 2017
1. GENERAL (continued)
(b) Manager’s management fees (continued)
• an authorised investment management fee of 0.5% per annum of the value of authorised investments which are not real estate. Where such authorised investment is an interest in a property fund (either a real estate investment trust or private property fund) wholly managed by a wholly owned subsidiary of CapitaLand Limited, no authorised investment management fee shall be payable in relation to such authorised investment.
The Manager may, in accordance with Clause 14.1.8(i) of the Trust Deed elect to receive the management fees in cash or Units or a combination of cash and/or Units (as it may in its sole discretion determine). Pursuant to Clauses 14.1.3 and 14.1.4 of the Trust Deed, the base fee and performance fee are computed and payable on a quarterly and annually basis respectively.
(c) Property management fees
Under the property management agreements in respect of each property, the property managers will provide lease management services, property tax services and marketing co-ordination services in relation to that property. The property managers are entitled to the following fees:
• 2.0% per annum of the gross revenue;
• 2.0% per annum of the net property income; and
• 0.5% per annum of the net property income in lieu of leasing commissions otherwise payable to the property managers and/or third party agents.
(d) Acquisition fee
For any authorised investment acquired from time to time by the Trustee on behalf of the Trust, the acquisition fee payable to the Manager under Clause 14.2 of the Trust Deed shall be:
• up to 1.5% of the purchase price in the case of any authorised investment (as defined in the Trust Deed) acquired by the Trust for less than $200 million; and
• 1.0% of the purchase price in the case of any authorised investment acquired by the Trust for $200 million or more.
The acquisition fee payable in respect of any authorised investment acquired from time to time by the Trustee on behalf of the Trust from CapitaLand Mall China Income Fund I, CapitaLand Mall China Income Fund II, CapitaLand Mall China Income Fund III, CapitaLand Mall China Development Fund III, or CapitaLand Mall Asia Limited shall be 1.0% of the purchase price paid by the Trust.
No acquisition fee was payable for the acquisition of the initial property portfolio of the Trust.
The acquisition fee is payable to the Manager in the form of cash and/or Units (as the Manager may elect) at the prevailing market price provided that in respect of any acquisition of real estate assets from interested parties, such a fee should, if required by the applicable laws, rules and/or regulations, be in the form of Units issued by the Trust at prevailing market price(s) and subject to such transfer restrictions as may be imposed.
Any payment to third party agents or brokers in connection with the acquisition of any authorised investments for the Trust shall be paid by the Manager to such persons out of the Deposited Property of the Trust or the assets of the relevant special purpose vehicle, and not out of the acquisition fee received or to be received by the Manager.
ANNUAL REPORT 2017
105
FINA
NC
IALS
& A
DD
ITIO
NA
L INFO
RM
AT
ION
P
OR
TFO
LIO D
ETA
ILS
BU
SINE
SS RE
VIE
W
SUSTA
INA
BILIT
Y
CO
RP
OR
AT
E G
OV
ER
NA
NC
E &
TR
AN
SPA
RE
NC
Y
OV
ER
VIE
W
NOTES TO THEFINANCIAL STATEMENTSYear ended 31 December 2017
1. GENERAL (continued)
(e) Divestment fee
Under Clause 14.2 of the Trust Deed, the Manager is entitled to receive a divestment fee of 0.5% of the sale price of any authorised investment disposed directly or indirectly by the Trust, prorated if applicable to the proportion of the Trust’s interest.
The divestment fee is payable to the Manager in the form of cash and/or Units (as the Manager may elect) at the prevailing market price provided that in respect of any divestment of real estate assets to interested parties, such a fee should, if required by the applicable laws, rules and/or regulations, be in the form of Units issued by the Trust at prevailing market price(s) and subject to such transfer restrictions as may be imposed.
Any payment to third party agents or brokers in connection with the divestment of any authorised investments for the Trust shall be paid by the Manager to such persons out of the Deposited Property of the Trust or the assets of the relevant special purpose vehicle, and not out of the divestment fee received or to be received by the Manager.
2. BASIS OF PREPARATION
(a) Statement of compliance
The financial statements have been prepared in accordance with the recommendations of the Statement of Recommended Accounting Practice (“RAP”) 7 “Reporting Framework for Unit Trusts” issued by the Institute of Singapore Chartered Accountants, the applicable requirements of the Code on Collective Investment Schemes (the “CIS Code”) issued by the Monetary Authority of Singapore (“MAS”) and the provisions of the Trust Deed. RAP 7 requires that accounting policies adopted should generally comply with the principles relating to recognition and measurement of the Singapore Financial Reporting Standards (“FRS”).
(b) Basis of measurement
The financial statements have been prepared on the historical cost basis except for the following material items on the statement of financial position:
• derivative financial instruments are measured at fair value;
• investment properties are measured at fair value.
(c) Functional and presentation currency
Items included in the financial statements of each entity in the Group are measured using the currency that best reflects the economic substance of the underlying events and circumstances relevant to that entity (the “functional currency”). The consolidated financial statements of the Group are presented in Singapore dollars, which is the functional currency of the Trust. All financial information presented in Singapore dollars has been rounded to the nearest thousand, unless otherwise stated.
CAPITALAND RETAIL CHINA TRUST
106

NOTES TO THEFINANCIAL STATEMENTSYear ended 31 December 2017
2. BASIS OF PREPARATION (continued)
(d) Use of estimates and judgements
The preparation of financial statements in conformity with RAP 7 requires the Manager to make judgements, estimates and assumptions that affect the application of accounting policies and the reported amounts of assets, liabilities, income and expenses. The estimates and associated assumptions are based on historical experience and various other factors that are believed to be reasonable under the circumstances, the results of which form the basis of making the judgements about carrying amounts of assets and liabilities that are not readily apparent from other sources.
Estimates and underlying assumptions are reviewed on an ongoing basis. Revisions to accounting estimates are recognised in the period in which the estimates are revised and in any future periods affected.
Information about assumptions and estimation uncertainties that have a significant risk of resulting in a material adjustment within the next financial year are included in the following notes:
• Note 4 – Valuation of investment properties;
• Note 27 – Valuation of financial instruments.
Measurement of fair values
A number of the Group’s accounting policies and disclosures require the measurement of fair values, for both financial and non-financial assets and liabilities.
When measuring the fair value of an asset or a liability, the Group uses observable market data as far as possible. Fair values are categorised into different levels in a fair value hierarchy based on the inputs used in the valuation techniques as follows:
• Level 1: quoted prices (unadjusted) in active markets for identical assets or liabilities.
• Level 2: inputs other than quoted prices included in Level 1 that are observable for the asset or liability, either directly (i.e. as prices) or indirectly (i.e. derived from prices).
• Level 3: inputs for the asset or liability that are not based on observable market data (unobservable inputs).
If the inputs used to measure the fair value of an asset or a liability fall into different levels of the fair value hierarchy, then the fair value measurement is categorised in its entirety in the same level of the fair value hierarchy as the lowest level input that is significant to the entire measurement (with Level 3 being the lowest).
The Group recognises transfers between levels of the fair value hierarchy as of the end of the reporting period during which the change has occurred.
Further information about the assumptions made in measuring fair values is included in the following notes:
• Note 4 – Investment properties;
• Note 27 – Valuation of financial instruments.
ANNUAL REPORT 2017
107
FINA
NC
IALS
& A
DD
ITIO
NA
L INFO
RM
AT
ION
P
OR
TFO
LIO D
ETA
ILS
BU
SINE
SS RE
VIE
W
SUSTA
INA
BILIT
Y
CO
RP
OR
AT
E G
OV
ER
NA
NC
E &
TR
AN
SPA
RE
NC
Y
OV
ER
VIE
W

NOTES TO THEFINANCIAL STATEMENTSYear ended 31 December 2017
2. BASIS OF PREPARATION (continued)
(e) Changes in accounting policies
Disclosure Initiative (Amendments to FRS 7)
From 1 January 2017, as a result of the amendments to FRS 7, the Group has provided additional disclosure in relation to the changes in liabilities arising from financing activities for the year ended 31 December 2017. Comparative information has not been presented (see Note 10).
3. SIGNIFICANT ACCOUNTING POLICIES
The accounting policies set out below have been applied consistently to all periods presented in these financial statements, and have been applied consistently by Group entities.
(a) Basis of consolidation
(i) Subsidiaries
Subsidiaries are entities controlled by the Group. The Group controls an entity when it is exposed to, or has rights to, variable returns from its involvement with the entity and has the ability to affect those returns through its power over the entity. The financial statements of subsidiaries are included in the consolidated financial statements from the date that control commences until the date that control ceases.
Where the Group acquires an asset or a group of assets that does not constitute a business, the cost of the investment is allocated to the individual identifiable assets acquired and liabilities assumed at the date of acquisition.
(ii) Loss of control
Upon the loss of control, the Trust derecognises the assets and liabilities of the subsidiary, any non-controlling interest and the other components of equity related to the subsidiary. Any surplus or deficit arising on the loss of control is recognised in the statement of total return.
If the Group retains any interest in the previous subsidiary, then such interest is measured at fair value at the date that control is lost. Subsequently, it is accounted for as an equity-accounted investee or as an available-for-sale financial asset depending on the level of influence retained.
(iii) Transactions eliminated on consolidation
Intra-group balances and transactions, and any unrealised income or expenses arising from intra-group transactions, are eliminated in preparing the consolidated financial statements. Unrealised gains arising from transactions with equity-accounted investees are eliminated against the investment to the extent of the Group’s interest in the investee. Unrealised losses are eliminated in the same way as unrealised gains, but only to the extent that there is no evidence of impairment.
(iv) Accounting for subsidiaries by the Trust
Investments in subsidiaries are stated in the Trust’s statement of financial position at cost less accumulated impairment losses.
CAPITALAND RETAIL CHINA TRUST
108

NOTES TO THEFINANCIAL STATEMENTSYear ended 31 December 2017
3. SIGNIFICANT ACCOUNTING POLICIES (continued)
(b) Foreign currency
(i) Foreign currency transactions
Transactions in foreign currencies are translated at the exchange rates at the dates of the transactions. Monetary assets and liabilities denominated in foreign currencies at the reporting date are translated to the functional currency at the exchange rates at that date. Non-monetary assets and liabilities denominated in foreign currencies that are measured at fair value are translated at the exchange rates at the date that the fair value was determined. Non-monetary items in a foreign currency that are measured in terms of historical cost are translated using the exchange rate at the date of the transaction.
Foreign currency differences arising on translation are recognised in the statement of total return, except for differences arising on the translation of monetary items that in substance form part of the Group’s net investment in a foreign operation (see Note 3(b)(iii)) and financial derivatives designated as hedges of the net investment in a foreign operation (see Note 3(b)(iv)).
(ii) Foreign operations
The assets and liabilities of foreign operations are translated to Singapore dollars at exchange rates at the reporting date. The income and expenses of foreign operations are translated to Singapore dollars at exchange rates at the dates of the transactions. Goodwill and fair value adjustments arising on the acquisition of a foreign operation are treated as assets and liabilities of the foreign operation and are translated at the exchange rate at the reporting date.
Foreign currency differences are recognised in the foreign currency translation reserve. When a foreign operation is disposed of, in part or in full, the cumulative amount in the translation reserve related to that foreign operation is reclassified to the statement of total return as part of the gain or loss on disposal.
(iii) Net investment in a foreign operation
When the settlement of a monetary item receivable from or payable to a foreign operation is neither planned nor likely in the foreseeable future, foreign exchange gains and losses arising from such a monetary item are considered to form part of a net investment in a foreign operation. These are recognised in Unitholders’ funds and are presented in the foreign currency translation reserve.
(iv) Hedge of net investment in foreign operation
Foreign currency differences arising on the translation of a financial instrument designated as a hedge of a net investment in a foreign operation are recognised in Unitholders’ funds to the extent that the hedge is effective, and are presented in the foreign currency translation reserve. To the extent that the hedge is ineffective, such differences are recognised in the statement of total return. When the hedged net investment is disposed of, the cumulative amount in the foreign currency translation reserve is transferred to the statement of total return as an adjustment to the gain or loss arising on disposal.
ANNUAL REPORT 2017
109
FINA
NC
IALS
& A
DD
ITIO
NA
L INFO
RM
AT
ION
P
OR
TFO
LIO D
ETA
ILS
BU
SINE
SS RE
VIE
W
SUSTA
INA
BILIT
Y
CO
RP
OR
AT
E G
OV
ER
NA
NC
E &
TR
AN
SPA
RE
NC
Y
OV
ER
VIE
W
NOTES TO THEFINANCIAL STATEMENTSYear ended 31 December 2017
3. SIGNIFICANT ACCOUNTING POLICIES (continued)
(c) Financial instruments
(i) Non-derivative financial assets
The Group initially recognises loans and receivables and deposits on the date that they are originated. All other financial assets are recognised initially on the trade date, which is the date that the Group becomes a party to the contractual provisions of the instrument.
The Group derecognises a financial asset when the contractual rights to the cash flows from the asset expire, or it transfers the rights to receive the contractual cash flows on the financial asset in a transaction in which substantially all the risks and rewards of ownership of the financial asset are transferred, or it neither transfers nor retains substantially all of the risks and rewards of ownership and does not retain control over the transferred asset. Any interest in transferred financial assets that is created or retained by the Group is recognised as a separate asset or liability.
Financial assets and liabilities are offset and the net amount presented in the statement of financial position when, and only when, the Group currently has a legally enforceable right to offset the amounts and intends either to settle on a net basis or to realise the asset and settle the liability simultaneously.
The Group has loans and receivables as its non-derivative financial assets.
Loans and receivables
Loans and receivables are financial assets with fixed or determinable payments that are not quoted in an active market. Such assets are initially measured at fair value plus any directly attributable transaction costs. Subsequent to initial recognition, loans and receivables are measured at amortised cost using the effective interest method, less any impairment losses.
Loans and receivables comprise non-trade amounts due from subsidiaries, trade and other receivables excluding prepayments and cash and cash equivalents.
Cash and cash equivalents comprise cash balances and bank deposits.
(ii) Non-derivative financial liabilities
Financial liabilities are recognised initially on the trade date, which is the date that the Group becomes a party to the contractual provisions of the instrument.
The Group derecognises a financial liability when its contractual obligations are discharged, cancelled or expired.
Financial assets and liabilities are offset and the net amount presented in the statement of financial position when, and only when, the Group currently has a legally enforceable right to offset the amounts and intends either to settle on a net basis or to realise the asset and settle the liability simultaneously.
The Group has the following non-derivative financial liabilities: trade and other payables, security deposits and interest-bearing borrowings.
Such financial liabilities are initially measured at fair value less any directly attributable transaction costs. Subsequent to initial recognition, these financial liabilities are measured at amortised cost using the effective interest method.
CAPITALAND RETAIL CHINA TRUST
110

NOTES TO THEFINANCIAL STATEMENTSYear ended 31 December 2017
3. SIGNIFICANT ACCOUNTING POLICIES (continued)
(c) Financial instruments (continued)
(iii) Derivative financial instruments, including hedge accounting
The Group holds derivative financial instruments to hedge its foreign currency and interest rate risk exposures. Embedded derivatives are separated from the host contract and accounted for separately if the economic characteristics and risks of the host contract and the embedded derivative are not closely related, a separate instrument with the same terms as the embedded derivative would meet the definition of a derivative, and the combined instrument is not measured at fair value through the statement of total return.
On initial designation of the derivative as the hedging instrument, the Group formally documents the relationship between the hedging instrument and hedged item, including the risk management objectives and strategy in undertaking the hedge transaction and the hedged risk, together with the methods that will be used to assess the effectiveness of the hedging relationship. The Group makes an assessment, both at the inception of the hedge relationship as well as on an ongoing basis, of whether the hedging instruments are expected to be “highly effective” in offsetting the changes in the fair value or cash flows of the respective hedged items attributable to the hedged risk, and whether the actual results of each hedge are within a range of 80%-125%. For a cash flow hedge of a forecast transaction, the transaction should be highly probable to occur and should present an exposure to variations in cash flows that could ultimately affect the statement of total return.
Derivatives are initially measured at fair value; any attributable transaction costs are recognised in the statement of total return when incurred. Subsequent to initial recognition, derivatives are measured at fair value, and changes therein are accounted for as described below.
Cash flow hedges
When a derivative is designated as the hedging instrument in a hedge of the variability in cash flows attributable to a particular risk associated with a recognised asset or liability or a highly probable forecast transaction that could affect total return, the effective portion of changes in the fair value of the derivative is recognised and presented in the hedging reserve in Unitholders’ fund. Any ineffective portion of changes in the fair value of the derivative is recognised immediately in the statement of total return.
When the hedged item is a non-financial asset, the amount recognised in the hedging reserve is transferred to the carrying amount of the asset when it is recognised. In other cases, the amount recognised in the hedging reserve is transferred to the statement of total return in the same period that the hedged item affects the statement of total return. If the hedging instrument no longer meets the criteria for hedge accounting, expires or is sold, terminated or exercised, or the designation is revoked, then the hedge accounting is discontinued prospectively. If the forecast transaction is no longer expected to occur, then the balance in the hedging reserve is recognised immediately in the statement of total return.
ANNUAL REPORT 2017
111
FINA
NC
IALS
& A
DD
ITIO
NA
L INFO
RM
AT
ION
P
OR
TFO
LIO D
ETA
ILS
BU
SINE
SS RE
VIE
W
SUSTA
INA
BILIT
Y
CO
RP
OR
AT
E G
OV
ER
NA
NC
E &
TR
AN
SPA
RE
NC
Y
OV
ER
VIE
W

NOTES TO THEFINANCIAL STATEMENTSYear ended 31 December 2017
3. SIGNIFICANT ACCOUNTING POLICIES (continued)
(d) Investment properties
Investment properties are properties held either to earn rental income or for capital appreciation or both. Investment properties are accounted for as non-current assets and are stated at initial cost on acquisition and at fair value thereafter. The cost of a purchased property comprises its purchase price and any directly attributable expenditure. Transaction costs are included in the initial measurement. Fair value is determined in accordance with the Trust Deed, which requires the investment properties to be valued by independent registered valuers at least once a year in accordance with the CIS Code issued by the MAS.
Any increase or decrease on revaluation is credited or charged to the statement of total return as a net change in fair value of the investment properties.
Subsequent expenditure relating to investment properties that have already been recognised is added to the carrying amount when it is probable that future economic benefits, in excess of the originally assessed standard of performance of the existing asset will flow to the Group.
All other subsequent expenditure is recognised as an expense in the period in which it is incurred.
When an investment property is disposed of, the resulting gain or loss recognised in the statement of total return is the difference between the net disposal proceeds and the carrying amount of the property.
Investment properties are not depreciated. The properties are subject to continued maintenance and regularly revalued on the basis set out above.
(e) Plant and equipment
(i) Recognition and measurement
Plant and equipment are measured at cost less accumulated depreciation and accumulated impairment losses. Cost includes expenditure that is directly attributable to the acquisition of the asset.
When parts of an item of plant and equipment have different useful lives, they are accounted for as separate items (major components) of plant and equipment.
Gains or losses arising from the retirement or disposal of plant and equipment are determined as the difference between the estimated net disposal proceeds and the carrying amount of the asset and are recognised in the statement of total return on the date of retirement or disposal.
(ii) Subsequent costs
The cost of replacing part of an item of plant and equipment is recognised in the carrying amount of the item if it is probable that the future economic benefits embodied within the part will flow to the Group and its cost can be measured reliably. The costs of the day-to-day servicing of plant and equipment are recognised in the statement of total return as incurred.
CAPITALAND RETAIL CHINA TRUST
112

NOTES TO THEFINANCIAL STATEMENTSYear ended 31 December 2017
3. SIGNIFICANT ACCOUNTING POLICIES (continued)
(e) Plant and equipment (continued)
(iii) Depreciation
Depreciation is provided on a straight-line basis so as to write off items of plant and equipment, and major components that are accounted for separately, over their estimated useful lives as follows:
Improvement to premises – 5 yearsPlant and machinery – 3 to 5 yearsMotor vehicles – 5 yearsFurniture, fittings and equipment – 2 to 5 years
Depreciation methods, useful lives and residual values are reviewed, and adjusted as appropriate, at each reporting date.
(f) Impairment
(i) Financial assets (including receivables)
A financial asset not carried at fair value through the statement of total return is assessed at the end of each reporting period to determine whether there is objective evidence that it is impaired. A financial asset is impaired if objective evidence indicates that a loss event has occurred after the initial recognition of the asset, and that the loss event has a negative impact on the estimated future cash flows of that asset that can be estimated reliably.
Objective evidence that financial assets are impaired can include default or delinquency by a debtor, restructuring of an amount due to the Group on terms that the Group would not consider otherwise, or indications that a debtor will enter bankruptcy.
The Group considers evidence of impairment for receivables at both a specific asset and collective level. All individually significant receivables are assessed for specific impairment. All individually significant receivables found not to be specifically impaired are then collectively assessed for any impairment that has been incurred but not yet identified. Receivables that are not individually significant are collectively assessed for impairment by grouping together receivables with similar risk characteristics.
In assessing collective impairment, the Group uses historical trends of the probability of default, timing of recoveries and the amount of loss incurred, adjusted for management’s judgement as to whether current economic and credit conditions are such that the actual losses are likely to be greater or less than suggested by historical trends.
An impairment loss in respect of a financial asset measured at amortised cost is calculated as the difference between its carrying amount and the present value of the estimated future cash flows, discounted at the asset’s original effective interest rate. Losses are recognised in the statement of total return and reflected in an allowance account against receivables. Interest on the impaired asset continues to be recognised. When the Group considers that there are no realistic prospects of recovery of the asset, the relevant amounts are written off. If the amount of impairment loss subsequently decreases and the decrease can be related objectively to an event occurring after the impairment was recognised, then the previously recognised impairment loss is reversed through the statement of total return.
ANNUAL REPORT 2017
113
FINA
NC
IALS
& A
DD
ITIO
NA
L INFO
RM
AT
ION
P
OR
TFO
LIO D
ETA
ILS
BU
SINE
SS RE
VIE
W
SUSTA
INA
BILIT
Y
CO
RP
OR
AT
E G
OV
ER
NA
NC
E &
TR
AN
SPA
RE
NC
Y
OV
ER
VIE
W

NOTES TO THEFINANCIAL STATEMENTSYear ended 31 December 2017
3. SIGNIFICANT ACCOUNTING POLICIES (continued)
(f) Impairment (continued)
(ii) Non-financial assets
The carrying amounts of the Group’s non–financial assets, other than investment properties, are reviewed at each reporting date to determine whether there is any indication of impairment. If any such indication exists, then the asset’s recoverable amount is estimated. An impairment loss is recognised if the carrying amount of an asset or its related cash-generating unit (“CGU”) exceeds its estimated recoverable amount.
The recoverable amount of an asset or CGU is the greater of its value in use and its fair value less costs to sell. In assessing value in use, the estimated future cash flows are discounted to their present value using a pre-tax discount rate that reflects current market assessments of the time value of money and the risks specific to the asset or CGU. For the purpose of impairment testing, assets that cannot be tested individually are grouped together into the smallest group of assets that generates cash inflows from continuing use that are largely independent of the cash inflows of other assets or CGUs.
Impairment losses are recognised in the statement of total return. Impairment losses recognised in respect of CGUs are allocated first to reduce the carrying amount of any goodwill allocated to the CGU (group of CGUs), and then to reduce the carrying amounts of the other assets in the CGU (group of CGUs) on a pro rata basis.
An impairment loss in respect of goodwill is not reversed. In respect of other assets, impairment losses recognised in prior periods are assessed at each reporting date for any indications that the loss has decreased or no longer exists. An impairment loss is reversed if there has been a change in the estimates used to determine the recoverable amount. An impairment loss is reversed only to the extent that the asset’s carrying amount does not exceed the carrying amount that would have been determined, net of depreciation or amortisation, if no impairment loss had been recognised.
(g) Unitholders’ funds
Unitholders’ funds represent the residual interests in the Group’s net assets upon termination and are classified as equity.
Expenses incurred in connection with the issuance of Units in the Trust are deducted directly against the Unitholders’ funds.
(h) Employee benefits
(i) Defined contribution plans
Obligations for contributions to defined contribution pension plans are recognised as an expense in the statement of total return as incurred.
(ii) Short-term benefits
Short-term employee benefit obligations are measured on an undiscounted basis and are expensed as the related service is provided.
A provision is recognised for the amount expected to be paid under short-term cash bonus if the Group has a present legal or constructive obligation to pay this amount as a result of past service provided by the employee, and the obligation can be estimated reliably.
CAPITALAND RETAIL CHINA TRUST
114

NOTES TO THEFINANCIAL STATEMENTSYear ended 31 December 2017
3. SIGNIFICANT ACCOUNTING POLICIES (continued)
(i) Distribution policy
The Trust’s distribution policy is to distribute at least 90.0% of its distributable income in each financial year to Unitholders, other than from the sale of properties that are determined by Inland Revenue Authority of Singapore to be trading gains.
(j) Revenue recognition
(i) Rental income
Rental income receivable under operating leases is recognised on a straight-line basis over the term of the lease, except where an alternative basis is more representative of the time pattern of benefits to be derived from the leased assets. Lease incentives granted are recognised as an integral part of the total rental to be received. Contingent rentals, which include gross turnover rental, are recognised as income in the accounting period on an earned basis. No contingent rental is recognised if there are uncertainties due to the possible return of the amounts received.
(ii) Dividend income
Dividend income is recognised when the right to receive payment is established.
(k) Lease payments
Payment made under operating leases are recognised in the statement of total return on a straight-line basis over the term of the lease. Lease incentives received are recognised as an integral part of the total lease expense, over the term of the lease.
Contingent lease payments are accounted for by revising the minimum lease payments over the remaining term of the lease when the lease adjustment is confirmed.
(l) Expenses
(i) Property expenses
Property expenses are recognised on an accrual basis.
(ii) Manager’s management fees, property management fees and Trustee’s fees
These are recognised on an accrual basis based on the applicable formula stipulated in Note 1.
(m) Finance income and finance costs
Finance income comprises interest income recognised in the statement of total return as it accrues, using the effective interest method and gain on hedging instruments that are recognised in the statement of total return.
Finance costs which comprise interest expense on borrowings and expense incurred in connection with borrowings are recognised in the statement of total return, using the effective interest method over the period of the borrowings and loss on hedging instruments that are recognised in the statement of total return.
ANNUAL REPORT 2017
115
FINA
NC
IALS
& A
DD
ITIO
NA
L INFO
RM
AT
ION
P
OR
TFO
LIO D
ETA
ILS
BU
SINE
SS RE
VIE
W
SUSTA
INA
BILIT
Y
CO
RP
OR
AT
E G
OV
ER
NA
NC
E &
TR
AN
SPA
RE
NC
Y
OV
ER
VIE
W
NOTES TO THEFINANCIAL STATEMENTSYear ended 31 December 2017
3. SIGNIFICANT ACCOUNTING POLICIES (continued)
(n) Taxation
Taxation on the returns for the year comprises current and deferred tax. Taxation is recognised in the statement of total return except to the extent that it relates to items recognised directly in Unitholders’ fund.
Current tax is the expected tax payable on the taxable income for the year, using tax rates enacted or substantively enacted at the reporting date, and any adjustment to tax payable in respect of previous years. The amount of current tax payable is the best estimate of the tax amount expected to be paid that reflects uncertainty related to income taxes, if any.
Deferred tax is recognised in respect of temporary differences between the carrying amounts of assets and liabilities for financial reporting purposes and the amounts used for taxation purposes. Deferred tax is not recognised for:
• temporary differences on the initial recognition of assets or liabilities in a transaction that is not a business combination and that affects neither accounting nor taxable profit; and
• temporary differences related to investments in subsidiaries to the extent that it is probable that they will not reverse in the foreseeable future.
Deferred tax is measured at the tax rates that are expected to be applied to the temporary differences when they reverse, based on the laws that have been enacted or substantively enacted by the reporting date. Deferred tax assets and liabilities are offset if there is a legally enforceable right to offset current tax liabilities and assets, and they relate to taxes levied by the same tax authority on the same taxable entity, or on different tax entities, but they intend to settle current tax liabilities and assets on a net basis or their tax assets and liabilities will be realised simultaneously.
A deferred tax asset is recognised only to the extent that it is probable that future taxable profits will be available against which the unused tax losses and credits can be utilised. Deferred tax assets are reviewed at each reporting date and are reduced to the extent that it is no longer probable that the related tax benefits will be realised.
Except for the tax exemption as described below, income earned by the Trust will be subject to Singapore income tax at the Trust level at the prevailing corporate tax rate.
The Trust is exempted from Singapore income tax under Section 13(12) of the Singapore Income Tax Act on the following income:
(i) dividends; and
(ii) interest on shareholders’ loans,
payable by its subsidiaries in Barbados and Singapore out of underlying rental income derived from the investment properties in China.
This exemption is granted subject to certain conditions, including the condition that the Trustee is a tax resident of Singapore.
The tax exemption also applies to dividends payable by these subsidiaries out of gains, if any, derived from the disposal of their shares in the subsidiaries in China.
CAPITALAND RETAIL CHINA TRUST
116
NOTES TO THEFINANCIAL STATEMENTSYear ended 31 December 2017
3. SIGNIFICANT ACCOUNTING POLICIES (continued)
(o) Earnings per Unit
The Group presents basic and diluted earnings per Unit (“EPU”) data for its Units. Basic EPU is calculated by dividing the total return attributable to Unitholders of the Group by the weighted average number of ordinary Units outstanding during the period. Diluted EPU is determined by adjusting the total return attributable to Unitholders and the weighted average number of Units outstanding for the effects of all dilutive potential Units.
(p) Segment reporting
An operating segment is a component of the Group that engages in business activities from which it may earn revenues and incur expenses, including revenues and expenses that relate to transactions with any of the Group’s other components. Operating segments are reported in a manner consistent with the internal reporting provided to the Chief Operating Decision–Makers (“CODMs”).
Segment results that are reported to the CODMs include items directly attributable to a segment as well as those that can be allocated on a reasonable basis. Unallocated items comprise mainly financial derivative assets and liabilities, other receivables, cash and cash equivalents, trade and other payables, and interest-bearing borrowings.
Segment capital expenditure is the total cost incurred during the year to acquire plant and equipment and capital expenditure on investment properties.
(q) New standards, interpretations and revised recommended accounting practice not yet adopted
A number of new standards, amendments to standards are effective for annual periods beginning after 1 January 2017 and earlier application is permitted; however the Group has not early applied the following new or amended standards in preparing these financial statements.
Applicable to 2018 financial statements
FRS 115 Revenue from Contracts with Customers
FRS 115 establishes a comprehensive framework for determining whether, how much and when revenue is recognised. It also introduces new cost guidance which requires certain costs of obtaining and fulfilling contracts to be recognised as separate assets when specified criteria are met.
When effective, FRS 115 replaces existing revenue recognition guidance, including FRS 18 Revenue, FRS 11 Construction Contracts, INT FRS 113 Customer Loyalty Programmes, INT FRS 115 Agreements for the Construction of Real Estate, INT FRS 118 Transfers of Assets from Customers and INT FRS 31 Revenue – Barter Transactions Involving Advertising Services.
FRS 115 is effective for annual periods beginning on or after 1 January 2018, with early adoption permitted.
The Group does not expect the impact on the financial statements to be significant. The Group plans to adopt the standard when it becomes effective in 2018.
ANNUAL REPORT 2017
117
FINA
NC
IALS
& A
DD
ITIO
NA
L INFO
RM
AT
ION
P
OR
TFO
LIO D
ETA
ILS
BU
SINE
SS RE
VIE
W
SUSTA
INA
BILIT
Y
CO
RP
OR
AT
E G
OV
ER
NA
NC
E &
TR
AN
SPA
RE
NC
Y
OV
ER
VIE
W

NOTES TO THEFINANCIAL STATEMENTSYear ended 31 December 2017
3. SIGNIFICANT ACCOUNTING POLICIES (continued)
(q) New standards, interpretations and revised recommended accounting practice not yet adopted (continued)
Applicable to 2018 financial statements (continued)
FRS 109 Financial Instruments
FRS 109 replaces most of the existing guidance in FRS 39 Financial Instruments: Recognition and Measurement. It includes revised guidance on the classification and measurement of financial instruments, a new expected credit loss model for calculating impairment on financial assets, and new general hedge accounting requirements. It also carries forward the guidance on recognition and derecognition of financial instruments from FRS 39.
FRS 109 is effective for annual periods beginning on or after 1 January 2018, with early adoption permitted.
The Group does not expect the impact on the financial statements to be significant.
The Group does not expect a significant change to the measurement basis arising from adopting the new classification and measurement model under FRS 109. Loans and receivables that are currently accounted for at amortised cost will continue to be accounted for using amortised cost model under FRS 109. For financial assets currently held at fair value, the Group expects to continue measuring most of these assets at fair value under FRS 109.
The Group plans to apply the simplified approach and record lifetime expected impairment losses on all trade receivables and any contract assets arising from the application of FRS 115. On adoption of FRS 109, the Group does not expect a significant increase in the impairment loss allowance.
The Group expects that all its existing hedges that are designated in effective hedging relationships will continue to qualify for hedge accounting under FRS 109.
The Group plans to adopt the standard when it becomes effective in 2018.
Applicable to 2019 financial statements
FRS 116 Leases
FRS 116 eliminates the lessee’s classification of leases as either operating leases or finance leases and introduces a single lessee accounting model. Applying the new model, a lessee is required to recognise right-of-use (ROU) assets and lease liabilities for all leases with a term of more than 12 months, unless the underlying asset is of low value.
FRS 116 substantially carries forward the lessor accounting requirements in FRS 17 Leases. Accordingly, a lessor continues to classify its leases as operating leases or finance leases, and to account for these two types of leases using the FRS 17 operating lease and finance lease accounting models respectively. However, FRS 116 requires more extensive disclosures to be provided by a lessor.
When effective, FRS 116 replaces existing lease accounting guidance, including FRS 17, INT FRS 104 Determining whether an Arrangement contains a Lease, INT FRS 15 Operating Leases – Incentives, and INT FRS 27 Evaluating the Substance of Transactions Involving the Legal Form of a Lease.
CAPITALAND RETAIL CHINA TRUST
118

NOTES TO THEFINANCIAL STATEMENTSYear ended 31 December 2017
3. SIGNIFICANT ACCOUNTING POLICIES (continued)
(q) New standards, interpretations and revised recommended accounting practice not yet adopted (continued)
Applicable to 2019 financial statements (continued)
FRS 116 Leases (continued)
FRS 116 is effective for annual periods beginning on or after 1 January 2019, with early adoption permitted if FRS 115 is also applied.
The Group has performed a preliminary high-level assessment of the new standard on its existing operating lease arrangements as a lessee. Based on the preliminary assessment, the Group expects these operating leases to be recognised as investment properties with corresponding lease liabilities under the new standard. The operating lease commitments on an undiscounted basis is immaterial. Assuming no additional new operating leases in future years until the effective date, the Group expects lease liabilities to be lower as the lease terms run down.
The Group plans to adopt the standard when it becomes effective in 2019.
4. INVESTMENT PROPERTIES
Group2017 2016$’000 $’000
At 1 January 2,628,353 2,412,626Acquisition of investment property1 – 307,939Disposal of investment property (202,161) –Expenditure capitalised 12,033 18,744Changes in fair value 41,457 41,151Translation differences (38,658) (152,107)At 31 December 2,441,024 2,628,353
1 Includes acquisition fees and acquisition related expenses of $5,654,000.
Investment properties are stated at fair value based on valuation performed by independent professional valuers having appropriate recognised professional qualifications and recent experience in the location and category of property being valued. In determining the fair value, the valuers have used valuation methods which involve certain estimates. The Manager reviews the key valuation parameters and underlying data including discount, capitalisation and terminal yield rates adopted by the valuers and is of the view that the valuation methods and estimates are reflective of the current market conditions.
The fair values are based on open market values, being the estimated amount for which a property could be exchanged on the date of the valuation between a willing buyer and a willing seller in an arm’s length transaction wherein the parties had each acted knowledgably and without compulsion.
The valuers have considered valuation techniques including the capitalisation and discounted cash flows approaches in arriving at the open market value as at the reporting date.
ANNUAL REPORT 2017
119
FINA
NC
IALS
& A
DD
ITIO
NA
L INFO
RM
AT
ION
P
OR
TFO
LIO D
ETA
ILS
BU
SINE
SS RE
VIE
W
SUSTA
INA
BILIT
Y
CO
RP
OR
AT
E G
OV
ER
NA
NC
E &
TR
AN
SPA
RE
NC
Y
OV
ER
VIE
W
NOTES TO THEFINANCIAL STATEMENTSYear ended 31 December 2017
4. INVESTMENT PROPERTIES (continued)
The capitalisation approach is an investment approach whereby the estimated gross passing income (on both passing and market rent basis) is adjusted to reflect anticipated operating costs to produce a net income on a fully leased basis. The adopted fully leased net income is capitalised over the remaining term of the lease from the valuation date at an appropriate capitalisation rate. The discounted cash flow method involves the estimation and projection of an income stream over a period and discounting the income stream with a risk adjusted discount rates to arrive at the market value.
Fair value of the investment properties were based on independent professional full valuations carried out by the following valuers on the dates stated below:
Valuers Valuation Date Valuation Date
Colliers International (Hong Kong) Limited 31 December 2017 –
Cushman & Wakefield International Property Advisers 31 December 2017 –
DTZ Debenham Tie Leung International Property Advisers (Shanghai) Co., Ltd.
– 31 December 2016
Knight Frank Petty Limited 31 December 2017 31 December 2016
CBRE Limited 31 December 2017 31 December 2016
Savills Valuation and Professional Services (S) Pte. Ltd. 31 December 2017 31 December 2016
Investment properties comprise retail properties that are held mainly for use by tenants under operating leases. Most leases contain an initial non-cancellable period of within 1 to 3 years (2016: within 1 to 3 years).
Contingent rents, representing income based on certain sales achieved by tenants, recognised in the statement of total return during the year amounted to $11.5 million (2016: $11.2 million).
Level 3 fair values
The following table shows the significant unobservable inputs used in the valuation models:
Valuation methods Significant unobservable inputs
Inter-relationship between key unobservable inputs and fair value measurement
Capitalisation approach • Capitalisation rates (from 4.25% to 8.00%) (2016: from 4.25% to 8.50%)
The fair value increases as capitalisation rates decreases.
Discounted cash flows approach
• Discount rates (from 7.00% to 10.75%) (2016: from 7.00% to 9.50%)
• Terminal rates (from 5.00% to 7.50%) (2016: from 5.00% to 7.50%)
The fair value increases as discount rates and terminal rates decreases.
CAPITALAND RETAIL CHINA TRUST
120
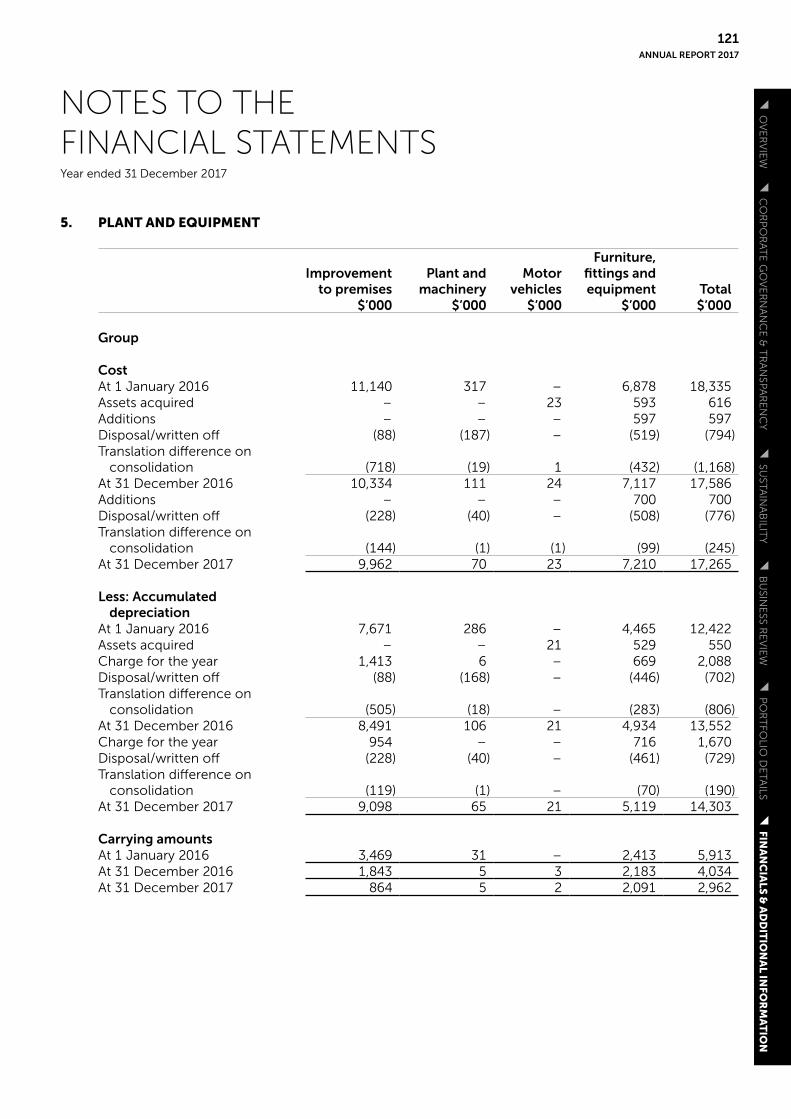
NOTES TO THEFINANCIAL STATEMENTSYear ended 31 December 2017
5. PLANT AND EQUIPMENT
Improvementto premises
Plant and machinery
Motorvehicles
Furniture, fittings and equipment Total
$’000 $’000 $’000 $’000 $’000
Group
CostAt 1 January 2016 11,140 317 – 6,878 18,335Assets acquired – – 23 593 616Additions – – – 597 597Disposal/written off (88) (187) – (519) (794)Translation difference on
consolidation (718) (19) 1 (432) (1,168)At 31 December 2016 10,334 111 24 7,117 17,586Additions – – – 700 700Disposal/written off (228) (40) – (508) (776)Translation difference on
consolidation (144) (1) (1) (99) (245)At 31 December 2017 9,962 70 23 7,210 17,265
Less: Accumulated depreciation
At 1 January 2016 7,671 286 – 4,465 12,422Assets acquired – – 21 529 550Charge for the year 1,413 6 – 669 2,088Disposal/written off (88) (168) – (446) (702)Translation difference on
consolidation (505) (18) – (283) (806)At 31 December 2016 8,491 106 21 4,934 13,552Charge for the year 954 – – 716 1,670Disposal/written off (228) (40) – (461) (729)Translation difference on
consolidation (119) (1) – (70) (190)At 31 December 2017 9,098 65 21 5,119 14,303
Carrying amountsAt 1 January 2016 3,469 31 – 2,413 5,913At 31 December 2016 1,843 5 3 2,183 4,034At 31 December 2017 864 5 2 2,091 2,962
ANNUAL REPORT 2017
121
FINA
NC
IALS
& A
DD
ITIO
NA
L INFO
RM
AT
ION
P
OR
TFO
LIO D
ETA
ILS
BU
SINE
SS RE
VIE
W
SUSTA
INA
BILIT
Y
CO
RP
OR
AT
E G
OV
ER
NA
NC
E &
TR
AN
SPA
RE
NC
Y
OV
ER
VIE
W

NOTES TO THEFINANCIAL STATEMENTSYear ended 31 December 2017
6. INTERESTS IN SUBSIDIARIES
Trust2017 2016$’000 $’000
(a) Unquoted equity, at cost 569,201 615,152Less: Allowance for impairment loss (8,815) –
560,386 615,152
(b) Loans to subsidiaries 333,054 358,007Non-trade amounts due from subsidiaries 432,605 443,035
765,659 801,042
1,326,045 1,416,194
Movement in allowance for impairment loss was as follows:
Trust2017 2016$’000 $’000
At 1 January – –Allowance for impairment loss (8,815) –At 31 December (8,815) –
(a) Details of the subsidiaries are as follows:
Name of subsidiariesPrincipal activities
Place ofincorporation/business
Effective equityheld by
the Group2017 2016
% %
(i) Direct subsidiaries
* CapitaRetail China Investments (B) Pte. Ltd.
Investmentholding
Barbados 100 100
* CapitaRetail China Investments (B) Alpha Pte. Ltd.
Investmentholding
Barbados 100 100
* CapitaRetail China Investments (B) Beta Pte. Ltd.
Investmentholding
Barbados 100 100
* CapitaRetail China Investments (B) Gamma Pte. Ltd.
Investmentholding
Barbados 100 100
CAPITALAND RETAIL CHINA TRUST
122

NOTES TO THEFINANCIAL STATEMENTSYear ended 31 December 2017
6. INTERESTS IN SUBSIDIARIES (continued)
(a) Details of the subsidiaries are as follows: (continued)
Name of subsidiariesPrincipal activities
Place ofincorporation/business
Effective equityheld by
the Group2017 2016
% %
(i) Direct subsidiaries (continued)
** CapitaRetail China Investments (BVI) Alpha Limited
Investmentholding
British Virgin Islands
100 100
*** Somerset (Wuhan) Investments Pte Ltd
Investmentholding
Singapore 100 100
*** CapitaLand Retail Investments (SY) Pte Ltd
Investmentholding
Singapore 100 100
* BR Spicy (HK) Limited Investmentholding
Hong Kong 100 100
*** Gold Rock Investment Pte Ltd
Investmentholding
Singapore 100 –
(ii) Indirect subsidiaries
Subsidiary of CapitaRetail China Investments (B) Pte. Ltd.
* CapitaRetail Beijing Wangjing Real Estate Co., Ltd.
Propertyinvestment
China 100 100
Subsidiaries of CapitaRetail China Investments (B) Alpha Pte. Ltd.
*# CapitaRetail Beijing Anzhen Real Estate Co., Ltd.
Propertyinvestment
China – 100
* CapitaRetail Dragon Mall (Shanghai) Co., Ltd.
Propertyinvestment
China 100 100
* CapitaRetail Beijing Shuangjing Real Estate Co., Ltd.
Propertyinvestment
China 100 100
* CapitaRetail Henan Zhongzhou Real Estate Co., Ltd.
Propertyinvestment
China 100 100
* Huaxin Saihan Huhhot Real Estate Co., Ltd.
Propertyinvestment
China 100 100
ANNUAL REPORT 2017
123
FINA
NC
IALS
& A
DD
ITIO
NA
L INFO
RM
AT
ION
P
OR
TFO
LIO D
ETA
ILS
BU
SINE
SS RE
VIE
W
SUSTA
INA
BILIT
Y
CO
RP
OR
AT
E G
OV
ER
NA
NC
E &
TR
AN
SPA
RE
NC
Y
OV
ER
VIE
W
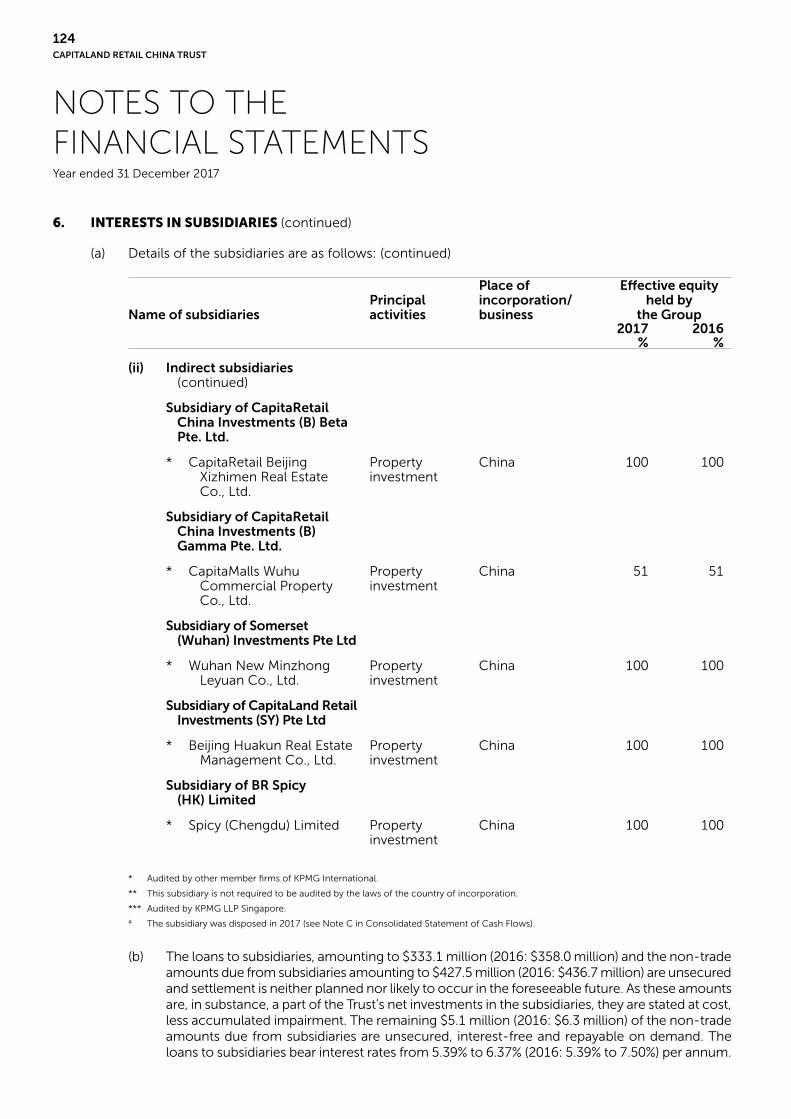
NOTES TO THEFINANCIAL STATEMENTSYear ended 31 December 2017
6. INTERESTS IN SUBSIDIARIES (continued)
(a) Details of the subsidiaries are as follows: (continued)
Name of subsidiariesPrincipal activities
Place ofincorporation/business
Effective equityheld by
the Group2017 2016
% %
(ii) Indirect subsidiaries (continued)
Subsidiary of CapitaRetail China Investments (B) Beta Pte. Ltd.
* CapitaRetail Beijing Xizhimen Real Estate Co., Ltd.
Propertyinvestment
China 100 100
Subsidiary of CapitaRetail China Investments (B) Gamma Pte. Ltd.
* CapitaMalls Wuhu Commercial Property Co., Ltd.
Propertyinvestment
China 51 51
Subsidiary of Somerset (Wuhan) Investments Pte Ltd
* Wuhan New Minzhong Leyuan Co., Ltd.
Propertyinvestment
China 100 100
Subsidiary of CapitaLand Retail Investments (SY) Pte Ltd
* Beijing Huakun Real Estate Management Co., Ltd.
Propertyinvestment
China 100 100
Subsidiary of BR Spicy (HK) Limited
* Spicy (Chengdu) Limited Propertyinvestment
China 100 100
* Audited by other member firms of KPMG International.
** This subsidiary is not required to be audited by the laws of the country of incorporation.
*** Audited by KPMG LLP Singapore.# The subsidiary was disposed in 2017 (see Note C in Consolidated Statement of Cash Flows).
(b) The loans to subsidiaries, amounting to $333.1 million (2016: $358.0 million) and the non-trade amounts due from subsidiaries amounting to $427.5 million (2016: $436.7 million) are unsecured and settlement is neither planned nor likely to occur in the foreseeable future. As these amounts are, in substance, a part of the Trust’s net investments in the subsidiaries, they are stated at cost, less accumulated impairment. The remaining $5.1 million (2016: $6.3 million) of the non-trade amounts due from subsidiaries are unsecured, interest-free and repayable on demand. The loans to subsidiaries bear interest rates from 5.39% to 6.37% (2016: 5.39% to 7.50%) per annum.
CAPITALAND RETAIL CHINA TRUST
124
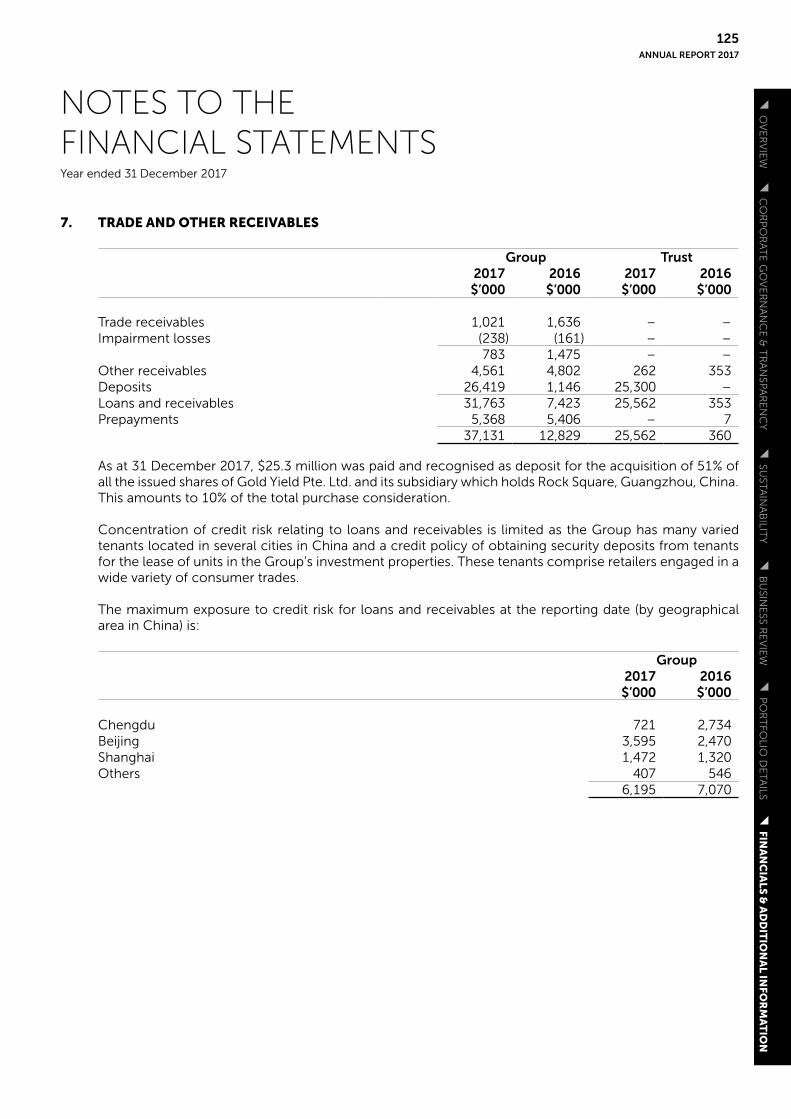
NOTES TO THEFINANCIAL STATEMENTSYear ended 31 December 2017
7. TRADE AND OTHER RECEIVABLES
Group Trust 2017 2016 2017 2016$’000 $’000 $’000 $’000
Trade receivables 1,021 1,636 – –Impairment losses (238) (161) – –
783 1,475 – –Other receivables 4,561 4,802 262 353Deposits 26,419 1,146 25,300 –Loans and receivables 31,763 7,423 25,562 353Prepayments 5,368 5,406 – 7
37,131 12,829 25,562 360
As at 31 December 2017, $25.3 million was paid and recognised as deposit for the acquisition of 51% of all the issued shares of Gold Yield Pte. Ltd. and its subsidiary which holds Rock Square, Guangzhou, China. This amounts to 10% of the total purchase consideration.
Concentration of credit risk relating to loans and receivables is limited as the Group has many varied tenants located in several cities in China and a credit policy of obtaining security deposits from tenants for the lease of units in the Group’s investment properties. These tenants comprise retailers engaged in a wide variety of consumer trades.
The maximum exposure to credit risk for loans and receivables at the reporting date (by geographical area in China) is:
Group 2017 2016$’000 $’000
Chengdu 721 2,734Beijing 3,595 2,470Shanghai 1,472 1,320Others 407 546
6,195 7,070
ANNUAL REPORT 2017
125
FINA
NC
IALS
& A
DD
ITIO
NA
L INFO
RM
AT
ION
P
OR
TFO
LIO D
ETA
ILS
BU
SINE
SS RE
VIE
W
SUSTA
INA
BILIT
Y
CO
RP
OR
AT
E G
OV
ER
NA
NC
E &
TR
AN
SPA
RE
NC
Y
OV
ER
VIE
W

NOTES TO THEFINANCIAL STATEMENTSYear ended 31 December 2017
7. TRADE AND OTHER RECEIVABLES (continued)
Impairment losses
The ageing of loans and receivables at the reporting date is:
Gross Impairment 2017 2016 2017 2016$’000 $’000 $’000 $’000
Group
Not past due 30,870 6,616 – –Past due 1 – 30 days 108 427 – –Past due 31 – 60 days 479 209 19 –Past due 61 – 90 days 43 126 – –More than 90 days past due 501 206 219 161
32,001 7,584 238 161
Trust
Not past due 25,562 353 – –
The movement in the allowance for impairment in respect of trade receivables during the year is as follows:
GroupNote 2017 2016
$’000 $’000
At 1 January 161 241Impairment losses on trade receivables, net 17 131 143Allowance utilised (51) (207)Translation difference (3) (16)At 31 December 238 161
The majority of the trade receivables are mainly from tenants that have good credit records with the Group. The allowance account in respect of trade receivables is used to record impairment losses unless the Group is satisfied that no recovery of the amount owing is possible; at that point the amounts are considered irrecoverable and are written off against the financial asset directly.
The Group’s historical experience in the collection of loans and receivables falls within the recorded allowances. The Manager believes that no additional credit risk beyond the amounts provided for collection losses is inherent in the Group’s loans and receivables, based on historical payment behaviours and the security deposits held (if applicable).
CAPITALAND RETAIL CHINA TRUST
126

NOTES TO THEFINANCIAL STATEMENTSYear ended 31 December 2017
8. CASH AND CASH EQUIVALENTS
Group Trust 2017 2016 2017 2016$’000 $’000 $’000 $’000
Bank balances 6,826 47,039 2,226 1,661Fixed deposits with financial institutions 179,689 89,098 7,404 –
186,515 136,137 9,630 1,661
9. TRADE AND OTHER PAYABLES
Group Trust 2017 2016 2017 2016$’000 $’000 $’000 $’000
Trade payable 1,137 1,422 51 69Accrued operating expenses 19,485 19,745 1,198 2,182Accrued development expenditure 6,098 8,223 – –Amounts due to related parties (trade) 2,689 2,698 1,669 1,740Other deposits and advances 26,571 26,906 – –Interest payable 2,046 1,860 2,046 1,766Other payables 1,537 3,673 – 3,630
59,563 64,527 4,964 9,387
Included in amounts due to related parties (trade) are amounts due to the Manager, Property and Project Managers of $1.7 million (2016: $1.7 million), $0.6 million (2016: $0.7 million) and $0.1 million (2016: $nil million) respectively.
ANNUAL REPORT 2017
127
FINA
NC
IALS
& A
DD
ITIO
NA
L INFO
RM
AT
ION
P
OR
TFO
LIO D
ETA
ILS
BU
SINE
SS RE
VIE
W
SUSTA
INA
BILIT
Y
CO
RP
OR
AT
E G
OV
ER
NA
NC
E &
TR
AN
SPA
RE
NC
Y
OV
ER
VIE
W

NOTES TO THEFINANCIAL STATEMENTSYear ended 31 December 2017
10. INTEREST-BEARING BORROWINGS
Group Trust Note 2017 2016 2017 2016
$’000 $’000 $’000 $’000
Unsecured term loans (a) 750,000 900,503 750,000 900,503Secured loan (b) – 58,943 – –Money market facilities – 19,800 – 19,800Less: Unamortised transactions costs (2,493) (1,495) (2,493) (1,495)
747,507 977,751 747,507 918,808
(a) As at 31 December 2017, unsecured term loans comprise nine $50.0 million, a $100.0 million and a $200.0 million floating rate trust term loans (collectively known as “Trust Term Loan Facilities”). These facilities have negative pledge covenants which require the Trust, amongst others:
(i) not to, without the prior written consent of the lender, create or have outstanding any security on or over the Group’s interest in any of the investment properties;
(ii) in the event of a sale of any of the investment properties, to repay an amount equal to the proportion of the market value of the investment properties sold to the total market value of the investment properties as determined by the lender based on the latest annual valuation reports of the investment properties; and
(iii) not to provide any guarantee for any other entities except for secured borrowings for new investment properties acquired with existing mortgages.
The Trust Term Loan Facilities are repayable in full at maturity, although the Trust has the option to make early prepayments.
(b) At the reporting date, RMB285.0 million (S$58.9 million) of the secured loan was fully repaid on 30 June 2017 and the legal mortgage was discharged.
CAPITALAND RETAIL CHINA TRUST
128

NOTES TO THEFINANCIAL STATEMENTSYear ended 31 December 2017
10. INTEREST-BEARING BORROWINGS (continued)
Terms and debt repayment schedule
Terms and conditions of the outstanding interest–bearing borrowings are as follows:
Nominal interest rate
per annumYear of
maturityFace
valueCarrying amount
% $’000 $’000
2017
Group
S$ unsecured floating rate loans 1.65-2.48 2019-2023 750,000 747,507
Trust
S$ unsecured floating rate loans 1.65-2.48 2019-2023 750,000 747,507
2016
Group
S$ unsecured floating rate money market facility 1.21-1.63 2017 19,800 19,800S$ unsecured fixed rate loan 2.75 2018 50,000 49,929S$ unsecured floating rate loans 1.02-2.94 2017-2021 850,503 849,079RMB secured floating rate term loan 4.75 2018 58,943 58,943
979,246 977,751
Trust
S$ unsecured floating rate money market facility 1.21-1.63 2017 19,800 19,800S$ unsecured fixed rate loan 2.75 2018 50,000 49,929S$ unsecured floating rate loans 1.02-2.94 2017-2021 850,503 849,079
920,303 918,808
ANNUAL REPORT 2017
129
FINA
NC
IALS
& A
DD
ITIO
NA
L INFO
RM
AT
ION
P
OR
TFO
LIO D
ETA
ILS
BU
SINE
SS RE
VIE
W
SUSTA
INA
BILIT
Y
CO
RP
OR
AT
E G
OV
ER
NA
NC
E &
TR
AN
SPA
RE
NC
Y
OV
ER
VIE
W

NOTES TO THEFINANCIAL STATEMENTSYear ended 31 December 2017
10. INTEREST-BEARING BORROWINGS (continued)
Terms and debt repayment schedule (continued)
The following are the contractual maturities of non-derivative financial liabilities, including estimated interest payments and excluding the impact of netting agreements:
Carrying amount
Contractualcash flow
Within 1 year
Within 2 to 5 years
After 5 years
$’000 $’000 $’000 $’000 $’000
2017
Group
S$ unsecured floating rate loans 747,507 817,938 17,354 600,300 200,284Trade and other payables
(Note 9) 59,563 59,563 59,563 – –Security deposits 50,818 50,818 21,519 25,585 3,714
857,888 928,319 98,436 625,885 203,998Trust
S$ unsecured floating rate loans 747,507 817,938 17,354 600,300 200,284Trade and other payables
(Note 9) 4,964 4,964 4,964 – –752,471 822,902 22,318 600,300 200,284
2016
Group
S$ unsecured floating rate money market facility 19,800 19,828 19,828 – –
S$ unsecured fixed rate loan 49,929 51,990 1,375 50,615 –S$ unsecured floating rate loans 849,079 898,487 440,931 457,556 –RMB secured floating rate
term loan 58,943 64,246 7,947 56,299 –Trade and other payables
(Note 9) 64,527 64,527 64,527 – –Security deposits 48,769 48,769 16,557 28,125 4,087
1,091,047 1,147,847 551,165 592,595 4,087
Trust
S$ unsecured floating rate money market facility 19,800 19,828 19,828 – –
S$ unsecured fixed rate loan 49,929 51,990 1,375 50,615 –S$ unsecured floating rate loans 849,079 898,487 440,931 457,556 –Trade and other payables
(Note 9) 9,387 9,387 9,387 – –928,195 979,692 471,521 508,171 –
It is not expected that the cash flows included in the maturity analysis could occur significantly earlier, or at significantly different amounts.
CAPITALAND RETAIL CHINA TRUST
130

NOTES TO THEFINANCIAL STATEMENTSYear ended 31 December 2017
10. INTEREST-BEARING BORROWINGS (continued)
Reconciliation of movements of liabilities to cash flows arising from financing activities
Non-cash changesAt
1 January 2017
Financingcash flows
Fair value(gain)/loss
Foreign exchange
movementOther
changes
At31 December
2017$’000 $’000 $’000 $’000 $’000 $’000
Interest-bearing borrowings 977,751 (230,074) – (1,177) (1,007) 747,507
Interest rate swap and forward exchange contracts used for hedging – assets (2,114) (267) 1,945 – – (436)
Interest rate swap and forward exchange contracts used for hedging – liabilities 2,165 (5,979) 11,617 – – 7,803
977,802 (236,320) 13,562 (1,177) (1,007) 754,874
ANNUAL REPORT 2017
131
FINA
NC
IALS
& A
DD
ITIO
NA
L INFO
RM
AT
ION
P
OR
TFO
LIO D
ETA
ILS
BU
SINE
SS RE
VIE
W
SUSTA
INA
BILIT
Y
CO
RP
OR
AT
E G
OV
ER
NA
NC
E &
TR
AN
SPA
RE
NC
Y
OV
ER
VIE
W

NOTES TO THEFINANCIAL STATEMENTSYear ended 31 December 2017
11. FINANCIAL DERIVATIVES
Group and Trust 2017 2016$’000 $’000
Financial derivative assets 436 2,114
Financial derivative liabilities (7,803) (2,165)
The following are the contractual maturities of financial derivative assets and liabilities, including estimated interest payments:
Carrying amount
Contractualcash flow
Within 1 year
Within 2 to 5 years
$’000 $’000 $’000 $’000
Group and Trust
Financial derivative assets2017Interest rate swaps 309 303 (251) 554Non-deliverable forwards 127 127 127 –
436 430 (124) 554
2016Interest rate swaps 890 1,462 (1,208) 2,670Non-deliverable forwards 1,224 1,224 1,224 –
2,114 2,686 16 2,670
Financial derivative liabilities2017Forwards (916) (916) (916) –Interest rate swaps (2,443) (2,666) (2,028) (638)Non-deliverable forwards (4,444) (4,444) (4,444) –
(7,803) (8,026) (7,388) (638)
2016Interest rate swaps (236) (311) (844) 533Non-deliverable forwards (1,929) (1,929) (1,929) –
(2,165) (2,240) (2,773) 533
As at reporting date, it is not expected that the cash flows included in the maturity analysis could occur significantly earlier, or at significantly different amounts.
The table also indicates the periods in which the cash flows associated with derivatives that are expected to occur and impact the statement of total return and Unitholders’ funds.
CAPITALAND RETAIL CHINA TRUST
132

NOTES TO THEFINANCIAL STATEMENTSYear ended 31 December 2017
12. DEFERRED TAX LIABILITIES
The movement in deferred tax liabilities during the financial year is as follows:
At 1 January
2016
Statementof totalreturn
(Note 21)Translationdifference
At31 December
2016
Statementof totalreturn
(Note 21)Disposal ofsubsidiary
Translationdifference
At 31 December
2017
$’000 $’000 $’000 $’000 $’000 $’000 $’000 $’000
Group
Deferred tax liabilities
Investment properties 228,909 18,318 (19,446) 227,781 17,990 (25,098) (3,443) 217,230
Tax on unrepatriated profits 7,858 787 – 8,645 2,543 (684) – 10,504
236,767 19,105 (19,446) 236,426 20,533 (25,782) (3,443) 227,734
Deferred tax assets have not been recognised in respect of the following item because it is not probable that future taxable profit will be available against which the Group can utilise the benefits therefrom:
Group 2017 2016$’000 $’000
Tax losses 36,061 44,701
The tax losses are subject to agreement by the tax authorities and compliance with tax regulations in the country in which the subsidiaries operate. These tax losses can be carried forward up to five consecutive years and will expire on the fifth year from which the tax losses arise.
ANNUAL REPORT 2017
133
FINA
NC
IALS
& A
DD
ITIO
NA
L INFO
RM
AT
ION
P
OR
TFO
LIO D
ETA
ILS
BU
SINE
SS RE
VIE
W
SUSTA
INA
BILIT
Y
CO
RP
OR
AT
E G
OV
ER
NA
NC
E &
TR
AN
SPA
RE
NC
Y
OV
ER
VIE
W
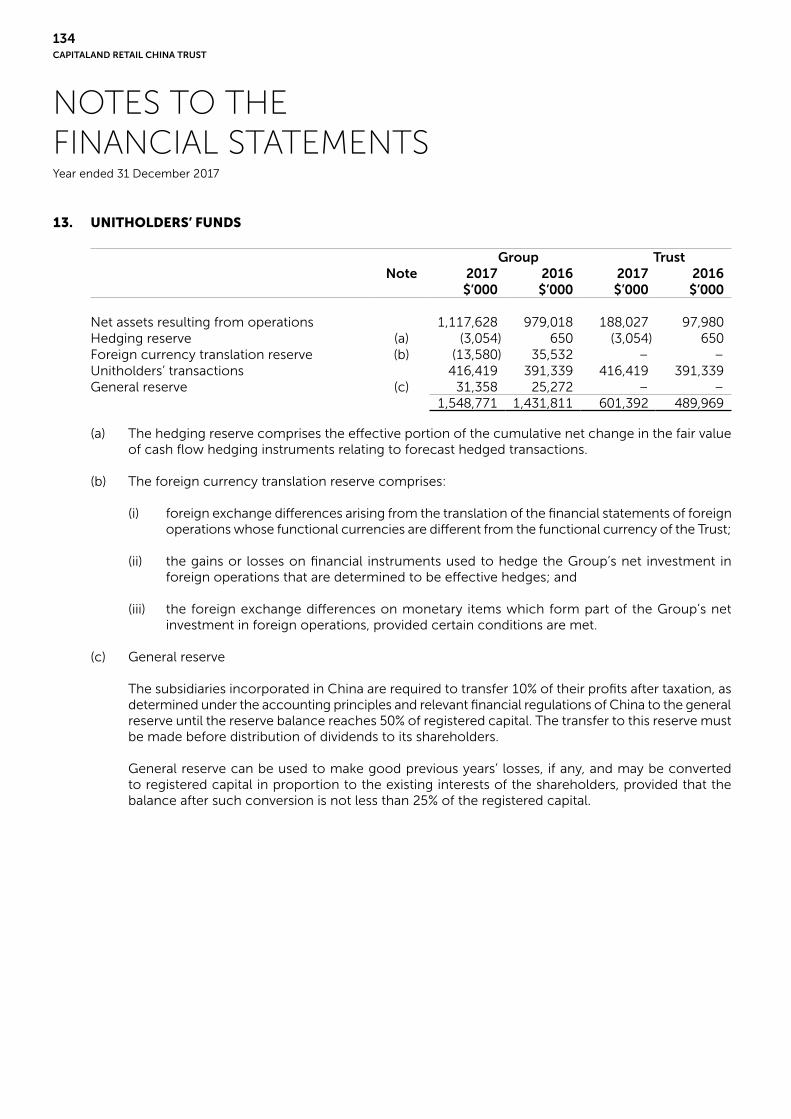
NOTES TO THEFINANCIAL STATEMENTSYear ended 31 December 2017
13. UNITHOLDERS’ FUNDS
Group Trust Note 2017 2016 2017 2016
$’000 $’000 $’000 $’000
Net assets resulting from operations 1,117,628 979,018 188,027 97,980Hedging reserve (a) (3,054) 650 (3,054) 650Foreign currency translation reserve (b) (13,580) 35,532 – –Unitholders’ transactions 416,419 391,339 416,419 391,339General reserve (c) 31,358 25,272 – –
1,548,771 1,431,811 601,392 489,969
(a) The hedging reserve comprises the effective portion of the cumulative net change in the fair value of cash flow hedging instruments relating to forecast hedged transactions.
(b) The foreign currency translation reserve comprises:
(i) foreign exchange differences arising from the translation of the financial statements of foreign operations whose functional currencies are different from the functional currency of the Trust;
(ii) the gains or losses on financial instruments used to hedge the Group’s net investment in foreign operations that are determined to be effective hedges; and
(iii) the foreign exchange differences on monetary items which form part of the Group’s net investment in foreign operations, provided certain conditions are met.
(c) General reserve
The subsidiaries incorporated in China are required to transfer 10% of their profits after taxation, as determined under the accounting principles and relevant financial regulations of China to the general reserve until the reserve balance reaches 50% of registered capital. The transfer to this reserve must be made before distribution of dividends to its shareholders.
General reserve can be used to make good previous years’ losses, if any, and may be converted to registered capital in proportion to the existing interests of the shareholders, provided that the balance after such conversion is not less than 25% of the registered capital.
CAPITALAND RETAIL CHINA TRUST
134

NOTES TO THEFINANCIAL STATEMENTSYear ended 31 December 2017
14. NON-CONTROLLING INTEREST
The following summarises the financial information of the Group’s significant subsidiary with material non-controlling interest. At the reporting date, the Group only had one subsidiary with significant non-controlling interest of 49% (2016: 49%), CapitaMalls Wuhu Commercial Property Co., Ltd.
Group2017 2016$’000 $’000
Non-current assets 43,672 46,490Current assets 1,153 936Non-current liabilities (17,914) (19,151)Current liabilities (29,327) (25,848)Net assets (2,416) 2,427
Net assets based on percentage shareholdings (1,184) 1,189Add: Loans from non-controlling interest
to the subsidiary in China 20,501 18,690Net assets attributable to non-controlling interest 19,317 19,879
Revenue 1,783 1,954Total return after taxation (4,642) (6,586)
Attributable to non-controlling interest:Total return after taxation (2,275) (3,227)Add: Interest on loans from non-controlling interest
to the subsidiary in China 629 620Total return allocated to non-controlling interest (1,646) (2,607)
Cash flows used in operating activities (1,594) (1,426)Cash flows used in investing activities (776) (318)Cash flows from financing activities 2,447 17Net increase/(decrease) in cash and cash equivalents 77 (1,727)
There are no dividends paid to non-controlling interests in 2017 and 2016.
ANNUAL REPORT 2017
135
FINA
NC
IALS
& A
DD
ITIO
NA
L INFO
RM
AT
ION
P
OR
TFO
LIO D
ETA
ILS
BU
SINE
SS RE
VIE
W
SUSTA
INA
BILIT
Y
CO
RP
OR
AT
E G
OV
ER
NA
NC
E &
TR
AN
SPA
RE
NC
Y
OV
ER
VIE
W

NOTES TO THEFINANCIAL STATEMENTSYear ended 31 December 2017
15. UNITS IN ISSUE
2017 2016Number of
UnitsNumber of
Units
Balance as at beginning of year 869,679,633 843,256,155
New Units issued:– as payment of Manager’s management fees 4,177,316 945,766– in connection with private placement exercise 64,392,000 –– as payment of distribution through distribution reinvestment plan 27,976,952 25,477,712Total issued Units as at end of the year 966,225,901 869,679,633
New Units to be issued:– as payment of Manager’s management fees 3,720,617 4,177,316Total issued and issuable Units as at end of the year 969,946,518 873,856,949
Units issued during the year ended 31 December 2017 are as follows:
(a) On 2 March 2017, the Trust issued 4,177,316 new Units at an issue price of $1.3556 per Unit as payment of the performance component of the management fee for the period from 1 January 2016 to 31 December 2016;
(b) On 23 March 2017, the Trust issued 14,888,722 new Units at an issue price of $1.3830 per Unit as payment of distribution under distribution reinvestment plan for the period from 1 July 2016 to 31 December 2016;
(c) On 20 September 2017, the Trust issued 13,088,230 new Units at an issue price of $1.5910 per Unit as payment of distribution under distribution reinvestment plan for the period from 1 January 2017 to 30 June 2017; and
(d) On 7 December 2017, the Trust issued 64,392,000 new Units at an issue price of $1.6120 per Unit to partially fund the joint acquisition of Rock Square.
Units issued during the year ended 31 December 2016 are as follows:
(a) On 14 March 2016, the Trust issued 945,766 new Units at an issue price of $1.4887 per Unit as payment of the performance component of the management fee for the period from 1 October 2015 to 31 December 2015;
(b) On 30 March 2016, the Trust issued 11,094,216 new Units at an issue price of $1.3910 per Unit as payment of distribution under distribution reinvestment plan for the period from 1 July 2015 to 31 December 2015; and
(c) On 20 September 2016, the Trust issued 14,383,496 new Units at an issue price of $1.5090 per Unit as payment of distribution under distribution reinvestment plan for the period from 1 January 2016 to 30 June 2016.
The issue prices were determined based on the volume weighted average traded price for all trades done on the SGX-ST in the ordinary course of trading for the last 10 business days of the relevant periods in which the management fees accrue.
CAPITALAND RETAIL CHINA TRUST
136

NOTES TO THEFINANCIAL STATEMENTSYear ended 31 December 2017
15. UNITS IN ISSUE (continued)
Each Unit in the Trust represents an undivided interest in the Trust. The rights and interests of Unitholders are contained in the Trust Deed and include the right to:
• one vote per Unit;
• receive income and other distributions attributable to the Units held;
• participate in the termination of the Trust by receiving a share of all net cash proceeds derived from the realisation of the assets of the Trust less any liabilities, in accordance with their proportionate interests in the Trust. However, a Unitholder has no equitable or proprietary interest in the underlying assets of the Trust and is not entitled to the transfer of any assets (or part thereof) or any estate or interest in any asset (or part thereof) of the Trust; and
• attend all Unitholders’ meetings. The Trustee or the Manager may (and the Manager shall at the request in writing of not less than 50 Unitholders or one-tenth in number of Unitholders, whichever is lesser) at any time convene a meeting of Unitholders in accordance with the provisions of the Trust Deed.
The restrictions of a Unitholder include the following:
• a Unitholder’s right is limited to the right to require due administration of the Trust in accordance with the provisions of the Trust Deed; and
• a Unitholder has no right to request the Manager to redeem his Units while the Units are listed on the SGX-ST.
A Unitholder’s liability is limited to the amount paid or payable for any Unit in the Trust. The provisions of the Trust Deed provide that no Unitholder will be personally liable to indemnify the Trustee or any creditor of the Trustee in the event that the liabilities of the Trust exceed its assets.
ANNUAL REPORT 2017
137
FINA
NC
IALS
& A
DD
ITIO
NA
L INFO
RM
AT
ION
P
OR
TFO
LIO D
ETA
ILS
BU
SINE
SS RE
VIE
W
SUSTA
INA
BILIT
Y
CO
RP
OR
AT
E G
OV
ER
NA
NC
E &
TR
AN
SPA
RE
NC
Y
OV
ER
VIE
W
NOTES TO THEFINANCIAL STATEMENTSYear ended 31 December 2017
16. TOTAL UNITHOLDERS’ DISTRIBUTION
Unitholders’ distribution for the year is accounted for as distribution from operations and distribution from Unitholders’ contributions:
(a) Distribution from operations
This refers to distribution made by the Trust that is represented by income received or receivable during the financial year, as the case may be, net of expenses. Such income comprises mainly the following:
• dividend from subsidiaries in Barbados, Singapore and Hong Kong paid out of dividend declared by the subsidiaries in China;
• dividend from subsidiaries in Barbados paid out of net interest income earned by subsidiaries in Barbados on shareholders’ loans extended to subsidiaries in China; and
• interest income earned by the Trust on shareholders’ loans extended to subsidiaries in Barbados.
The above income originates from income derived by the subsidiaries in China in respect of the current financial year.
(b) Distribution from Unitholders’ contributions
This refers to the amount of distribution made by the Trust for the financial year where the underlying cash is not, or may not be, received or receivable as income by the Trust during that period. Such distribution comprises mainly the following:
• profits from operations arising from the investment properties which are declared as dividend income after the financial year, as the case may be, and accordingly also received as dividends by the Trust after that year;
• profits from operations arising from the investment properties which cannot be declared as dividends;
• adjustment for depreciation expenses of the investment properties; and
• adjustments for trust expenses that are paid in Units, foreign currency differences attributable to net investment hedges undertaken by the Trust and certain unrealised expenses.
Income available for distribution to Unitholders at end of the year
Distributions are made on a semi-annual basis, with the amount calculated as at 30 June and 31 December each year for the six–month period ending on each of the said dates. In accordance with the provisions of the Trust Deed, the Manager is required to pay distributions within 90 days from the end of each distribution period. Distributions, when paid, will be in Singapore dollars.
Distribution for the period from 1 January 2017 to 30 June 2017 was paid on 20 September 2017. Distribution for the period from 1 July 2017 to 6 December 2017 was paid on 21 December 2017 in an advance distribution. Distribution for the period from 7 December 2017 to 31 December 2017 will be paid within 90 days of the end of the distribution period, in accordance with the provisions of the Trust Deed.
CAPITALAND RETAIL CHINA TRUST
138
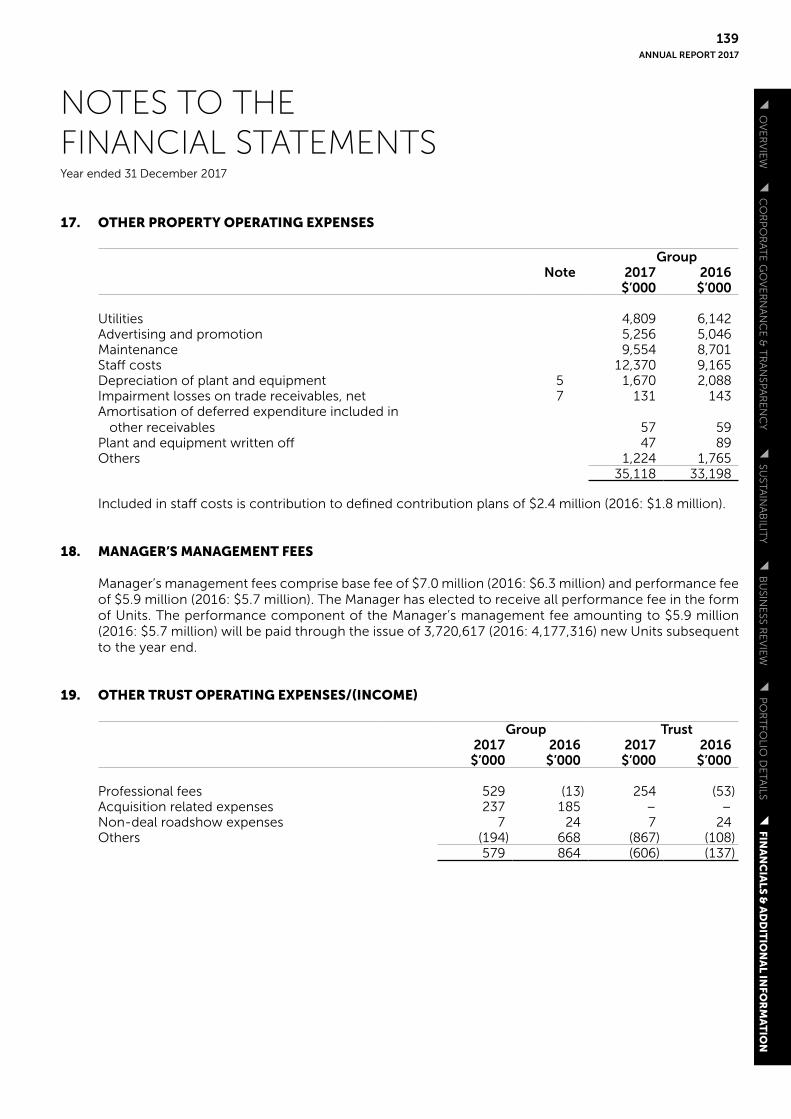
NOTES TO THEFINANCIAL STATEMENTSYear ended 31 December 2017
17. OTHER PROPERTY OPERATING EXPENSES
GroupNote 2017 2016
$’000 $’000
Utilities 4,809 6,142Advertising and promotion 5,256 5,046Maintenance 9,554 8,701Staff costs 12,370 9,165Depreciation of plant and equipment 5 1,670 2,088Impairment losses on trade receivables, net 7 131 143Amortisation of deferred expenditure included in
other receivables 57 59Plant and equipment written off 47 89Others 1,224 1,765
35,118 33,198
Included in staff costs is contribution to defined contribution plans of $2.4 million (2016: $1.8 million).
18. MANAGER’S MANAGEMENT FEES
Manager’s management fees comprise base fee of $7.0 million (2016: $6.3 million) and performance fee of $5.9 million (2016: $5.7 million). The Manager has elected to receive all performance fee in the form of Units. The performance component of the Manager’s management fee amounting to $5.9 million (2016: $5.7 million) will be paid through the issue of 3,720,617 (2016: 4,177,316) new Units subsequent to the year end.
19. OTHER TRUST OPERATING EXPENSES/(INCOME)
Group Trust2017 2016 2017 2016$’000 $’000 $’000 $’000
Professional fees 529 (13) 254 (53)Acquisition related expenses 237 185 – –Non-deal roadshow expenses 7 24 7 24Others (194) 668 (867) (108)
579 864 (606) (137)
ANNUAL REPORT 2017
139
FINA
NC
IALS
& A
DD
ITIO
NA
L INFO
RM
AT
ION
P
OR
TFO
LIO D
ETA
ILS
BU
SINE
SS RE
VIE
W
SUSTA
INA
BILIT
Y
CO
RP
OR
AT
E G
OV
ER
NA
NC
E &
TR
AN
SPA
RE
NC
Y
OV
ER
VIE
W

NOTES TO THEFINANCIAL STATEMENTSYear ended 31 December 2017
20. FINANCE INCOME AND FINANCE COSTS
Group Trust2017 2016 2017 2016$’000 $’000 $’000 $’000
Interest income:– financial institutions 2,418 1,777 82 569– subsidiaries – – 18,868 22,834Finance income 2,418 1,777 18,950 23,403
Interest expenses (23,465) (20,555) (22,359) (17,401)Other finance costs – (657) – (641)Finance costs (23,465) (21,212) (22,359) (18,042)Net finance (costs)/income recognised in
statement of total return (21,047) (19,435) (3,409) 5,361
21. TAXATION
Group TrustNote 2017 2016 2017 2016
$’000 $’000 $’000 $’000
Current taxationCurrent year 41,567 22,953 – –Under/(over) provision in prior years 2,114 (417) 7 –
43,681 22,536 7 –Deferred taxationOrigination of temporary differences 12 20,533 19,105 – –
Income tax expense 64,214 41,641 7 –
Reconciliation of effective tax rate
Group Trust 2017 2016 2017 2016$’000 $’000 $’000 $’000
Total return for the year before taxation 207,264 145,648 90,054 19,877
Tax calculated using Singapore tax rate of 17% 35,235 24,760 15,309 3,379Adjustments:Effect of different tax rates in foreign
jurisdictions 1,147 6,541 – –Income not subject to tax (270) (195) (30,992) (9,158)Expenses not deductible for tax purposes 27 – 9,430 521Deferred tax assets not recognised 996 1,618 – –Utilisation of previously unrecognised tax losses (3,221) (1,547) – –Tax losses not allowed to be carried forward 6,256 5,261 6,253 5,258Foreign tax suffered 21,930 5,620 – –Under/(over) provision in prior years 2,114 (417) 7 –
64,214 41,641 7 –
CAPITALAND RETAIL CHINA TRUST
140

NOTES TO THEFINANCIAL STATEMENTSYear ended 31 December 2017
22. EARNINGS PER UNIT
Basic earnings per Unit
The calculation of basic earnings per Unit is based on weighted average number of Units during the year and total return for the year after taxation and non-controlling interest before distribution.
Group 2017 2016$’000 $’000
Total return for the year after taxation and non-controlling interest before distribution 144,696 106,614
TrustNumber of
UnitsNumber of
Units2017 2016’000 ’000
Issued Units at beginning of year 869,680 843,256Effect of creation of new Units:– Manager’s management fees paid/payable in Units 3,501 766– In connection with private placement exercise 4,410 –– As payment of distribution under distribution reinvestment plan 15,278 12,375Weighted average number of issued and
issuable Units at end of the year 892,869 856,397
Diluted earnings per Unit
Diluted earnings per Unit is calculated based on total return for the year after taxation and non-controlling interest and weighted average number of Units outstanding during the period, adjusted for the effects of all dilutive potential Units.
TrustNumber of
UnitsNumber of
Units2017 2016’000 ’000
Issued Units at beginning of year 869,680 843,256Effect of creation of new Units:– Manager’s management fees paid/payable in Units 7,211 4,932– In connection with private placement exercise 4,410 –– As payment of distribution under distribution reinvestment plan 15,278 12,375Weighted average number of issued and
issuable Units at end of the year 896,579 860,563
ANNUAL REPORT 2017
141
FINA
NC
IALS
& A
DD
ITIO
NA
L INFO
RM
AT
ION
P
OR
TFO
LIO D
ETA
ILS
BU
SINE
SS RE
VIE
W
SUSTA
INA
BILIT
Y
CO
RP
OR
AT
E G
OV
ER
NA
NC
E &
TR
AN
SPA
RE
NC
Y
OV
ER
VIE
W
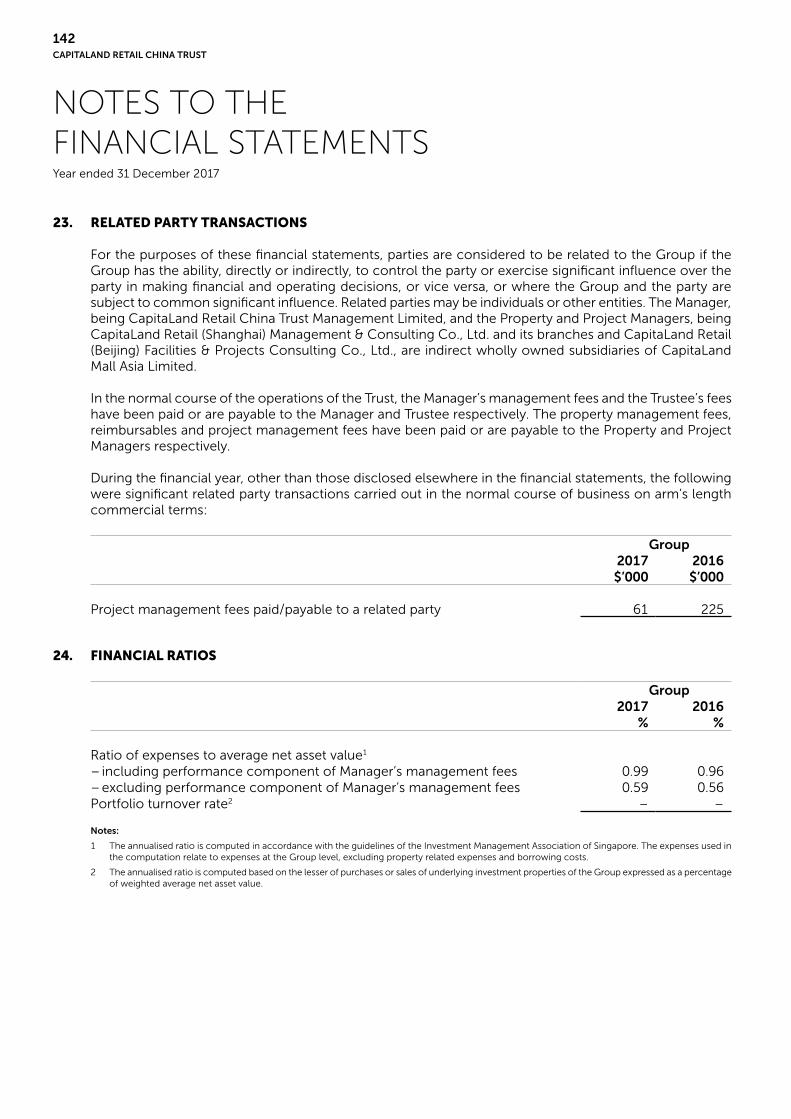
NOTES TO THEFINANCIAL STATEMENTSYear ended 31 December 2017
23. RELATED PARTY TRANSACTIONS
For the purposes of these financial statements, parties are considered to be related to the Group if the Group has the ability, directly or indirectly, to control the party or exercise significant influence over the party in making financial and operating decisions, or vice versa, or where the Group and the party are subject to common significant influence. Related parties may be individuals or other entities. The Manager, being CapitaLand Retail China Trust Management Limited, and the Property and Project Managers, being CapitaLand Retail (Shanghai) Management & Consulting Co., Ltd. and its branches and CapitaLand Retail (Beijing) Facilities & Projects Consulting Co., Ltd., are indirect wholly owned subsidiaries of CapitaLand Mall Asia Limited.
In the normal course of the operations of the Trust, the Manager’s management fees and the Trustee’s fees have been paid or are payable to the Manager and Trustee respectively. The property management fees, reimbursables and project management fees have been paid or are payable to the Property and Project Managers respectively.
During the financial year, other than those disclosed elsewhere in the financial statements, the following were significant related party transactions carried out in the normal course of business on arm’s length commercial terms:
Group2017 2016$’000 $’000
Project management fees paid/payable to a related party 61 225
24. FINANCIAL RATIOS
Group2017 2016
% %
Ratio of expenses to average net asset value1
– including performance component of Manager’s management fees 0.99 0.96– excluding performance component of Manager’s management fees 0.59 0.56Portfolio turnover rate2 – –
Notes:
1 The annualised ratio is computed in accordance with the guidelines of the Investment Management Association of Singapore. The expenses used in the computation relate to expenses at the Group level, excluding property related expenses and borrowing costs.
2 The annualised ratio is computed based on the lesser of purchases or sales of underlying investment properties of the Group expressed as a percentage of weighted average net asset value.
CAPITALAND RETAIL CHINA TRUST
142

NOTES TO THEFINANCIAL STATEMENTSYear ended 31 December 2017
25. OPERATING SEGMENTS
The Group has 11 reportable segments, as described below, which are the Group’s investment properties. The investment properties are managed separately because they require different operating and marketing strategies. For each of the investment properties, the CODMs review internal management reports on a monthly basis.
All of the Group’s reportable segments are investment properties located in China used primarily for retail purposes. The reporting segments are as follows:
• CapitaMall Xizhimen
• CapitaMall Wangjing
• CapitaMall Grand Canyon
• CapitaMall Xinnan
• CapitaMall Anzhen#
• CapitaMall Erqi
• CapitaMall Shuangjing
• CapitaMall Minzhongleyuan
• CapitaMall Qibao
• CapitaMall Saihan
• CapitaMall Wuhu
# The subsidiary was disposed in 2017 (see Note C in Consolidated Statement of Cash Flows).
Segment revenue comprises mainly income generated from its tenants. Segment net property income represents the income earned by each segment after allocating property operating expenses. This is the measure reported to the CODMs for the purpose of assessment of segment performance. In addition, the CODMs monitor the non–financial assets as well as financial assets attributable to each segment when assessing segment performance.
Segment results, assets and liabilities include items directly attributable to a segment as well as those that can be allocated on a reasonable basis. Unallocated items comprise mainly the Trust’s financial assets and liabilities and its expenses. Segment capital expenditure is the total cost incurred during the year to acquire segment assets that are expected to be used for more than one year.
Information regarding the Group’s reportable segments is presented in the tables in the following pages.
For the purpose of monitoring segment performance, the Group’s CODMs monitor the non-financial assets as well as financial assets attributable to each segment.
ANNUAL REPORT 2017
143
FINA
NC
IALS
& A
DD
ITIO
NA
L INFO
RM
AT
ION
P
OR
TFO
LIO D
ETA
ILS
BU
SINE
SS RE
VIE
W
SUSTA
INA
BILIT
Y
CO
RP
OR
AT
E G
OV
ER
NA
NC
E &
TR
AN
SPA
RE
NC
Y
OV
ER
VIE
W

NOTES TO THEFINANCIAL STATEMENTSYear ended 31 December 2017
25. OPERATING SEGMENTS (continued)
Information about reportable segments
CapitaMallXizhimen
CapitaMallWangjing
CapitaMallGrand Canyon
CapitaMall Xinnan
CapitaMall Anzhen
CapitaMall Erqi Sub Total
2017 2016 2017 2016 2017 2016 2017 2016 2017 2016 2017 2016 2017 2016
$’000 $’000 $’000 $’000 $’000 $’000 $’000 $’000 $’000 $’000 $’000 $’000 $’000 $’000
External revenues:
– Gross rental income 55,208 55,368 43,262 41,866 25,704 25,874 24,705 5,099 8,148 16,945 10,078 10,430 167,105 155,582
– Others 3,592 2,975 2,589 2,776 3,830 3,287 2,060 648 1 – 10 7 12,082 9,693
– Gross revenue 58,800 58,343 45,851 44,642 29,534 29,161 26,765 5,747 8,149 16,945 10,088 10,437 179,187 165,275
Segment net property income 41,005 40,859 32,363 31,991 18,591 18,657 18,327 3,168 6,710 13,919 8,614 8,663 125,610 117,257
Finance income 853 226 286 220 183 142 131 35 35 177 121 128 1,609 928
Finance costs – – – – (1,106) (3,170) – – – – – – (1,106) (3,170)
Reportable segment total return before taxation 65,701 53,739 49,342 53,186 19,244 19,062 18,810 7,170 6,704 14,812 9,910 11,468 169,711 159,437
Segment assets 700,849 631,522 517,573 485,529 440,698 456,924 326,039 347,039 – 222,186 131,575 137,479 2,116,734 2,280,679
Segment liabilities 106,506 95,006 100,327 94,332 36,022 95,548 20,798 17,969 – 26,396 20,054 17,951 283,707 347,202
Other segment items:
Depreciation and amortisation (444) (616) (456) (574) (312) (319) (43) (3) (5) (32) (32) (49) (1,292) (1,593)
(Impairment losses)/write-back on trade receivables, net – (91) – (54) 3 2 (67) – – – – – (64) (143)
Net change in fair value of investment properties 23,909 12,888 16,727 21,282 2,217 3,844 442 4,029 – 853 1,189 2,795 44,484 45,691
Capital expenditure (1,422) (1,549) (1,757) (6,019) (2,457) (6,134) (1,588) (12) – (292) (240) (538) (7,464) (14,544)
CAPITALAND RETAIL CHINA TRUST
144

NOTES TO THEFINANCIAL STATEMENTSYear ended 31 December 2017
25. OPERATING SEGMENTS (continued)
Information about reportable segments (continued)
CapitaMallShuangjing
CapitaMallMinzhongleyuan
CapitaMall Qibao
CapitaMall Saihan
CapitaMall Wuhu Sub Total Grand Total
2017 2016 2017 2016 2017 2016 2017 2016 2017 2016 2017 2016 2017 2016
$’000 $’000 $’000 $’000 $’000 $’000 $’000 $’000 $’000 $’000 $’000 $’000 $’000 $’000
External revenues:
– Gross rental income 9,312 9,458 5,008 2,350 17,855 19,325 11,912 11,799 1,667 1,650 45,754 44,582 212,859 200,164
– Others 37 48 432 221 2,493 2,665 1,171 1,277 116 304 4,249 4,515 16,331 14,208
– Gross revenue 9,349 9,506 5,440 2,571 20,348 21,990 13,083 13,076 1,783 1,954 50,003 49,097 229,190 214,372
Segment net property income 7,509 7,665 263 (1,881) 9,294 10,587 7,910 7,470 (1,374) (1,360) 23,602 22,481 149,212 139,738
Finance income 287 97 9 15 311 117 70 33 11 12 688 274 2,297 1,202
Finance costs – – – – – – – – – – – – (1,106) (3,170)
Reportable segment total return before taxation 8,369 8,349 (108) (5,726) 8,466 9,744 9,186 9,872 (4,842) (5,213) 21,071 17,026 190,782 176,463
Segment assets 132,759 124,410 109,764 110,281 130,145 120,020 102,128 98,615 40,636 43,954 515,432 497,280 2,632,166 2,777,959
Segment liabilities 18,450 17,693 4,572 4,770 19,170 18,671 14,157 12,280 1,757 708 58,106 54,122 341,813 401,324
Other segment items
Depreciation and amortisation (10) (10) (96) (115) (66) (77) (169) (219) (94) (133) (435) (554) (1,727) (2,147)
Impairment losses on trade receivables, net – – (67) – – – – – – – (67) – (131) (143)
Net change in fair value of investment properties 620 862 (221) (3,779) (1,058) (866) 1,284 2,483 (3,652) (3,240) (3,027) (4,540) 41,457 41,151
Capital expenditure (1,420) (182) (911) (1,717) (1,150) (870) (982) (1,711) (806) (317) (5,269) (4,797) (12,733) (19,341)
ANNUAL REPORT 2017
145
FINA
NC
IALS
& A
DD
ITIO
NA
L INFO
RM
AT
ION
P
OR
TFO
LIO D
ETA
ILS
BU
SINE
SS RE
VIE
W
SUSTA
INA
BILIT
Y
CO
RP
OR
AT
E G
OV
ER
NA
NC
E &
TR
AN
SPA
RE
NC
Y
OV
ER
VIE
W
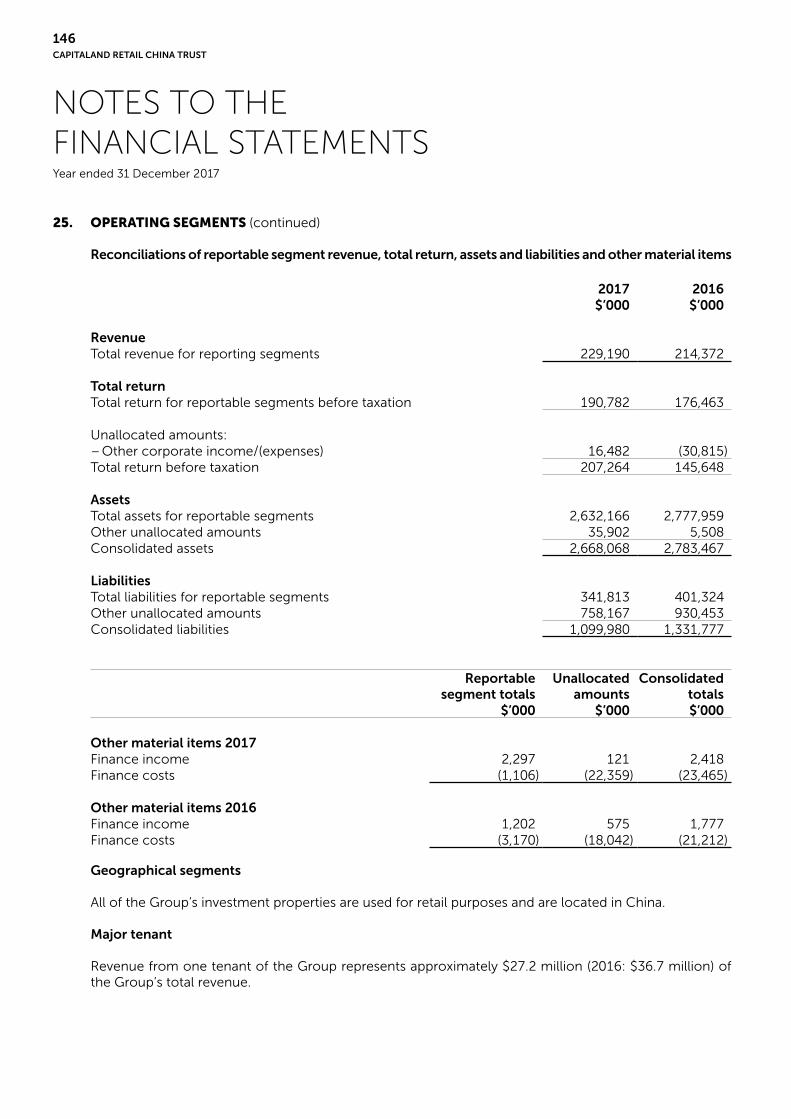
NOTES TO THEFINANCIAL STATEMENTSYear ended 31 December 2017
25. OPERATING SEGMENTS (continued)
Reconciliations of reportable segment revenue, total return, assets and liabilities and other material items
2017 2016$’000 $’000
Revenue Total revenue for reporting segments 229,190 214,372
Total returnTotal return for reportable segments before taxation 190,782 176,463
Unallocated amounts:– Other corporate income/(expenses) 16,482 (30,815)Total return before taxation 207,264 145,648
AssetsTotal assets for reportable segments 2,632,166 2,777,959Other unallocated amounts 35,902 5,508Consolidated assets 2,668,068 2,783,467
LiabilitiesTotal liabilities for reportable segments 341,813 401,324Other unallocated amounts 758,167 930,453Consolidated liabilities 1,099,980 1,331,777
Reportablesegment totals
Unallocatedamounts
Consolidatedtotals
$’000 $’000 $’000
Other material items 2017Finance income 2,297 121 2,418Finance costs (1,106) (22,359) (23,465)
Other material items 2016Finance income 1,202 575 1,777Finance costs (3,170) (18,042) (21,212)
Geographical segments
All of the Group’s investment properties are used for retail purposes and are located in China.
Major tenant
Revenue from one tenant of the Group represents approximately $27.2 million (2016: $36.7 million) of the Group’s total revenue.
CAPITALAND RETAIL CHINA TRUST
146

NOTES TO THEFINANCIAL STATEMENTSYear ended 31 December 2017
26. COMMITMENTS
(a) Capital commitments
Group2017 2016$’000 $’000
Payable:– contracted but not provided for 2,783 2,516
(b) The Group leases out its investment properties. Operating lease rentals are receivable as follows:
Group2017 2016$’000 $’000
Receivable:– within 1 year 186,754 176,627– after 1 year but within 5 years 330,400 361,256– after 5 years 154,678 222,310
671,832 760,193
(c) The Group has non–cancellable leases with rentals payable as follows:
Group2017 2016$’000 $’000
Payable:– within 1 year 4,788 4,851– after 1 year but within 5 years 25,598 25,407– after 5 years 7,527 14,322
37,913 44,580
ANNUAL REPORT 2017
147
FINA
NC
IALS
& A
DD
ITIO
NA
L INFO
RM
AT
ION
P
OR
TFO
LIO D
ETA
ILS
BU
SINE
SS RE
VIE
W
SUSTA
INA
BILIT
Y
CO
RP
OR
AT
E G
OV
ER
NA
NC
E &
TR
AN
SPA
RE
NC
Y
OV
ER
VIE
W

NOTES TO THEFINANCIAL STATEMENTSYear ended 31 December 2017
27. CAPITAL AND FINANCIAL RISK MANAGEMENT
Capital management
The Group’s objectives when managing capital are to optimise Unitholders’ value through the combination of available capital sources which include debt and equity instruments whilst complying with statutory and constitutional capital and distribution requirements, maintaining aggregate leverage and interest service coverage ratio within approved limits. As a key part of the Group’s overall strategy, the Board of the Manager reviews the Group and the Trust’s debt and capital management cum financing policy regularly so as to optimise the Group and the Trust’s funding structure. The Board also monitors the Group and the Trust’s exposure to various risk elements by closely adhering to clearly established management policies and procedures.
The Group is subject to the aggregate leverage limit as defined in Appendix 6 of the CIS Code (“Property Fund Appendix”). The Property Fund Appendix stipulates that the total borrowings and deferred payments (together, the “Aggregate Leverage”) of a property fund should not exceed 45% (2016: 45.0%) of its Deposited Property. The Group’s aggregate leverage limit did not exceed 45% (2016: 45.0%) during the year, and was 28.4% (2016: 35.3%) as at 31 December 2017. In computing the aggregate leverage, the Trust has considered the effect of hedging the net assets denominated in RMB.
There were no changes in the Group’s approach to capital management during the financial year.
Financial risk management
Overview
The Group’s returns are primarily from net operating income and capital appreciation of its assets. However, these returns are exposed to financial risks including credit, liquidity, interest rate and foreign currency risks.
Financial risk management is integral to the whole business of the Group. The Group adopts an integrated approach to manage the financial risks arising in the normal course of the Group’s business. The Group has written risk management policies and guidelines, and established processes to monitor and manage significant exposures. Risk management policies and processes are reviewed regularly to reflect changes in market conditions and the Group’s activities.
The Group adheres to standardised accounting and financial policies and exercises effective controls over the financial affairs of its subsidiaries. This is achieved by ensuring group–wide adherence to a comprehensive set of guidelines covering contracts, policies and procedures and other requirements. Adequate measures are in place to ensure that the reliability and integrity of financial information compiled from subsidiaries are kept intact.
CAPITALAND RETAIL CHINA TRUST
148

NOTES TO THEFINANCIAL STATEMENTSYear ended 31 December 2017
27. CAPITAL AND FINANCIAL RISK MANAGEMENT (continued)
Financial risk management (continued)
Credit risk
While it is necessary to assume a certain level of tenant credit risks to remain competitive in China, the Group has established credit limits for tenants and monitors their balances on an ongoing basis. Risks associated with credit limits are reflected in the level of security deposits and bank guarantees placed as collateral in respect of the leases. Appropriate risk mitigating actions are in place to manage trade receivables.
The Group establishes an allowance for impairment that represents its estimate of incurred losses in respect of trade and other receivables. The main components of this allowance are a specific loss component that relates to individually significant exposures, and a collective loss component established for groups of similar assets in respect of losses that have been incurred but not yet identified. The collective loss allowance is determined based on historical data of payment statistics for similar financial assets.
The allowance account in respect of trade and other receivables is used to record impairment losses unless the Group is satisfied that no recovery of the amount owing is possible. At that point, the financial asset is considered irrecoverable and the amount charged to the allowance account is written off against the carrying amount of the impaired financial asset.
Cash and fixed deposits are placed with banks and financial institutions which are regulated.
Liquidity risk
The Group monitors its liquidity risk and maintains a level of cash and cash equivalents deemed adequate by management to finance the Group’s operations and to mitigate the effects of fluctuations in cash flows. Typically the Group ensures that it has sufficient cash on demand to meet expected operational expenses for a reasonable period, including the servicing of financial obligations.
In addition, the Group maintains the following debt facilities and programme as at 31 December 2017.
S$ denominated facilities:• S$151.0 million money market line facilities
• S$100.0 million three–year trust term loan facilities
• S$250.0 million four–year trust term loan facilities
• S$400.0 million five–year trust term loan facilities
United States dollar (“US$”) denominated facilities:• US$70.0 million money market line facilities
Multicurrency Medium Term Notes:• $1.0 billion multicurrency Medium Term Note (“MTN”) Programme
As at 31 December 2017, the Group has outstanding debt of $750.0 million (2016: $900.5 million) trust term loan facilities, $nil (2016: $19.8 million) money market line facilities and RMB nil (2016: RMB285.0 million) secured term loan facility.
The Group also monitors and observes the Property Fund Appendix issued by MAS concerning limits on total borrowings.
ANNUAL REPORT 2017
149
FINA
NC
IALS
& A
DD
ITIO
NA
L INFO
RM
AT
ION
P
OR
TFO
LIO D
ETA
ILS
BU
SINE
SS RE
VIE
W
SUSTA
INA
BILIT
Y
CO
RP
OR
AT
E G
OV
ER
NA
NC
E &
TR
AN
SPA
RE
NC
Y
OV
ER
VIE
W

NOTES TO THEFINANCIAL STATEMENTSYear ended 31 December 2017
27. CAPITAL AND FINANCIAL RISK MANAGEMENT (continued)
Financial risk management (continued)
Interest rate risk
The Manager adopts a proactive interest rate management policy to manage the risk associated with changes in interest rates on the Group’s loan facilities while also seeking to ensure that the ongoing cost of debt remains competitive.
As at 31 December 2017, the Group has interest rate swaps (“IRS”) with notional contract amount of $600.0 million (2016: $475.5 million). The Group pays a fixed rate interest and receives a variable rate equal to the Swap Offer Rate (“SOR”) on the notional contract amount. The Group classifies the IRS as cash flow hedges to hedge the exposure in interest rate fluctuations on certain of its term loans.
The term loans and the underlying IRS have the same terms and conditions.
The Manager proactively seeks to minimise the level of interest rate risk by locking the majority of the Group’s borrowings at fixed rates. As at 31 December 2017, the Group has locked in approximately 80% (2016: 53.7%) of its borrowings at fixed rates. As at 31 December 2016, excluding the RMB denominated loan, money market line and bridge term loan which are not hedged, the Group has locked in approximately 87.5% of its borrowings at fixed rates.
Fair value sensitivity analysis for fixed rate instruments
The Group does not account for any fixed rate financial liabilities at fair value through profit or loss and the Group does not designate interest rate derivatives as hedging instruments under a fair value hedge accounting model. Therefore a change in interest rates at the reporting date would not affect the statement of total return.
Cash flow sensitivity analysis for variable rate instruments
The net change in fair value of the interest component of IRS as at 31 December 2017 of $2.8 million (2016: $5.9 million), representing the effective portion of the cash flow hedge, has been recognised directly in the hedging reserve.
Effects of a 100 basis point (“bp”)* movement in interest rate at the reporting date would increase/(decrease) statement of total return and Unitholders’ funds by the amounts shown below. This analysis assumes that all other variables, in particular foreign currency rates, remain constant. The analysis is performed on the same basis for 2016.
* 100 basis point is equivalent to 1 percentage point
CAPITALAND RETAIL CHINA TRUST
150

NOTES TO THEFINANCIAL STATEMENTSYear ended 31 December 2017
27. CAPITAL AND FINANCIAL RISK MANAGEMENT (continued)
Financial risk management (continued)
Interest rate risk (continued)
Statement of total return Unitholders’ funds100 bp 100 bp 100 bp 100 bp
increase decrease increase decrease$’million $’million $’million $’million
Group and Trust
2017Interest rate swaps – – 4.2 (4.2)Variable rate instruments (1.5) 1.5 – –Cash flow sensitivity (net) (1.5) 1.5 4.2 (4.2)
2016Interest rate swaps – – 3.7 (3.7)Variable rate instruments (2.2) 2.2 – –Cash flow sensitivity (net) (2.2) 2.2 3.7 (3.7)
Foreign currency risk
The Group is exposed to foreign currency risk on cash holdings and operating expenses that are denominated in a currency other than the respective functional currencies of the Group entities. The currencies giving rise to this risk are primarily the US$ and RMB.
The Manager’s strategy is to achieve a natural hedge through local RMB financing and any non-RMB denominated loan will be hedged into RMB where possible, to protect the going concern of the Trust in the event of large currency fluctuation. However, the Manager will hedge the RMB cash flow from operations if it is determined with certainty that they are to be remitted back to Singapore for distribution purposes.
During the year, the Group entered into foreign exchange forward contracts with notional amount of $114.0 million to hedge the foreign currency exposure of a highly probable forecast transaction. No ineffectiveness was recognised from the cash flow hedge. The fair value of the forwards as at 31 December 2017 of $0.9 million (2016: $nil), representing the effective portion of the cash flow hedge, has been recognised directly in the hedging reserve.
ANNUAL REPORT 2017
151
FINA
NC
IALS
& A
DD
ITIO
NA
L INFO
RM
AT
ION
P
OR
TFO
LIO D
ETA
ILS
BU
SINE
SS RE
VIE
W
SUSTA
INA
BILIT
Y
CO
RP
OR
AT
E G
OV
ER
NA
NC
E &
TR
AN
SPA
RE
NC
Y
OV
ER
VIE
W
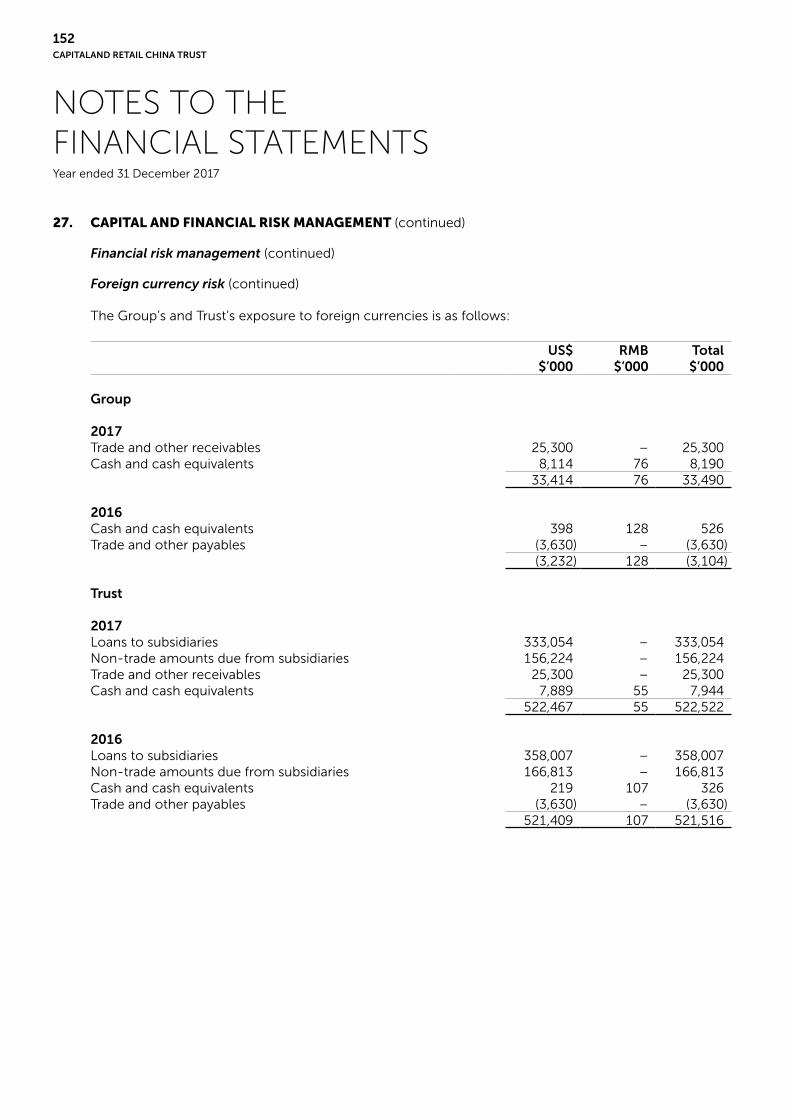
NOTES TO THEFINANCIAL STATEMENTSYear ended 31 December 2017
27. CAPITAL AND FINANCIAL RISK MANAGEMENT (continued)
Financial risk management (continued)
Foreign currency risk (continued)
The Group’s and Trust’s exposure to foreign currencies is as follows:
US$ RMB Total$’000 $’000 $’000
Group
2017Trade and other receivables 25,300 – 25,300Cash and cash equivalents 8,114 76 8,190
33,414 76 33,490
2016Cash and cash equivalents 398 128 526Trade and other payables (3,630) – (3,630)
(3,232) 128 (3,104)
Trust
2017Loans to subsidiaries 333,054 – 333,054Non-trade amounts due from subsidiaries 156,224 – 156,224Trade and other receivables 25,300 – 25,300Cash and cash equivalents 7,889 55 7,944
522,467 55 522,522
2016Loans to subsidiaries 358,007 – 358,007Non-trade amounts due from subsidiaries 166,813 – 166,813Cash and cash equivalents 219 107 326Trade and other payables (3,630) – (3,630)
521,409 107 521,516
CAPITALAND RETAIL CHINA TRUST
152

NOTES TO THEFINANCIAL STATEMENTSYear ended 31 December 2017
27. CAPITAL AND FINANCIAL RISK MANAGEMENT (continued)
Sensitivity analysis
A 10% strengthening of Singapore dollar against the US$ and RMB at the reporting date would increase/(decrease) total return after tax by the amounts shown below. This analysis assumes that all other variables, in particular interest rates, remain constant. The analysis is performed on the same basis for 2016.
Statements of total returnGroup Trust$’000 $’000
2017US$ (3,341) (52,247)RMB (8) (6)
2016US$ 323 (52,141)RMB (13) (11)
A 10% weakening of Singapore dollar against the US$ and RMB would have had equal but opposite effect on the US$ and RMB to the amounts shown above, on the basis that all other variables remain constant.
Hedge of net investment in foreign operation
The non–deliverable forwards (“NDF”) of $375.0 million (2016: $300.0 million) are designated as hedges of the Group’s net investment in certain subsidiaries in China. No ineffectiveness was recognised from the net investment hedge.
Sensitivity analysis
For NDF (accounted for as net investment hedges), a 10% strengthening/weakening of Singapore dollar against the RMB at the reporting date would increase/(decrease) Unitholders’ funds as at 31 December 2017 by the amounts shown below. This analysis assumes that all other variables, in particular interest rates, remain constant. The analysis is performed on the same basis for 2016.
Unitholders’ funds$’million $’million
Group
2017Non-deliverable forwards 28.6 (35.0)
2016Non-deliverable forwards 22.7 (27.7)
ANNUAL REPORT 2017
153
FINA
NC
IALS
& A
DD
ITIO
NA
L INFO
RM
AT
ION
P
OR
TFO
LIO D
ETA
ILS
BU
SINE
SS RE
VIE
W
SUSTA
INA
BILIT
Y
CO
RP
OR
AT
E G
OV
ER
NA
NC
E &
TR
AN
SPA
RE
NC
Y
OV
ER
VIE
W
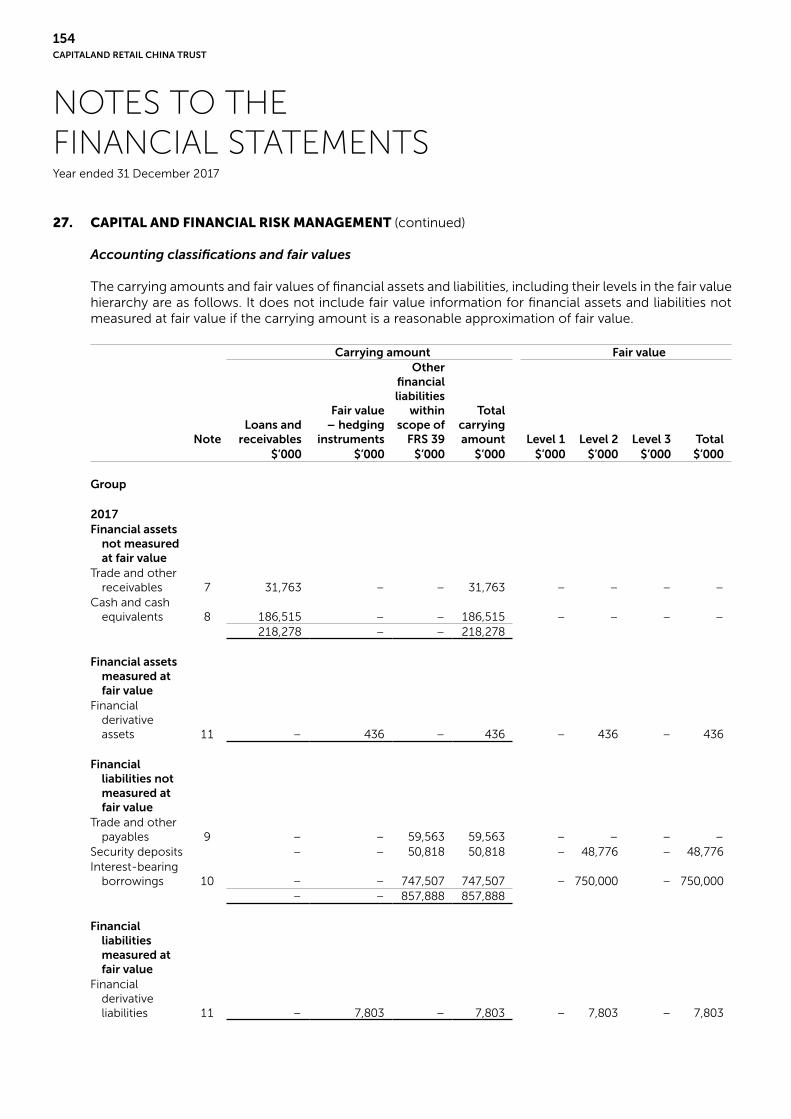
NOTES TO THEFINANCIAL STATEMENTSYear ended 31 December 2017
27. CAPITAL AND FINANCIAL RISK MANAGEMENT (continued)
Accounting classifications and fair values
The carrying amounts and fair values of financial assets and liabilities, including their levels in the fair value hierarchy are as follows. It does not include fair value information for financial assets and liabilities not measured at fair value if the carrying amount is a reasonable approximation of fair value.
Carrying amount Fair value
NoteLoans and
receivables
Fair value– hedging
instruments
Otherfinancialliabilities
withinscope of
FRS 39
Total carrying amount Level 1 Level 2 Level 3 Total
$’000 $’000 $’000 $’000 $’000 $’000 $’000 $’000
Group
2017Financial assets
not measured at fair value
Trade and other receivables 7 31,763 – – 31,763 – – – –
Cash and cash equivalents 8 186,515 – – 186,515 – – – –
218,278 – – 218,278
Financial assets measured at fair value
Financial derivative assets 11 – 436 – 436 – 436 – 436
Financial liabilities not measured at fair value
Trade and other payables 9 – – 59,563 59,563 – – – –
Security deposits – – 50,818 50,818 – 48,776 – 48,776Interest-bearing
borrowings 10 – – 747,507 747,507 – 750,000 – 750,000– – 857,888 857,888
Financial liabilities measured at fair value
Financial derivative liabilities 11 – 7,803 – 7,803 – 7,803 – 7,803
CAPITALAND RETAIL CHINA TRUST
154

NOTES TO THEFINANCIAL STATEMENTSYear ended 31 December 2017
27. CAPITAL AND FINANCIAL RISK MANAGEMENT (continued)
Accounting classifications and fair values (continued)
Carrying amount Fair value
NoteLoans and
receivables
Fair value– hedging
instruments
Otherfinancialliabilities
withinscope of
FRS 39
Totalcarryingamount Level 1 Level 2 Level 3 Total
$’000 $’000 $’000 $’000 $’000 $’000 $’000 $’000
Group
2016Financial assets
not measured at fair value
Trade and other receivables 7 7,423 – – 7,423 – – – –
Cash and cash equivalents 8 136,137 – – 136,137 – – – –
143,560 – – 143,560Financial assets
measured at fair value
Financial derivative assets 11 – 2,114 – 2,114 – 2,114 – 2,114
Financial liabilities not measured at fair value
Trade and other payables 9 – – 64,527 64,527 – – – –
Security deposits – – 48,769 48,769 – 46,676 – 46,676Interest-bearing
borrowings 10 – – 977,751 977,751 – 979,000 – 979,000– – 1,091,047 1,091,047
Financial liabilities measured at fair value
Financial derivative liabilities 11 – 2,165 – 2,165 – 2,165 – 2,165
ANNUAL REPORT 2017
155
FINA
NC
IALS
& A
DD
ITIO
NA
L INFO
RM
AT
ION
P
OR
TFO
LIO D
ETA
ILS
BU
SINE
SS RE
VIE
W
SUSTA
INA
BILIT
Y
CO
RP
OR
AT
E G
OV
ER
NA
NC
E &
TR
AN
SPA
RE
NC
Y
OV
ER
VIE
W

NOTES TO THEFINANCIAL STATEMENTSYear ended 31 December 2017
27. CAPITAL AND FINANCIAL RISK MANAGEMENT (continued)
Accounting classifications and fair values (continued)
Carrying amount Fair value
NoteLoans and
receivables
Fair value– hedging
instruments
Otherfinancialliabilities
withinscope of
FRS 39
Totalcarryingamount Level 1 Level 2 Level 3 Total
$’000 $’000 $’000 $’000 $’000 $’000 $’000 $’000
Trust
2017Financial assets
not measured at fair value
Non-trade amounts due from subsidiaries 6 5,108 – – 5,108 – – – –
Trade and other receivables 7 25,562 – – 25,562 – – – –
Cash and cash equivalents 8 9,630 – – 9,630 – – – –
40,300 – – 40,300
Financial assets measured at fair value
Financial derivative assets 11 – 436 – 436 – 436 – 436
Financial liabilities not measured at fair value
Trade and other payables 9 – – 4,964 4,964 – – – –
Interest-bearing borrowings 10 – – 747,507 747,507 – 750,000 – 750,000
– – 752,471 752,471Financial
liabilities measured at fair value
Financial derivative liabilities 11 – 7,803 – 7,803 – 7,803 – 7,803
CAPITALAND RETAIL CHINA TRUST
156

NOTES TO THEFINANCIAL STATEMENTSYear ended 31 December 2017
27. CAPITAL AND FINANCIAL RISK MANAGEMENT (continued)
Accounting classifications and fair values (continued)
Carrying amount Fair value
NoteLoans and
receivables
Fair value– hedging
instruments
Otherfinancialliabilities
withinscope of
FRS 39
Totalcarryingamount Level 1 Level 2 Level 3 Total
$’000 $’000 $’000 $’000 $’000 $’000 $’000 $’000
Trust
2016Financial assets
not measured at fair value
Non-trade amounts due from subsidiaries 6 6,303 – – 6,303 – – – –
Trade and other receivables 7 353 – – 353 – – – –
Cash and cash equivalents 8 1,661 – – 1,661 – – – –
8,317 – – 8,317
Financial assets measured at fair value
Financial derivative assets 11 – 2,114 – 2,114 – 2,114 – 2,114
Financial liabilities not measured at fair value
Trade and other payables 9 – – 9,387 9,387 – – – –
Interest-bearing borrowings 10 – – 918,808 918,808 – 920,057 – 920,057
– – 928,195 928,195Financial
liabilities measured at fair value
Financial derivative liabilities 11 – 2,165 – 2,165 – 2,165 – 2,165
ANNUAL REPORT 2017
157
FINA
NC
IALS
& A
DD
ITIO
NA
L INFO
RM
AT
ION
P
OR
TFO
LIO D
ETA
ILS
BU
SINE
SS RE
VIE
W
SUSTA
INA
BILIT
Y
CO
RP
OR
AT
E G
OV
ER
NA
NC
E &
TR
AN
SPA
RE
NC
Y
OV
ER
VIE
W

NOTES TO THEFINANCIAL STATEMENTSYear ended 31 December 2017
27. CAPITAL AND FINANCIAL RISK MANAGEMENT (continued)
Estimation of fair value
The following summarises the significant methods and assumptions used in estimating the fair values of financial instruments of the Group and Trust.
Financial derivatives
The fair values of non-deliverable forwards and interest rates are based on banks’ quotes. These quotes are tested for reasonableness by discounting estimated future cash flows based on the terms and maturity of each contract and using market interest rates for a similar instrument at the measurement date. Fair values reflect the credit risk of the Group entity and counterparties when appropriate.
Interest–bearing borrowings
Fair value, which is determined for disclosure purposes, is calculated based on the present value of future principal and interest cash flows, discounted at the market rate of interest at the reporting date.
Other financial assets and liabilities
The carrying amounts of financial assets and liabilities (including non-trade amounts due from subsidiaries, trade and other receivables, cash and cash equivalents, trade and other payables and current security deposits) are assumed to approximate their fair values because they are either short term in nature, or effect of discounting is immaterial. All other financial assets and liabilities (non-current security deposits) are discounted to determine their fair values.
Interest rates used in determining fair values
The interest rates used to discount estimated cash flows, where applicable, are based on the forward yield curve as at 31 December 2017 plus an adequate constant credit spread, and are as follows:
2017 2016% p.a. % p.a.
Interest–bearing borrowings 2.02 - 2.35 1.42 – 4.75Security deposits 2.07 - 2.34 1.84 – 2.10
Offsetting financial assets and financial liabilities
The disclosures set out in the tables below include financial assets and financial liabilities that:
• are offset in the Trust’s statements of financial position; or
• are subject to an enforceable master netting arrangement, irrespective of whether they are offset in the statement of financial position.
Financial instruments such as loans and receivables and financial liabilities are not disclosed in the tables below unless they are offset in the statements of financial position.
CAPITALAND RETAIL CHINA TRUST
158
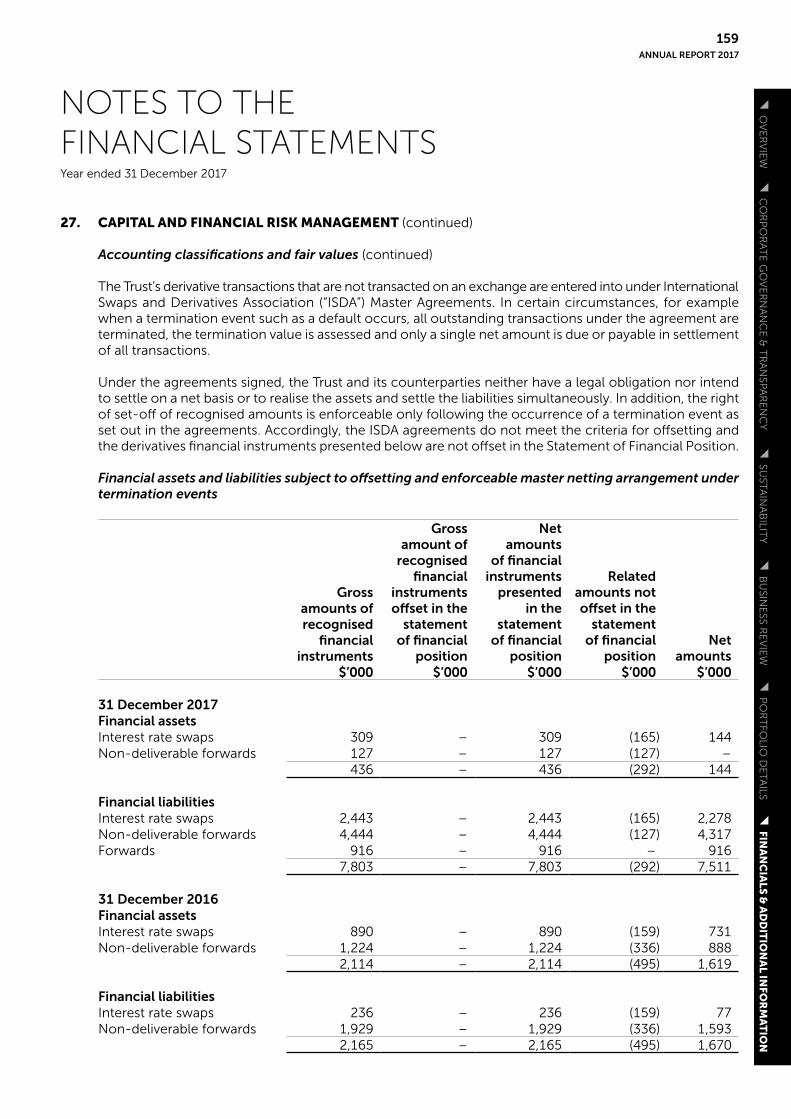
NOTES TO THEFINANCIAL STATEMENTSYear ended 31 December 2017
27. CAPITAL AND FINANCIAL RISK MANAGEMENT (continued)
Accounting classifications and fair values (continued)
The Trust’s derivative transactions that are not transacted on an exchange are entered into under International Swaps and Derivatives Association (“ISDA”) Master Agreements. In certain circumstances, for example when a termination event such as a default occurs, all outstanding transactions under the agreement are terminated, the termination value is assessed and only a single net amount is due or payable in settlement of all transactions.
Under the agreements signed, the Trust and its counterparties neither have a legal obligation nor intend to settle on a net basis or to realise the assets and settle the liabilities simultaneously. In addition, the right of set-off of recognised amounts is enforceable only following the occurrence of a termination event as set out in the agreements. Accordingly, the ISDA agreements do not meet the criteria for offsetting and the derivatives financial instruments presented below are not offset in the Statement of Financial Position.
Financial assets and liabilities subject to offsetting and enforceable master netting arrangement under termination events
Grossamounts ofrecognised
financialinstruments
Grossamount of
recognisedfinancial
instrumentsoffset in the
statementof financial
position
Net amounts
of financialinstruments
presentedin the
statement of financial
position
Relatedamounts notoffset in the
statementof financial
positionNet
amounts$’000 $’000 $’000 $’000 $’000
31 December 2017Financial assetsInterest rate swaps 309 – 309 (165) 144Non-deliverable forwards 127 – 127 (127) –
436 – 436 (292) 144
Financial liabilitiesInterest rate swaps 2,443 – 2,443 (165) 2,278Non-deliverable forwards 4,444 – 4,444 (127) 4,317Forwards 916 – 916 – 916
7,803 – 7,803 (292) 7,511
31 December 2016Financial assetsInterest rate swaps 890 – 890 (159) 731Non-deliverable forwards 1,224 – 1,224 (336) 888
2,114 – 2,114 (495) 1,619
Financial liabilitiesInterest rate swaps 236 – 236 (159) 77Non-deliverable forwards 1,929 – 1,929 (336) 1,593
2,165 – 2,165 (495) 1,670
ANNUAL REPORT 2017
159
FINA
NC
IALS
& A
DD
ITIO
NA
L INFO
RM
AT
ION
P
OR
TFO
LIO D
ETA
ILS
BU
SINE
SS RE
VIE
W
SUSTA
INA
BILIT
Y
CO
RP
OR
AT
E G
OV
ER
NA
NC
E &
TR
AN
SPA
RE
NC
Y
OV
ER
VIE
W

NOTES TO THEFINANCIAL STATEMENTSYear ended 31 December 2017
28. SUBSEQUENT EVENTS
On 31 January 2018, the Group completed the acquisition of 51% of all the issued shares of Gold Yield Pte. Ltd. and its subsidiary which holds Rock Square, Guangzhou, China. The total purchase consideration approximates US$259.3 million, subject to post completion adjustments.
On 31 January 2018, the Manager declared a distribution of 0.83 cents per Unit to Unitholders in respect of the period from 7 December 2017 to 31 December 2017, which was paid on 23 February 2018.
CAPITALAND RETAIL CHINA TRUST
160
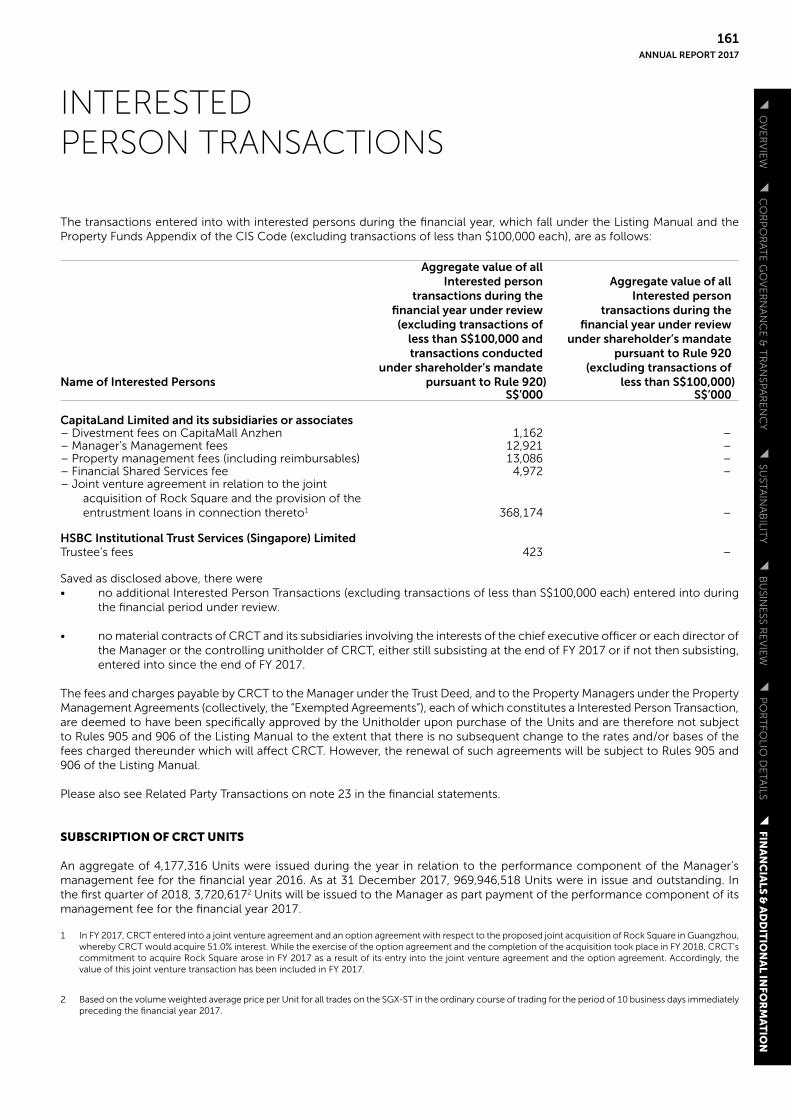
INTERESTEDPERSON TRANSACTIONS
The transactions entered into with interested persons during the financial year, which fall under the Listing Manual and the Property Funds Appendix of the CIS Code (excluding transactions of less than $100,000 each), are as follows:
Name of Interested Persons
Aggregate value of allInterested person
transactions during thefinancial year under review(excluding transactions of
less than S$100,000 andtransactions conducted
under shareholder’s mandatepursuant to Rule 920)
Aggregate value of allInterested person
transactions during thefinancial year under review
under shareholder’s mandatepursuant to Rule 920
(excluding transactions ofless than S$100,000)
S$’000 S$’000
CapitaLand Limited and its subsidiaries or associates– Divestment fees on CapitaMall Anzhen 1,162 –– Manager’s Management fees 12,921 –– Property management fees (including reimbursables) 13,086 –– Financial Shared Services fee 4,972 –– Joint venture agreement in relation to the joint
acquisition of Rock Square and the provision of the entrustment loans in connection thereto1 368,174 –
HSBC Institutional Trust Services (Singapore) LimitedTrustee’s fees 423 –
Saved as disclosed above, there were• no additional Interested Person Transactions (excluding transactions of less than S$100,000 each) entered into during
the financial period under review.
• no material contracts of CRCT and its subsidiaries involving the interests of the chief executive officer or each director of the Manager or the controlling unitholder of CRCT, either still subsisting at the end of FY 2017 or if not then subsisting, entered into since the end of FY 2017.
The fees and charges payable by CRCT to the Manager under the Trust Deed, and to the Property Managers under the Property Management Agreements (collectively, the “Exempted Agreements”), each of which constitutes a Interested Person Transaction, are deemed to have been specifically approved by the Unitholder upon purchase of the Units and are therefore not subject to Rules 905 and 906 of the Listing Manual to the extent that there is no subsequent change to the rates and/or bases of the fees charged thereunder which will affect CRCT. However, the renewal of such agreements will be subject to Rules 905 and 906 of the Listing Manual.
Please also see Related Party Transactions on note 23 in the financial statements.
SUBSCRIPTION OF CRCT UNITS
An aggregate of 4,177,316 Units were issued during the year in relation to the performance component of the Manager’s management fee for the financial year 2016. As at 31 December 2017, 969,946,518 Units were in issue and outstanding. In the first quarter of 2018, 3,720,6172 Units will be issued to the Manager as part payment of the performance component of its management fee for the financial year 2017.
1 In FY 2017, CRCT entered into a joint venture agreement and an option agreement with respect to the proposed joint acquisition of Rock Square in Guangzhou, whereby CRCT would acquire 51.0% interest. While the exercise of the option agreement and the completion of the acquisition took place in FY 2018, CRCT’s commitment to acquire Rock Square arose in FY 2017 as a result of its entry into the joint venture agreement and the option agreement. Accordingly, the value of this joint venture transaction has been included in FY 2017.
2 Based on the volume weighted average price per Unit for all trades on the SGX-ST in the ordinary course of trading for the period of 10 business days immediately preceding the financial year 2017.
ANNUAL REPORT 2017
161
FINA
NC
IALS
& A
DD
ITIO
NA
L INFO
RM
AT
ION
P
OR
TFO
LIO D
ETA
ILS
BU
SINE
SS RE
VIE
W
SUSTA
INA
BILIT
Y
CO
RP
OR
AT
E G
OV
ER
NA
NC
E &
TR
AN
SPA
RE
NC
Y
OV
ER
VIE
W
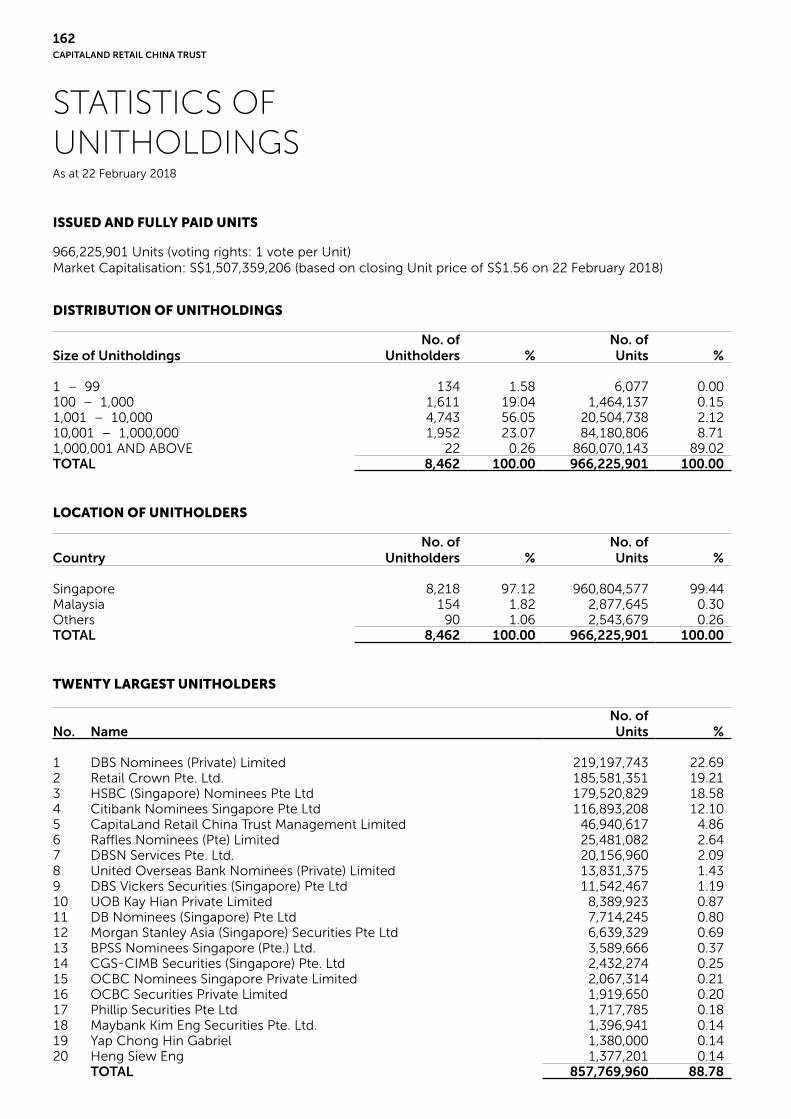
STATISTICS OFUNITHOLDINGSAs at 22 February 2018
ISSUED AND FULLY PAID UNITS
966,225,901 Units (voting rights: 1 vote per Unit)Market Capitalisation: S$1,507,359,206 (based on closing Unit price of S$1.56 on 22 February 2018)
DISTRIBUTION OF UNITHOLDINGS
Size of UnitholdingsNo. of
Unitholders %No. ofUnits %
1 – 99 134 1.58 6,077 0.00100 – 1,000 1,611 19.04 1,464,137 0.151,001 – 10,000 4,743 56.05 20,504,738 2.1210,001 – 1,000,000 1,952 23.07 84,180,806 8.711,000,001 AND ABOVE 22 0.26 860,070,143 89.02TOTAL 8,462 100.00 966,225,901 100.00
LOCATION OF UNITHOLDERS
CountryNo. of
Unitholders %No. ofUnits %
Singapore 8,218 97.12 960,804,577 99.44Malaysia 154 1.82 2,877,645 0.30Others 90 1.06 2,543,679 0.26TOTAL 8,462 100.00 966,225,901 100.00
TWENTY LARGEST UNITHOLDERS
No. NameNo. ofUnits %
1 DBS Nominees (Private) Limited 219,197,743 22.692 Retail Crown Pte. Ltd. 185,581,351 19.213 HSBC (Singapore) Nominees Pte Ltd 179,520,829 18.584 Citibank Nominees Singapore Pte Ltd 116,893,208 12.105 CapitaLand Retail China Trust Management Limited 46,940,617 4.866 Raffles Nominees (Pte) Limited 25,481,082 2.647 DBSN Services Pte. Ltd. 20,156,960 2.098 United Overseas Bank Nominees (Private) Limited 13,831,375 1.439 DBS Vickers Securities (Singapore) Pte Ltd 11,542,467 1.1910 UOB Kay Hian Private Limited 8,389,923 0.8711 DB Nominees (Singapore) Pte Ltd 7,714,245 0.8012 Morgan Stanley Asia (Singapore) Securities Pte Ltd 6,639,329 0.6913 BPSS Nominees Singapore (Pte.) Ltd. 3,589,666 0.3714 CGS-CIMB Securities (Singapore) Pte. Ltd 2,432,274 0.2515 OCBC Nominees Singapore Private Limited 2,067,314 0.2116 OCBC Securities Private Limited 1,919,650 0.2017 Phillip Securities Pte Ltd 1,717,785 0.1818 Maybank Kim Eng Securities Pte. Ltd. 1,396,941 0.1419 Yap Chong Hin Gabriel 1,380,000 0.1420 Heng Siew Eng 1,377,201 0.14
TOTAL 857,769,960 88.78
CAPITALAND RETAIL CHINA TRUST
162

STATISTICS OFUNITHOLDINGSAs at 22 February 2018
DIRECTORS’ INTERESTS IN UNITS AND CONVERTIBLE SECURITIES AS AT 21 JANUARY 2018
Based on the Register of Directors’ Unitholdings, save for those disclosed below, none of the Directors holds any interest in Units and convertible securities issued by CRCT.
No. of UnitsContingent Awards of Units1
under the Manager’s
Name of DirectorDirect
InterestDeemedInterest
PerformanceUnit Plan
RestrictedUnit Plan
Soh Kim Soon – – – –Lim Ming Yan 209,949 – – –Tan Tze Wooi 39,280 3,000 0 to 173,2362 0 to 121,1172,3
Fong Heng Boo 47,828 – – –Christopher Gee Kok Aun 30,987 – – –Tan Kong Yam 20,708 – – –Neo Poh Kiat 50,000 – – –Kuan Li Li – – – –Lim Cho Pin Andrew Geoffrey – – – –Lee Chee Koon – 21,200 – –
1 This refers to the number of Units which are the subject of contingent awards granted but not released under the Manager’s Performance Unit Plan (PUP) and Restricted Unit Plan (RUP). The final number of Units that will be released could range from 0% to a maximum of 200% of the baseline award under the PUP and from 0% to a maximum of 150% of the baseline award under the RUP.
2 The final number of Units to be released will depend on the achievement of pre-determined targets at the end of the respective performance periods for the PUP and RUP.
3 On the final vesting, an additional number of Units of a total value equal to the value of the accumulated distributions which are declared during each of the vesting periods and deemed foregone due to the vesting mechanism of the RUP, will also be released.
ANNUAL REPORT 2017
163
FINA
NC
IALS
& A
DD
ITIO
NA
L INFO
RM
AT
ION
P
OR
TFO
LIO D
ETA
ILS
BU
SINE
SS RE
VIE
W
SUSTA
INA
BILIT
Y
CO
RP
OR
AT
E G
OV
ER
NA
NC
E &
TR
AN
SPA
RE
NC
Y
OV
ER
VIE
W

STATISTICS OFUNITHOLDINGSAs at 22 February 2018
SUBSTANTIAL UNITHOLDERS’ UNITHOLDINGS AS AT 22 FEBRUARY 2018
Based on the information available to the Manager as at 22 February 2018, the unitholdings of Substantial Unitholders of CRCT are as follows:
Direct Interest Deemed InterestName of Substantial Unitholder No. of Units % No. of Units %
Temasek Holdings (Private) Limited (THPL) – – 359,120,1591 37.16CapitaLand Limited (CL) – – 355,226,9682 36.76CapitaLand Mall Asia Limited (CMA) – – 355,226,9683 36.76CapitaLand Retail China Pte. Ltd. (CLRC) – – 185,581,3514 19.21Retail Crown Pte. Ltd. 185,581,351 19.21 – –HSBC Institutional Trust Services (Singapore)
Limited, as trustee of CapitaLand Mall Trust 122,705,000 12.70 – –Matthews International Capital Management,
LLC (MICM) – – 61,906,4605 6.41Matthews International Funds (MIF) – – 54,380,9006 5.63
1 THPL is deemed to have an interest in the unitholdings in which its associated companies have or are deemed to have an interest pursuant to Section 4 of the Securities and Futures Act, Chapter 289 of Singapore. THPL is wholly owned by the Minister for Finance.
2 CL is deemed to have an interest in the unitholdings of HSBC Institutional Trust Services (Singapore) Limited, as trustee of CapitaLand Mall Trust, and its indirect wholly owned subsidiaries namely, Retail Crown Pte. Ltd. and the Manager.
3 CMA is deemed to have an interest in the unitholdings of HSBC Institutional Trust Services (Singapore) Limited, as trustee of CapitaLand Mall Trust, and its indirect wholly owned subsidiaries namely, Retail Crown Pte. Ltd. and the Manager.
4 CLRC is deemed to have an interest in the unitholdings of its direct wholly owned subsidiary namely, Retail Crown Pte. Ltd..
5 MICM is a U.S. registered investment advisor who has a discretionary authority over its clients’ investment.
6 MIF is deemed to have an interest in the unitholdings of Brown Brothers Harriman & Co, the custodian for Units owned by MIF.
PUBLIC FLOAT
Based on the information made available to the Manager, approximately 56.38% of the Units in CRCT were held in the hands of the public as at 22 February 2018. Accordingly, Rule 723 of the Listing Manual of the SGX-ST has been compiled with.
CAPITALAND RETAIL CHINA TRUST
164

MALLDIRECTORY
CAPITAMALL XIZHIMEN
凯德MALL•西直门No. 1 Xizhimenwai Road,Xicheng District, Beijing北京市西城区西直门外大街1号Tel: +86 10 5830 1111Fax: +86 10 5830 1599
CAPITAMALL WANGJING
凯德MALL•望京No. 33 Guangshun North Road,Chaoyang District, Beijing北京市朝阳区广顺北大街33号Tel: +86 10 8472 9898Fax: +86 10 8472 9800
CAPITAMALL GRAND CANYON
凯德MALL•大峡谷No.16 South Third Ring West Road,Fengtai District, Beijing北京市丰台区南三环西路16号Tel: +86 10 8756 2780Fax: +86 10 8526 7556
CAPITAMALL SHUANGJING
凯德MALL•双井No. 31 Guangqu Road, Chaoyang District, Beijing北京市朝阳区广渠路31号Tel: +86 10 8472 9898Fax: +86 10 8472 9800
CAPITAMALL XINNAN
凯德广场•新南No. 99, Shenghe Yi Road, Gaoxin District,Chengdu, Sichuan Province四川省成都市高新区盛和一路99号Tel: +86 28 6759 9200 Fax: +86 28 6759 9201
CAPITAMALL QIBAO
凯德七宝购物广场No. 3655 Qixin Road,Minhang District, Shanghai上海市闵行区七莘路3655号Tel: +86 21 6479 3030Fax: +86 21 6479 0808
CAPITAMALL MINZHONGLEYUAN
凯德新民众乐园No. 704 Zhongshan Avenue, Jianghan District,Wuhan, Hubei Province湖北省武汉市江汉区中山大道704号Tel: +86 27 8553 0108Fax: +86 27 8537 9137
CAPITAMALL SAIHAN
凯德MALL•赛罕No. 26 Ordos Road, Saihan District,Hohhot, Inner Mongolia Autonomous Region内蒙古自治区呼和浩特市赛罕区鄂尔多斯大街26号Tel: +86 47 1596 1222Fax: +86 47 1597 1671
CAPITAMALL WUHU
凯德广场•芜湖No. 37 Zhongshan North Road,Jinghu District, Wuhu, Anhui Province安徽省芜湖市镜湖区中山北路37号Tel: +86 55 3599 1888Fax: +86 55 3599 1886
CAPITAMALL ERQI
凯德广场•二七No. 3 Minzhu Road, Erqi District,Zhengzhou, Henan Province河南省郑州市二七区民主路3号Tel: +86 27 8359 1800Fax: +86 27 8359 1818
ANNUAL REPORT 2017
165
FINA
NC
IALS
& A
DD
ITIO
NA
L INFO
RM
AT
ION
P
OR
TFO
LIO D
ETA
ILS
BU
SINE
SS RE
VIE
W
SUSTA
INA
BILIT
Y
CO
RP
OR
AT
E G
OV
ER
NA
NC
E &
TR
AN
SPA
RE
NC
Y
OV
ER
VIE
W

This page has been intentionally left blank.

This page has been intentionally left blank.This page has been intentionally left blank.

This page has been intentionally left blank.

CORPORATE INFORMATIONCAPITALAND RETAIL CHINA TRUST
REGISTERED ADDRESS OF THE TRUSTEEHSBC Institutional Trust Services(Singapore) Limited21 Collyer Quay#13-02 HSBC BuildingSingapore 049320Email: [email protected]: www.crct.com.sgStock Code: AU8UCounter Name: CapitaR China TR
TRUSTEEHSBC Institutional Trust Services(Singapore) Limited21 Collyer Quay#03-01 HSBC BuildingSingapore 049320Tel: +65 6658 6667Fax: +65 6534 5526
AUDITORKPMG LLPPublic Accountants and CharteredAccountants16 Raffles Quay#22-00 Hong Leong BuildingSingapore 048581Tel: +65 6213 3388Fax: +65 6225 0984Partner-In-Charge: Lim Pang Yew, VictorAppointed: With effect from financialyear ended 31 December 2017
UNIT REGISTRARBoardroom Corporate &Advisory Services Pte. Ltd.50 Raffles Place#32-01 Singapore Land TowerSingapore 048623Tel: +65 6536 5355Fax: +65 6536 1360
THE MANAGER
REGISTERED ADDRESS OF THE MANAGERCapitaLand Retail China TrustManagement Limited168 Robinson Road#30-01 Capital TowerSingapore 068912Tel: +65 6713 2888Fax: +65 6713 2999
BOARD OF DIRECTORSSoh Kim SoonChairman & Non-Executive Independent Director
Lim Ming YanDeputy Chairman & Non-Executive Non-Independent Director
Tan Tze WooiChief Executive Officer & Executive Non-Independent Director
Fong Heng BooNon-Executive Independent Director
Christopher Gee Kok AunNon-Executive Independent Director
Professor Tan Kong YamNon-Executive Independent Director
Neo Poh KiatNon-Executive Independent Director
Kuan Li LiNon-Executive Independent Director
Lim Cho Pin Andrew GeoffreyNon-Executive Non-Independent Director
Lee Chee KoonNon-Executive Non-Independent Director
AUDIT COMMITTEEFong Heng BooChairman
Christopher Gee Kok AunProfessor Tan Kong YamLim Cho Pin Andrew Geoffrey
CORPORATE DISCLOSURE COMMITTEESoh Kim SoonChairman
Lim Ming YanLim Cho Pin Andrew Geoffrey
EXECUTIVE COMMITTEE Lim Ming YanChairman
Tan Tze WooiLim Cho Pin Andrew GeoffreyLee Chee Koon
COMPANY SECRETARIESChuo Cher ShingTan Lee Nah
This Annual Report to Unitholders may contain forward-looking statements. Forward-looking statement is subject to inherent uncertainties and is based on numerous assumptions. Actual performance, outcomes and results may differ materially from those expressed in forward-looking statements. Representa-tive examples of factors which may cause the actual performance, outcomes and results to differ materially from those in the forward-looking statements include (without limitation) changes in general industry and economic conditions, interest rate trends, cost of capital and capital availability, availability of real estate investment opportunities, competition from other companies, shifts in customers’ demands, changes in operating conditions, including employee wages, benefits and training, governmental and public policy changes and the continued availability of financing in the amounts and the terms necessary to support future business. You are cautioned not to place undue reliance on these forward-looking statements, which are based on the current views of managementon future events.
All rights are reserved.

CapitaLand Retail China Trust Management LimitedAs Manager of CapitaLand Retail China TrustCompany Registration No. 200611176D
168 Robinson Road#30-01 Capital TowerSingapore 068912Tel : +65 6713 2888Fax : +65 6713 2999Email : [email protected]
www.crct.com.sg
This report is printed using soy-based ink on FSC™ mix uncoated paper which is part
produced using hydroelectric power.