Embed Size (px)
Citation preview

Optimising the user experience design process for timeous systems
development: A South African case study
By
Trevor Ngonidzashe Chawana
16251360
Submitted in fulfilment of the requirements for the degree
M Com in Informatics
in the
FACULTY OF ECONOMIC AND MANAGEMENT SCIENCES
at the
UNIVERSITY OF PRETORIA
Supervisor: Dr Funmi Adebesin
Date of submission
30 October 2020
©© UUnniivveerrssiittyy ooff PPrreettoorriiaa

i
Dedication
Ad majorem dei gloriam (for the greater glory of God).
©© UUnniivveerrssiittyy ooff PPrreettoorriiaa

ii
Abstract
User Experience (UX) design is the process of creating products that adequately meet
users’ needs and result in user satisfaction. In the context of software development,
the application of UX design practices has been linked to increased profitability in
organisations. Despite the financial benefit organisations stand to gain by adopting UX
design practices, previous studies have revealed a low rate of adoption. One key
source of resistance to the adoption UX design practices is the perception that adding
new steps to an organisation’s software development process would prolong delivery
timelines unnecessarily. Such resistance is compounded by the fact that a high
proportion of software development projects already exceed their planned durations.
The question therefore arises on how the UX design process can be optimised so that
it has the least amount of impact on the speed of delivering software. It is this very
question that this study answers.
In this study, the UX design processes from four case study organisations and six
prominent international UX design approaches were reviewed and analysed. From
these analyses, commonalities and optimisation opportunities were identified for each
process, then synthesised into a proposed framework. This study’s contribution to the
Human-Computer Interaction body of knowledge is the proposed Graduated UX
Design Adoption (gUXa) framework. The Innovation Resistance Theory (IRT) was
used to explain the ability of the gUXa framework to reduce the barrier to UX process
adoption due to its potential to optimise the design process for timeous systems
development.
Keywords: User experience, user experience design, gUXa framework, software
development, optimisation.
©© UUnniivveerrssiittyy ooff PPrreettoorriiaa

iii
Acknowledgments
I am grateful to the following people and institutions:
• My wonderful wife Celia, for encouraging me to take up this challenge and
supporting me through all the times I thought of quitting. I could not have asked
for a better partner in life.
• My uncle, Mr William Chikoto and aunt, Mrs Florence Chikoto, without whom I
would not have an education. Your love inspires me.
• My brother Henry for being a sounding board for ideas and encouraging me to
do my master’s with University of Pretoria. I have had a positive experience.
• My supervisor Dr Funmi Adebesin for your guidance, encouragement and
exceptional professionalism. You set the bar high and I consider you a role
model. Thank you.
• My initial supervisor, the late Prof Helene Gelderblom for energising me about
this study and setting me up for success.
• The University of Pretoria, for granting me a bursary to complete this
dissertation.
©© UUnniivveerrssiittyy ooff PPrreettoorriiaa

iv
Contents
Dedication ............................................................................................................................................. i
Abstract ................................................................................................................................................ ii
Acknowledgments ............................................................................................................................ iii
List of figures ..................................................................................................................................... ix
List of tables ....................................................................................................................................... ix
Glossary of terms............................................................................................................................... x
1. Introduction ................................................................................................................................. 1
1.1. Introduction and background to the study ................................................................. 2
1.2. Problem statement ............................................................................................................. 4
1.3. Research question ............................................................................................................. 5
1.4. Scope and delineations .................................................................................................... 5
1.5. Significance of the study ................................................................................................. 6
1.6. Contribution of the study ................................................................................................. 6
1.7. Chapters in the dissertation ............................................................................................ 6
2. Literature review ......................................................................................................................... 8
2.1. Introduction ......................................................................................................................... 9
2.2. Understanding UX design ................................................................................................ 9
2.2.1. User-centred design ..................................................................................................... 9
2.2.2. Constituents of UX design ........................................................................................ 11
2.2.3. UX design practices ................................................................................................... 13
2.3. Emerging trends in UX design ...................................................................................... 16
2.3.1. Agile UX ....................................................................................................................... 16
2.3.2. Lean UX ....................................................................................................................... 18
2.3.3. Design thinking ........................................................................................................... 20
2.3.4. Google design sprint .................................................................................................. 22
2.3.5. Double diamond ......................................................................................................... 24
2.3.6. Atomic design ............................................................................................................. 25
2.3.7. Web analytics .............................................................................................................. 26
©© UUnniivveerrssiittyy ooff PPrreettoorriiaa

v
2.4. Measuring the benefits of incorporating UX practices in an organisation’s
systems development process ................................................................................................ 27
2.4.1. Net Promoter Score ................................................................................................... 29
2.4.2. Drop-off rate ................................................................................................................ 29
2.4.3. Increase in sales ......................................................................................................... 30
2.4.4. Cost reduction ............................................................................................................. 30
2.5. Conclusion ......................................................................................................................... 30
3. Research Design ...................................................................................................................... 32
3.1. Introduction ....................................................................................................................... 33
3.2. Theoretical framework .................................................................................................... 33
3.2.1. Innovation resistance theory ..................................................................................... 35
3.2.2. Defining innovation resistance ................................................................................. 37
3.2.3. Functional barriers...................................................................................................... 38
3.2.4. Psychological barriers................................................................................................ 38
3.2.5. The nature of innovation resistance ........................................................................ 39
3.3. Relevance of the Innovation Resistance Theory to this study ............................ 39
3.4. Research Methodology ................................................................................................... 40
3.4.1. Research paradigm .................................................................................................... 41
3.4.2. Research strategy ...................................................................................................... 41
3.4.3. Sampling method........................................................................................................ 43
3.4.4. Data collection strategy ............................................................................................. 44
3.4.5. Data analysis strategy ............................................................................................... 44
3.4.6. Ethics ............................................................................................................................ 45
3.5. Conclusion ......................................................................................................................... 46
4. Interview results ....................................................................................................................... 47
4.1. Introduction ....................................................................................................................... 48
©© UUnniivveerrssiittyy ooff PPrreettoorriiaa

vi
4.2. Data collection .................................................................................................................. 48
4.3. Case Study A ..................................................................................................................... 48
4.3.1. UX design process: Case Study A........................................................................... 49
4.3.2. Reducing the total duration of the UX design process ......................................... 54
4.3.3. ROI measurement ...................................................................................................... 55
4.4. Case Study B ..................................................................................................................... 55
4.4.1. UX Design process: Case Study B .......................................................................... 56
4.4.2. Alignment to UX design approaches ....................................................................... 61
4.4.3. Reducing the total duration of the UX design process ......................................... 62
4.4.4. ROI measurement ...................................................................................................... 63
4.5. Case Study C ..................................................................................................................... 64
4.5.1. UX Design process: Case Study C .......................................................................... 65
4.5.2. Alignment to UX design approaches ....................................................................... 75
4.5.3. Reducing the total duration of the UX design process ......................................... 77
4.5.4. ROI measurement ...................................................................................................... 79
4.6. Case Study D ..................................................................................................................... 79
4.6.1. UX design process: Case Study D .......................................................................... 80
4.6.2. Alignment to UX design approaches ....................................................................... 84
4.6.3. Reducing the total duration of the UX design process ......................................... 84
4.6.4. ROI measurement ...................................................................................................... 85
4.7. Conclusion ......................................................................................................................... 86
5. Analysis ...................................................................................................................................... 88
5.1. Introduction ....................................................................................................................... 89
5.2. Themes ............................................................................................................................... 91
5.2.1. Theme1: UX design practices commonly implemented ....................................... 92
©© UUnniivveerrssiittyy ooff PPrreettoorriiaa

vii
5.2.2. Theme 2: Making the UX design process faster ................................................... 95
5.2.3. Theme 3: getting started with UX ............................................................................ 99
5.2.4. Theme 4: ROI in UX ................................................................................................. 100
5.3. Conclusion ....................................................................................................................... 101
6. The Proposed Graduated UX Design Adoption Framework (gUXa) ......................... 102
6.1. Introduction ..................................................................................................................... 103
6.2. Proposed framework ..................................................................................................... 103
6.2.1. Demonstrating the need for UX design ................................................................. 105
6.2.2. The UX design process ........................................................................................... 105
6.2.3. Process accelerators ............................................................................................... 110
6.2.4. ROI in UX design ...................................................................................................... 111
6.3. Evaluation of gUXa ........................................................................................................ 112
6.3.1. Evaluation criterion ................................................................................................... 112
6.3.2. Could gUXa reduce the usage barrier that exists for adopting UX practices? 113
6.4. Conclusion ....................................................................................................................... 116
7. Conclusion ............................................................................................................................... 117
7.1. Introduction ..................................................................................................................... 118
7.2. Summary of research findings ................................................................................... 118
7.2.1. Summary of findings: sub-question 1 .................................................................... 119
7.2.2. Summary of findings: sub-question 2 .................................................................... 119
7.2.3. Summary of findings: sub-question 3 .................................................................... 120
7.2.4. Summary of findings: sub-question 4 .................................................................... 121
7.2.5. Summary of findings: sub-question 5 .................................................................... 121
7.2.6. Summary of findings: primary research question ................................................ 122
7.3. Methodological reflections .......................................................................................... 124
7.4. Contribution ..................................................................................................................... 124
©© UUnniivveerrssiittyy ooff PPrreettoorriiaa

viii
7.5. Future research .............................................................................................................. 124
7.6. Conclusion ....................................................................................................................... 125
References ....................................................................................................................................... 126
Appendix A: Interview questions ............................................................................................... 136
Appendix B: Combined letter of introduction and informed consent .............................. 138
Appendix C: Ethical clearance certificate ............................................................................... 139
©© UUnniivveerrssiittyy ooff PPrreettoorriiaa

ix
List of figures
Figure 1.1: Outline of chapter 1.......................................................................................................... 1
Figure 2.1: Outline of chapter 2.......................................................................................................... 8
Figure 2.2: Boersma’s T-Model of UX design [adapted from Hobbs et al. (2010)] .................. 11
Figure 2.3: Lean UX process [adapted from Gothelf (2013)] ...................................................... 19
Figure 2.4: Design thinking process [adapted from Dam and Siang (2018)] ............................ 21
Figure 2.5: Google design sprint's five-day plan [adapted from Knapp et al. (2016)] ............. 23
Figure 2.6: Double diamond design process [adapted from Tschimmel (2012)]...................... 24
Figure 3.1: Outline of chapter 3........................................................................................................ 32
Figure 3.2: Hierarchy of barriers to innovation [adapted from Ram and Sheth (1989)] .......... 37
Figure 4.1: Outline of chapter 4........................................................................................................ 47
Figure 4.2: UX design process for Case Study A .......................................................................... 50
Figure 4.3: UX design process for Case Study B .......................................................................... 57
Figure 4.4: UX design process for Case Study C ......................................................................... 66
Figure 4.5: Shortened UX design process for Case Study C ...................................................... 72
Figure 4.6: UX design process for Case Study D ......................................................................... 81
Figure 5.1: Outline of chapter 5........................................................................................................ 88
Figure 5.2: Summary of coding and elaboration process to derive themes .............................. 91
Figure 5.3: Summary of themes from analyses of interview results ........................................... 92
Figure 6.1: Outline of chapter 6...................................................................................................... 102
Figure 6.2: The proposed gUXa framework ................................................................................. 104
Figure 6.3: Relationship between barrier to innovation and innovation resistance ............... 113
Figure 6.4: Impact of gUXa on usage barrier ............................................................................... 114
Figure 7.1: Outline of chapter 7...................................................................................................... 117
List of tables
Table 1.1: Research question and sub-questions ........................................................................... 5
Table 2.1: UX design practices ........................................................................................................ 13
Table 4.1: Description of each step of Case Study A's UX design process .............................. 51
Table 4.2: Description of each step of Case Study B's UX design process .............................. 58
Table 4.3: Description of each step of Case Study C's UX design process ............................. 67
Table 4.4: Description of each step of Case Study C's shortened UX design process ........... 73
Table 4.5: Description of each step of Case Study D's UX design process ............................. 82
Table 5.1: Common UX design practices in case study organisations ...................................... 93
Table 5.2: Common approaches followed by case study organisations ................................... 95
Table 6.1: Process steps for the gUXa framework ..................................................................... 107
Table 6.2: Impact of each gUXa component on the usage barrier ........................................... 115
©© UUnniivveerrssiittyy ooff PPrreettoorriiaa

x
Glossary of terms
Term Definition
Waterfall An approach to software development projects in which analysis, design, development and testing activities are conducted in a linear, sequential manner (Seno, Andryana & Iskandar, 2020). The waterfall approach is also known as the “traditional” approach to software development (Seno et al., 2020).
Agile An approach to software development projects in which cross-functional teams deliver working software in short, frequent intervals (Dingsøyr, Nerur, Balijepally & Moe, 2012).
Sprint A timeboxed period within which analysis, design or software development work must be completed, usually between one and four weeks (Wang, 2019).
Product backlog Prioritised list of features and enhancements to be developed by a software development project team (Moreira, 2013).
Front-end developer A software development professional whose role is to create the user interface of an application (Laaziri, Benmoussa, Khoulji, Larbi & El Yamami, 2019).
Middleware and back end developer
A software development professional whose role is to develop the database and the components that enable retrieval of data from the database, for display on the user interface (Ghimire, 2020).
UX designer A professional whose role is to ensure that the design of an application meets the needs of target users by including users in the design process (Barbosa-Hughes, 2019).
UI designer A design professional whose role is to create prototypes that resemble the final user interface including colour, icons, buttons and how the screen objects respond to user activation (Pandian & Suleri, 2020).
©© UUnniivveerrssiittyy ooff PPrreettoorriiaa

1
1. Introduction
Figure 1.1: Outline of chapter 1
©© UUnniivveerrssiittyy ooff PPrreettoorriiaa

2
1.1. Introduction and background to the study
User interface design is an all-important aspect of systems development, as the user
interface is the point of contact between the user and the system (Gkonos, Iosifescu
Enescu & Hurni, 2019). Myers (1998) identified interface improvement as one of the
key factors that drive increased usage of the Internet, as well as the proliferation of
information systems. Over time, the increasing significance of a good user experience
(UX) has manifested itself both in terms of research and practice.
From a research perspective, the increase in UX-related studies has culminated in the
establishment of conferences and academic journals with focus on this area of study.
These conferences and journals are testament to the increasing relevance of UX, with
examples being the Australian Computer-Human Interaction Conference and the
Journal of Usability Studies, respectively. Knowledge from various academic
disciplines, most notably Psychology and Ergonomics, is interwoven into Human-
Computer Interaction (HCI), the discipline that focuses on the “human” aspect of UX
(Myers, 1998). Some universities have developed courses geared towards developing
UX professionals and there is an emergence of UX-focused degrees, such as the
Masters of Human-Computer Interaction offered by the University of Maryland
(Pretorius, Hobbs & Fenn, 2015).
In terms of practice, an appreciation of the need for good UX has prompted business
organisations to incorporate UX design practices in their systems development
processes (Gray, 2014). Practitioners working towards the improvement of UX span
across universities, government organisations and private sector organisations
(Myers, 1998). A study conducted by Pretorius et al. (2015) reported the emergence
of UX professionals with varying job titles. These practitioners have a shared objective,
©© UUnniivveerrssiittyy ooff PPrreettoorriiaa

3
namely, to ensure that system interfaces are designed in a manner that enables users
to have a good experience on them.
With such a compelling case for good UX, one would justifiably expect most or all
organisations to incorporate UX design practices in their systems development
processes. Findings from a study conducted in South Africa by Pretorius et al. (2015)
suggest that this is not the case. In a survey with 59 respondents, the top challenge
experienced by UX practitioners was the difficulty in garnering buy-in for UX design
and promoting it in the organisation. This problem was so common that 61% of
respondents listed this as the biggest challenge they face. The second biggest
challenge faced, which 36% of respondents identified as an issue, was the time
constraint during projects. Time constraints impeded the application of UX design
practices and the implementation of recommendations. Brosens (2017) also identified
time constraints on projects as one of the key reasons for a low adoption of UX design
practices in South African organisations. These challenges, among others, led to a
more poignant statistic: only 45% of organisations incorporated UX design practices
into their systems development process (Pretorius et al., 2015).
The purpose of this study was to propose a combination of UX design practices and
the sequencing thereof, that organisations could incorporate into their systems
development processes without compromising the speed of project delivery.
This chapter provided a background to the study, followed by a statement of the
research problem. The research problem informed the statement of the research
question and the scope and delineation of the study. The chapter also highlighted the
significance of the study and its contribution. The chapter concluded with a summary
of how the remaining chapters in the dissertation are structured.
©© UUnniivveerrssiittyy ooff PPrreettoorriiaa

4
1.2. Problem statement
Numerous studies have investigated the benefits of incorporating UX design practices
in systems development processes. For example, Donahue (2001) and Kolbeinsson,
Lindblom and Thorvald (2020) found that organisations stand to increase profitability
by incorporating UX design practices in their systems development processes.
Aleryani (2020) identified a broader range of benefits such as building the right product
for users, reduction of call centre volumes and increased customer loyalty.
Despite the number of studies that have linked the integration of UX design practices
into systems’ development processes with increased profitability, Pretorius et al.
(2015) and Brosens (2017) assert that there is still a low number of organisations that
incorporate UX design practices into their systems development processes. Business
decision-makers are even more reluctant to support the incorporation of UX design
practices into systems development processes. This is because systems development
costs are often seen immediately whereas the benefits of UX design practices are
often intangible (Kuusinen & Vaananen-Vainio-Mattila, 2012). Innes (2011) identified
a further complication that makes business decision-makers complacent in the low
adoption of UX design practices: some organisations that ignore ease-of-use have
managed to succeed commercially. However, the same author asserts that the market
conditions that make it possible for organisations to succeed without focusing on ease-
of-use have changed with the proliferation of applications. Organisations therefore
need to make ease-of-use a focus in their systems development.
In this study, I investigated the problem of low uptake of UX design practices in
systems development processes. Following the investigation, I developed a UX design
process that could enable organisations to incorporate UX design in their systems
development process without compromising the speed of project delivery.
©© UUnniivveerrssiittyy ooff PPrreettoorriiaa

5
1.3. Research question
With the research problem in mind, the following questions arose:
Table 1.1: Research question and sub-questions
Main Question How can the user experience design process be optimised to ensure minimal impact on overall system development time?
Sub-question1 Which UX design practices are predominantly used by UX practitioners in South African organisations?
Sub-question2 How do organisations in South Africa incorporate UX practices into their systems development processes?
Sub-question3 How can return on investment (ROI) in UX practices be measured?
Sub-question4 What emerging UX design practices are currently not being used by organisations in South Africa?
Sub-question5 What combination of UX design practices and sequence of UX design practices can enable organisations in South Africa to incorporate UX design in the software development process without compromising the speed of project delivery?
1.4. Scope and study limitations
Given the time constraint placed on completing this research, I limited the scope from
two perspectives: country and research participants. The research was conducted in
South Africa, with the findings applicable to the country’s context. References were
made to findings from research conducted in other countries, but these were used to
provide a broader context to this research. Within South Africa, the research was
narrowed down to a set of organisations selected using the purposive sampling
technique. Lastly, the research participants were limited to UX team leads, UX
practitioners and participants that worked closely with the UX-related roles within the
participating organisations.
As will be discussed in section 4.2, 33 people from four case study organisations
participated in the study. As such, the results cannot be generalised to all South
African organisations. However, the study provides a research-based framework that
©© UUnniivveerrssiittyy ooff PPrreettoorriiaa

6
organisations that wish to incorporate UX design into their development processes
could tailor to suit their needs.
1.5. Significance of the study
The output of this study was a UX design process that is geared towards minimising
the impact of UX design practices on the total duration of systems development
projects. The reduced impact of UX design on total project duration could reduce the
level of resistance to the adoption of UX design. This in turn, could help increase the
adoption of UX design by organisations in South Africa.
1.6. Contribution of the study
The practical contribution of this study was a UX design framework. The framework,
called Graduated UX Design Adoption (gUXa), was developed based on a
combination of literature review and results from the case studies conducted. With the
gUXa framework, organisations that intend to adopt UX design have a process that
they can incorporate into their development processes, without compromising the
speed with which they can complete their systems development projects.
1.7. Chapters in the dissertation
This dissertation has seven chapters, namely the introduction, literature review,
research design, interview results, analysis, the proposed graduated UX design
adoption framework and conclusion. Each of these chapters is briefly described below.
The introduction, discussed in this chapter, provided context for the study by
describing the problem statement, research question, scope and delineations,
significance of the study, contribution of the study and describing the chapters in the
dissertation.
©© UUnniivveerrssiittyy ooff PPrreettoorriiaa

7
The literature review chapter provided an overview of extant literatures that were
relevant to this study. The chapter looked at the definition of UX, UX design and UX
design practices. This was followed by a discussion of emerging trends in UX design.
Lastly, the chapter provided a brief overview of how Return on Investment (ROI) from
the adoption of UX design practices into software development processes could be
measured.
The research design chapter provided a description of the theoretical framework and
research methodology applied to this study. The chapter started with a description of
the research theory upon which the research was grounded. Following the description
of the theory was a description of the research paradigm that I adopted, the research
strategy, how the research data was collected and how the data was analysed.
The Interview results chapter provided a summary of interview responses from
participants.
The Analysis chapter provided a description of the themes derived from the interview
results.
In the Proposed Graduated UX Design Adoption Framework (gUXa) chapter, each
component of the proposed framework was described. The proposed framework was
also evaluated in this chapter.
The final chapter, the conclusion, provided a summary of the study. The main research
question and sub-questions were re-visited in this chapter, with a summary of how
they were answered. The chapter also highlighted the contribution of this study to the
HCI body of knowledge.
©© UUnniivveerrssiittyy ooff PPrreettoorriiaa

8
2. Literature review
Figure 2.1: Outline of chapter 2
©© UUnniivveerrssiittyy ooff PPrreettoorriiaa
9
2.1. Introduction
Numerous researchers have investigated the need for improved UX. For instance,
Sundberg (2015) and Downey and Rosales (2012) discuss the need for improved UX
to users, such as increased accuracy, increased job satisfaction, and reduced stress
levels. Other researchers such as Donahue (2001) and Kolbeinsson et al. (2020)
highlight the benefits of improved UX to an organisation, such as increased
profitability, customer loyalty and improved brand image. Existing publications have
varying focus areas spanning across UX design practices, UX design approaches and
ROI in UX design (Bannon, 2011). This literature review chapter covers the three
categories of research, with a special focus on UX design as a strategy for the design
of highly usable interfaces. The chapter begins with a discussion of UX design in
systems development, followed by a discussion of emerging approaches in UX design.
Lastly, the chapter covers the measurement of the benefits of incorporating UX design
practices in systems development processes.
2.2. Understanding UX design
2.2.1. User-centred design
Poorly designed user interfaces (UI) can result in slow task completion times and
negative user emotions such as frustration and anxiety (Sonderegger, Uebelbacher &
Sauer, 2019). In cases where users have no obligation to use a particular application,
they tend not to return to applications whose usage results in a negative emotion
(McCurdie, Taneva, Casselman, Yeung, McDaniel, Ho & Cafazzo, 2012). User-
centred design (UCD) is an approach to system design that emphasises the
involvement of potential users of a system in system design activities, to ensure their
needs are catered for (Gulliksen, Göransson, Boivie, Blomkvist, Persson & Cajander,
2003). UCD follows four principles, namely the active involvement of users, the clear
©© UUnniivveerrssiittyy ooff PPrreettoorriiaa

10
distinction and allocation of function between user and system, iterative design and
multi-disciplinary design teams (Gulliksen et al., 2003).
2.2.1.1. Active involvement of users
Involving users during system design requires a selection process that identifies
different user groups and enrols them for participation in the design process (Gulliksen
et al., 2003). According to Gulliksen et al. (2003) users should be included in both the
design and development processes. In cases where the users are not accessible, the
design team can identify representatives of user groups to involve in the design
process (Abras, Maloney-Krichmar & Preece, 2004).
2.2.1.2. Clear distinction and allocation of function between user and system
As a means to leverage the qualities of systems and humans, design teams should
distinguish tasks best performed by a system from tasks best performed by humans
during systems design (Maguire, 2001).
2.2.1.3. Iterative design
Iterative design entails repeatedly designing, evaluating and improving design
solutions (Maguire, 2001). Users can evaluate various artefacts such as paper
prototypes and screen designs of varying levels of fidelity (Maguire, 2001).
2.2.1.4. Multi-disciplinary design teams
UCD is a collaborative process that benefits from multiple perspectives and skill sets
typically found in systems development project teams and stakeholders that provide
them with information, support and resources (Maguire, 2001). A project team may
include UX specialists, end users, software developers, business analysts, testers,
product owners and UI designers (Maguire, 2001).
©© UUnniivveerrssiittyy ooff PPrreettoorriiaa

11
2.2.2. Constituents of UX design
To understand UX design, it is necessary to grasp the meaning of the phrase “user
experience.” Various authors have defined the phrase differently, with one particularly
succinct definition being provided by Hassenzahl (2008:2) as “a momentary, primarily
evaluative feeling (good-bad), while interacting with a product or service.” UX design
is defined as “a holistic, multidisciplinary approach to the design of user interfaces for
digital products” (Benyon & Resmini, 2017). UX design is a combination of eight fields,
namely information design, visual design, interaction design, information architecture,
usability design, copywriting, marketing and communications and computer science
(Hobbs, Fenn & Resmini, 2010). Figure 2.2 depicts the constituents of UX design and
the following paragraphs describe each constituent.
Figure 2.2: Boersma’s T-Model of UX design [adapted from Hobbs et al. (2010)]
Information design is the discipline that focuses on the analysis and design of
messages containing information, with the goal of presenting the information in a way
that message recipients can understand effectively (Pettersson, 2002).
©© UUnniivveerrssiittyy ooff PPrreettoorriiaa

12
Visual design is the discipline concerned with identifying and applying a combination
of visual elements such as fonts, colours and buttons, that is most appropriate for
target users (Watzman, 2003).
Interaction design is the discipline that focuses on identifying the appropriate
responses that systems should provide to users, such as motion and sound (Löwgren
& Stolterman, 2004). Examples of interaction design outputs are the perceived
suppression of a button when a user clicks on it and the sound produced when an
error message is displayed for a user (Löwgren & Stolterman, 2004).
Information architecture is the discipline that focuses on making it easy for users to
find content or functionality they are looking for on a system, by designing the
appropriate labels, navigation, organisation and search mechanisms (Morville &
Rosenfeld, 2006).
Usability is defined in ISO 9241-11 as “the extent to which a product can be used by
specified users to achieve specified goals with effectiveness, efficiency and
satisfaction in a specified context of use” (Jokela, Iivari, Matero & Karukka, 2003:1).
Nielsen and Norman (2017) made a distinction between UX and usability, highlighting
that UX encompasses usability. Usability design is the discipline that focuses on
ensuring that users can achieve their system usage goals efficiently and effectively
(Göransson, Lif & Gulliksen, 2003).
Copywriting is the discipline that focuses on the selection of the appropriate text for
users to read as they interact with a UI, such as labels, notifications and messages
(Shaw, 2012).
©© UUnniivveerrssiittyy ooff PPrreettoorriiaa

13
Marketing and communication is the discipline responsible for deciding the messages
to send to users and the medium through which to send them, both digital and non-
digital (Weiner, 2006).
Computer Science is the discipline that focuses on the development and improvement
of computer hardware and software components (Newell & Simon, 2007).
According to Hobbs et al. (2010) UX design practitioners are skilled in each of the
eight disciplines, but with varying levels of proficiency in each fields.
2.2.3. UX design practices
A UX design practice is an activity that is undertaken to improve the experience of
users on a system, in line with UCD principles (Brosens, 2017). As stated in section
2.2.1, UCD principles are active involvement of users, clear distinction and allocation
of function between user and system, iterative design and multi-disciplinary design
teams (Gulliksen et al., 2003). Table 2.1 provides brief overviews of common UX
design practices, namely user research, personas, user journeys, user stories, service
blueprint, use cases, competitor analysis, heuristic evaluation, concept testing,
sketches, prototypes and usability testing.
Table 2.1: UX design practices
UX design practice
Description of UX design practice
User research
In the context of UX design, user research is the process of gathering insights about the thought patterns, attitudes and behavioural patterns of end users (Baxter, Courage & Caine, 2015). UX designers use techniques such as interviews, surveys and focus groups to engage end users (Baxter et al., 2015). An accurate understanding of end users can lead to an improvement in the quality of design decisions (Goodman, Kuniavsky & Moed, 2012).
Personas A persona is a description of a fictitious end user (Nielsen, 2019). A persona is typically given a name, age, habits, goals and a description of when and how they would use the system (Kelle, Henka & Zimmermann, 2015). The objective of a persona is to communicate the traits and goals of end users in a manner that is
©© UUnniivveerrssiittyy ooff PPrreettoorriiaa

14
easy to remember and to evoke empathy towards users (So & Joo, 2017). A persona is derived from user research (Kelle et al., 2015). In cases where systems development project teams have a limited budget or time allocation to conduct user research, they develop proto-personas, which they validate through research as a project progresses (Gothelf, 2013). A proto-persona is a persona created by UX designers based on interviewing individuals that possess knowledge about end users, but are not themselves end users (Pinheiro, Lopes, Conte & Zaina, 2019). Examples of interviewed individuals are representatives from the Marketing department and each business unit responsible for a segment of end users (Pinheiro et al., 2019).
User journeys
A user journey map is a depiction of the interactions a user has with an organisation while accessing a specific service (Kojo, Heiskala & Virtanen, 2014). User journey maps are documented from the customer’s perspective, highlighting their thoughts and feelings as they progress through the activities involved in accessing the service (Kojo et al., 2014). The insights depicted on a user journey map are derived from user research and used to highlight parts of the user’s journey that require improvement (Lemon & Verhoef, 2016).
User stories A user story is a description of functionality that is required by a user or purchaser of a system and the value to be derived from the functionality (Cohn, 2004). User stories are typically written in the format “as a (role) I want (functionality) so that (business benefit)” (Clarke & Kautz, 2014). User stories enable software development teams to plan and estimate the number of features to include in a sprint (Cohn, 2004).
Service blueprints
A service blueprint is a depiction of the interactions a user has with an organisation while accessing a specific service, together with the organisation’s internal processes that support the delivery of that service (Carlbring, 2020). A service blueprint can be viewed as an extension of a user journey map (Stickdorn, Hormess, Lawrence & Schneider, 2018). It is documented based on findings from user research and conversations with business units that support the delivery of that service to customers (Koljonen, 2019). Documenting a service blueprint ensures that a project team considers not only the manner in which a user interacts with a service but also whether the organisation’s internal processes can support the service (Carlbring, 2020).
Use cases A use case is a description of a user’s interaction with a system, written from the user’s perspective (Noda, Kishi & Fukuzumi, 2020). Use cases provide clear requirements to software developers (Chen, Chen, Wen, Jiang, Zeng, Shu & Hong, 2019).
Competitor analysis
Competitor analysis is the systematic search and documentation of existing solutions to a design problem, with the intention of identifying opportunities for reuse and innovation (Lebedenko, 2019).
Heuristic evaluation
Heuristic evaluation is a usability evaluation method in which usability expert(s) review a system’s usability based on set criteria such as ease of navigation, page content, interaction mechanisms and
©© UUnniivveerrssiittyy ooff PPrreettoorriiaa

15
presentation of content (Toribio-Guzmán, García-Holgado, Pérez, García-Peñalvo & Martín, 2016).
Concept testing
Concept testing is the process of engaging potential users of a system with the goal of establishing the likely demand and target market for a product (Varnes, 2019). The outcomes of concept testing are either the improvement of a concept based on user feedback, or the decision not to proceed with developing the idea further due to a low likelihood of success (Varnes, 2019).
Sketches A sketch is the simplest visual representation of the ideas to solve a specific design problem (Humanfactors.com, 2014). Sketches are the first visualisations created in a UX design process, typically in a brainstorming workshop to explore ideas and narrow down options (UXmatters.com, 2020).
Prototypes A prototype is a draft version of a product that can be presented to users for evaluation before investing resources in development (Usability.gov, 2020). High-fidelity prototypes closely resemble the likely final design and tend to allow users to click through some content (Humanfactors.com, 2014). Low-fidelity prototypes do not closely resemble the likely final design and can be in the form of paper drawings (Usability.gov, 2020).
Usability testing
Usability testing is the evaluation of the extent to which users can complete tasks efficiently and effectively on a system (Baxter et al., 2015). In preparation for a usability test, a UX designer creates a set of tasks for users to perform on a prototype and observes the users as they perform each task (Lang & Howell, 2017). The results of usability testing are used to improve the design in an iterative manner (Baxter et al., 2015). Given that usability is a key component of UX, usability testing is one of the UX evaluation methods used by UX practitioners (Vermeeren, Law, Roto, Obrist, Hoonhout & Väänänen-Vainio-Mattila, 2010).
Sections 2.2.1 to 2.2.3 facilitated a deeper understanding of the main area of research,
namely, UX design. Identifying and describing UX design practices in Table 2.1
supported the investigation of research sub-questions 2 and 5 by identifying common
UX practices, which are in scope for optimisation as part of this study. Without a clear
understanding of UX design and UX design practices, a likely outcome would have
been the optimisation of practices from other disciplines, such as quality assurance
and software architecture.
©© UUnniivveerrssiittyy ooff PPrreettoorriiaa

16
2.3. Emerging trends in UX design
As with most fields in Information Technology (IT), UX design and UX design practices
are constantly evolving (Allsteadt, 2017). Some of the emerging approaches to UX
design are Agile UX, Lean UX, Design thinking, Google design sprint, Double
diamond, Atomic design and Web analytics. This section contains a description of
these approaches. Understanding emerging trends in UX design supported the
investigation of research sub-question 4 by providing a basis upon which case study
organisations’ UX design processes could be compared.
2.3.1. Agile UX
In organisations where traditional software development approaches are followed, all
UX design activities are conducted prior to commencing development (Kuusinen &
Vaananen-Vainio-Mattila, 2012). In those organisations, UX design is typically run as
a separate stream of work that happens outside the development (Kuusinen &
Vaananen-Vainio-Mattila, 2012). A negative consequence of this separation is that
business stakeholders are often willing to forego UX design, as it is portrayed as an
optional extra that lengthens the project unnecessarily (Kuusinen & Vaananen-Vainio-
Mattila, 2012).
The increasing adoption of Agile software development methodologies has prompted
organisations to adapt UX practices to suit the more iterative software development
processes (Lárusdóttir, Cajander & Gulliksen, 2012). The Agile community is generally
against “big design up front” whereas UX practitioners traditionally prefer it (Lárusdóttir
et al., 2012). Thus, a new approach to UX design called Agile UX has emerged, with
the objective of bridging this gap. Agile UX is a methodical approach to designing
systems using Agile principles (Kuusinen & Vaananen-Vainio-Mattila, 2012). The
following paragraphs describe the key elements of the Agile UX process.
©© UUnniivveerrssiittyy ooff PPrreettoorriiaa

17
Kuusinen and Vaananen-Vainio-Mattila (2012) outline a process for Agile UX. The
involvement of UX practitioners ideally starts during project planning, with UX
practitioners advocating the inclusion of relevant UX practices to ensure users have a
good interaction with the software. Once the involvement of UX practitioners is
secured, user research is conducted, then initial sketches are drawn for review before
any user story is documented. The initial sketches are then used by the development
team, including the product owner, to plan the product backlog. Once the product
backlog is complete, the development team informs the UX practitioner on what will
be developed in the next sprint. At that point, an iterative process is triggered, where
the UX practitioner details and refines the design for the upcoming sprint before
development for that sprint is started. Once designs for a sprint are completed, the
development team reviews the prototypes, then starts development. During
development, a pre-demonstration session is conducted a day and a half before
demonstration, so that if UX issues are identified, the team has a day and a half to
correct them. This development process ensures that the UX designer always works
a sprint ahead of the development team, then supports them during the actual
development.
Agile UX has its challenges. One of the key issues is the difficulty of keeping the vision
of UX in mind. In Agile software development approaches such as SCRUM, the project
team adds so much functionality that by the end of the project, it is difficult to know
where to fit new functionality in the overall UX of the system (Lárusdóttir et al., 2012).
One suggestion to deal with this challenge is to do a thorough pre-study before
prototyping and conducting usability testing (Lárusdóttir et al., 2012). Another key
issue highlighted as a hindrance to Agile UX is the reduction in the amount of time
allocated to design activities due to budget constraints (Kuusinen & Vaananen-Vainio-
©© UUnniivveerrssiittyy ooff PPrreettoorriiaa

18
Mattila, 2012). According to Kuusinen and Vaananen-Vainio-Mattila (2012) this is
largely a result of misalignment between software sales and software development
processes, where the former still run in a Waterfall manner but the latter are Agile.
Kuusinen and Vaananen-Vainio-Mattila (2012) suggest the inclusion of UX
professionals in the sales process to ensure that there is advocacy for UX design,
resulting in its adoption on projects. With these drawbacks considered, it has been
found that designing for good UX in an iterative manner is less costly than excluding
it then improving what had already been developed (Kuusinen & Vaananen-Vainio-
Mattila, 2012).
2.3.2. Lean UX
Lean UX is a UX design process that eliminates waste by minimising documentation,
focusing on rapid experimentation and fostering collaboration for all the role players in
systems development (Gothelf, 2013). It is applicable across different system
development methodologies, both Agile and Waterfall (Gothelf, 2013). The key steps
of Lean UX are declaring assumptions, creating a Minimum Viable Product (MVP),
running experiments and lastly, feedback and research (Gothelf, 2013). These steps
are depicted in Figure 2.3 and summarised below.
Gothelf (2013) describes each of the steps in the Lean UX process. Declaring
assumptions is when UX practitioners state the assumptions upon which they base
their designs before they can ascertain the facts. This enables UX practitioners to
continue with work without any delay, and thereafter validate the assumptions when
they can ascertain the facts. Using the information available to them, UX practitioners
develop an MVP, which is an early, skeletal version of the envisioned product.
Developing an MVP enables UX practitioners to conduct a concept test on the
©© UUnniivveerrssiittyy ooff PPrreettoorriiaa

19
conceptual design without spending too much time on it, thereby reducing the costs
associated with creating the MVP. Once completed, the MVP is tested and gradually
improved. The feedback and research conducted by the design practitioners are then
used to update the MVP and test it iteratively.
With any two steps, there is a constant overlap. For example, assumptions can be
specified while creating an MVP. During concept testing, the MVP can be enhanced.
This is best illustrated by Figure 2.3 which summarises the Lean UX process.
Figure 2.3: Lean UX process [adapted from Gothelf (2013)]
Organisations stand to benefit from implementing Lean UX. One key advantage is the
elimination of non-critical documentation, which saves time on projects (Gothelf,
2013). It is also applicable across different types of software development
methodologies because the processes can fit with traditional and Agile approaches
(Gothelf, 2013). Lastly, the rapid display of incremental improvements results in Lean
UX lending itself to be a more attractive option over traditional UX design processes,
particularly with business stakeholders (Gothelf, 2013).
©© UUnniivveerrssiittyy ooff PPrreettoorriiaa

20
Although authors such as Gothelf (2013) and Elberzhager, Holl, Karn and Immich
(2017) believe that Lean UX is the ideal way of incorporating UX practices into systems
development processes, Liikkanen, Kilpiö, Svan and Hiltunen (2014) identified some
challenges with implementing the approach. Lean UX presents a big change for
organisations and they find it challenging to implement this way of working, given how
differently it tends to be from traditional UX approaches (Liikkanen et al., 2014). This
renders it impractical in organisations that are not ready for change (Liikkanen et al.,
2014).
2.3.3. Design thinking
Design thinking is a process for solving complex design problems and creating new
products (Black, Gardner, Pierce & Steers, 2019). The process was popularised by
consulting organisation IDEO in 2001 (Liedtka, 2018). The Design thinking process
has been adopted by some of the world’s largest organisations such as Google and
Apple (Dam & Siang, 2018). Its popularity is so widespread that some universities
such as Harvard University and Massachusetts Institute of Technology also teach the
process (Dam & Siang, 2018).
There are five phases in the Design thinking process, namely Empathise, Define,
Ideate, Prototype and Test. The phases of Design Thinking are depicted in Figure 2.3
and described in the following paragraphs.
©© UUnniivveerrssiittyy ooff PPrreettoorriiaa

21
Figure 2.4: Design thinking process [adapted from Dam and Siang (2018)]
Design thinking does not prescribe specific tools and techniques but provides a
guideline of what should be done in each phase (Dam & Siang, 2018). In the
Empathise phase, designers learn about the users for whom they need to solve a
problem. Typically, this involves making assumptions about user characteristics
before validating the assumptions through interviews with representatives of the users.
The output of this phase is a set of personas that describe the users.
The objective of the Define phase is to document a problem statement (Dam & Siang,
2018). In the Define phase, designers draw insights from data they gathered in the
Empathy phase about the user and the user’s context, then synthesise the data into a
limited set of user needs (Plattner, 2013). By combining their understanding of the
user’s attributes, context and needs, designers articulate an actionable problem
statement, which is the basis for the rest of the design effort (Plattner, 2013).
In the Ideate phase, the designers engage relevant parties and come up with creative
ideas for potential solutions to the problem (Dam & Siang, 2018). Examples of
©© UUnniivveerrssiittyy ooff PPrreettoorriiaa

22
techniques used in this phase are sketching and brainstorming (Plattner, 2013). In the
Ideate phase, the emphasis is on generating as many ideas as possible without
evaluating their feasibility or suitability for solving the problem (Plattner, 2013). To
transition into the Prototype phase, the designers narrow down the ideas into two or
three ideas that are most likely to succeed in solving the problem (Plattner, 2013).
The Prototype phase consists of creating prototypes that can be evaluated by users
(Plattner, 2013). There are no restrictions on the format in which the a prototype is
created, so a designer can choose paper, a whiteboard, prototyping software or any
other medium they deem suitable for eliciting user feedback (Plattner, 2013).
Designers spend as little time as possible creating the prototypes, while making sure
there is enough detail for users to evaluate (Plattner, 2013).
The objective of the Test phase is to evaluate the prototype through concept testing
(Plattner, 2013). The concept testing enables designers to elicit users’ thoughts and
feelings about the prototype (Plattner, 2013). The insights from concept testing are
used to refine the design in the following iteration of design (Plattner, 2013).
The phases of the Design thinking process are non-linear and iterative (Dam & Siang,
2018). This implies that when, for example, a prototype is completed and it fails the
testing process, the design team goes back to problem definition or ideation,
depending on what it deems fit.
2.3.4. Google design sprint
The Google design sprint is an approach for creating and testing solutions to complex
design problems in five days (Knapp, Zeratsky & Kowitz, 2016). The sprint is a five-
day workshop facilitated by a designer, where representatives from various
departments such as Sales, Product Support and IT, collaborate to create and test
©© UUnniivveerrssiittyy ooff PPrreettoorriiaa

23
solutions to complex problems (Banfield, Lombardo & Wax, 2015). The process was
created in 2010 by Jake Knapp while he was working for Google (Knapp et al., 2016).
The Design sprint process is depicted in Figure 2.4.
Figure 2.5: Google design sprint's five-day plan [adapted from Knapp et al. (2016)]
Knapp et al. (2016) specified the activities that are conducted during each day of a
sprint. On Monday, workshop participants define a clear problem statement and the
objective(s) for the remaining four days. On Tuesday, participants review existing
competitor solutions to the problem, then sketch potential solutions. Another key
activity for Tuesday is recruitment of users that match the target user group, for testing.
On Wednesday, participants go through a structured process of combining the best
ideas from all the sketches completed on Tuesday into one final sketch. On Thursday,
the design team creates a testable prototype based on Wednesday’s final sketch. This
high-fidelity, clickable prototype only needs a UI, rather than a complete technical
solution with a database and middleware.
On Friday, the prototype created on Thursday is tested with users. The feedback from
testing provides designers with sufficient information to decide whether to take the
design forward for development or make refinements.
©© UUnniivveerrssiittyy ooff PPrreettoorriiaa

24
2.3.5. Double diamond
The Double diamond approach is a process used by design professionals to conduct
user-centred design (Tschimmel, 2012). The process was developed by the UK
Design Council in 2005 (Tschimmel, 2012).
The Double diamond model has four phases, namely Discover, Define, Develop and
Deliver (Tschimmel, 2012). The model is depicted in Figure 2.5 and described in the
paragraphs that follow.
Figure 2.6: Double diamond design process [adapted from Tschimmel (2012)]
The phases of the Double Diamond process are described as either diverging or
converging. The diverging phases are characterised by an accumulation of data and
ideas, whereas in the converging phases, the volume of data is reduced as data is
synthesized into insights (Cahya, Handayani & Wibawa, 2018).
In the Discovery phase, the designer interviews users impacted by a problem, to gain
better understanding of their context and challenges (Cahya et al., 2018). In the Define
phase, the designer synthesises the data gathered during Discovery and based on the
insights, defines a problem statement (Kim, 2020).
©© UUnniivveerrssiittyy ooff PPrreettoorriiaa

25
Once the problem is clearly defined, potential solutions are brainstormed, refined and
prototyped in the Development phase (Tschimmel, 2012). The Delivery phase
concludes the process. In the Delivery phase, different solutions are developed on a
small-scale, tested and refined, resulting in the implementation of the solution that will
likely succeed (Cahya et al., 2018).
2.3.6. Atomic design
A design system is a repository of reusable Graphical User Interface (GUI)
components such as text boxes, buttons and labels (Frost, 2016). It enables designers
to complete UI design quickly because they can select objects from a library of existing
components, rather than creating new ones for each new project (Frost, 2016).
Atomic design is an approach to creating a design system, based on a hierarchy of
elements that make up a web page (Frost, 2016). Developed by Brad Frost, Atomic
design applies an analogy from the field of chemistry to the development of design
systems. It proposes five stages of designing a UI, namely atoms, molecules,
organisms, templates and pages (Frost, 2016).
The first three elements are named in a manner that emphasises hierarchy, using
concepts from chemistry.
Given that atoms are the smallest unit of matter, the atoms on a UI are the basic
Hypertext Markup Language (HTML) elements such as buttons, labels and text boxes
(Frost, 2016).
When atoms combine in chemistry, they form molecules, which take on a unique set
of properties different from each individual atom. On a UI, molecules are the
combination of objects such as a text box with a label and a button to submit captured
text (Frost, 2016).
©© UUnniivveerrssiittyy ooff PPrreettoorriiaa

26
The next level on the hierarchy is an organism, which is a combination of molecules
(Frost, 2016). An example of an organism is a page header that contains the Search
text box, label and button, together with menu items, to make up a header. An
organism can be composed of either similar or different groups of molecules (Frost,
2016).
The next element on the hierarchy are templates, which are objects that enable
designers to organise a page’s components into a logical layout (Frost, 2016).
Templates provide a framework that guides the positioning of organisms and
molecules on a web page (Frost, 2016).
The last item on the hierarchy is a page, which is a specific instance of a template.
Pages contain specific content that closely resembles the content and function of the
final product, such as pictures and text (Frost, 2016).
2.3.7. Web analytics
Web analytics involve tracking of users’ online experiences to gain knowledge which
organisations can use to make informed decisions about their user interface (Clifton,
2012). It includes the use of software that tracks users’ activities on a website (Clifton,
2012).
The key advantage of Web analytics is that UX practitioners can decipher human
dynamics through various measures derived from tracking services (Goncalves &
Ramasco, 2008).
Criticism levelled against Web analytics is the violation of user privacy (Akkus, Chen,
Francis, Hardt & Gehrke, 2012). Some third-party analytics service providers track
user activity across platforms, leading to the development of anti-tracking legislation
and tracking-blocking software (Akkus et al., 2012).
©© UUnniivveerrssiittyy ooff PPrreettoorriiaa

27
2.4. Measuring the benefits of incorporating UX practices in an organisation’s systems development process
The adage “what gets measured gets done” has become a common cliché used in a
variety of contexts. To illustrate this, 93 500 results were returned when I conducted a
Google search for this exact phrase on 12 October 2020. UX and usability are not
exempt from the measurement agenda, with authors stating different views on the
measurement of the benefits of incorporating UX to an organisation’s systems
development process. This section discusses the different views.
In a study conducted by Djamasbi, McAuliffe, Gomez, Kardzhaliyski, Liu and Oglesby
(2014), it was concluded that optimisation of interfaces has a positive impact on the
ROI for a company. Bias and Mayhew (2005) provide empirical evidence and
examples of organisations that benefited financially from improving usability, a key
element of user experience. Turner (2011) suggests measuring ROI of UX practices
from various perspectives. At a strategic level, the author recommends the use of a
Balanced Scorecard (BSC) to link UX practices to overall business goals, including
the financial perspective, customer perspective, internal business perspective and the
innovation and learning perspective. The same author goes on to suggest specific
metrics under some categories, examples being the calculation of Net Present Value
to cater for the financial perspective, and calculation of cost per order (CPO) as a
metric for the internal business perspective.
Other researchers have expressed disagreement with ROI measures for UX.
Rosenberg (2004) expresses scepticism towards the accuracy of measurement of ROI
in UX. The article highlights that there is an insufficient amount of empirical evidence
to support claims that a better user experience results in a good ROI. The same author
further states that most of the articles recycle the “limited” amount of empirical work
©© UUnniivveerrssiittyy ooff PPrreettoorriiaa

28
that has been done in this area. Another issue highlighted in the same publication is
the creation of causal relationships between UX practices and the ROI metrics while
omitting, intentionally or otherwise, other contributing factors to those metrics. The
assumptions made in these causal relationships result in inaccuracies, largely
because the studies were not conducted in a controlled environment.
The low uptake of UX practices in South Africa identified by Pretorius et al. (2015) and
Brosens (2017) has a yet unexplained link to the finding that the top two challenges
faced by UX practitioners in South Africa relate to getting buy-in for UX and lack of
incorporation of UX practices into systems development processes due to time
limitations on projects. Kuusinen and Vaananen-Vainio-Mattila (2012) state that the
calculation of the ROI on UX is a tricky exercise on projects in practice and this is
further compounded by the fact that UX practices are often conducted outside of
software development processes. Traditional UX design processes are conducted
prior to development and as such, are often seen as a separate stream of work
(Kuusinen & Vaananen-Vainio-Mattila, 2012). This has an impact on funding for that
stream of work, as it is often seen as an optional extra. The status quo points to the
need for incorporating UX practices as part of software development processes.
Section 2.3 explored some of the emerging approaches to UX design that are geared
towards addressing the second biggest challenge faced by UX practitioners in South
Africa – time constraints on projects, which lead to either exclusion of UX practices or
the disregard for the results of UX practices (Pretorius et al., 2015).
Sections 2.4.1 to 2.2.4 describe four ROI metrics for UX design. The metrics described
in sections 2.4.1 to 2.2.4 enabled me to answer research sub-question 3.
©© UUnniivveerrssiittyy ooff PPrreettoorriiaa

29
2.4.1. Net Promoter Score
The Net Promoter Score (NPS) is a measure of customers’ loyalty to an organisation,
based on the extent to which they are likely to promote the organisation’s products or
services (Reichheld, 2003). Bradner and Sauro (2012) identified four key steps for
calculating NPS. The first step is to ask customers if they would recommend an
organisation’s product, applying a scale from zero to ten, with zero meaning “extremely
unlikely” and ten meaning “extremely likely.” The second step is to divide all the
responses into three categories, namely promoters, passives and detractors.
Promoters are responses with a nine or ten rating, while passives are responses with
a seven or eight rating and detractors are responses with a zero to six rating. Once
the responses are categorised, the third step is to calculate the percentage of
promoters and percentage of detractors. The last step is to subtract the percentage of
detractors from the percentage of promoters.
Organisations use NPS improvement as an ROI measure for UX, given that UX is
considered to be a key determinant of customer loyalty (Reichheld, 2003).
2.4.2. Drop-off rate
The drop-off rate is a measure of the number of users that exit an application from a
specific page (Young, 2014). A high drop-off rate for a particular page on an application
can be an indication of poor design (Weinschenk, 2005). A decrease in the drop-off
rate is one of the measures used to calculate ROI in UX design (Weinschenk, 2005).
The drop-off rate decrease is established by comparing the drop-off rate before a
redesign and after the redesign (Weinschenk, 2005).
©© UUnniivveerrssiittyy ooff PPrreettoorriiaa

30
2.4.3. Increase in sales
Good UX is often the outcome of a user-centred design process (Weinschenk, 2005).
When an application is developed with little or no consideration of users’ needs, user
frustration is often the result (Weinschenk, 2005). Good UX can lead to increased
sales on e-commerce websites and other software on which organisations generate
revenue (Weinschenk, 2005). The increase in sales is therefore a metric that can be
used to measure ROI in UX design and is calculated by comparing the sales revenue
before a redesign to the sales revenue after a redesign (Weinschenk, 2005).
2.4.4. Cost reduction
Poorly designed applications often result in high user training costs, higher call centre
volumes for user support and tend to require more detailed user manuals than well-
designed applications (Weinschenk, 2005). By implementing a UX design process,
organisations stand to reduce costs related to user training, support and user
documentation (Weinschenk, 2005). Cost reduction is calculated by subtracting the
cost of user training, support and documentation after a redesign from the costs before
the redesign (Weinschenk, 2005).
2.5. Conclusion
This chapter provided a summary of insights found in academic literature. The starting
point was to describe user-centred design and UX design. The eight disciplines that
constitute UX design were identified and a description of UX design practices was
provided. A discussion of emerging trends in UX design identified seven leading
approaches that may enable organisations to complete UX design in a timeous
manner. Lastly, a discussion followed, covering the measurement of benefits of UX
design. Numerous authors studying the measurement of the benefits have found it a
©© UUnniivveerrssiittyy ooff PPrreettoorriiaa

31
difficult and often inaccurate exercise as it almost always requires an assumption that
a causal link exists between UX practices and ROI.
©© UUnniivveerrssiittyy ooff PPrreettoorriiaa

32
3. Research Design
Figure 3.1: Outline of chapter 3
©© UUnniivveerrssiittyy ooff PPrreettoorriiaa

33
3.1. Introduction
The validity of empirical research studies is measured through multiple dimensions,
the key ones being rigour and relevance (Lee, 1999). Rigour is built into empirical
studies through the research design (Benbasat & Zmud, 1999). In this chapter, the
theoretical framework for this study is discussed, following which is the research
methodology that was followed in this study.
3.2. Theoretical framework
Research themes in the Information Systems (IS) field have progressed significantly
since the field’s inception in the 1960s (Hirschheim & Klein, 2012). As research themes
have evolved, so too have theoretical frameworks supporting them (Hirschheim &
Klein, 2012). The importance of theory in research has been immortalised in the
statement “nothing is quite so practical as a good theory” (Van de Ven, 1989:486).
Gregor (2006) defined five types of theories in IS research, namely:
• Theory for analysing;
• theory for explaining;
• theory for predicting;
• theory for explaining and predicting;
• theory for design and action.
Theory for analysing has a focus on identifying classificatory, compositional or
associative relationships for ‘what is’ rather than creating causal relationships (Gregor,
2006). Taxonomies typify the theories that fall into this category. An example of a
theory for analysing is the Trillium model, a usability capability maturity model which
specifies five maturity levels for usability practices in organisations (Jokela, Siponen,
Hirasawa & Earthy, 2006).
©© UUnniivveerrssiittyy ooff PPrreettoorriiaa

34
The second type of theory, theory for explaining identifies causal relationships, i.e.
how and why events or situations occur (Gregor, 2006). This type of theory explains
phenomena without predicting future outcomes based on past occurrences. An
example of theory for explaining is the Structuration theory, which explains the
reciprocal relationship between human agency or ‘action’ and the make-up of social
structures (Gregor, 2006).
Theory for predicting describes what will occur as a result of one or more factors,
without explaining why (Gregor, 2006). The emphasis of this type of theory is the ability
to predict outcomes without necessarily establishing a causal link between the
dependent and independent variables. An example of a theory for predicting is
Moore’s law, which predicts that the number of transistors in an integrated circuitry
would double every two years (Gregor, 2006).
Theory for explaining and predicting describes dependent and independent variables,
clearly identifying causal relationships and explaining the theoretical constructs of
each variable (Gregor, 2006). An example of this type of theory is the Technology
Acceptance Model (TAM) theory, which identifies the factors that influence when and
how users will use a new technology (Davis, Bagozzi & Warshaw, 1989). In the TAM
model, a causal link is established between the dependant variable and the
independent variables.
Lastly, theory for design and action describes an approach or formula for how to
accomplish a specific objective (Gregor, 2006). This type of theory is prescriptive in
nature, typically packaged as a method or process. The structured systems analysis
and design method is an example of this type of theory (Gregor, 2006). Gregor (2006)
asserts that every research study should be based on a sound theory.
©© UUnniivveerrssiittyy ooff PPrreettoorriiaa

35
The aim of this study was to propose a UX design process that will have the least
possible impact on the total duration of project delivery and as a result, increase the
adoption of UX design practices by organisations in South Africa. To achieve this, the
appropriate theoretical framework must link reduction in time taken for the completion
of UX design to an increase in adoption of UX design. Using the five theory types
proposed by Gregor (2006), the research problem lends itself to the application of a
theory for explaining and predicting, namely the Innovation Resistance Theory (IRT).
The Innovation Resistance Theory identifies the factors that influence the level of
resistance to an innovation and predicts what would happen if any of the factors are
changed (Ram & Sheth, 1989).
3.2.1. Innovation resistance theory
The Innovation Resistance Theory (IRT) was developed to address the high rate of
product failure by providing insights into why consumers do not readily adopt new
innovations (Ram & Sheth, 1989). Following its formulation, the theory has been
applied in a wide variety of research contexts. A few examples of studies that used the
IRT are described below.
In a study that investigated lack of adoption of Internet banking by a large proportion
of banking clients in Finland, Kuisma, Laukkanen and Hiltunen (2007) applied the IRT.
The study was qualitative in nature, with the researchers using semi-structured
interviews to gather data. Once data was gathered, the interview responses were
linked to each of the barriers to innovation as postulated by the IRT. This enabled the
researchers to establish the key sources of resistance to the adoption of Internet
banking, using banking clients in Finland as a case study.
©© UUnniivveerrssiittyy ooff PPrreettoorriiaa

36
In another study, Ma and Lee (2018) used the IRT to investigate the slow adoption of
Massive Open Online Courses (MOOCs) in a developing country, using China as a
case study. The study was quantitative in nature, with the researchers using focus
groups to elicit data from participants. Responses from the focus groups were then
linked to each of the barriers to innovation defined in the IRT, thereby establishing the
reasons for the slow adoption of MOOCs.
The IRT was also used in quantitative studies. In a study by Lian, Liu and Liu (2012),
the authors used the IRT to investigate whether the nature of a product influences the
amount of resistance to its adoption, using the adoption of online shopping as a case
study. The five barriers to innovation postulated by the IRT were the basis upon which
five hypotheses were formulated and tested. The study was quantitative in nature, with
a survey employed as the research instrument.
In another study, the IRT was used to understand the reasons for the slow adoption
of green innovations like solar water heaters, using Lebanon as a case study (Bakhit,
2016). As with Lian et al. (2012), the barriers to innovation postulated by the IRT were
the basis upon which five hypotheses were formulated and tested. The study was also
quantitative in nature, with a survey employed as the research strategy.
The variety of innovations investigated using the IRT is illustrative of its applicability to
a wide variety of products, services, processes and other innovation types. It has been
used in both qualitative and quantitative studies, with a variety of research strategies,
data collection and analysis methods.
In this study, the IRT was used in two ways. Firstly, to provide a research-based
explanation of why the length of time taken to complete the UX design process is a
legitimate source of resistance to the innovation named, UX design. Secondly, the
©© UUnniivveerrssiittyy ooff PPrreettoorriiaa

37
theory was used to evaluate the proposed framework, given that it provides a
research-based prediction of what could happen if the time taken to complete UX
design practices was reduced.
3.2.2. Defining innovation resistance
A point of departure for understanding what the IRT postulates is to define ‘innovation,’
‘resistance’ and ‘innovation resistance.’ An innovation can be defined as an idea,
practice or object that is perceived as new by an individual or other unit of adoption
(Rogers, 2002). Resistance, or resistance to change, is a behaviour that is geared
towards maintaining the status quo in situations where there is encouragement to alter
the present circumstances (Ram, 1987).
Innovation resistance is therefore the resistance presented by individuals to an
innovation, either because it poses potential changes from a satisfactory status quo
or because it conflicts with the individual’s belief structure (Ram & Sheth, 1989). As
depicted in Figure 3.2, there are two categories of barriers to innovation, namely,
functional and psychological barriers (Ram & Sheth, 1989).
Figure 3.2: Hierarchy of barriers to innovation [adapted from Ram and Sheth (1989)]
©© UUnniivveerrssiittyy ooff PPrreettoorriiaa

38
3.2.3. Functional barriers
Functional barriers arise when consumers expect an innovation to cause substantial
changes to a comfortable status quo (Ram & Sheth, 1989). There are three types of
functional barriers, namely: usage, value and risk (Ram & Sheth, 1989).
The most common reason for resistance to innovation is a perception from consumers
that the innovation will not be a good fit for existing workflows, practices or habits (Ram
& Sheth, 1989). This is called the usage barrier.
Another source of functional resistance arises when consumers conduct an analysis
of the ROI from adopting an innovation and find that it does not exceed that of the
existing or substitute products (Ram & Sheth, 1989). This is called a value barrier.
The third functional barrier arises when consumers have uncertainty regarding the
potential negative consequences of adopting an innovation, which could lead to the
postponement of innovation adoption until better understanding of the innovation
(Ram & Sheth, 1989). This is called the risk barrier. There are four key risks related to
adoption, namely physical harm to people or property, financial losses, mal-
performance and social risk i.e. being ostracised for adopting the innovation (Ram &
Sheth, 1989).
3.2.4. Psychological barriers
When innovations clash with consumers’ views or beliefs, psychological barriers arise
(Ram & Sheth, 1989). There are two types of psychological barriers, namely tradition
and image barriers (Ram & Sheth, 1989).
Innovation that requires consumers to change established traditions and norms could
lead to resistance. This is called the tradition barrier (Ram & Sheth, 1989).
©© UUnniivveerrssiittyy ooff PPrreettoorriiaa

39
The other type of psychological barrier arises when consumers develop negative
perceptions of products, product classes or their countries of origin. This is called the
image barrier (Ram & Sheth, 1989).
3.2.5. The nature of innovation resistance
Understanding the nature of innovation resistance is the key to finding ways to contain,
mitigate or eradicate it.
The first characteristic of innovation resistance is that it is a range, not an absolute,
static value. The lowest level of resistance is when a consumer postpones adoption
until his/her reservations have been addressed (Kleijnen, Lee & Wetzels, 2009). The
next level of resistance is when consumers reject a product or service deemed as an
innovation, without actively opposing it (Kleijnen et al., 2009). The highest level of
resistance is when a consumer actively opposes the innovation (Kleijnen et al., 2009).
The bigger the barriers to innovation, the higher the level of resistance to the
innovation (Kleijnen et al., 2009).
The second noteworthy characteristic of innovation resistance is that it exists across
different products, services and processes (Ram & Sheth, 1989). As a process, UX
design is therefore open to innovation resistance.
Lastly, innovation resistance affects the timing of adoption (Ram & Sheth, 1989). The
bigger the barriers to adopting an innovation, the longer consumers are likely to delay
its adoption.
3.3. Relevance of the Innovation Resistance Theory to this study
The importance of the Innovation Resistance Theory to this study is three-pronged.
Firstly, it provides a trustworthy explanation for why the adoption of UX design in South
Africa has been slow, as determined by Pretorius et al. (2015) and Brosens (2017).
©© UUnniivveerrssiittyy ooff PPrreettoorriiaa

40
The adoption of UX design, the innovation in this context, can prolong existing
workflows. The potential to prolong existing work processes can make the adoption of
UX design unattractive, considering the time constraint on software development
projects. In other words, a usage barrier exists for the adoption of UX design as an
innovation in the South African context.
Secondly, the IRT provides a guiding principle for the proposed framework. The
framework was formulated with the overarching goal of reducing the size of the usage
barrier that persists in South African organisations.
Lastly, the IRT provides the evaluation criteria that were used to assess the proposed
framework, given that the IRT is a credible basis for predicting what could happen
when the overall time taken to complete the UX design process is reduced.
Specifically, a framework with the potential to reduce the overall duration of the UX
design process could reduce the usage barrier, hence lowering the level of resistance
to the adoption of UX design practices.
To establish the more appropriate theoretical framework for this study, the Technology
Acceptance Model (TAM) was considered as an alternative. The TAM postulates that
perceived usefulness and perceived ease of use determine individuals’ intention to
use a system (Davis et al., 1989). The TAM theory falls short in its applicability to this
research because it has a narrow focus on technology, which does not encompass
UX design. The IRT’s broader focus on innovations makes it a more appropriate option
for this study, given its inclusion of processes and practices such as UX design.
3.4. Research Methodology
Sections 3.4.1 to 3.4.6 discuss the research methodology for this study, starting with
a discussion of the paradigm that was applied. After the research paradigm, the most
©© UUnniivveerrssiittyy ooff PPrreettoorriiaa

41
suitable research strategy is discussed, followed by discussions detailing the sampling
method, data collection strategy, data analysis strategy and lastly, research ethics.
3.4.1. Research paradigm
There are multiple paradigms from which to conduct research, with the predominant
ones being the positivist and interpretivist (Lee, 1991). The positivist paradigm views
reality as stable and knowledge as objective and observable, understandable through
experiments (Terre Blanche, Durrheim & Painter, 2006). Facts are therefore irrefutable
from the positivist perspective.
In contrast, the Interpretivist paradigm views reality as the subjective, socially
constructed experience of individuals (Walsham, 1995). From an interpretivist
perspective, reality can only be understood through the lens of individuals, which
means it cannot be separated from its observer.
The objective of this study was to formulate a UX design framework that will enable
South African organisations to implement UX design with the least possible impact on
the duration of software development projects. To gain an understanding of current
UX design practices in the South African context, I investigated the subjective
experiences of UX team leads and UX practitioners. The research therefore lends itself
to applying an interpretivist research paradigm.
3.4.2. Research strategy
Given the research objective mentioned in section 3.4.1, the investigation required
three key steps. The first step was to gain an understanding of the current UX design
processes followed by the organisations that participated in the research. A literature
review of UX practices that, if adopted, could lead to a faster UX design process was
©© UUnniivveerrssiittyy ooff PPrreettoorriiaa

42
then conducted. Lastly, a UX design process that could enable the least impact on
overall project duration was proposed.
Saunders, Lewis and Thornhill (2016) identified eight research strategies that are
generally used in research studies. These are experiments, surveys, archival
research, case studies, ethnography, action research, grounded theory and narrative
enquiry. Each of these strategies has specific contexts within which it is most
appropriately applied.
In selecting a research strategy for this study, several key factors were considered.
Firstly, UX design often occurs in the context of systems development projects, so the
research strategy of choice needed to be suitable for investigating past and present
projects. Secondly, the data collected needed to be understood from UX professionals’
perspective and be of a qualitative nature. Lastly, the investigation needed to be
carried out in more than one organisation, with research data being elicited within each
organisation’s natural context. Benbasat, Goldstein and Mead (1987) identified case
studies to be a research strategy of choice in cases where the researcher can study
information systems in a natural setting, can generate theories from practice and
understand the nature of processes taking place. The same authors asserted that case
studies are a good strategy to use for qualitative studies in which the experiences of
the actors are critical to the study. Given that this study matches the conditions
identified by Benbasat et al. (1987) as suitable for case study research, it lent itself to
the use of case studies as a research strategy. A description of case studies is given
the following paragraphs.
Yin (2011) distinguishes between case studies carried out in one organisation and
those carried out in more than one organisation, the single and multiple case study,
©© UUnniivveerrssiittyy ooff PPrreettoorriiaa
43
respectively. Given the focus on more than one organisation, the best-fit research
strategy to apply for this study was the case study, using different organisations as
case studies.
Using case study research has some benefits and drawbacks. One key benefit is that
it is suitable for studies in which a link between key activities and actors needs to be
established in a causal link (Benbasat et al., 1987). In this study, I maximised this
benefit of case studies by interviewing the role players whose processes I studied,
namely, UX design practitioners. One drawback of using case studies is that in cases
where historical data is being collected, research subjects might have inconsistent
recollection of events (Benbasat et al., 1987). In this study, I minimised the potential
impact of inconsistent recollection of events by interviewing multiple participants per
case study. Interviewing multiple participants was beneficial in that interview
responses that deviated significantly from otherwise homogenous responses could
easily be identified as an outlier to the general response. If I had interviewed one
person per case study, it would not have been possible to differentiate between
normative and exceptional responses.
3.4.3. Sampling method
When selecting organisations to participate in the study, I considered two key factors.
Firstly, the organisation should have UX design practices embedded in its systems
development process. This is an important consideration, given that only organisations
with UX design processes could provide information that is relevant for answering the
research question. The other consideration is that the organisations must be willing to
participate in the study. Given that the selection of participants in the study was based
on specific qualities they possessed, purposive sampling was the appropriate
©© UUnniivveerrssiittyy ooff PPrreettoorriiaa

44
sampling method (Etikan, Musa & Alkassim, 2016). Within each case study
organisation, I requested a list of individuals that worked as UX design specialists,
team leads and managers. After the lists were provided by each organisation, I
conducted one-on-one, semi-structured interviews with the consenting participants,
using a list of questions linked to research sub-questions 1-5. The interview questions
are documented in Appendix A.
3.4.4. Data collection strategy
The subjective emphasis of an interpretivist research study requires an understanding
of the individual research participant’s perspective (Terre Blanche et al., 2006).
Common approaches to collecting data for interpretivist research are interviews,
observations, document reviews and visual data analyses (Mackenzie & Knipe, 2006).
I used interviews as a data collection strategy. I conducted semi-structured interviews
with UX professionals and UX team leads in four organisations, as they were the most
knowledgeable individuals regarding UX practices. I also interviewed individuals in
roles that worked closely with UX professionals, for example, Business Analysts and
Product Owners. Interviews provided opportunities to ask follow-up questions to gain
deeper insights. The key information elicited from the interviews were the UX practices
implemented in organisations in South Africa.
3.4.5. Data analysis strategy
Data collection and data analysis in interpretivist research studies are often conducted
in parallel, with the latter taking more emphasis once the former is completed (Terre
Blanche et al., 2006). Terre Blanche et al. (2006) state five key steps for conducting
data analysis in interpretive studies. The first step is for researchers to familiarise
themselves with the data during the data collection process, with the result being a
©© UUnniivveerrssiittyy ooff PPrreettoorriiaa
45
good idea of the interpretations that are likely to be supported by the data. The second
step is to derive a set of optimally complex themes from the data, with relevant sub-
themes, ideally using a bottom-up approach.
While deriving relevant themes, the third step is conducted, which is the linking of
specific passages of text from collected data to the themes identified. This step is
known as “coding”. The fourth step is to refine and rearrange the themes and sub-
themes, an iterative process known as “elaboration”. During elaboration, themes and
sub-themes are reorganised until no new insights can be found from the data. The fifth
and final step is to interpret the findings, typically making use of the themes and sub-
themes identified. During interpretation, the researcher also reviews the themes and
sub-themes, and makes relevant changes, as necessary.
I followed the process detailed by Terre Blanche et al. (2006), starting with conducting
the interviews. All interviews were audio-recorded and transcribed, adhering to the
University of Pretoria’s research ethics guidelines (see section 3.4.6).
While conducting the interviews with research participants, I documented the current
UX design practices followed by each organisation. This documentation of UX design
practices continued after completion of the interviews and developed into a process of
deriving themes using coding and elaboration. The final step was interpreting the
findings, which involved sequencing UX design practices in the context of systems
development processes and deriving key insights that were useful for formulating the
proposed framework.
3.4.6. Ethics
I conducted the study in a manner that upheld research participants’ rights, particularly
the right to confidentiality, anonymity, informed consent, withdrawal and non-
©© UUnniivveerrssiittyy ooff PPrreettoorriiaa

46
participation as recommended by Oates (2005). Prior to being interviewed, each
participant reviewed and signed a combined letter of introduction and informed
consent, a copy of which is provided in Appendix B. The letter highlighted the
participant’s rights to confidentiality, anonymity, informed consent, withdrawal and
non-participation. I also obtained ethical clearance from University of Pretoria’s
Research Ethics Committee and ensured that all data collection, analysis as well as
reporting of the results were in line with the University’s research ethics requirements.
A copy of the ethics clearance letter is provided in Appendix C.
3.5. Conclusion
This chapter discussed the theoretical framework and research methodology for this
study. The Innovation Resistance Theory is the theoretical model of choice for this
study. It was selected as the most appropriate theoretical framework after careful
consideration of an alternative, for two key reasons. Firstly, it provides a research-
based and credible explanation for the reasons for the slow adoption of UX design by
South African organisations. Secondly, it is the basis upon which the proposed
framework was evaluated, as it provides a credible basis for predicting what could
happen if the overall time taken to complete the UX design process is reduced. The
research methodology discussion covered the research paradigm, research strategy,
data collection approach and data analysis approach. The nature of this study lent
itself to an interpretivist paradigm and a multiple case study. Interviews were the key
data collection approach and lastly, the data was analysed through a process of
coding, culminating in the derivation of logical themes that informed the proposed
framework.
©© UUnniivveerrssiittyy ooff PPrreettoorriiaa

47
4. Interview results
Figure 4.1: Outline of chapter 4
©© UUnniivveerrssiittyy ooff PPrreettoorriiaa

48
4.1. Introduction
The main research question that I undertook to answer in this study was “how can the
user experience design process be optimised to ensure minimal impact on overall
system development time?” There were three steps to answering this question, as
stipulated in section 3.4.2. The first step was to gain an understanding of the current
UX design processes followed by organisations in South Africa. Next was to conduct
a literature review of UX practices that, if adopted, could lead to a faster UX design
process. The third and final step was to design a process that could have minimal
impact on overall system development time. This chapter focuses on the first step. To
understand the current UX design processes followed by organisations in South Africa,
data was collected from four organisations that have UX design processes.
4.2. Data collection
As specified in section 3.4.4, interviews were the appropriate data collection strategy
for this study. To gain an understanding of the current UX design processes followed
by organisations in South Africa, I conducted 33 interviews with participants in four
case study organisations.
4.3. Case Study A
Case Study A is a Johannesburg-based organisation that specialises in developing
applications for its client organisations in a wide variety of industries. The organisation
was formed in 2003 and has clients located both in South Africa and abroad. This
section contains a summary of the UX design process followed by Case Study A, the
opportunities for optimisation of their processes and how ROI in the incorporation of
UX is measured in the organisation.
©© UUnniivveerrssiittyy ooff PPrreettoorriiaa

49
I interviewed two individuals from Case Study A, a Creative Director who co-founded
the organisation and a Lead UX Designer. Their respective roles required them to
understand the organisation’s entire software development process and influence the
UX design process.
4.3.1. UX design process: Case Study A
Figure 4.2 depicts the key steps followed by the organisation to complete UX design
and Table 4.1 contains a narrative for each step.
©© UUnniivveerrssiittyy ooff PPrreettoorriiaa

50
Figure 4.2: UX design process for Case Study A
©© UUnniivveerrssiittyy ooff PPrreettoorriiaa

51
Table 4.1: Description of each step of Case Study A's UX design process
Step No.
Step name Step description Step output
1 Define problem statement
The project team from Case Study A schedule a workshop with the representative(s) of a client organisation to understand their business objectives and the problem that a proposed website or custom software should solve. The problem statement is written down on a white board during a Discovery session. A Discovery session is a workshop during which a cross-functional team collaborates with representative(s) of the client organisation to understand the problem, brainstorm solutions and create designs. Key roles involved in the Discovery session: - Business Strategist, whose role is to facilitate the workshop; - Front-end developer, whose role is to advise workshop participants on which
design ideas are feasible and which ones are infeasible, based on front end technology constraints;
- Middleware and back end developer, whose role is to advise workshop participants on which design ideas are feasible and which ones are infeasible, based on back end and middleware technology constraints;
- UX/UI Designer, whose role is to lead the ideation and sketching of potential design ideas,
- Representative(s) of the client organisation, whose role is to describe the problem and decide which solution will best solve the business problem.
Representatives of the client organisation are usually a manager from the business unit paying for the software and other individuals they may choose to accompany them to the Discovery session. The output of this step is a documented problem statement.
Problem statement
2 Create personas
During a Discovery session, personas are developed by eliciting from the client representative(s) who the typical users of a proposed website or custom software are. This is followed by the creation of the personas, with inputs from the representative(s). In cases where the representative(s) does not know the potential users of a proposed application, the Design team will make assumptions about the
Personas
©© UUnniivveerrssiittyy ooff PPrreettoorriiaa

52
potential users in order to create user profiles and personas. These assumptions are validated later in the UX design process through usability testing and confirmation from the client organisation’s representative(s). In cases where a similar application has been developed in the past, the Design team reuses and adjusts existing personas. While defining personas, the Design team also identifies other human user types such as System Administrators and non-human ‘users’ such as web analytics software. These other user types are treated as personas when user journeys are mapped. The output of this step is a set of personas.
3 Document user journey
During the third step, the team maps each user’s journey during the Discovery session, with the different journeys displayed parallel to each other. Two types of user journeys are created. An ‘As-is’ user journey enables the team to understand the status quo, while a ‘To-be’ user journey documents the future journey users will experience. This process culminates in the development of the ‘To-be’ user journeys, which are mapped collaboratively using a brainstorming approach.
To-be user journeys
4 Design low-fidelity prototype
During the fourth step, the team develops the information architecture and a low-fidelity prototype. The prototype is grey (no saturated colours) to ensure that stakeholders’ reviews focus more on the user navigation rather than the content. Low-fidelity prototype is typically the last output from Discovery sessions.
Low-fidelity prototype
5 Conduct usability testing
In this step, the low-fidelity prototype is tested by individuals that are not part of the project team and may or may not fit the description of users as detailed in the personas. Examples of such individuals are UX designers and software developers that are part of the organisation but working on other projects. The feedback from the testing is used to refine the low-fidelity prototype and then incorporated into the high-fidelity prototype. The output of this step is usability testing results.
Usability testing results
6 Design high-fidelity prototype
This step entails designers adding content to the low-fidelity prototype, followed by feedback from the client organisation’s representative(s). The designers then add colours, interactions and where necessary, animations to the design.
High-fidelity prototype
©© UUnniivveerrssiittyy ooff PPrreettoorriiaa

53
Depending on a client’s requirements, the design team either creates a video with a recording of the high-fidelity prototype and how to navigate it, or a link to the high-fidelity prototype. In cases where the design team send the client representative(s) a link to the prototype, the client representative(s) navigate through the prototype to check whether their expectations are met.
7 Develop Features and Functions specification
In this step, the design team documents user stories, details about each web page, the functionality it offers and the user flow on the page, all in the Features and Functions specification. The output of this step is a set of user stories in the Features and Functions specification.
User Stories
8 Develop software
This step involves the software developers building the database, middleware and web pages based on the outputs of the previous steps. The output of this step is functioning software.
Functioning software
9 Track web analytics
After deployment of the website or custom software, the design team tracks data analytics and uses the statistics as an input for making decisions for future design changes.
Web analytic results
©© UUnniivveerrssiittyy ooff PPrreettoorriiaa

54
4.3.2. Reducing the total duration of the UX design process
The interview participants from Case Study A considered their organisation’s UX
design process as having a fast turnaround time, thus not requiring any optimisation
to make the process faster.
On average, a website typically takes the organisation one to two weeks to complete
the UX design, with more complex software taking up to a month and simpler software
taking as few as two days to complete. The organisation credits two key factors as the
catalysts for the fast turnaround times.
The first contributing factor to a fast turnaround time is the continuous improvement of
the UX design process over time. From the organisation’s inception in 2003, the
process has undergone numerous refinements. At the time I conducted interviews in
November 2019, the UX design process was a combination of practices drawn from
the Design Thinking, Agile UX and Atomic Design approaches. Redundant steps have
been removed from the process and each step in the process has been optimised to
ensure a fast turnaround time without compromising the rigour of the design process.
The other contributing factor is the availability of a Design system, a library of reusable
GUI components that the design team could draw from. This saves time as there is no
need to reinvent the wheel. For instance, the team has on occasion completed the UX
design process from problem definition to a clickable prototype in two days. For one
of the designs that took two days to complete, the interviewee attributed the fast
turnaround time to the low complexity of the design problem and the existence of a
vast library of reusable GUI components, which the design team could draw from.
Participants from Case Study A identified one key improvement that needed to be
made to their UX design process. The organisation’s process did not involve end
©© UUnniivveerrssiittyy ooff PPrreettoorriiaa

55
users. In the absence of end users, the organisation applied a pragmatic approach by
involving individuals that were not part of the project team but probably fitted the
description of users as detailed in the personas. This practice could possibly distort
the accuracy of the personas and skew the results of the usability testing. To address
this issue, the organisation plans to persuade client organisations to provide the
necessary funding to recruit end users to participate in user research and usability
testing.
4.3.3. ROI measurement
At the time that the interviews were conducted in November 2019, Case Study A did
not incorporate the measurement of ROI in UX processes. The organisation’s
engagements with clients end upon successful delivery of an application. Thereafter,
clients do not share any data with the case study organisation to enable the calculation
of the ROI in UX.
4.4. Case Study B
Case Study B was a management consulting organisation headquartered in
Johannesburg, with offices in Cape Town, the United States of America and Australia.
The organisation provides software development and management consulting
services to organisations in a variety of industries. The organisation was formed in
1998 and the South African office currently employs 500 people, 30 of which make up
the Design competency. This section contains a summary of the UX design process
followed by Case Study B, the opportunities for optimisation of their process and how
ROI in the incorporation of UX is measured in the organisation.
©© UUnniivveerrssiittyy ooff PPrreettoorriiaa

56
I interviewed nine individuals from the organisation, whose titles included Lead UX
Designer, User Interface (UI) Designer, UX Researcher, Lead Business Analyst and
Lead Engineer.
4.4.1. UX Design process: Case Study B
Figure 4.3 depicts the key steps followed by the organisation to complete UX design
and Table 4.2 contains a narrative for each step.
©© UUnniivveerrssiittyy ooff PPrreettoorriiaa

57
Figure 4.3: UX design process for Case Study B
©© UUnniivveerrssiittyy ooff PPrreettoorriiaa

58
Table 4.2: Description of each step of Case Study B's UX design process
Step No.
Step name Step description Step output
1 Define problem statement
During the first step of the design process, the Design Lead facilitates a workshop to understand the business problem. The typical workshop attendees are representatives of the client organisation from different business units, including: - Representatives of the different market segments, who understand each
group of end users; - Representatives of the business unit that manages the services offered on
the software. An example from a banking client organisation is a representative from the business unit responsible for originating loans or savings accounts,
- Representatives of Operations business units including IT, Sales and Customer support.
In cases where the client organisation has an existing application, the Designers conduct a heuristic evaluation of the application. Improvement opportunities are identified from the heuristic evaluation and shared with the client organisation. Statistics from Web Analytics from the existing solution are analysed and used to enhance the problem statement. The output of this step is a problem statement.
Problem statement
2 Conduct research
In this step, the UX Designers conduct a competitor analysis with input from the same group of stakeholders involved in the problem definition. They also conduct desktop research and interviews with competitor clients recruited through an agency, to collect as much information as possible about competitor solutions. They also conduct user research, interviewing representatives of end users to gain insights into the individuals for whom the software is going to be designed. The outputs of this step are a competitor analysis report and personas.
- Competitor analysis report
- Personas
©© UUnniivveerrssiittyy ooff PPrreettoorriiaa

59
3 Map user journey
In this step, the Lead Designer facilitates a brainstorming session to identify potential user journeys. After consensus is reached on a final user journey, the concept is tested with a selection of end users recruited through an agency. The output of this step is the ‘To-be’ user journey.
‘To-be’ user journey
4 Conduct concept testing
In this step, the UX Designers validate their solution ideas. The objectives of the concept testing are two-fold. One to validate whether the proposed software would appeal to the target users and identify improvements to the user journey. The output of this step is a concept testing report.
Concept testing report
5 Design low-fidelity prototype
In this step, the UX Designers develop a low-fidelity prototype. In some cases, the UX Designers develop paper prototypes. In other cases, they design the low-fidelity prototype using prototyping software. The choice of paper or software depends on the Designer’s preference. The output of this step is a low-fidelity prototype.
Low fidelity prototype
6 Usability testing
Whether a paper or black-and-white digital prototype is developed, it is tested with end users. In cases where a sufficient budget is allocated to the project, usability testing participants are individuals that are recruited through an agency. Where budget allocation is low, the UX Designers conduct usability testing with individuals within the client organisation that are not part of the project team and that may not align to the persona. The output of this step is a report detailing the usability testing results.
Usability testing results
7 Develop high-fidelity prototype
In this step, a UI Designer develops a high-fidelity, clickable prototype which acts as the standard upon which the rest of the software’s functionality is based. The high-fidelity prototype is not a complete software product but a combination of high-priority functionality, only considering happy path scenarios. Happy path scenarios are the actions users would take in a situation in which there are no errors or exceptions to the functionality being tested. The output of this step is a high-fidelity prototype.
High-fidelity prototype
8 Build, Test, Fix In this step, a cross-functional team selects a portion of functionality and analyses, designs and develops it. The organisation follows the Scrum methodology, using 2-week sprints. There are two types of sprints, one focused on design and the other focused on developing, testing and deploying software. Each piece of functionality goes through a Design sprint followed by a
Working software
©© UUnniivveerrssiittyy ooff PPrreettoorriiaa

60
Development sprint with the former happening one or two sprints ahead of the latter. Each cross-functional team comprises one or more Business Analysts, UX Designers, UI Designers, Software Developers and Software testers working closely with a Product Owner and Scrum Master. The size of each team is dependent on the size and complexity of the functionality to be developed, with bigger and more complex features requiring bigger teams. The output of this step is software that works.
©© UUnniivveerrssiittyy ooff PPrreettoorriiaa

61
4.4.2. Alignment to UX design approaches
Whenever a new UX design approach is published, the manager of the UX design
competency requests two to five UX designers to conduct research on it and share
knowledge about it with the rest of the team of designers. This allows the UX designers
to keep abreast of new developments in the field of UX design.
Although the interview participants from Case Study B were not of the view that their
organisation strictly followed a UX design process, a clear pattern of UX design steps
that were typically followed in the organisation emerged from the interview data. I
referred to these commonly followed steps as the organisation’s UX design process.
The UX design process followed in the organisation, illustrated in Figure 4.3, was
derived from the Google design sprint, Lean UX, Agile UX and Design thinking
approaches.
In cases where a client organisation had a formal UX design process, the designers
in Case Study B would tailor the process that they typically followed to suit their client
organisation’s requirements. In cases where a client organisation did not have an
existing UX design process, the UX design professionals would then follow the
process illustrated in Figure 4.3 as an unwritten rule.
One of the key principles that UX design professionals in the organisation adhered to
was continuous improvement of their UX design knowledge and practices. The
interviewees displayed a sense of pride in their propensity to experiment with new UX
Design approaches. Interviewees were of the view that not being afraid to experiment
had served their organisation well through improvements in their UX design practices
over time. An evidence of this improvement was that when the organisation first
adopted Agile UX, they used to work in two-week sprints which incorporated design
©© UUnniivveerrssiittyy ooff PPrreettoorriiaa

62
and software development. Over months, the designers found that two-week sprints
tended to be a bottleneck for the developers because their work required iteration and
creativity. To resolve this issue, the sprints were split into a Design sprint and a
Development sprint, with the Design working a sprint or two ahead of the Development
sprint. This and many other improvements over the years have resulted in
improvements in the organisation’s UX design process.
4.4.3. Reducing the total duration of the UX design process
As stated in section 4.4.2, Case Study B organisation did not have a formal UX design
process. The absence of a formally documented UX design process led to a diversity
of views regarding how to reduce the overall duration of UX design activities. Two
participants from the organisation indicated that they were able to reduce the total
duration of the UX design process by eliminating steps that the designers considered
optional, such as developing a high-fidelity prototype. For example, the participants
would only create high-fidelity prototypes in the ‘first few’ sprints when a cross-
functional team starts working together. Once a project team reaches a high level of
‘maturity’ and has worked together ‘long enough,’ the team as a collective would
decide when it would be appropriate to stop developing high-fidelity prototypes. This
recommendation is predicated on the notion that software developers only need the
level of detail found in high-fidelity prototypes in the initial stages of development in
order to understand the design standards. In this line of reasoning, the software
developers would no longer need such detail once they become accustomed to the
organisation’s design standards.
Another method that the organisation uses to shorten the duration of the UX design
process is to reduce the amount of time spent on usability testing. According to study
participants this is achieved by limiting the number of usability test participants to three
©© UUnniivveerrssiittyy ooff PPrreettoorriiaa

63
rather than the standard minimum of six. Another approach is elimination of the time
spent on recruiting end users from outside the organisation by an external agency, in
cases where target users are external to the client organisation. Rather than relying
on external agencies, UX designers would involve end users that are employees of
the client organisation, that closely match the target users’ description as detailed in
the personas. To mitigate the risk of skewing usability test results, a screening process
needs to be applied within the organisation to identify users that closely match the
personas.
Study participants also indicated that activities that can be conducted in parallel are
identified and carried out in parallel. This approach enables them to reduce the total
duration of the UX design process.
The last method that the organisation uses to shorten the duration of the UX design
process is to implement a division of labour by allocating specific activities in the UX
design process to specialised UX professionals. This replaces the ‘Jack of all trades’
UX professional with distinct roles such as UX Researcher, UX Designer, UX
Copywriter and UI Designer. Such specialisation facilitates the completion of tasks in
parallel, which shortens the overall duration of the UX design process. This is yet
another way the organisation has reduced the overall duration of the UX design
process.
4.4.4. ROI measurement
The interview participants from Case Study B identified ways to measure ROI in UX.
One metric that the study participants have used is the improvement in the Net
Promoter Score, a measure of the likelihood of clients of Case Study B recommending
their services to other potential clients. The NPS is calculated by an independent
organisation and published annually. The UX designers compared the Net Promoter
©© UUnniivveerrssiittyy ooff PPrreettoorriiaa

64
Score before and after a design was implemented to establish whether the design led
to an improvement in customer loyalty and brand image.
Another measure is the reduction in the number of drop-offs after a new design was
implemented. The UX designers would compare the drop-offs before and after a
redesign to establish whether the design resulted in an improvement in usability.
Another measure is a calculation of the percentage increase in sales that result from
the new design.
Lastly, ROI is measured by calculating the amount of money saved from the rejection
of ideas that failed concept testing.
4.5. Case Study C
Case study C is a financial services organisation that has been in existence for a
century. The organisation is headquartered in Johannesburg and has offices and
branches in all the nine provinces of South Africa. It also has offices and branches in
15 countries across Africa, Asia and Europe. The organisation has 140 UX design
professionals working on both customer-facing and internal applications. This section
describes the UX design process followed by Case Study C, the opportunities for
optimisation of their processes and how ROI in the incorporation of UX is measured in
the organisation.
I interviewed 17 individuals from the organisation. The titles of the interviewees
included Creative Director, Lead UX Designer, UX Designer, User Interface (UI)
Designer, UX Researcher, Lead Business Analyst, Product Owner, Customer
Experience (CX) Specialist and Service Design Lead.
©© UUnniivveerrssiittyy ooff PPrreettoorriiaa

65
4.5.1. UX Design process: Case Study C
Case Study C followed two UX design processes. The first process contains a
comprehensive set of UX design steps that are mandated for all newly formed project
teams. The second UX design process is shorter than the first process and can only
be followed once a project team has completed at least one software release. Figure
4.4 depicts the key steps followed by the organisation to complete UX design for new
projects and Table 4.3 contains a narrative for each step. Figure 4.5 depicts the steps
followed in the shortened UX design process and Table 4.4 contains a narrative for
each step of the shortened process.
©© UUnniivveerrssiittyy ooff PPrreettoorriiaa

66
Figure 4.4: UX design process for Case Study C
©© UUnniivveerrssiittyy ooff PPrreettoorriiaa

67
Table 4.3: Description of each step of Case Study C's UX design process
Phase Step No.
Step name Step description Step output
Discover 1 Define problem statement
Within Case Study C, representatives of the business unit requesting the application define a problem statement before a systems development project is initiated. Once a project is initiated, the Business Analyst meets with the business unit’s representatives to understand the problem statement and where necessary, refine it. A problem statement is refined in cases where the Business Analyst perceives it to be unclear or requiring elaboration. The output of this step is a problem statement.
Problem statement
Discover 2 Define as-is state
In the second step the UX Researcher, Customer Experience Specialist and UX Designer conduct a workshop to understand the existing customer journey. They include representatives of the business unit responsible for onboarding new customers and the business unit responsible for customer retention. The output of this step is an ‘As-is’ journey map.
‘As-is’ journey map
Discover 3 Conduct research
In the third step, The UX Researcher conducts research to verify the accuracy of the problem statement. This investigation comprises interviews with end users and desktop research. Upon completion of the investigation, the UX Researcher identifies key themes and presents recommendations to a decision-making committee, regarding whether to proceed with the project. The benefit of such research is the provision of a fact-based recommendation of whether an idea is likely to succeed or fail. The organisation also saves money by not pursuing ideas that are not likely to be profitable. The output of this step is a research report.
Research report
Discover 4 Conduct competitor analysis
In this step, the UX Researcher and UX Designer review solutions that were implemented by competitor organisations for solving similar problems. Competitor analysis is typically conducted through desktop
Competitor analysis report
©© UUnniivveerrssiittyy ooff PPrreettoorriiaa

68
research and other creative ways of collecting data. An example of a creative method for collecting data for competitor analysis was given by one of the interview participants. On a project whose objective was to build a mobile application, she enrolled herself as a client of four of Case Study C’s main competitors and accessed their respective mobile applications. Accessing the competitors’ mobile applications enabled her to conduct a competitor review based on her first-hand experience using each competitor’s mobile application. The output of this step is a competitor analysis report.
Describe 5 Consolidate customer insights into persona
In this step, the UX Researcher elicits characteristics of target user groups by conducting interviews with a sample of end users recruited through an agency. The UX Researcher creates personas by identifying themes from interview data related to characteristics such as typical daily routines, age range and needs of each target user group. To save time, UX Researchers from Case Study C reuse personas that were created on other projects provided they are at most, six months old. The output of this step is a set of personas.
Persona
Describe 6 Ideate potential solutions
In this step, the UX Designer facilitates a workshop to brainstorm potential solutions, using the existing customer journey and completed research as inputs. In the brainstorming workshop, the UX Designer, Business Analyst, UX Researcher and Development Team Lead sketch potential solutions and narrow them down to one or two solutions they identify as most likely to solve the problem. The output of this step is a set of concept sketches.
Concept sketches
Describe 7 Develop low-fidelity prototype
In this step, the UX Designer facilitates a brainstorming workshop including representatives of various business units, the Business Analyst and Development Team Lead. In this workshop, they create a low-fidelity prototype on paper or on whiteboards. In some cases, the Ideation workshop (step 6) results in the creation of a low-fidelity prototype, hence combining steps 6 and 7. The output of this step the low-fidelity prototype.
Low-fidelity prototype
©© UUnniivveerrssiittyy ooff PPrreettoorriiaa

69
Define 8 Conduct concept testing
In this step, the UX Researcher tests the low-fidelity prototypes with end users to identify flaws with the conceptual design. UX Researchers can conduct concept testing using paper prototypes, sketches on a whiteboard, sketches on a digital application, or through interviews with end users. The output of this step is a concept testing report.
Concept testing report
Define 9 Create target customer journey map
In this step, the UX Researcher, Customer Experience Specialist and UX Designer collaborate in a brainstorming workshop, to define the desired customer journey. The output of this step is a ‘To-be’ user journey map.
‘To-be’ journey map
Define 10 Develop service blueprint
In this step, the Service Designer facilitates a workshop with representatives of business units that are responsible for back office operations that would support the ‘To-be’ user journey. During the workshop, the Service Designer presents the ‘To-be’ user journey, then documents the back-office processes that support the user journey, based on input from the workshop attendees. A service blueprint displays the back-office operations for each step of a user journey map. The output of this step is a ‘To-be’ service blueprint.
‘To-be’ service blueprint
Define 11 Document user stories
In this step, the Business Analyst documents user stories using the low-fidelity prototype and user journey map as inputs. The Business Analyst also documents requirements identifying the data that will be analysed and tracked after the project, for each feature. To confirm the accuracy of the user stories, the Business Analyst facilitates review meetings with the Product Owner and representatives of the business unit requesting the features. The output of this step is the user stories.
User stories
Define 12 Develop happy flow prototype
In this step, the UX designer develops a prototype with only the ideal flow, without catering for cases where the process does not operate as planned. ‘Negative’ flows are developed together with the high-fidelity prototype (step 15). To save time, happy flows are sometimes developed as early as during the Discover phase during ideation of potential solutions (step 6) and refined as the process progresses.
Happy flow prototype
©© UUnniivveerrssiittyy ooff PPrreettoorriiaa

70
The output of this step is a happy flow prototype.
Define 13 Test happy flows with users
In this step, the UX Researcher conducts usability testing for the happy flow prototype, with end users recruited through an agency. The insights from the usability testing are incorporated into the next iteration of design. In cases where happy flows are ready by the time concept testing is conducted, they are tested for usability at that stage. The output of this step is a usability testing report.
Usability testing report
Deliver 14 Create and deliver UX
In this step, the prototype is refined based on the results of usability testing. In cases where the UX Designer had created a paper prototype, they create a digital version of the prototype and store it on the enterprise design software during this step. The output of this step is the refined low-fidelity prototype.
Refined low-fidelity prototype.
Deliver 15 Create and deliver UI
In this step, the UI Designer adds more detail to the low-fidelity prototype by applying the organisation’s design standards on screen elements such as colour schemes, button sizes and font sizes. The UI Designer also refines the text on labels and other objects on each page, to align with the organisation’s standards. The output of this step is a high-fidelity prototype.
High-fidelity prototype
Deliver 16 Check UX writing
In this step, a Copywriter reviews the text on the high-fidelity prototype and applies changes to align it to the organisation’s standards. The output of this step is a refined high-fidelity prototype.
Refined high-fidelity prototype
Deliver 17 Usability testing
In this step, the UX Researcher conducts usability testing on the high-fidelity prototype with end users recruited through an agency. The Design team has an option to omit this step from the UX design process, as they would have tested low-fidelity prototypes when they tested happy flows. The output of this step is a usability testing report.
Usability testing report
Deliver 18 Add to Design tool
In this step, the UI Designer moves the high-fidelity prototype to a system that is accessed by software developers. The software developers use the high-fidelity prototype to build the software. The output of this step is a high-fidelity prototype that is ready for software developers to use as a reference point for developing the UI.
Ready-for-development prototype
©© UUnniivveerrssiittyy ooff PPrreettoorriiaa

71
Deliver 19 Define product metrics
In this step, the Product Owner facilitates a process to establish the metrics by which the software is measured once its implementation is completed. The Product Owner elicits the metrics from representatives of the business unit that requested the software. The output of this step is a set of Key Performance Indicators (KPI).
Key Performance Indicators
Disrupt 20 Build, Test, Fix In this step, the software is developed, tested for accuracy, then refined. Case Study C follows the Scrum methodology for building software. The organisation defines two types of sprints, namely a Design sprint and a Development sprint. The Design sprint is a 2-week sprint during which Business Analysts refine user stories and UX Designers create and refine prototypes. Once the design of a particular feature is complete, the functionality is developed and tested in the Development sprint. The output of this step is functioning software.
Functioning software
Disrupt 21 Conduct testing
In this step, the UX Designers and UX Researchers test the system for design defects by recruiting end users through an agency and asking them to perform tasks on the software. This step is optional, so it is performed on some projects and omitted on others. The output of this step is a Usability testing report.
Usability testing report
Disrupt 22 Assess metrics
In this step, the performance of the software is evaluated against the established KPIs. If performance is not in line with expectations, a root-cause analysis is conducted by the Product Owner and remedial action taken. In cases where design flaws are seen to be the root case, a new project is initiated to address them. The output of this step is a performance assessment report.
Performance assessment report
©© UUnniivveerrssiittyy ooff PPrreettoorriiaa

72
Figure 4.5: Shortened UX design process for Case Study C
©© UUnniivveerrssiittyy ooff PPrreettoorriiaa
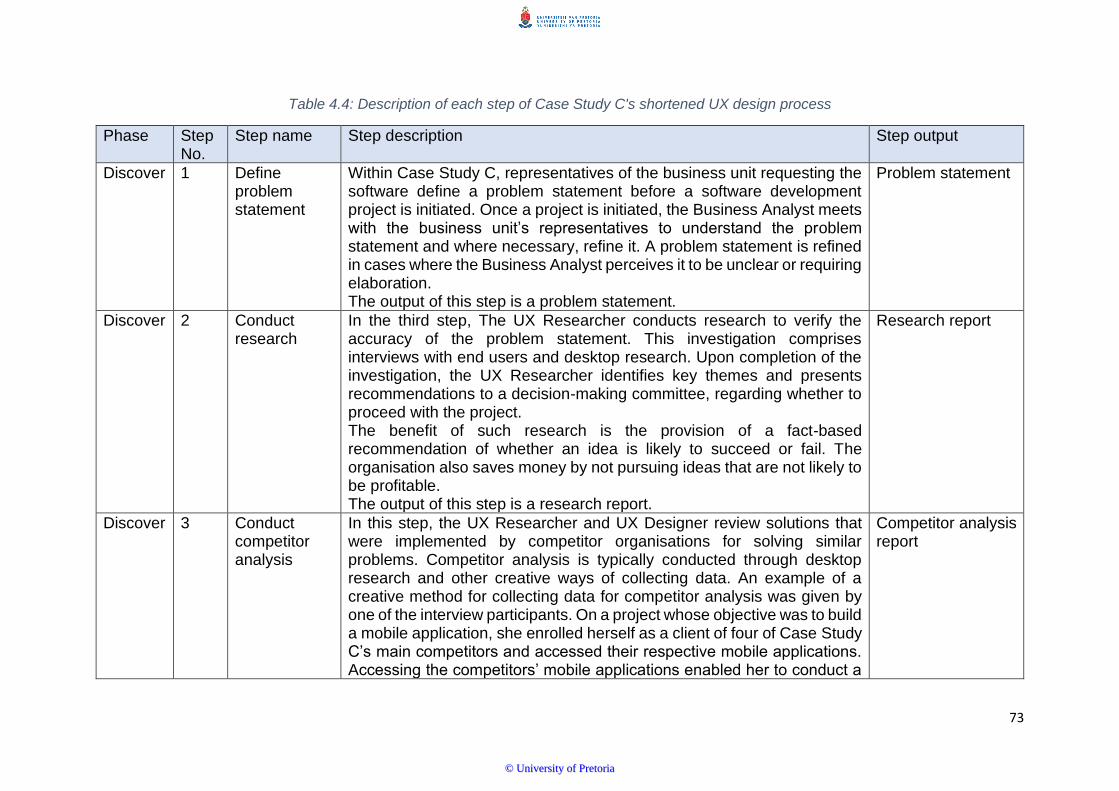
73
Table 4.4: Description of each step of Case Study C's shortened UX design process
Phase Step No.
Step name Step description Step output
Discover 1 Define problem statement
Within Case Study C, representatives of the business unit requesting the software define a problem statement before a software development project is initiated. Once a project is initiated, the Business Analyst meets with the business unit’s representatives to understand the problem statement and where necessary, refine it. A problem statement is refined in cases where the Business Analyst perceives it to be unclear or requiring elaboration. The output of this step is a problem statement.
Problem statement
Discover 2 Conduct research
In the third step, The UX Researcher conducts research to verify the accuracy of the problem statement. This investigation comprises interviews with end users and desktop research. Upon completion of the investigation, the UX Researcher identifies key themes and presents recommendations to a decision-making committee, regarding whether to proceed with the project. The benefit of such research is the provision of a fact-based recommendation of whether an idea is likely to succeed or fail. The organisation also saves money by not pursuing ideas that are not likely to be profitable. The output of this step is a research report.
Research report
Discover 3 Conduct competitor analysis
In this step, the UX Researcher and UX Designer review solutions that were implemented by competitor organisations for solving similar problems. Competitor analysis is typically conducted through desktop research and other creative ways of collecting data. An example of a creative method for collecting data for competitor analysis was given by one of the interview participants. On a project whose objective was to build a mobile application, she enrolled herself as a client of four of Case Study C’s main competitors and accessed their respective mobile applications. Accessing the competitors’ mobile applications enabled her to conduct a
Competitor analysis report
©© UUnniivveerrssiittyy ooff PPrreettoorriiaa

74
competitor review based on her first-hand experience using each competitor’s mobile application. The output of this step is a competitor analysis report.
Describe 4 Consolidate customer insights into persona
In this step, UX Researcher elicits characteristics of target user groups by conducting interviews with a sample of end users recruited through an agency. The UX Researcher creates personas by identifying themes from interview data related to characteristics such as typical daily routines, age range and needs of each target user group. To save time, UX Researchers from Case Study C reuse personas that were created on other projects provided they are at most, six months old. The output of this step is a set of personas.
Persona
Describe 5 Ideate potential solutions
In this step, the UX Designer facilitates a workshop to brainstorm potential solutions, using the existing customer journey and completed research as inputs. In the brainstorming workshop, the UX Designer, Business Analyst, UX Researcher and Development Team Lead sketch potential solutions and narrow them down to one or two solutions they identify as most likely to solve the problem. The output of this step is a set of concept sketches.
Concept sketches
Describe 6 Develop low-fidelity prototypes
In this step, the team develops the low-fidelity prototype, which are grey (no saturated colours) to ensure that stakeholders’ reviews focus more on the user navigation rather than the content. The output of this step is a low-fidelity prototype.
Low-fidelity prototype
Define 7 Conduct concept testing
In this step, the UX Researcher tests the low-fidelity prototypes with end users to identify flaws with the conceptual design. UX Researchers can conduct concept testing using paper prototypes, sketches on a whiteboard, sketches on a digital application, or through interviews with end users. The output of this step is a concept testing report.
Concept testing report
©© UUnniivveerrssiittyy ooff PPrreettoorriiaa

75
4.5.2. Alignment to UX design approaches
Case Study C followed the four phases of the Double Diamond approach, with an
additional phase they tailored in, namely, Disrupt. The Disrupt phase was added to
reflect the organisation’s strategic intent, which was to be a market leader in their
industry.
The organisation’s UX design process also incorporated the Lean UX principle of rapid
paper prototyping to save time. While most UX Designers in this organisation
conducted rapid paper prototyping, not all of them followed this principle because, in
some cases, their respective project sponsors only signed off on prototypes
documented on prototyping software because, in their view, it looked more
‘professional.’ Whenever this happened, it constrained the UX Designers by forcing
them to use software for their prototyping.
Another reason why rapid paper prototyping was not always followed was that
preferences varied from one designer to another. Some UX Designers from Case
Study C preferred drawing their prototypes on top of their desks as it was common
practice within the organisation, while others used whiteboards and others strictly used
prototyping software. Although the Lean UX principles were predominantly followed in
the case study organisation, there were no restrictions on how prototyping is
conducted.
Lastly, the organisation applied the Agile UX principle of splitting sprints into a Design
sprint and a Development sprint, with the former happening ahead of the latter. As an
organisation standard, each of the sprints were two weeks long. In some cases, the
Design sprint happened one sprint ahead of the Development sprint and in other cases
©© UUnniivveerrssiittyy ooff PPrreettoorriiaa

76
two or in rare cases, three sprints ahead. Each project team tailored the process to
suit their project’s requirements.
©© UUnniivveerrssiittyy ooff PPrreettoorriiaa
77
4.5.3. Reducing the total duration of the UX design process
In the two years before I conducted the interviews in November 2019, some measures
were implemented within Case Study C organisation to reduce the duration of the UX
design process.
The first measure was the implementation of a design system, a central repository of
reusable components that UX and UI Designers used to define high-fidelity prototypes.
When high-fidelity prototypes were completed on the design system, they matched
exactly how the final solution would look. The design system saved time in two ways.
Firstly, the clarity that software developers achieved from a design that represented
the final output eliminated most, if not all the need to ask the UI Designer questions
about interface elements like fonts and button sizes. Secondly, the number of errors
made by designers was reduced since the design system restricted them to objects
that were aligned to the organisation’s design standard.
A second measure that was implemented was the splitting of sprints into a Design
sprint and a Development sprint. When the organisation adopted the Agile UX
approach, the software development project teams would attempt to complete UX
design in the same sprint as the software development. In that setup, UX Design was
seen as a bottleneck because design work often required more time than anticipated,
which led to the missing of deadlines. The process was changed to one where UX
Design was conducted in one sprint and software development in its own sprint. This
new process led to a more efficient process because Design teams now had sufficient
time to deliver their outputs two or four weeks ahead of software developers.
Another measure implemented by the organisation was to reduce the number of steps
that design teams followed after implementing the Minimum Viable Product (MVP), in
©© UUnniivveerrssiittyy ooff PPrreettoorriiaa

78
line with Lean UX principles. This measure was formalised through the shortened UX
design process.
Usability testing was identified by interview participants as an important part of the UX
Design process that should not be removed under any circumstance. Case Study C
used two ways to reduce the amount of time taken to conduct usability testing. Firstly,
the UX Researchers conducted testing using only five participants, which was the bare
minimum group of users that would yield accurate results (Nielsen & Landauer, 1993).
The other measure was to conduct usability testing with proxy users, who are users
that were not recruited through an agency. An example of this is in a case where a
project did not have adequate budget allocation for usability testing. The UX
Researcher and UX Designers would test the design using family members or relatives
as participants whose profiles matched those of the system being developed.
Lastly the UX Design process allowed team members to tailor the process to what was
suitable for the software under development. Examples of tailoring that reduced the
overall duration of the UX Design process were the removal of optional steps and
working on some design activities concurrently.
The interviewees from the Case Study C organisation identified two measures that
could further reduce the overall duration of the UX design process in their organisation.
The first measure would be to conduct only one usability test instead of conducting
multiple iterations. The usability test would be done using low-fidelity prototypes and
the findings of the usability testing report would then be incorporated into the design
of high-fidelity prototypes.
The second suggestion would be to include UX Designers in meetings where Business
Analysts elicited requirements from representatives of the business unit that requested
©© UUnniivveerrssiittyy ooff PPrreettoorriiaa

79
the software. Including UX Designers in the requirements elicitation would enable
them to start prototyping earlier in the process, rather than waiting for user stories to
be completed by Business Analysts. Close collaboration between the Business
Analysts and User Experience Designers would result in earlier delivery of high-fidelity
prototypes. However, the interviewees were of the view that this suggestion could be
difficult to implement since UX Designers often worked on multiple projects. This could
limit their capacity to be involved in requirements elicitation. This meant the
organisation may need to rethink the way they allocated UX Designers to projects, to
enable them to work on fewer projects.
4.5.4. ROI measurement
At the time of conducting the interviews, ROI in UX practices was not being measured
in Case Study C organisation. Business cases were typically developed for each
project and ROI was calculated per project, without allocating returns to a specific
discipline within the project team. One metric the organisation tracked was the Net
Promotor Score.
The interview participants identified ways that ROI in UX processes could be
measured. Reduction in the number of drop-offs after a new design had been
implemented and the percentage increase in sales were identified useful measures.
4.6. Case Study D
Case Study D was a management consulting organisation with an office in
Johannesburg. The organisation provided management consulting services for
organisations in the South African financial services industry. The organisation
employed 120 people, 80 of whom made up the Design competency. This section
describes the UX design process followed by Case Study D, the opportunities for
©© UUnniivveerrssiittyy ooff PPrreettoorriiaa

80
optimisation of their processes and how ROI in the incorporation of UX was measured
in the organisation.
4.6.1. UX design process: Case Study D
Case Study D organisation did not have a formally documented UX design process
but trained each newly hired UX design professional on the methods they followed.
From the interview data, a clear pattern of UX design process steps emerged, which I
refer to as the organisation’s process. Figure 4.6 depicts the key steps followed by the
organisation to complete UX design and Table 4.5 contains a narrative for each step.
©© UUnniivveerrssiittyy ooff PPrreettoorriiaa

81
Figure 4.6: UX design process for Case Study D
©© UUnniivveerrssiittyy ooff PPrreettoorriiaa

82
Table 4.5: Description of each step of Case Study D's UX design process
Step No.
Step name Step description Step output
1 Define problem statement
In the first step, a Business Analyst and UX Designer facilitate workshops with representatives(s) of a client organisation to define the problem statement. Representatives of the client organisation are usually managers from the business unit(s) paying for the project and the business unit(s) that have understands the end users. The output of this step is a problem statement.
Problem statement
2 Create Personas
In this step, the UX Designer makes assumptions about the users and creates personas based on those assumptions. The UX Designer validates the assumptions with representatives of the client organisation that understand the users. The output of this step is a set of proto personas.
Proto persona
3 Conduct research
In this step, the UX Designer conducts a contextual inquiry to understand the existing solution and how it is used. As part of research, the UX Designer also conducts a heuristic evaluation to identify potential issues with the existing application, if one exists. In cases where a sufficient budget is allocated to the project, the UX Designer conducts interviews with end users to understand the user characteristics. The information from these interviews is an input into confirming and refining the personas. The UX Designer also conducts a competitor analysis, from which they develop an understanding of existing solutions from local and international competitors. The insights from the competitor analysis are an input to the ideation of potential solutions. The UX Designer also investigates trends for solving specific design-related problems by accessing websites such as www.dribbble.com, www.material.angular.io and www.behance.net. The outputs of this step are a competitor analysis report, a heuristic evaluation report and updated personas.
Competitor analysis report Heuristic evaluation report Updated personas
4 Document user journey
In this step, the UX Designer documents current and future user journeys during a collaborative workshop derived from the Google Design Sprint. The UX Designer
‘As-is’ user journey map
©© UUnniivveerrssiittyy ooff PPrreettoorriiaa

83
facilitates the workshop and includes the Business Analyst, Project Owner, Development Lead, representatives of the business unit that understand the products and representatives of the business unit that understand the users. The outputs of this step are the ‘As-is’ and ‘To-be’ user journey maps.
‘To-be’ user journey map
5 Design low-fidelity prototype
In this step, the UX Designer creates a paper prototype, using insights from the research (step 3) and ‘To-be’ user journey map. The output of this step is the low-fidelity prototype.
Low fidelity prototype
6 Conduct usability testing
In this step, the UX Designer conducts usability testing with end users to validate the low-fidelity prototype. Once the usability testing is complete, the UX Designer compiles a report with usability testing results, together with recommendations for improving the design. The output of this step is a usability testing report.
Usability testing report
7 Document user stories
In this step, the Business Analyst documents user stories using the low-fidelity prototype as an input. The Business Analyst confirms the accuracy of the user stories by facilitating a review meeting with the Product Owner and representative(s) of the business unit requesting the features. The output of this step is the user stories.
User stories
8 Design high-fidelity prototype
In this step, the UX Designer enhances the low-fidelity prototype by adding page components, colour schemes and where relevant, animations. Using page components from the client organisation’s design system, the UX Designer develops a high-fidelity, clickable prototype. The output of this step is the high-fidelity prototype.
High-fidelity prototype
9 Build, Test, Fix In this step, the Software Developer develops the functionality, following which the Quality Assurance Analyst tests the integrity of the software and the UI Designer conducts design testing. Design testing is the review of the UI to ensure that it is identical to the high-fidelity prototype. The Software Developer also makes the necessary changes to the software based on the testing conducted by the Quality Assurance Analyst and the design testing conducted by the UI Designer. The output of this step is functioning software.
Functioning software
©© UUnniivveerrssiittyy ooff PPrreettoorriiaa

84
4.6.2. Alignment to UX design approaches
The UX design approaches the organisation followed were the Google design sprint,
Agile UX, Lean UX and Design thinking. The UX Designers also used Web analytics
data to guide the features to develop first in a redesign, with the most frequently used
features being the ones that were prioritised first.
4.6.3. Reducing the total duration of the UX design process
The interviewees from Case Study D organisation identified measures that could
facilitate reduction in the total duration of UX design. To reduce the time taken when
conducting user research, UX Designers from Case Study D would define proto
personas. These were just enough information to understand the target users. In most
cases, proto personas were validated by meeting with representatives of a client
organisation that understood users. In rare cases, UX Designers conducted user
interviews to validate their assumptions. An alternative approach used by one of the
interviewees was the use of demographic data provided by the client organisation, to
understand ‘typical users’, without creating personas.
Another measure taken by the UX Designers was to conduct some activities
concurrently. For instance, one participant stated thus
“If I’m designing a low-complexity functionality, I can already start doing a user
journey as I conduct the research. I’ll give an example of a login. Once I see
how competitors do it, understand the frustrations/pain points users have with
it, I can go ahead and do a user journey for that. For higher complexity features
I could do it differently”.
©© UUnniivveerrssiittyy ooff PPrreettoorriiaa

85
A third way of reducing the overall duration of the UX design process was to shorten
the duration of usability testing. This could be achieved by limiting the number of users
to a maximum of six.
Another time reduction measure was to distinguish between functionality aligned with
personas that required usability testing and functionality that did not require usability
testing. Examples of functionality that required usability testing included features
related to the completion of complex tasks or specialist knowledge. An example of
functionality that did not require usability testing was common software features like
password reset. The complex task would require recruitment of participants through
an agency, whereas the latter could leverage a Friends of the programme group, which
would be a set of volunteers recruited at the beginning of the project to participate in
testing.
One way that the design team used to minimise the likelihood of miscommunication of
project objectives and requirements was the inclusion of the Development Lead in
problem statement definition and requirements elicitation workshops. A benefit of this
approach was that the Development Lead could start ideating and building some of
the simpler features while the Design team was still refining the design. This gave the
Development team time to raise any issues with the feasibility of the solution, rather
than wait until the requirements elicitation was complete.
4.6.4. ROI measurement
Case Study D’s engagements with client organisations ended when software
development was completed. Upon successful delivery of software, client
organisations did not share any data with the organisation to enable the calculation of
©© UUnniivveerrssiittyy ooff PPrreettoorriiaa

86
the ROI in UX. As a result, Case Study D did not calculate ROI in UX. Nevertheless,
interview participants provided suggestions for how ROI in UX could be established.
Study participants suggested measuring reduction in the number of calls to an
organisation’s call centre after an application redesign. This measure was applicable
in situations where, prior to a redesign, call centre data points to usability as being the
root cause of a rise in support-related calls. A reduction in the number of such calls
could translate to cost savings for the organisation and the intangible benefit of
increasing the likelihood of customer retention through a better user experience.
Another measure was the increase in the volume and value of sales emanating from
the design and implementation of new features or the redesign of existing ones.
Closely linked to this measure was the identification of an increase in the number of
sales leads generated as a result of design and implementation of new features or
redesign of existing ones. For these two measures, the interviewees acknowledged
that that ROI was usually established for the entire project, not just the incorporation
of UX design process. To resolve this, one suggestion given by an interviewee was to
ascertain the gain the project as a whole brought to the organisation, then apportion it
to each discipline involved in the project according to the number of hours worked.
4.7. Conclusion
This chapter presented the results of the interviews conducted with 33 participants
from four case study organisations. For each case study organisation, the UX design
process that was followed in the organisation was discussed, together with an
identification of the UX design methods adopted by the organisation. This was followed
by a discussion of how the organisations had reduced the overall duration of their UX
design process. A description of how each organisation established ROI on UX design
©© UUnniivveerrssiittyy ooff PPrreettoorriiaa

87
was also highlighted. In chapter 5, I presented my analyses of the data collected from
the interviews.
©© UUnniivveerrssiittyy ooff PPrreettoorriiaa

88
5. Analysis
Figure 5.1: Outline of chapter 5
©© UUnniivveerrssiittyy ooff PPrreettoorriiaa

89
5.1. Introduction
The objective of this study was to propose a UX design process that could have the
least possible impact on the total duration of project delivery and as a result, increase
the adoption of UX design practices by organisations in South Africa. In section 3.4.2,
I identified three steps as being necessary for achieving the research objective. The
first step, understanding the current UX design processes followed by organisations
in South Africa, is the subject of chapter 4. The second step is to identify ways through
which the UX design process may be accelerated. The third step is to formulate a UX
design process that meets the objective of the study. The focus of this chapter is the
second step. In this chapter, I identified the common themes that emerged from the
interviews and the literature review. The themes identified in this chapter were the
basis upon which the proposed gUXa framework was built.
In section 3.4.5, I described the coding and elaboration process recommended by
Terre Blanche et al. (2006). Figure 5.2 depicts the process of coding and elaboration
that I followed to identify themes from interview data. Upon completing all the
interviews, I listened to all the interview recordings and read the interview transcripts
to familiarise myself with the responses. While listening to the interview recordings and
reviewing the transcripts, I started identifying and documenting responses that I
deemed to be useful for answering the main research question and sub-questions. I
reviewed the interview transcripts multiple times, identifying and documenting the
useful responses until there were no new insights from the interview transcripts. While
deriving insights from the interview recordings and transcripts, I also read extant
literature and documented relevant insights from them.
After deriving insights from interview recordings, transcripts and extant literature, I
grouped similar insights into themes, using a bottom-up analysis approach. Based on
©© UUnniivveerrssiittyy ooff PPrreettoorriiaa

90
the insights from the interview recordings, transcripts and extant literature, I created
the set of themes described in section 5.2, namely UX design practices commonly
implemented, Making the UX design process faster, Getting started with UX and ROI
in UX.
The final themes and sub-themes were the result of the analysis process described in
this section, with gradual refinement. An example of gradual refinement is the process
I followed to derive the theme UX design practices commonly implemented, which was
not part of the first set of themes that I created. The first set of themes that I created
included the two themes Common UX design practices in case study organisations
and Common UX design approaches in case study organisations. After revising the
interview recordings and transcripts multiple times, I decided to create the theme UX
design practices commonly implemented and make it the main theme, reorganising
the two initial themes into sub-themes. I decided to reorganise the themes in this
manner because the themes Common UX design practices in case study
organisations and Common UX design approaches in case study organisations are
closely related, so I saw it fit to categorise them under one main theme.
I followed the same coding and elaboration process for all the data elicited from
interview questions, including the follow-up questions.
©© UUnniivveerrssiittyy ooff PPrreettoorriiaa

91
Figure 5.2: Summary of coding and elaboration process to derive themes
5.2. Themes
In line with the appropriate data collection strategy for this study, I conducted semi-
structured interviews with UX design professionals at four case study organisations.
The interview questions (see Appendix A) were linked to each of the research sub-
questions identified in section 1.3. Through a process of coding, I identified four
themes, namely UX design practices commonly implemented, Making the UX design
process faster, Getting started with UX and ROI in UX. Figure 5.3 depicts the themes
and sub-themes.
©© UUnniivveerrssiittyy ooff PPrreettoorriiaa

92
Figure 5.3: Summary of themes from analyses of interview results
5.2.1. Theme1: UX design practices commonly implemented
This theme is divided into two sub-themes, namely Common UX design practices in
Case Study organisations and Common UX design approaches in Case Study
organisations. The two sub-themes are described in the following sub-sections.
5.2.1.1. Common UX design practices in case study organisations
A theme arising from reviewing case study organisations’ UX design processes is the
set of UX design practices they have in common. Table 5.1 contains a list of all the
practices identified from the interview data and an indication of which organisation
applies a specific practice. Column 1 of Table 5.1 provides the UX design practice,
columns 2 to 5 identify a case study organisation and indicate whether a specific UX
design practice is followed in the organisation (‘Yes’) or not (‘No’). Column 6 provides
my categorisation of the ‘level of importance’ of a specific UX design practice, as
described in the following paragraphs.
©© UUnniivveerrssiittyy ooff PPrreettoorriiaa

93
Table 5.1: Common UX design practices in case study organisations
UX Design Practice Case Study A Case Study B Case Study C Case Study D UX Design Practice Categorisation
Problem statement definition Yes Yes Yes Yes Non-negotiable
User research No Yes Yes No Useful
Persona definition Yes Yes Yes Yes (proto personas)
Non-negotiable
Design research: Competitor Analysis No Yes Yes Yes Important
Heuristic evaluation No Yes No No Unimportant
User journey mapping Yes Yes Yes Yes Non-negotiable
Concept testing No Yes Yes No Useful
Low-fidelity prototyping Yes Yes Yes Yes Non-negotiable
Usability testing Yes Yes Yes Yes Non-negotiable
High-fidelity prototyping Yes Yes Yes Yes Non-negotiable
Web analytics Yes No Yes No Useful
©© UUnniivveerrssiittyy ooff PPrreettoorriiaa

94
To establish a rating of the importance of a particular practice relative to the other
ones, I established four categories. Each category is based on the number of the case
study organisations that have embedded the specific practice in their UX design
process. Practices that are embedded in all four organisations’ UX design processes
are categorised as non-negotiable, whereas if they are implemented by three of the
organisations, they are categorised as important. Where two of the four organisations
have a specific practice embedded in their process, a rating of useful is assigned.
Lastly, practices that are followed by only one organisation are categorised as
unimportant. This categorisation was one of the criteria that informed the proposed
gUXa framework.
5.2.1.2. Common UX design approaches in case study organisations
Each of the case study organisations based their processes on one or more
international UX design approaches. Table 5.2 summarises the popularity of each UX
design approach followed. Column 1 of Table 5.2 provides the UX design approach,
columns 2 to 5 list each case study organisation, with an indication of whether a
specific UX design approach is followed in the organisation (‘Yes’) or not (‘No’).
Column 6 provides my categorisation of the ‘level of popularity’ of a specific UX design
approach.
To establish a rating scale for the popularity of each UX design approach relative to
the other ones, I established four categories. Each category is based on how many of
the case study organisations have adopted the approach in their organisation. UX
design approaches adopted by all four organisations were highly popular, whereas if
they were implemented by three of the organisations, they were popular. Where two
of the four organisations have adopted the approach, a rating of somewhat popular
was assigned. Lastly, UX design approaches adopted by only one organisation were
©© UUnniivveerrssiittyy ooff PPrreettoorriiaa

95
not popular. This categorisation was one of the criteria that informed the proposed
framework.
Table 5.2: Common approaches followed by case study organisations
Approach Case Study A
Case Study B
Case Study C
Case Study D
Application
Atomic Design Yes No No No Not Popular
Design thinking Yes Yes Yes Yes Highly Popular
Agile UX Yes Yes Yes Yes Highly Popular
Lean UX Yes Yes Yes Yes Highly Popular
Google Design Sprint
Yes Yes Yes Yes Highly Popular
Double Diamond
No No Yes No Not Popular
5.2.2. Theme 2: Making the UX design process faster
The second theme identified from the data was the set of measures taken by case
study organisations to reduce the overall time taken to complete the UX design
process. There are two sub-themes, namely alternative approaches to UX design
practices and optimisation of the UX design process. The former sub-theme specifies
ways through which specific UX design practices can be expedited, while the latter
sub-theme specifies ways through which the entire process could be expedited.
5.2.2.1. Alternative approaches to UX design practices
Interview participants specified ways to reduce the duration of completing usability
testing. The first measure was to limit the number of usability test participants to five,
the smallest number that can yield accurate results (Nielsen & Landauer, 1993). This
would shorten the amount of time taken to recruit participants, conduct the usability
tests and compile a usability testing report, than in a scenario wherein more than five
©© UUnniivveerrssiittyy ooff PPrreettoorriiaa

96
participants are recruited. Another method that could speed up the design process
involves the use of end users within the client organisation, that closely match the
personas. This approach can eliminate the time that is spent to recruit end users from
outside the organisation through an agency. To mitigate the risk of skewing usability
test results, a screening process would be applied within the organisation to identify
proxy users that closely match the end users, as defined in the personas.
Another measure was to conduct only one usability test instead of conducting multiple
iterations. The usability test would be done using a low-fidelity prototypes and the
results from the Usability Testing Report incorporated into the design of the high-
fidelity prototype.
Another practice that could reduce the time spent on UX design process was the
development of proto personas in place of personas. The proto personas are based
on assumptions made by the UX design professionals and partly informed by data on
user groups. Design teams from the case study organisations that create personas
would typically conduct user research that will culminate in the development of these
personas. Proto personas speed up persona creation by not relying on user research
that can take months to complete. When creating proto personas, UX designers make
assumptions about the user groups, then validate the assumptions with the business
unit(s) that understand the users and their characteristics.
Lastly, usability testing can be conducted with participants whose characteristics do
not necessarily match those of the personas. From the interview data, this practice
has been applied in cases where no budget has been allocated for usability testing.
While this can be viewed as ‘cutting corners’, interview participants that used this
©© UUnniivveerrssiittyy ooff PPrreettoorriiaa

97
approach to usability testing justified it by highlighting that they preferred usability
testing with any user over no usability testing at all.
5.2.2.2. Optimisation of the UX design process
Interview participants identified measures that could improve the UX design process.
In the context of this study, optimisation of UX design processes refers to any activity
conducted with the objective of reducing the duration of the UX design process without
compromising the quality of design artefacts such as prototypes.
The first approach that could be used to optimise the UX design process is the
implementation of a Design System. Interview participants indicated that the presence
of a repository of reusable GUI components that the Design team can draw from saves
time as there is no need to reinvent the wheel during the definition of high-fidelity
prototypes. Interview participants also highlighted that the presence of a repository of
reusable GUI components reduces the likelihood of design inconsistencies in
considerations such as button sizes and colours.
The splitting of work into a Design sprint and a Development sprint is a measure taken
by all the case study organisations to accelerate the rate of delivery by project teams.
In cases where both UX design and software development are performed in the same
sprint, Design tends to be a bottleneck due to the number of iterations required. All
case study organisations have restructured their processes to ensure that their Design
team works at least one sprint ahead of the Development team. This measure has
ensured that the UX design processes are not a bottleneck to the entire development
process.
Organisations can embed flexibility into their UX design process, to enable teams to
tailor design process to their design context. One way to achieve this is to impose
©© UUnniivveerrssiittyy ooff PPrreettoorriiaa

98
specific requirements on UX design teams in the initial iteration of a software
development project, followed by a gradual loosening of the constraints. An example
of this is to have two distinct UX design processes, one that is applied in the initial
iteration of a project and a shortened one applied once a team starts working optimally,
as determined by a Design governance body. Based on the interview results, Case
Study C organisation was able to implement this approach successfully. Another way
of achieving the gradual relaxation of constraints is to make certain practices
compulsory only in the first iteration, following which teams have the flexibility to tailor
the practice out of the process. An example of this is to mandate the design teams to
conduct high-fidelity prototyping from when a cross-functional team starts working
together until the end of the first software release. Once the project team has
completed the first software release, the team as a collective would decide when it
would be appropriate to stop developing high-fidelity prototypes. This measure would
work in cases where software developers only need the initial detail found in high-
fidelity prototypes in the initial stages of development to understand the design
standards.
Yet another measure that may be useful for optimising the UX design process is to
identify design activities that can be conducted in parallel and perform them in that
manner. An example of this is the inclusion of UX Designers in meetings where
Business Analysts elicit requirements. Including the UX Designers in the requirements
elicitation meetings enables them to start prototyping earlier in the process, rather than
waiting for user stories to be completed by Business Analysts.
Having an adequate number of UX design professionals enables a ‘division of labour’
that can expedite the process. One interview participant from Case Study D
organisation identified the inadequate number of UX design professionals on a project
©© UUnniivveerrssiittyy ooff PPrreettoorriiaa

99
as the reason it took ‘too long’ to complete the process. The interviewee identified
herself as a ‘Jack of all trades’ UX professional. To avoid a scenario in which software
development projects are delayed because of an inadequate ‘division of labour’ Case
Study C organisation divided UX-related responsibilities into distinct roles. Examples
of the UX-related roles were UX Researcher, UX Designer, UX Copywriter and UI
Designer. Such specialisation enabled different parts of the process to be completed
in parallel, which in turn, reduced the overall duration of the UX design process.
The last measure to optimise the UX design process was continuous improvement
and refinement of the process. Each case study organisation reviewed their UX design
process periodically and with each improvement, new ways are found to save time.
5.2.3. Theme 3: getting started with UX
The third theme from the interview data pertains to the steps UX design advocates
could take to convince resistant organisations of the benefits they stand to gain by
adopting UX design practices. This section discusses two sub-themes arising from the
data, namely Demonstrating the need for UX and Demonstrating value quickly.
5.2.3.1. Demonstrating the need for UX
During the interview process, participants shared principles from their experience with
establishing a UX design competency in their organisation. From these participants
and those who sell their respective organisations’ UX design services, a common first
step was to convince sceptical organisations of the need for incorporating UX design
in the development process. To achieve this, a heuristic evaluation of one of the
organisation’s existing systems was carried out. This was followed by usability testing
with users from the organisation’s target market. Results from the heuristic evaluation
and usability testing often surprised the organisations’ decision-makers because they
©© UUnniivveerrssiittyy ooff PPrreettoorriiaa

100
were able to see ‘first-hand’ how users struggled with the organisation’s application.
These two activities often put the organisations’ management in a position where they
are open to listening to recommendations on how to improve their application.
Hence, heuristic evaluation and usability testing enable UX designers to demonstrate
the need for incorporating UX design in the development processes of organisations
that would have been resistant to it.
5.2.3.2. Demonstrating value quickly
Following the completion of heuristic evaluation and usability testing, an organisation’s
management is usually open to the idea of implementing a pilot UX design process.
Analysis of the interview data showed that UX design ‘champions’ typically conducted
what is called ‘Discovery’, a process where UX design professionals conduct research
and develop a low-fidelity prototype, followed by usability testing and the development
of high-fidelity prototypes in the shortest possible time. A Discovery process often
takes about five days, based on the Google Design Sprint approach. The Discovery
process often leads organisations to a decision point regarding whether to make UX
design practices a part of their development process and in many cases, they do.
Interview participants with experience in setting up a UX design competency or selling
UX design services followed similar steps, namely, demonstrating the need for UX
followed by demonstrating value quickly.
5.2.4. Theme 4: ROI in UX
Based on my analysis of the interview data, interview participants identified four
metrics that could be used to measure ROI in UX. The metrics are (i) the Net Promoter
Score improvement, (ii) reduction in the drop-off rate, (iii) percentage increase in sales
and (iv) cost savings from ideas that are invalidated by concept testing.
©© UUnniivveerrssiittyy ooff PPrreettoorriiaa

101
It should be noted that none of the case study organisations calculated ROI on UX
design, but they used metrics that are typically used to measure ROI in UX design, to
calculate ROI in an entire software development project. The above-mentioned
metrics were incorporated in a business case document, together with other metrics
that are used to establish the ROI of a software development project, such as Net
Present Value. This means that in practice, none of the case study organisations
separated UX design from other project roles in the calculation of ROI. This is counter-
intuitive, given the number of UX professionals in each of the case study organisations.
An apparent continued recruitment of UX design professionals suggests that there
was an implicit understanding of the value that UX design brought to the organisations.
5.3. Conclusion
This chapter provides the discussions of the themes that emanated from my analyses
of the interview data. Four main themes were identified, namely (i) UX design practices
commonly implemented, (ii) Making the UX design process faster, (iii) Getting started
with UX and (iv) ROI on UX. The first three themes have sub-themes, while the ROI
on UX theme does not. The themes identified in this chapter were used as input to the
proposed gUXa framework.
©© UUnniivveerrssiittyy ooff PPrreettoorriiaa
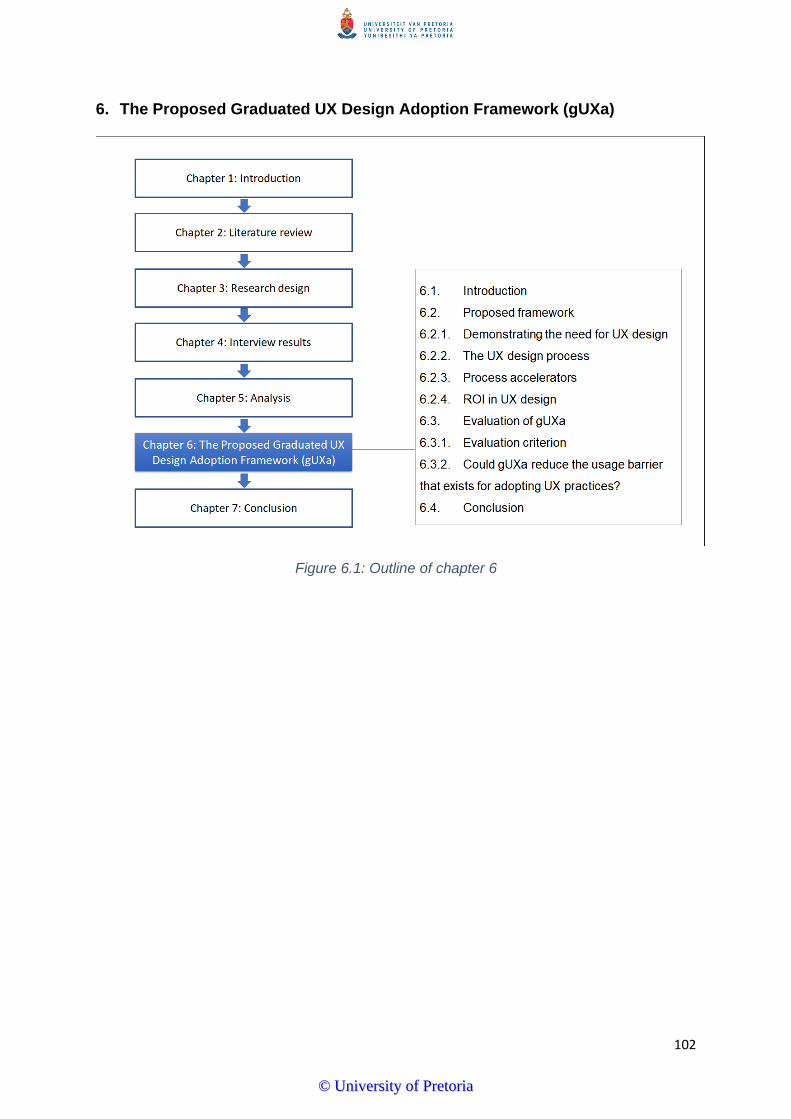
102
6. The Proposed Graduated UX Design Adoption Framework (gUXa)
Figure 6.1: Outline of chapter 6
©© UUnniivveerrssiittyy ooff PPrreettoorriiaa

103
6.1. Introduction
In section 1.6, I stipulated the output of this study to be a UX design framework geared
towards minimising the impact of UX design activities on the total duration of software
development projects. The focus of this chapter is to present the proposed Graduated
UX Design Adoption (gUXa) framework. In section 6.2, each component of gUXa is
described in detail. Section 6.3 contains an assessment of whether the framework
achieves its objective.
6.2. Proposed framework
The framework that emanates from this study, the Graduated UX Design Adoption
(gUXa) framework, illustrated in Figure 6.2, consists of four components. They are (i)
Demonstrating the need for UX design, (ii) UX design process, (iii) Process
Accelerators and (iv) ROI in UX design. Each component of gUXa is predicated on the
themes identified in section 5.2.
As stated in section 3.3, one of the ways in which the IRT was applied in this research
is that it served as the guiding principle for the proposed gUXa framework. The guiding
principle was that the proposed framework should be geared towards reducing the
usage barrier to the adoption of UX practices in South African organisations. According
to the IRT, reducing the barrier to innovations results in a decrease in the level of
resistance to the innovation which in turn, increases the likelihood of adoption (Kleijnen
et al., 2009). The descriptions of each component of the gUXa framework are provided
in sections 6.2.1 to 6.2.4.
©© UUnniivveerrssiittyy ooff PPrreettoorriiaa

104
Figure 6.2: The proposed gUXa framework
©© UUnniivveerrssiittyy ooff PPrreettoorriiaa

105
6.2.1. Demonstrating the need for UX design
In section 5.2.3 two activities emerged as being pivotal for convincing an organisation
to adopt UX design practices. The first activity is a heuristic evaluation, which enables
UX designers to identify areas of improvement in existing application(s) in a quick and
cost-effective manner (Nielsen, 1994).
The aim of the second activity, usability testing, is to demonstrate the difficulties that
users encounter while completing tasks on existing application(s). Results obtained
from this study showed that decision-makers were more willing to support the
incorporation of UX design into their organisation’s development process when they
saw, first-hand, how users struggled when using the organisation’s application.
Based on evidence from the research results, heuristic evaluation and usability testing
with five users are proposed as the first steps to demonstrate the need for the
incorporation of UX design in an organisation’s development process. If an
organisation’s decision-makers are resistant to the adoption of a full UX design
process, they may be open to the application of the two steps, namely heuristic
evaluation and usability testing. This is the first way in which the usage barrier is
reduced.
6.2.2. The UX design process
The proposed UX design process incorporates principles from the Agile UX, Lean UX
and Google Design Sprint approaches. In line with the Agile UX and Google Design
Sprint approaches, the proposed process has two separate sprints, namely a Design
sprint and a Development sprint.
The design sprint entails the first seven steps of the UX design process:
• Define problem statement;
©© UUnniivveerrssiittyy ooff PPrreettoorriiaa

106
• create personas;
• conduct competitor analysis;
• map user journeys;
• design low-fidelity prototype;
• design high-fidelity prototype,
• conduct usability testing.
Based on results from this study, each of these design sprints should be two weeks
long.
The actual development of the software takes place during the development sprint
(Build, Test, Fix), based on the outputs of the design sprint. This is followed by testing
and refinement of the software, based on testing results. Based on results from this
study, the development sprint should be two weeks long.
In line with the Agile UX principle, the Design sprint should occur one sprint ahead of
the Development sprint (Kuusinen & Vaananen-Vainio-Mattila, 2012). Based on the
Lean UX approach, the principle of rapid, iterative paper prototyping should be applied
during the development of low fidelity prototypes, step 5 of the UX design process.
The proposed UX design process is illustrated as a component of gUXa framework
(see Figure 6.2). Table 6.1 provides a narrative of each step, the outputs from each
step, and guidelines for the completion of each step in a timely manner.
©© UUnniivveerrssiittyy ooff PPrreettoorriiaa

107
Table 6.1: Process steps for the gUXa framework
Step No. UX design process step
Process step description and guidelines for completing step in a timely manner
Step output
1 Problem statement definition
In the first step, a Business Analyst facilitates a workshop with representatives(s) of the business unit paying for the project, to define the problem statement. The UX Designer is included in the workshop. UX designers should be part of the problem statement definition process, rather than receiving problem statements that have been defined by a Business Analyst. Involving UX designers in the problem statement definition will ensure that they can validate the problem statement while it is being defined, rather than afterwards. The output of this step is a problem statement.
Problem statement
2 Create personas In this step, the UX Researcher identifies the characteristics of target user groups by conducting interviews with a sample of end users recruited through an agency. The UX Researcher creates personas by identifying themes from interview data related to characteristics such as typical daily routines, age range and needs of each target user group. To shorten the duration of persona creation, the UX Researcher can use proto personas as is commonly practiced among the case study organisations. UX Researchers can also reuse personas that were created by other project teams solving a similar design problem within the past six months or other timeframe determined by the UX Researchers. The output of this step is a set of personas that match the target users of the proposed application.
Personas that match the target users of the proposed application
©© UUnniivveerrssiittyy ooff PPrreettoorriiaa

108
3 Competitor Analysis In this step, the UX Researcher and UX Designer review solutions that were implemented by competitor organisations for solving similar problems. The output of this step is a competitor analysis report.
Competitor analysis report
4 User journey mapping
In this step, the UX Researcher and UX Designer co-facilitate a brainstorming workshop to define the desired user journey. The workshop participants are representatives of the business unit paying for the project and representatives of the business unit responsible for the customer experience. The output of this step is a ‘To-be’ user journey map.
‘To-be’ user journey map
5 Low-fidelity prototyping
In this step, UX Designers conduct rapid, iterative paper prototyping of the solution in line with Lean UX principles. The creation of paper prototype should start during the Competitor Analysis step. The output of this step is a low-fidelity prototype.
Low-fidelity prototype
6 Usability testing In this step, the UX Researcher conducts usability testing with five participants. Previous studies, such as Nielsen and Landauer (1993) have shown that usability testing with five is sufficient to identify the majority of usability problems, irrespective of the type of application (web site, computer-based or mobile applications, etc.). The profile of usability testing participants should be aligned with the personas that were created during step two of the UX design process. The output of this step is a usability testing report.
Usability testing report
7 High-fidelity prototyping
In this step, the UI Designer adds more detail to the low-fidelity prototype by applying the organisation’s design standards on screen elements such as colour schemes, button sizes and font sizes. The UI Designer also refines the text on labels and other objects on each page, to align with the organisation’s standards. To expedite high-fidelity prototyping, an organisation can implement a design system
High-fidelity prototype
©© UUnniivveerrssiittyy ooff PPrreettoorriiaa

109
so that UI Designers have a set of reusable components they can choose from. The output of this step is a high-fidelity prototype.
8 Build, Test, Fix In this step, the software is developed, tested for accuracy, then refined. Steps 1-7 occur in a 2-week Design sprint, while the Build, Test, Fix step occurs in a 2-week Development sprint. The output of this step is functioning software.
Functioning software
©© UUnniivveerrssiittyy ooff PPrreettoorriiaa
110
6.2.3. Process accelerators
The third component of the gUXa framework is a set of Process Accelerators. Process
Accelerators are the measures that if taken, could reduce the time taken to execute
the proposed UX design process.
The first accelerator is the tailoring of the UX design process to an organisation’s
needs. One way to tailor the process is for a design team to identify activities that could
be carried out concurrently and execute those activities in parallel, to expedite the
process. Tailoring the process also could also take the form of reducing the number
of UX design steps a team chooses to complete. One way that the number of the UX
design process steps can be reduced is by removing the development of high-fidelity
prototypes from the full UX design process. Omitting high-fidelity prototypes is based
on the premise that as software developers grow in experience working within the
proposed process, they reach a stage where they understand the organisation’s
design standards so well, that they only need low-fidelity prototypes from UX
designers. However, omitting high-fidelity prototypes from the process is only
recommended once a project team has completed at least one release of a software,
not for newly-formed project teams. As such, a project team should be able to tailor
the gUXa framework to fit with their context and exclude steps that are deemed
unnecessary, such as high-fidelity prototypes.
The second accelerator is the use of a ‘design system’ which is a repository of reusable
GUI components that the design team can use. A design system saves time as there
will be no need to ‘reinvent the wheel’ during definition of both low- and high-fidelity
prototypes.
©© UUnniivveerrssiittyy ooff PPrreettoorriiaa

111
The third accelerator is to ‘divide and conquer’ the design work. This refers to
assigning a selection of specialist UX design professionals, such as a UX Researcher,
UX Designer, Service Designer, UX Copywriter and UI Designer on one project. In
cases where the ‘divide and conquer’ accelerator is applied, each specialist is
responsible for a part of the design effort. The result is a division of labour that
expedites the design process by facilitating the execution of some activities in parallel.
The antithesis of the ‘divide and conquer’ accelerator is the ‘Jack of all trades’ UX
designer as pointed out in section 5.2.2.2. A ‘Jack of all trades’ UX designer has a
limited capacity to execute activities concurrently but assigning specialists to specific
activities expedites the delivery. A notable disadvantage of the ‘divide and conquer’
accelerator is that it is only feasible for application within organisations that can afford
to pay for multiple UX design professionals, which may limit its applicability.
The last accelerator is the continuous improvement and refinement of the UX design
process. This entails reviewing the UX design process periodically and with each
review, finding and implementing new ways to save time. Within Case Study C, there
was a team of UX design process custodians whose role was to review the process
periodically. By reviewing project Lessons Learnt logs and investigating international
best practices, the process custodians constantly identified ways to optimise the
organisation’s UX design process. This is a practical way to continuously improve the
process.
6.2.4. ROI in UX design
In section 2.4, I noted the scepticism that exists among researchers, over calculations
of ROI on UX. The primary source of contention is the creation of a causal relationship
between UX practices and ROI metrics while omitting other contributing factors to
©© UUnniivveerrssiittyy ooff PPrreettoorriiaa

112
those metrics (Rosenberg, 2004). The fact that none of the case study organisations
calculated ROI in UX furthers the scepticism. In section 5.2.4 I specified that all four
case studies calculated ROI on entire projects, not on UX design only. With this in
mind, the gUXa ROI metrics are included in the project’s business case rather than a
separate calculation that singles out UX design. The metrics to be included are Net
Promoter Score improvement, reduction in the drop-off rate, percentage increase in
sales and percentage cost reduction.
6.3. Evaluation of gUXa
6.3.1. Evaluation criterion
In section 3.3, I specified that the IRT would be useful to this study in three ways.
Firstly, the theory provided a research-based explanation of the reasons why the
duration of UX design can result in a low adoption rate of UX design practices, as
highlighted by Pretorius et al. (2015) and Brosens (2017). Secondly, the theory
provides the basis upon which the proposed gUXa framework was formulated. More
specifically, the framework was formulated with the goal of reducing the size of the
usage barrier to the adoption of UX design. Lastly, the theory provided the criterion for
evaluating the proposed framework. In this section, the gUXa framework was
evaluated using the IRT.
According to the IRT, the size of a barrier to innovation influences the level of
resistance to that innovation (Ram & Sheth, 1989). The higher the size of the barrier
to innovation (independent variable), the higher the innovation resistance (dependent
variable) and vice versa (Ram & Sheth, 1989). Figure 6.3 depicts this relationship. An
appropriate evaluation criterion for the gUXa framework was to determine its impact
on the independent variable, the usage barrier. The evaluative question for the
©© UUnniivveerrssiittyy ooff PPrreettoorriiaa
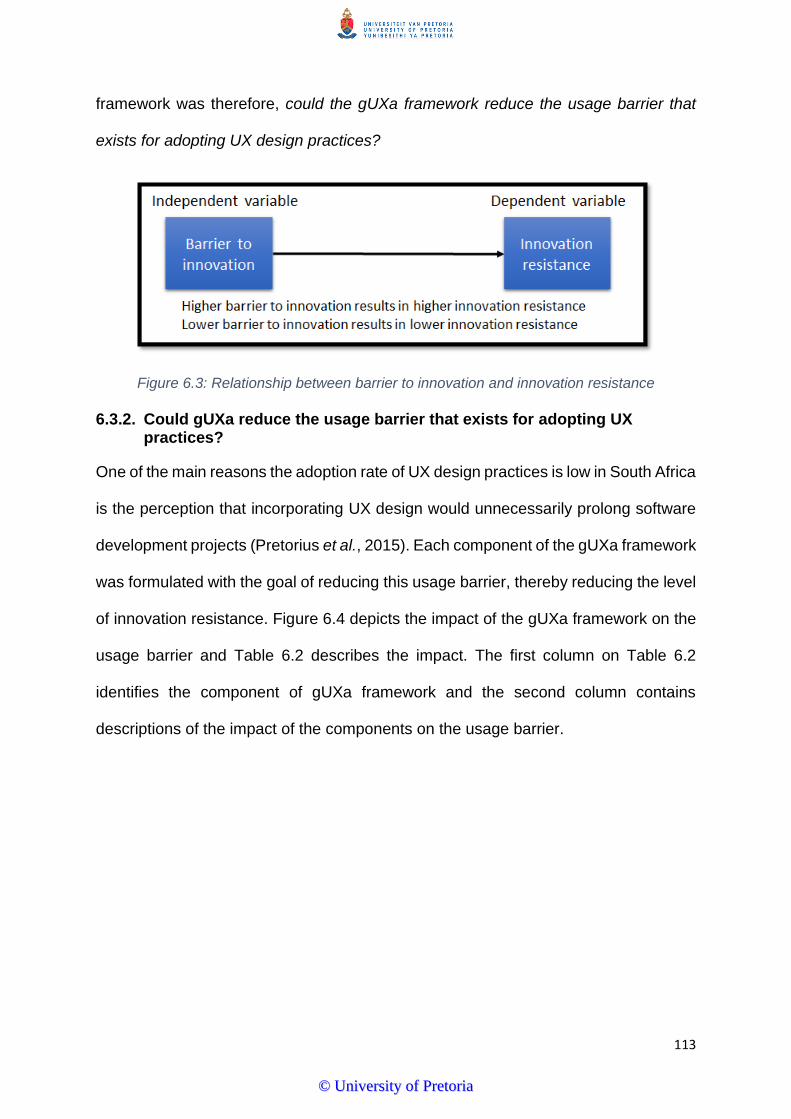
113
framework was therefore, could the gUXa framework reduce the usage barrier that
exists for adopting UX design practices?
Figure 6.3: Relationship between barrier to innovation and innovation resistance
6.3.2. Could gUXa reduce the usage barrier that exists for adopting UX practices?
One of the main reasons the adoption rate of UX design practices is low in South Africa
is the perception that incorporating UX design would unnecessarily prolong software
development projects (Pretorius et al., 2015). Each component of the gUXa framework
was formulated with the goal of reducing this usage barrier, thereby reducing the level
of innovation resistance. Figure 6.4 depicts the impact of the gUXa framework on the
usage barrier and Table 6.2 describes the impact. The first column on Table 6.2
identifies the component of gUXa framework and the second column contains
descriptions of the impact of the components on the usage barrier.
©© UUnniivveerrssiittyy ooff PPrreettoorriiaa

114
Figure 6.4: Impact of gUXa on usage barrier
©© UUnniivveerrssiittyy ooff PPrreettoorriiaa

115
Table 6.2: Impact of each gUXa component on the usage barrier
Component Impact on usage barrier
Demonstrating the need for UX
Demonstrating the need for the incorporation of UX design process entails evaluating existing systems using heuristic evaluation and usability testing. A heuristic evaluation identifies potential improvements to an application and a usability test demonstrates the difficulty users face using an organisation’s application. These two steps take a much shorter duration than completing an entire UX design process, which reduces the usage barrier because the UX designers would limit the UX design process steps to two activities.
As part of presenting the usability testing report and potential improvements, UX designers would also present the relevant benefits to the organisations in the form of ROI measures documented as part of a business case. Establishing the potential ROI that the organisation stands to benefit would likely increase the likelihood of decision-makers providing the necessary support for the implementation of a full UX design process.
ROI in UX
UX design process Application of the UX design process coupled with relevant process accelerators would likely lead to faster delivery. A fast delivery cycle that demonstrates the speed with which the design team could deliver designs is likely to reduce the usage barrier, therefore increasing the likelihood of adopting UX design practices. Process
accelerators
©© UUnniivveerrssiittyy ooff PPrreettoorriiaa

116
Based on the impact that each component of the gUXa framework is likely to have on
the usage barrier, the cumulative impact is likely to be a reduction in the usage barrier.
Hence, based on the preceding discussions, I have shown the ability of that the gUXa
framework to reduce the usage barrier that exists for adopting UX design practices.
6.4. Conclusion
In this chapter I introduced and described the Graduated UX Design Adoption (gUXa)
framework. The framework is based on the results of the interview data as well as
existing literature. The chapter also provided a detailed description of each component
of the gUXa framework. Finally, I demonstrated the ability of the framework to reduce
the usage barrier to the adoption of UX design into systems development processes.
©© UUnniivveerrssiittyy ooff PPrreettoorriiaa

117
7. Conclusion
Figure 7.1: Outline of chapter 7
©© UUnniivveerrssiittyy ooff PPrreettoorriiaa

118
7.1. Introduction
The purpose of this chapter is to summarise the research findings, reflect on the
research methodology, discuss this study's contribution to the HCI body of knowledge
and identify future research areas.
This dissertation consists of seven chapters and a set of appendices. Chapter 1 is an
introduction to the study, which provides context to the research, the objective of the
study and an overview of the content in the rest of the dissertation. Chapter 2 contains
a description of UX design, a review of prominent UX design approaches and a
discussion of ROI in UX design. In Chapter 3, the Innovation Resistance Theory was
described and its relevance to the study specified, following which the research
methodology was discussed. Chapter 4 provided a summary of the collected data from
the case studies, following which an analysis of the collected data was provided in
Chapter 5. Chapter 6 contains a description of the proposed framework, gUXa.
Chapter 7 is the conclusion of the dissertation.
7.2. Summary of research findings
The objective of this study was to formulate a UX design framework that could enable
organisations to complete UX design activities with the least amount of impact on the
speed of delivering systems development projects. The study was conducted using
literature review and four case studies, the latter being organisations that have
embedded UX design processes into their systems development processes.
The first focus of the literature review was to discuss user-centred design and UX
design practices. The second aspect of the literature review was a discussion of
prominent UX design approaches including Agile UX, Lean UX, Design thinking,
Google design sprint, Double diamond, Atomic design and Web analytics. The last
©© UUnniivveerrssiittyy ooff PPrreettoorriiaa

119
aspect the literature review focused on was understanding ROI in UX and how it is
measured.
The analysis of data from the literature and data from case studies combined the
practices from the prominent UX design approaches identified in existing literature with
practices implemented in the case study organisations. The analysis culminated in the
formulation of a framework with a proposed UX design process, graduated adoption
approach and proposed ROI measurements.
Five sub-questions were formulated to answer the main research question.
7.2.1. Summary of findings: sub-question 1
Sub-question 1: "Which UX design practices are predominantly used by UX
practitioners in South African organisations?"
The goal of the first sub-question was to understand the UX design practices adopted
by UX professionals in South Africa. This was done by interviewing 33 participants
from four case study organisations. Based on the themes from interviews, discussed
in section 5.2.1, the predominantly used practices are problem statement definition,
user research, persona definition, competitor analysis, user journey mapping, concept
testing, prototyping, usability testing and web analytics.
7.2.2. Summary of findings: sub-question 2
Sub-question 2: "How do organisations in South Africa incorporate UX design
practices into their systems development processes?"
The goal of the second sub-question was to understand how organisations in South
Africa incorporate UX design practices into their systems development processes.
©© UUnniivveerrssiittyy ooff PPrreettoorriiaa

120
This was done by interviewing 33 participants from four case study organisations. As
discussed in section 5.2.2.2, all the four case study organisations implemented a
design sprint, where UX activities were carried out, and a development sprint in which
the application was developed, tested and refined. The design sprint occurred ahead
of the development sprint because software developers used the outputs delivered by
the design team. The prominent UX design approaches discussed in the literature
review also follow a similar pattern, where the UX design activities are part of a
separate sprint from the development activities.
7.2.3. Summary of findings: sub-question 3
Sub-question 3: "How can return on investment (ROI) in UX practices be
measured?"
The goal of the third sub-question was to understand the ROI metrics applied for UX
design. The data to answer this question was extracted from a literature review and
from interviews conducted with 33 participants from four case study organisations. The
literature review showed that there is a high level of scepticism around measurement
of ROI in UX, mainly due to the difficultly of establishing the causality between
incorporating UX design and the ROI (Rosenberg, 2004). The main source of
scepticism is that the metrics for measuring ROI in UX tend to ignore other factors that
contribute to the ROI measurement. From the case study organisations, the key
finding was that the organisations did not establish ROI in UX in isolation as a
discipline, but on a project in its entirety.
©© UUnniivveerrssiittyy ooff PPrreettoorriiaa

121
7.2.4. Summary of findings: sub-question 4
Sub-question 4: "What emerging UX design practices are currently not being used
by organisations in South Africa?"
The goal of the fourth sub-question was to identify optimisation opportunities for UX
design processes elicited from the case studies, based on UX design approaches and
practices identified in the literature review. The UX design practices identified in the
literature but not currently being used by case study organisations were identified in
section 5.2.1.1, together with practices that were being used. Heuristic evaluation is
the notable UX design practice that was not commonly used by case study
organisations. The prominent UX design approaches identified in the literature but not
being applied by case study organisations were identified in section 5.2.1.2, together
with approaches that were being applied within the case study organisations. The
Atomic design and Double diamond approaches are the prominent approaches that
were not commonly used by case study organisations.
7.2.5. Summary of findings: sub-question 5
Sub-question 5: "What combination of UX design practices and sequence of UX
design practices can enable organisations in South Africa to incorporate UX design
in the software development process without compromising the speed of project
delivery?"
The goal of the fifth sub-question was to formulate a framework that could enable an
organisation to implement UX design practices without negatively impacting the speed
of delivery on software development projects. The framework, Graduated User
Experience Adoption, was developed based on key themes from collected data, that
©© UUnniivveerrssiittyy ooff PPrreettoorriiaa

122
took into account existing practices and optimisation opportunities identified in existing
literature and case study organisations. The gUXa framework proposes a graduated
approach to UX design adoption, starting with two UX design practices, namely
heuristic evaluation and usability testing. The second component of gUXa is a UX
design process that separates design activities and software development activities
into a design sprint and a development sprint, respectively. The UX design practices
in the design sprint include problem statement definition, persona creation, competitor
analysis, user journey mapping, low- and high-fidelity prototyping and usability testing.
The development sprint includes the programming, testing and refinement of software.
The gUXa framework also identifies a set of process accelerators that include tailoring
the process, the use of a design system, a division of labour and continuous
improvement of the UX design process. Lastly, the framework specifies measures for
calculating ROI in UX that should be included in a project’s business case, including
the increase in sales, drop-off rate, Net Promoter Score and reduced costs. Section
6.2 contains a detailed description of the framework.
7.2.6. Summary of findings: primary research question
Research question: "How can the user experience design process be optimised, so
that it has the least amount of impact on the speed of delivery of systems
development projects?"
Each of the five sub-questions contributed to answering the primary research
question.
Sub-question 1 enabled the identification of UX design practices that were commonly
applied in the case study organisations. These UX design practices provided a
starting point from which optimisation opportunities could be investigated.
©© UUnniivveerrssiittyy ooff PPrreettoorriiaa

123
Sub-question 2 prompted the investigation of how case study organisations
incorporated UX design practices into their systems development processes.
Establishing how UX design was incorporated into software development processes
enabled the identification of an approach used by all four case studies, namely the
distinction between a design sprint and a development sprint. The distinction
between a design sprint and development sprint serves to enable the delivery of UX
design with minimal impact on the speed of delivery of systems development
projects. The separation of design sprints and development sprints is a key
component of the gUXa framework.
Sub-question 3 prompted the investigation of ROI measures for UX design, how ROI
in UX was measured by organisations as identified in the literature review and lastly,
how ROI in UX was measured within case study organisations. Four ROI
measurements were incorporated in the gUXa framework as a means to persuade
decision-makers to incorporate UX design practices into software development
projects.
Sub-question 4 enabled the identification of opportunities for optimising the case
study organisations’ UX design processes. Emerging UX design practices and
approaches were a key consideration in formulating the gUXa framework.
Sub-question 5 prompted the formulation of the gUXa framework. The framework
considered the findings from sub-questions 1 to 5, culminating in a UX design
process that could have the least amount of impact on the speed of delivery of
systems development projects.
©© UUnniivveerrssiittyy ooff PPrreettoorriiaa

124
7.3. Methodological reflections
In this section, I reviewed the research design.
The objective of this study was to formulate a UX design framework that will enable
South African organisations to implement UX design with the least possible impact on
the duration of software development projects. The study lends itself to the application
of an interpretive paradigm because data needed to be collected from individuals who
by nature, may have different perspectives on the same question. Given that I needed
to understand the UX design process followed by four organisations, the appropriate
research strategy was a multiple case study, with semi-structured interviews being the
data collection strategy of choice. I found the methodology followed to be appropriate,
given that the data collected enabled me to fulfil the research objective.
7.4. Contribution
The main contribution of this study was the Graduated UX Design Adoption (gUXa)
framework for adopting UX design with the least possible impact on the duration of
systems development projects. The practical contribution of the study was that
organisations that wish to consider embedding UX design into their systems
development processes will have a research-based framework they can refer to and
tailor to suit their specific needs. The framework was validated using the IRT as being
able to reduce the usage barrier to resistance, through its graduated approach.
7.5. Future research
In this dissertation, the gUXa framework was evaluated based on a theory, namely the
Innovation Resistance Theory. An opportunity for future research is to implement the
gUXa framework to test its ability to enable South African organisations to implement
©© UUnniivveerrssiittyy ooff PPrreettoorriiaa

125
UX design with the least possible impact on the duration of software development
projects.
One of the key findings from the study was that all case studies did not calculate ROI
on UX alone, but ROI on a project. This supports the scepticism by Rosenberg (2004)
around measurement of ROI in UX. While it was useful to establish that all four case
studies did not calculate ROI in UX alone, an opportunity for future research is to
investigate the calculation of ROI across a larger sample size. This could take the form
of a quantitative study that examines organisations from different industries.
7.6. Conclusion
In this dissertation, a new framework for adopting UX design practices was formulated.
The gUXa framework addresses the study's main objective of a UX design framework
that has the least impact on the duration of software development projects. The
framework was developed based on existing literature and the results obtained from
the data collected from four case study organisations. In this chapter, a summary of
the study was provided, including the research findings, methodological reflections,
contributions and future research.
©© UUnniivveerrssiittyy ooff PPrreettoorriiaa

126
References
Abras, C., Maloney-Krichmar, D. & Preece, J. 2004. User-centered design.
Bainbridge, W. Encyclopedia of Human-Computer Interaction. Thousand Oaks:
Sage Publications, 37(4):445-456.
Akkus, I.E., Chen, R., Francis, P., Hardt, M. & Gehrke, J. 2012. Non-tracking web
analytics. Proceedings of the ACM Conference on Computer and
Communications Security:687-698.
Aleryani, A.Y. 2020. The Impact of the User Experience (UX) on the Quality of the
Requirements Elicitation. International Journal of Digital Information and
Wireless Communications, 10(1):1-9.
Allsteadt, C. 2017. An Exploration into the Effect of Advancing Technology on UX of
Social Media Applications. Elon Journal of Undergraduate Research in
Communications, 8 (2):121-130.
Bakhit, W. 2016. An Empirical Study of the Reasons for Resistance to Green
Innovations. International Journal of Finance & Banking Studies, 5(1):30.
Banfield, R., Lombardo, C.T. & Wax, T. 2015. Design sprint: A practical guidebook for
building great digital products. O'Reilly Media, Inc.
Bannon, L. 2011. Reimagining HCI: Toward a more human-centered perspective.
Interactions, 18(4):50-57.
Barbosa-Hughes, R. 2019. A pattern approach for identification of opportunities for
personalisation and automation of user interactions for the IoT. Proceedings of
the 24th European Conference on Pattern Languages of Programs, Irsee, 3-7
July 2019:1-9.
Baxter, K., Courage, C. & Caine, K. 2015. Understanding your users: a practical guide
to user research methods. 2nd ed. Waltham: Morgan Kaufmann.
Benbasat, I., Goldstein, D.K. & Mead, M. 1987. The case research strategy in studies
of information systems. MIS quarterly:369-386.
Benbasat, I. & Zmud, R.W. 1999. Empirical Research in Information Systems: The
Practice of Relevance. MIS Quarterly, 23(1):3.
©© UUnniivveerrssiittyy ooff PPrreettoorriiaa

127
Benyon, D. & Resmini, A. 2017. User experience in cross-channel ecosystems. 31st
International BCS Human Computer Interaction Conference (HCI 2017) 31, 3-
6 July 2017:1-12.
Bias, R.G. & Mayhew, D.J. 2005. Cost-justifying usability: An update for the Internet
age. Elsevier.
Black, S., Gardner, D.G., Pierce, J.L. & Steers, R. 2019. Design thinking.
Organizational Behavior.
Bradner, E. & Sauro, J. 2012. Software user experience and likelihood to recommend:
linking UX and NPS. UPA International Conference, Henderson, 4-8 June,
2012.
Brosens, J. 2017. The UX entrenchment enigma: why user experience practices are
not being incorporated in South African enterprises' Information Systems
Development Methodologies (ISDMS). Master's dissertation. University of
Pretoria.
Cahya, R.A.D., Handayani, A.N. & Wibawa, A.P. 2018. Mobile Braille Touch
Application for Visually Impaired People using Double Diamond Approach.
MATEC Web of Conferences:15007.
Carlbring, J. 2020. Inclusive Design for Mobile Devices with WCAG and Attentional
Resources in Mind: An investigation of the sufficiency of the Web Content
Accessibility Guidelines when designing inclusively and the effects of limited
attentional resources. Master's thesis. Linköping University.
Chen, Y., Chen, C., Wen, H., Jiang, J.-m., Zeng, Q., Shu, H. & Hong, Z. 2019. From
Use Case to Use Case Slices: An Automated Approach. International Journal
of Information System Modeling and Design (IJISMD), 10(4):24-50.
Clarke, R.J. & Kautz, K. 2014. What's in a user story: IS development methods as
communication. Faculty of Business - Papers (Archive), 651.
Clifton, B. 2012. Advanced Web metrics with Google Analytics. 3rd ed. Indianapolis:
Wiley.
Cohn, M. 2004. User stories applied: For agile software development. Addison-Wesley
Professional.
©© UUnniivveerrssiittyy ooff PPrreettoorriiaa

128
Dam, R. & Siang, T. 2018. What is design thinking and why is it so popular. [Online]
Available from:
http://athena.ecs.csus.edu/~buckley/CSc170_F2018_files/What%20is%20Des
ign%20Thinking%20and%20Why%20Is%20It%20So%20Popular.pdf
[Accessed: 6 September 2020].
Davis, F.D., Bagozzi, R.P. & Warshaw, P.R. 1989. User acceptance of computer
technology: a comparison of two theoretical models. Management science,
35(8):982-1003.
Dingsøyr, T., Nerur, S., Balijepally, V. & Moe, N.B. 2012. A decade of agile
methodologies: Towards explaining agile software development. Journal of
Systems and Software, 85(6):1213-1221.
Djamasbi, S., McAuliffe, D., Gomez, W., Kardzhaliyski, G., Liu, W. & Oglesby, F. 2014.
Designing for Success: Creating Business Value with Mobile User Experience
(UX). Lecture notes in computer science., (8527):299-306.
Donahue, G.M. 2001. Usability and the bottom line. IEEE Software, 18(1):31-37.
Downey, L. & Rosales, S. 2012. A brief history of user experience in government
systems. Usability in government systems: User experience design for citizens
and public servants:1-16.
Elberzhager, F., Holl, K., Karn, B. & Immich, T. 2017. Rapid lean UX development
through user feedback revelation. International Conference on Product-
Focused Software Process Improvement:535-542.
Etikan, I., Musa, S.A. & Alkassim, R.S. 2016. Comparison of convenience sampling
and purposive sampling. American journal of theoretical and applied statistics,
5(1):1-4.
Frost, B. 2016. Atomic design. Pittsburgh: Brad Frost.
Ghimire, B. 2020. Work Management Tool based on PHP and HTML. Centria
University of Applied Sciences.
Gkonos, C., Iosifescu Enescu, I. & Hurni, L. 2019. Spinning the wheel of design:
evaluating geoportal Graphical User Interface adaptations in terms of human-
centred design. International Journal of Cartography, 5(1):23-43.
©© UUnniivveerrssiittyy ooff PPrreettoorriiaa
129
Goncalves, B. & Ramasco, J.J. 2008. Human dynamics revealed through Web
analytics. Physical review. E, Statistical, nonlinear, and soft matter physics,
78(2 Pt 2):026123.
Goodman, E., Kuniavsky, M. & Moed, A. 2012. Observing the user experience: A
practitioner's guide to user research. Elsevier.
Göransson, B., Lif, M. & Gulliksen, J. 2003. Usability design-extending rational unified
process with a new discipline. International Workshop on Design, Specification,
and Verification of Interactive Systems:316-330.
Gothelf, J. 2013. Lean UX: Applying lean principles to improve user experience.
Sebastopol: O'Reilly Media, Inc.
Gray, C. 2014. Evolution of design competence in UX practice. SIGCHI Conference
on Human Factors in Computing Systems, Toronto, 26 April - 1 May 2014:1645-
1654.
Gregor, S. 2006. The nature of theory in information systems. MIS quarterly:611-642.
Gulliksen, J., Göransson, B., Boivie, I., Blomkvist, S., Persson, J. & Cajander, Å. 2003.
Key principles for user-centred systems design. Behaviour and Information
Technology, 22(6):397-409.
Hassenzahl, M. 2008. User experience (UX): towards an experiential perspective on
product quality. Proceedings of the 20th International Conference of the
Association Francophone d'Interaction Homme-Machine, Metz, 2-5 September
2008:11-15.
Hirschheim, R. & Klein, H. 2012. A Glorious and Not-So-Short History of the
Information Systems Field. Journal of the Association for Information Systems,
13(4):188-235.
Hobbs, J., Fenn, T. & Resmini, A. 2010. Maturing a practice. Journal of Information
Architecture, 2(1).
Humanfactors.com. 2014. Glossary of Usability Terms. [Online] Available from:
https://humanfactors.com/downloads/Glossary_of_Usability_Terms.pdf
[Accessed: 11 October 2020].
©© UUnniivveerrssiittyy ooff PPrreettoorriiaa

130
Innes, J. 2011. Why enterprises can’t innovate: Helping companies learn design
thinking. Lecture Notes in Computer Science (including subseries Lecture
Notes in Artificial Intelligence and Lecture Notes in Bioinformatics), 6769
LNCS:442-448.
Jokela, T., Iivari, N., Matero, J. & Karukka, M. 2003. The standard of user-centered
design and the standard definition of usability: analyzing ISO 13407 against
ISO 9241-11. Proceedings of the Latin American conference on Human-
computer interaction, New York:53-60.
Jokela, T., Siponen, M., Hirasawa, N. & Earthy, J. 2006. A survey of usability capability
maturity models: implications for practice and research. Behaviour &
Information Technology, 25(03):263-282.
Kelle, S., Henka, A. & Zimmermann, G. 2015. A persona-based extension for massive
open online courses in accessible design. Procedia Manufacturing, 3:3663-
3668.
Kim, Y.-J. 2020. Tracking Dynamics between Digital Design Agencies and Clients of
Hybrid Outsourcing in the Double Diamond Website Development Process.
Archives of Design Research, 33(1):17-35.
Kleijnen, M., Lee, N. & Wetzels, M. 2009. An exploration of consumer resistance to
innovation and its antecedents. Journal of economic psychology, 30(3):344-
357.
Knapp, J., Zeratsky, J. & Kowitz, B. 2016. Sprint: How to solve big problems and test
new ideas in just five days. New York: Simon and Schuster.
Kojo, I., Heiskala, M. & Virtanen, J.-P. 2014. Customer journey mapping of an
experience-centric service by mobile self-reporting: Testing the Qualiwall tool.
International Conference of Design, User Experience, and Usability:261-272.
Kolbeinsson, A., Lindblom, J. & Thorvald, P. 2020. Employing UX Processes for More
Focused Development in Research Projects. 6th International Digital Human
Modeling Symposium, Skövde, 31 August – 2 September, 2020:288-298.
Koljonen, R.A. 2019. Developing the offer process through a service blueprint.
Bachelor’s thesis. Laurea University of Applied Sciences.
©© UUnniivveerrssiittyy ooff PPrreettoorriiaa

131
Kuisma, T., Laukkanen, T. & Hiltunen, M. 2007. Mapping the reasons for resistance
to Internet banking: A means-end approach. International Journal of
Information Management, 27(2):75-85.
Kuusinen, K. & Vaananen-Vainio-Mattila, K. 2012. How to make agile UX work more
efficient. New York: ACM.
Laaziri, M., Benmoussa, K., Khoulji, S., Larbi, K.M. & El Yamami, A. 2019. Analyzing
bootsrap and foundation font-end frameworks: a comparative study.
International Journal of Electrical and Computer Engineering (IJECE), 9(1):713-
722.
Lang, J. & Howell, E. 2017. Researching UX: user research. SitePoint.
Lárusdóttir, M.K., Cajander, Å. & Gulliksen, J. 2012. The big picture of UX is missing
in Scrum projects. Proceedings of the International Workshop on the Interplay
between User Experience (UX) Evaluation and System Development (I-
UxSED), Copenhagen:49-54.
Lebedenko, R. 2019. Development of a mobile application user interface for
photographers’ search based on user experience. Doctoral dissertation.
Ukrainian Catholic University.
Lee, A.S. 1991. Integrating positivist and interpretive approaches to organizational
research. Organization science, 2(4):342-365.
Lee, A.S. 1999. Rigor and Relevance in MIS Research: Beyond the Approach of
Positivism Alone. MIS Quarterly, 23(1):29.
Lemon, K.N. & Verhoef, P.C. 2016. Understanding customer experience throughout
the customer journey. Journal of marketing, 80(6):69-96.
Lian, J.-W., Liu, H.-M. & Liu, I.-L. 2012. Applying innovation resistance theory to
understand user acceptance of online shopping: The moderating effect of
different product types. Computer Technology and Application, 3(2).
Liedtka, J. 2018. Why design thinking works. Harvard Business Review, 96(5):72-79.
Liikkanen, L.A., Kilpiö, H., Svan, L. & Hiltunen, M. 2014. Lean UX: the next generation
of user-centered agile development? Proceedings of the 8th Nordic Conference
on Human-Computer Interaction: Fun, Fast, Foundational, Helsinki:1095-1100.
©© UUnniivveerrssiittyy ooff PPrreettoorriiaa

132
Löwgren, J. & Stolterman, E. 2004. Thoughtful interaction design: A design
perspective on information technology. Cambridge, Massachusetts: MIT Press.
Ma, L. & Lee, C.S. 2018. Understanding the Barriers to the Use of MOOCs in a
Developing Country: An Innovation Resistance Perspective. Journal of
Educational Computing Research, 57(3):571-590.
Mackenzie, N. & Knipe, S. 2006. Research dilemmas: Paradigms, methods and
methodology. Issues in educational research, 16(2):193-205.
Maguire, M. 2001. Methods to support human-centred design. International journal of
human-computer studies, 55(4):587-634.
McCurdie, T., Taneva, S., Casselman, M., Yeung, M., McDaniel, C., Ho, W. &
Cafazzo, J. 2012. mHealth consumer apps: the case for user-centered design.
Biomedical instrumentation & technology, 46(s2):49-56.
Moreira, M.E. 2013. Writing User Stories and Grooming the Backlog. Being Agile.
Berkley: Springer.
Morville, P. & Rosenfeld, L. 2006. Information architecture for the World Wide Web:
Designing large-scale web sites. O'Reilly Media, Inc.
Myers, B. 1998. A brief history of human-computer interaction technology: reaching
out across the Web. Interactions, 5(2):44-54.
Newell, A. & Simon, H.A. 2007. Computer science as empirical inquiry: Symbols and
search. ACM Turing award lectures
Nielsen, J. 1994. Guerrilla HCI: Using discount usability engineering to penetrate the
intimidation barrier. Cost-justifying usability:245-272.
Nielsen, J. & Landauer, T.K. 1993. A mathematical model of the finding of usability
problems. Proceedings of the INTERACT'93 and CHI'93 conference on Human
factors in computing systems, Amsterdam:206-213.
Nielsen, J. & Norman, D. 2017. The Definition of User Experience (UX). [Online]
Available from: http://www.nngroup.com/articles/definition-user-experience/
[Accessed: 20 April 2020].
Nielsen, L. 2019. Persona Writing. Personas-User Focused Design: Springer.
©© UUnniivveerrssiittyy ooff PPrreettoorriiaa

133
Noda, N., Kishi, T. & Fukuzumi, S. 2020. Hidden-use case for eliciting quality in use.
CEUR Workshop Proceedings:25-27.
Oates, B.J. 2005. Researching information systems and computing. London: Sage.
Pandian, V.P.S. & Suleri, S. 2020. BlackBox Toolkit: Intelligent Assistance to UI
Design. arXiv.
Pettersson, R. 2002. Information design: An introduction. Amsterdam: John Benjamins
Publishing.
Pinheiro, E.G., Lopes, L.A., Conte, T.U. & Zaina, L.A. 2019. On the contributions of
non-technical stakeholders to describing UX requirements by applying proto-
persona. Journal of Software Engineering Research and Development, 7:1-8.
Plattner, H. 2013. An introduction to design thinking. Iinstitute of Design at Stanford:1-
15.
Pretorius, M., Hobbs, J. & Fenn, T. 2015. The User Experience Landscape of South
Africa. ACM International Conference Proceeding Series, 28-30 September
2015.
Ram, S. 1987. A model of innovation resistance. ACR North American Advances,
14:208-212.
Ram, S. & Sheth, J.N. 1989. Consumer resistance to innovations: the marketing
problem and its solutions. Journal of consumer marketing, 6(2):5-14.
Reichheld, F.F. 2003. The one number you need to grow. Harvard business review,
81(12):46-55.
Rogers, E.M. 2002. Diffusion of preventive innovations. Addictive behaviors,
27(6):989-993.
Rosenberg, D. 2004. The myths of usability ROI. interactions, 11(5):22-29.
Saunders, M.N.K., Lewis, P. & Thornhill, A. 2016. Research methods for business
students. 7th ed. Harlow: Pearson Education Limited.
©© UUnniivveerrssiittyy ooff PPrreettoorriiaa

134
Seno, B.A., Andryana, S. & Iskandar, A. 2020. Development of a System for
Submitting Funds Proposals at the National Web-Based University. Jurnal
Mantik, 4(1):969-974.
Shaw, M. 2012. Copywriting Second Edition: Successful Writing for Design,
Advertising and Marketing. 2nd ed. London: Laurence King Publishing.
So, C. & Joo, J. 2017. Does a persona improve creativity? The Design Journal,
20(4):459-475.
Sonderegger, A., Uebelbacher, A. & Sauer, J. 2019. The UX Construct–Does the
Usage Context Influence the Outcome of User Experience Evaluations? IFIP
Conference on Human-Computer Interaction, Paphos, 2-6 September
2019:140-157.
Stickdorn, M., Hormess, M.E., Lawrence, A. & Schneider, J. 2018. This is service
design doing: applying service design thinking in the real world. O'Reilly Media.
Sundberg, H. 2015. The role of user experience in a business-to-business context.
PhD thesis. Tampere: Tampere University of Technology.
Terre Blanche, M.J., Durrheim, K. & Painter, D. 2006. Research in practice: applied
methods for the social sciences. 2nd ed. Cape Town: UCT Press.
Toribio-Guzmán, J.M., García-Holgado, A., Pérez, F.S., García-Peñalvo, F.J. &
Martín, M.A.F. 2016. Study of the Usability of the Private Social Network
SocialNet using Heuristic Evaluation. Proceedings of the XVII International
Conference on Human Computer Interaction, New York, 13-16 September
2016:1-5.
Tschimmel, K. 2012. Design Thinking as an effective Toolkit for Innovation. ISPIM
Conference Proceedings, Barcelona, 17-20 June 2012:1.
Turner, C.W. 2011. A strategic approach to metrics for user experience designers.
Journal of Usability Studies, 6(2):52-59.
Usability.gov. 2020. User Experience Basics. [Online] Available from:
https://www.usability.gov/ [Accessed: 11 October 2020].
UXmatters.com. 2020. Glossary. [Online] Available from:
https://www.uxmatters.com/glossary/ [Accessed: 11 October 2020].
©© UUnniivveerrssiittyy ooff PPrreettoorriiaa

135
Van de Ven, A.H. 1989. Nothing is quite so practical as a good theory. Academy of
management Review, 14(4):486-489.
Varnes, C. 2019. Concept testing: the role of concept formulation for new product
success. Master's thesis. Copenhagen: Copenhagen Business School.
Vermeeren, A.P., Law, E.L.-C., Roto, V., Obrist, M., Hoonhout, J. & Väänänen-Vainio-
Mattila, K. 2010. User experience evaluation methods: current state and
development needs. Proceedings of the 6th Nordic conference on human-
computer interaction: Extending boundaries, Reykjavik:521-530.
Walsham, G. 1995. The emergence of interpretivism in IS research. Information
systems research, 6(4):376-394.
Wang, Z. 2019. Estimating productivity in a scrum team: a multi-agent simulation.
Proceedings of the 11th International Conference on Computer Modeling and
Simulation, North Rockhampton, 16-18 January 2019:239-245.
Watzman, S. 2003. Visual design principles for usable interfaces. The human-
computer interaction handbook: fundamentals, evolving technologies and
emerging applications. Hillsdale: L. Erlbaum Associates.
Weiner, M. 2006. Unleashing the Power of PR: a Contrarian's Guide to Marketing and
Communication. San Francisco: John Wiley & Sons.
Weinschenk, S. 2005. Usability a business case. Fairfield: Human Factors
International. [Online] Available from:
https://www.humanfactors.com/downloads/whitepapers/business-case.pdf
[Accessed: 23 September 2020].
Yin, R.K. 2011. Applications of case study research. 3rd ed. California: Sage.
Young, S.W. 2014. Improving library user experience with A/B testing: Principles and
process. Weave: Journal of Library User Experience, 1(1).
©© UUnniivveerrssiittyy ooff PPrreettoorriiaa

136
Appendix A: Interview questions
Questions linked to Sub-questions 1 and 2
• What UX design practices are used within your organisation?
• How long does it typically take to complete each of the UX practice?
• On the list provided to you, please indicate the UX practices you currently use
in your organisation. Name any practices you use but are not listed, bearing in
mind the following examples:
o Agile UX
o Lean UX
o Web Analytics
o Design Thinking
Questions linked to Sub-question 3
• What outputs (documentation or other deliverables) do UX professionals in
your organisation deliver?
• What kind of information is packaged in each of the deliverables?
• How do you attain the information you need for the deliverables (the
techniques you use)?
• Can you describe the SDLC process followed in your organisation and
highlight when the UX deliverables are produced?
Question linked to Sub-question 4
• In your organisation, how is return on investment (ROI) measured on UX
design practices?
©© UUnniivveerrssiittyy ooff PPrreettoorriiaa

137
Questions linked to Sub-question 5
• In your opinion, what do you think would make the UX design process
shorter?
• What new UX practices would you introduce to your team to improve your
design process?
• Why are you not currently using these new practices?
• How would you go about introducing the new practices to your team?
Closing Question:
• Is there any information that you wish to provide?
©© UUnniivveerrssiittyy ooff PPrreettoorriiaa

138
Appendix B: Combined letter of introduction and informed consent
©© UUnniivveerrssiittyy ooff PPrreettoorriiaa

139
Appendix C: Ethical clearance certificate
©© UUnniivveerrssiittyy ooff PPrreettoorriiaa