Embed Size (px)
Citation preview
1
Optimising cyanobacterial
growth:
The effects of using dual-colour,
high-frequency,
intermittent LED lights in Synechocystis
PCC6803
36 EC
(1st April 2014 – 1st October 2014)
MSc Biological sciences:
Limnology and oceanography
Supervisor: J. Merijn Schuurmans
Examiner: Hans C. P. Matthijs
Institute of biodiversity and ecosystem dynamics,
Department of aquatic microbiology, University of
Amsterdam.
April 1st 2014 – November xxx 2014

2
Abstract
Algal biotechnology has gained renewed interest due to declining fossil fuel
reserves and the need for a bio-based sustainable economy. Cyanobacteria have
the potential to produce a wide range of products (biofuels, alcohols, organic
acids etc.). In order to produce economically feasible amounts on a large scale,
photosynthetic efficiency needs to increase. One way to optimise this, is to take
timescale differences between the two photosystems (nanoseconds) and the
cytochrome b/f complex (microseconds) into account. To prevent excess
excitation from continuous and high intensity light, high frequency short light
flashes emitted by light emitting diodes (LEDs) can be applied. Properly timed
and dosed these flashes could reduce excess energy input , which in continuous
light would have been wasted by non-photochemical quenching. In this study,
we use Synechocystis PCC6803 as a model organism to conduct oxygen
measurements to find the best lighting conditions(duty cycle, frequency, and
intensity of orange and far-red LED lights) that produces the most oxygen, a
proxy for photosynthesis. We also used chemostats (photobioreactors) to gain a
further understanding of how the photosynthetic apparatus, phycobilisomes
(PBS), chlorophyll a (Chla), PSI : PSII ratio and biovolume, change under
different continuous, flashing and dual colour LED climates. We have tested
lighting conditions on a wild-type strain and two mutant strains, flv2flv4Δ and
isiAΔ, which are both partially defective in non-photochemical quenching.
Our oxygen measurement results show low duty cycle orange flashing light (0.2,
0.1, 0.17 DC) to increase oxygen production. The addition of low intensity far-red
increases oxygen production even further. Conclusions from the different
climates showed a low TL/TD ratio to produce higher oxygen concentrations. Our
chemostats showed the PSI : PSII ratio to increase with the addition of far-red,
while a low duty cycle orange flashing (0.2 DC) causes the ratio to decrease in
wild type Synechocystis. Free PBSs decrease in flashing orange light and attach
more to PSI. With the addition of far-red, binding to PSII is increased. The
increase in PSI binding (through flashing) was even more evident in both
mutants. ChlaPSI : ChlaPSII ratios using low temperature fluorescence show
minimal changes between wild type climates, while mutants show an increase in
ratio in flashing orange and even more with addition of far-red. Biovolume of the
culture appears to be affected by the binding state of PBSs. Efficient light
harvesting and energy transfer between both photosystems, increases yield on
light in steady state chemostats. The optimum climate was that of a 0.17 DC
orange flash followed by a 0.03 DC of far-red for both biomass and oxygen
production. We have shown Photosynthetic efficiency can be improved through
very specific and precise dual colour, low duty cycle and high frequency flashing
light. Not only that, but LED implementation is far more cost effective than
traditional artificial lighting.
3
Table of Contents
Abstract ................................................................................................................................................... 2
II. Introduction ................................................................................................................................. 5
2.1 Sustainable energy resource .............................................................................................. 5
2.2 In the field .................................................................................................................................. 5
2.3 Photosynthesis ......................................................................................................................... 5
2.3.1 Photosystem 2 ................................................................................................................. 5
2.3.1 Cytochrome b/f complex and photosystem 1 .................................................... 6
2.4 Non-photochemical quenching ......................................................................................... 7
2.5 State transitions, isiA∆ and flv2-4∆ ................................................................................. 7
2.6 Flashing light ............................................................................................................................ 7
2.7 Flashing coloured light ......................................................................................................... 8
2.7 Hypothesis ................................................................................................................................. 8
III. METHODS ..................................................................................................................................... 9
3.1 Photo-bioreactors (chemostats) ...................................................................................... 9
3.2 Oxygen measurements ......................................................................................................... 9
3.2.1 Oxygen set up (Firesting optode) ............................................................................ 9
3.2.2 Measurements .............................................................................................................. 10
3.3 Steady state measurements and analysis .................................................................. 10
3.3.1 77k ..................................................................................................................................... 10
3.3.2 Chlorophyll extraction .............................................................................................. 11
3.3.3 Cell counts/biovolume .............................................................................................. 11
3.3.4 Western Immuno-blots ............................................................................................. 11
IV. Results ............................................................................................................................................ 13
4.1 Oxygen measurement results ......................................................................................... 13
4.2 Steady state results ............................................................................................................. 18
4.2.1 Bio-volume ..................................................................................................................... 18
4.2.2 Ratio of Chla and PBS ................................................................................................ 19
4.2.3 SDS page gel analysis ................................................................................................. 22
V. Discussion....................................................................................................................................... 23
5.1 Oxygen measurements: ..................................................................................................... 23
5.1.1 Pmax values: continuous vs flashing .................................................................. 23
5.1.2 Pmax values: orange vs orange + far-red ......................................................... 23
5.1.3 Pmax values: colour arrangement, DCs and dark periods ........................ 24
5.1.4 α Values ........................................................................................................................... 25
5.1.5 Oxygen measurement conclusions ...................................................................... 25

4
5.2 Steady state measurements ............................................................................................ 25
5.2.1 Biovolume ....................................................................................................................... 25
5.2.2 Chlorophyll a ................................................................................................................. 26
5.2.3 Phycobilisomes ............................................................................................................ 29
5.4 Conclusion of steady states ............................................................................................. 30
5.5 Lighting .................................................................................................................................... 30
VI. Summary ....................................................................................................................................... 31
VII. References ................................................................................................................................... 33
VII. Appendices ................................................................................................................................. 40

5
II. Introduction
2.1 Sustainable energy resource
Microalgae are becoming the subject of expanding research. This is due to
studies that show them to be promising producers of organic chemicals and
biofuels (Simionato et al., 2013 and Wijffels et al., 2013). They have been shown
to produce products such as alcohols (ethanol, butanol, etc.) fatty acids, organic
acids, and storage compounds (with or without genetic manipulation
addition/subtraction/alterations of metabolic pathways) (Wijffels et al., 2013;
Sforza et al., 2012; Hellingwerf and De Mattos 2009).
Microalgae are effective CO2 fixers, and are around 10 times more productive (in
terms of energy conversion efficiency) than 1st generation biofuels. They also
flourish with only three feed stock ingredients: light, water and nutrition (Gris et
al., 2014; Wijffels et al., 2013; Angermayr et al., 2009 and Patil et al., 2008). This
makes them the perfect sustainable source for cultivation of biofuel, food
supplement, and other energy rich compounds.
2.2 In the field
As microalgae are small in size, they have to be in produced in large quantities to
achieve a reasonable ratio of product to biomass (Patil et al., 2008). To produce
the necessary biomass, large-scale photo bioreactors (PBRs) are preferred over
raceway pond systems because their closed culture environments allow little to
no exchange with the outside environment and the internal environment can be
controlled (Patil et al., 2008; Slade and Bauen, 2013 and Park and Lee, 2001).
Light quality and intensity are very important for growth of microalgae meaning
that PBRs need to be designed in an optimal way to allow for maximum surface
area and also minimize ‘self-shading’ (Gris et al., 2014 and Park and Lee, 2001).
Plants typically use around 1 % of sunlight, which is extremely low. Therefore, in
order to gain the large quantities of biomass needed and keep the process as
‘low-cost’ as possible it is important to optimize the PBR environment for
efficient conversion of light energy into biomass and products (Vejrazka et al.,
2001 and Matthijs et al., 1996).
2.3 Photosynthesis
2.3.1 Photosystem 2
In order to optimize the 1 % of sunlight that plants require, a deep knowledge of
photosynthesis is needed. Photosynthesis takes places in two steps. Photosystem
two (PSII) is the first step. This means the reaction can only take place when
light is available (Checchetto et al. 2013). In PSII light is harnessed by
phycobillisomes (PBS), a light gathering ‘antenna’ consisting of pigments
phycocyanin, phycoerythin around an allo-phycocyanin core.

6
Synechocystis spec. PCC6803 used in this study do not contain phycoerythrin.
These pigments optimally absorb orange light in the 590 nm to 650 nm range of
light and transfer the energy to the chlorophyll a (Chla) pigments in PSII’s
reaction centre. The photon energy is used in the reaction centre where it causes
water molecules to split into protons, electrons and oxygen (oxygenic
photosynthesis) (Checchetto et al., 2013 and Ma et al., 2007).
The electron (from the water splitting reaction) is then passed to chlorophyll
pigments within the reaction centre. From here it is able to reduce electron
acceptors (quinones Qa and then Qb) (Pinchasov et al., 2005 and Checchetto et al.,
2013). Qb then leaves the PSII reaction center and trasfers the electron to
plastoquinone that brings the electron to the cytochrome b/f complex.
2.3.1 Cytochrome b/f complex and photosystem 1
The cytochrome b/f complex forms a proton gradient that transfers electrons to
plastocyanin. The proton gradient across the membrane helps to form nature’s
intracellular energy source: Adenoisine riphosphate (ATP) (Cramer et al., 2004).
From Plastocyanin, the electron is transferred by photosystem one (PSI). PSI, like
PSII relies on light energy but at a wavelength of 700 nm. The electrons are re-
excited to contain enough energy to be transferred to ferredoxin (Stroenel et al.,
2003).
From this point there are three ways the electron go. First, ferredoxin NADP+
reductase reduces NADP+ to nicotinamide adenine dinucleotide phosphate
(NADPH) using the electron from ferredoxin which can be further used in the
Calvin-Benson cycle (dark reaction) for carbon assimilation (Takagi et al., 2014).
Second, ferredoxin-electron is cycled back into the PQ pool (cyclic electron
transport). Lastly, the electron may leave PSI and be use in Mehler and Mehler-
like reactions.
The Mehler reaction (taking place at PSI) is a direct reduction of O2 forming
singlet oxygen 1O2 also known as a reactive oxygen species (ROS). This is quickly
converted to H2O to prevent damage (Roberty et al., 2014). It is thought however
that the purpose of the PSI-Mehler reaction is to act as an extra proton gradient
across the thylakoid membrane, decreasing excitation pressure (Roberty et al.,
2014).
Mehler-like reactions on the other hand do not produce ROS, but instead H2O
and are involved in photo. Here flavodiiron proteins flv1 and flv3 use NADPH as
an electron donor to produce H2O (Dang et al., 2014, Roberty et al., 2014 and
Helman et al., 2003).

7
2.4 Non-photochemical quenching
Electron transfer from plastoquinone to plastocyanin via cytochrome b6/f takes
place on a much slower time scale (milliseconds) than PSI and PSII
(nanoseconds) (Sforza et al., 2012; Wilhelm and Selmar, 2011 and Matthijs et al.,
1996). This means that much of the energy of the Chla + electron molecules
cannot be used for functional use. In other words, the reaction center within PSII
is ‘closed’ (fully reduced Qa and Qb) (Kato et al., 2003 and Schuurmans et al.,
2014 in prep).
PSII is extremely susceptible to high oxidative stress (singlet oxygen 1O2),
especially in light intense environments and the excitation energy must dissipate
as heat or fluorescence through non-photochemical quenching (NPQ) (Gris et al.,
2014; Bersanini et al., 2014 and Checchetto et al., 2013). This refers to process
that do not aid in light capturing, but instead energy dissipation. PBSs are
strongly involved in the formation of quenching states (Joshua et al. 2005).
Methods of quenching for cyanobacteria include, flavodiiron (flv1, 2, 3, 4), the
formation of IsiA, Orange CarotenoidProtein (OCP), state transitions and
Mehler/-like reactions. If the energy is not dispersed through NPQ then it causes
damage to the photosynthetic apparatus (Bersanini et al., 2014).
2.5 State transitions, isiA∆ and flv2-4∆
State transitions occur when the excitation energy between the two
photosystems is unequal. In such cases phycobilisomes are moved from PSII to
PSI (Baily and Grossman, 2008; Pettai et al., 2005 and Mullineaux and Allen,
1990). IsiA is a protein found in most cyanobacteria that binds with PSI to create
super molecules forming additional light harvesting antennae (photochemical
quenching). It has also been shown to mediate excitation energy from PBS to its
reaction centre (Cadoret et al., 2004).
However in continuous light it is more likely that the isiA function is geared
towards mediating excitation energy. Studies have shown free-isiA proteins to
be created in excess at PSI and they are thought to subsequently shade PSII
under high light conditions (Yeremenko et al., 2004). Flv2-4 protein combo (from
this point on Flv4), who’s formation is also induced by high light conditions, are
found in cyanobacteria on PSII where they act as an electron sink dissipating
excess energy through electron transfer processes. This allows the PQ pool to
stay oxidised (Bersanini et al., 2014). Flv2-4 also plays an important role in
energy transfer from PBS to reaction center (Bersanini et al., 20
2.6 Flashing light
Non-photochemical quenching may well protect the photo-systems from
damage, but it is also costly, diverting much energy (in the form of ATP) from
biomass formation (Gris et al., 2014; Simionato et al., 2013 and Sforza et al.,
8
2012). Thus when algae are exposed to continuously high levels of light biomass
productio is hindered by photo-protection (Sfroza et al., 2012). In order to
reduce photo-protection and excess energy within PSII and PSI and increase the
overall biomass, high frequency intermittent light can be used to mimic the
natural ‘open/closed’ rhythm of the reaction centres (Sforza et al., 2012; Park
and Lee, 2001; Matthijs et al., 1996). This allows for maximal use of the light
energy received (Sforza et al., 2012).
Flashing light (in various combinations of on-off cycles) was shown to be
effective in increasing biomass as early as 1932 (Emerson and Arnold, 1932a and
Emerson and Arnold 1932b). More recent studies have confirmed the increased
biomass (up to three more than that achieved under continuous light) and/or
increased photosynthesis (i.e. a more efficient utilization of the absorbed light)
(Gris et al., 2014; Lunka and Bayless 2013; Sforza et al., 2012; Simionato et al.,
2013; Vejrazka et al., 2012; Vejrazka et al., 2011; Grobbelaar et al., 1996 Matthijs
et al., 1996; Terry et al., 1986 and Laws et al., 1983).
A duty cycle (DC) is the fraction of time that the light is ‘on’ in a given period of
time (for example 1 second). A 0.2 DC signifies that the light is on 20 % of the
time and for the following 80 % is off. Regardless of the frequency of flashing or
light dark cycle the majority of reported results from above authors show an
increase in biomass at a DC of 0.1 - 0.2.
2.7 Flashing coloured light
Lunka and Bayless (2013) used four different light climates of white LEDs
lighting (75 µmoles∙m-2∙s-1 continuous, 175 µmoles∙m-2∙s-1 flashing, 275
µmoles∙m-2∙s-1flashing and 375 µmoles∙m-2∙s-1 flashing), all with a 0.2 DC and
repeated at 10 KHz. Here optical density was a measure of productivity. The
treatment, 375 µmoles∙m-2∙s-1 of flashing light produced an increase of around
540 % relative to the continuous 75 µmoles∙m-2∙s-1. Not only did flashing light
increase biomass but also the power consumption was less than half that of the
continuous light. This shows the enhancement in biomass production efficiency
that flashing light can achieve.
Although continuous light has been studied, there has been little to no research
on coloured flashing light. One study by Mohsenpour et al., (2012), for example,
showed orange light to be one of the three most beneficial light colours (150
µmoles∙m-2∙s-1) with biomass concentrations of 0.04 g∙L-1∙day for cyanobacteria
Gloeothece membranacea.
2.7 Hypothesis
In this study we look at the effects of combining far-red light with orange light
with different DCs in a small scale PBR containing Synechocystis (wild type). Two

9
mutants (isiA∆- and flv4∆-deficient mutants) will be used to show the effect of
light environment on biomass in quenching deficient strains. We also look at the
positioning of the far-red light within the cycle to gain optimal oxygen
production. We do this in the hope of stimulating PSI, allowing more efficient
electron transport through the two photosystems via the electron transfer chain
resulting in an increase in biomass (Mullineaux and Allen, 1990).
In addition we would like to find a climate with optimal PBS binding. Continuous
light (1.0 DC) and 0.2 DC (Schuurmans et al. in prep) were used as controls. LED
panels were used as they did not waste energy through heat and eliminate the
excitation of other wavelengths (such as blue light) (Matthijs et al, 1996). The
rate of photosynthetic was measured via O2 production (Checchetto et al., 2013).
III. METHODS
3.1 Photo-bioreactors (chemostats)
Four PBRs (chemostats) were assembled (Huisman et al., 2002) using BG-11
mineral medium (Sigma) with the addition of 5 mM Na2CO3 to insure nutrient
and carbon replete conditions. CO2 enriched air (1.5 %) was flushed through the
cultures which were maintained at a temperature of 30°C. The dilution rate was
set to 0.015 h-1. Chemostats were inoculated with Synechocystis spec. PCC6803
and were kept at a light regime of continuous (1.0 DC) orange light (636 nm) at
an average of 15 µmoles∙m-2∙s-1. The chemostats were run for 1 week to reach a
sufficient starting optical density (OD750).
Climates for Synechocystis (WT) consisted of: continuous orange (1.0 DC)
(control), flashing orange (0.2 DC), continuous orange + far-red (726 nm) (1.0
DC), flashing orange + far-red (0.2 DC) and the best climate from oxygen
measurements. All WT chemostats were illuminated at 30 µmoles∙m-2∙s-1, and
flashing frequency at 1 KHz. Two mutant strains (isiAΔ and flv4Δ) were also used
and placed in the following climates: Continuous orange, flashing orange (0,2
DC) and best climate from the oxygen measurements. After five to six volume
changes, the cultures were considered to be in steady-state (approx. two weeks)
at which point samples were taken for analysis. The pH values were measured
(SCHOTT instruments pH meter) and always remained in the range 7.8 - 8.6.
3.2 Oxygen measurements
3.2.1 Oxygen set up (Firesting optode)
Three small transparent double-walled glass vessels were placed in the middle
of two LED3 panels, to minimize shading and increase equal distribution of light.
The optical light path was 1 cm. Water was flushed through the double wall to
control the temperature of the experiments (30°C). The internal chamber of the

10
glass vessels contains a sample chamber of 3 ml. Each vessel had an attached
optode (Firesting, Pyroscience Germany) that entered the sample chamber.
These optodes were calibrated to zero by flushing ddH2O in the sample chamber
with N2 gas for at least 15 minutes until 0 % dissolved oxygen was reached. To
reach maximum dissolved oxygen, air was flushed through the vessel.
3.2.2 Measurements
Sample was taken from the continuous control (1.0 DC orange) and diluted with
BG-11 to achieve an OD750 of 0.250 (+/-0.025). From there, 3.5 ml of sample
were placed in the three internal chamber cuvettes and flushed with nitrogen to
bring O2 production to less than 20 % of O2 saturation in water. NaHCO3 were
added to the cuvettes, to a final concentration of 10 mM sealed with stoppers to
prevent air exchange. A computer-mediated LED lighting program allowed
manual alteration of light climates using orange (620 nm) and far-red (730 nm).
Light regimes were run for 33 minutes in three minute intervals with
incrementing orange light intensities. Far-red intensity was kept constant
throughout each individual experiment. The percentage of dissolved oxygen was
converted into concentration of oxygen, assuming that at 1 atm. Pressure at 30°C
air saturated water contains 190 µM Oxygen. Chla concentrations of the samples
were calculated using the following formula:
Chla = ( 14.003 · ( OD750 - OD680 ) – 0.2167 ) · 3
To calculate the Oxygen production (µmoles·min-1·mg Chla-1) the change of
oxygen in each three minute climate (disregarding the first 20 seconds of every
three minutes) were averaged. These data were then transferred to sigma plot
(version 12.5) where oxygen curves were fitted for each climate using a
hyperbolic tangent function from Jassby and Platt et al., (1976). This function fits
well with the increases in photosynthesis, but does not account for photo-
inhibition.
Function: P = Pmax · tanh ( αI / Pmax )
3.3 Steady state measurements and analysis
3.3.1 77k
A sample of 1.5 ml was taken as soon as possible after sample collection and
placed into fluorometer cuvettes containing 1.5 ml of 60 % glycerol and flash
frozen in liquid nitrogen (stored in -80°C). Samples were analysed through a
spectrofluorometer (OLIS DM45) at 77K (in liquid nitrogen). Excitations of 440
nm and 590 nm (corresponding to Chla and PBS pigment) with emission spectra
of 600-750 nm and 630-750 nm, respectively were recorded and used to
determine the distribution of free PBS and Chla/PBS attached to the different
photosystems (PSI and PSII). The area under the emission peak was calculated
11
from the procuct of the peak’s height and its half-height width. These values
were then used to show the ratio of PBS and Chla.
3.3.2 Chlorophyll extraction
Two 2 ml of sample were centrifuged at 14000 rpm for 5 minutes at 4°C (HAWK
15/05 MSE), supernatant was removed. To the remaining pellet, 1.6 ml of 90 %
acetone and 0.4 ml DMSO were added. The samples were vortexed (VWR
analogue vortex mixer) at maximum speed for 1 minute until the pellets were
dissolved and then stored in the refrigerator (4°C) for 10 minutes. The samples
were then re-vortexed and centrifuged (14000 rpm, 5 minutes, 4°C) again.
Samples were then analysed in cuvettes and read on a spectrophotometer
(Pharmacia LKB Novaspec II) at 663 nm. The formula used to calculate the
concentration of chlorophyll was:
Chla (mg/L) = 12.7 * [A663]
3.3.3 Cell counts/biovolume
A 1 ml sample was added to three bottles containing 10 ml of casyton. This was
then further diluted by adding 100 μl to three new bottles containing 10 ml
castyton. Samples were analysed on a CASY 1 TTC cell counter with a 60 µm
capillary (Schärfe Systems GmbH, Reutlingen, Germany). Blanks were subtracted
from the total counts
3.3.4 Western Immuno-blots
50 ml of sample was placed into a 50 ml tube and centrifuged (Heffich
rotanta/RP) at 40000 rpm for 10 minutes at 4°C. Supernatant was removed and
5 ml of MES buffer solution was added to the pellet and centrifuged again. When
done the supernatant was removed and MES solution was added until 5 ml total
volume was reached. The treated samples were stored at -20°C. Samples were
then French pressed (American instrument company) to break the cell walls.
3.3.4.1 BCA Protein assay
A protein assay was done before the gels to calculate the amount of protein
within each sample. A 1 ml sample was centrifuged at 14000 rpm for 2 minutes
at 4°C. 10 mg/ml BSA (bovine serum albumin) was used as a protein standard (5,
2, 1, 0.5, 0.2, 0.1, 0.05, 0.02 and 0 mg BSA/ml). 100 μl of BSA standards and the
supernatant of the samples were placed into a 96 well plate (Costar 96 wells falt
bottom plate) and read on a Microtiter plate spectrophotometer at 595 nm
(molecular devices VesaMax tunable microplate reader). Values were then used
to make sure all samples had the same amount of protein for the gel.
3.3.4.2 SDS page gel (12%) preparation
A gel system was built (Bio-rad) using a large glass plate and a small glass plate,
making sure there was no leakage between the two glass plates.
12
Running gel: 2.6 ml ddH2O, 3.2 ml 30 % acrylamide, 2 ml 1.5 M Tris (pH 8.8), 80
μl 10 % SDS, 80 μl 10 % APS (ammonium persulphate) and 8 μl of TEMED were
mixed together. The solution was then poured between the two glass plates and
a small layer of n-butanol was added on top to prevent air bubbles and to keep
the top of the gel flat. The gel was then left to polymerise and the n-butanol was
removed using filter paper.
Stacking gel: 3 ml ddH2O, 0.67 ml 30 % acrylamide, 1.25 ml 0.5 M Tris (pH 6.8),
50 μl 10 % SDS, 50 μl 10 % APS and 5 μl TEMED. This solution was this added on
top of the running gel and a 15 well (1.5 mm) Bio-Rad toothcomb was added into
the stacking gel and left to polymerise. Once the gel was fully polymerised, the
gel along with the two glass plates and toothcomb were transferred into a Bio-
Rad gel system. 1 X SDS buffer (25 mM tris, 192 mM glycine and 0.1 % SDS)
solution was used to fill the inside and outside chamber (making sure there was
no overflow between the two chambers) and the toothcomb was removed slowly
in order to keep well intact.
3.3.4.3 Protein sample for gel preparation
A 1 ml sample was centrifuged at 14000 rpm for 2 minutes at 4°C. The
supernatant was then transferred to an eppendorf tube where relevant samples
were diluted with MES to reach a total volume of 12 μl. To these samples 3 μl of
sample buffer were added and then left for 10 minutes on a 70°C heating block.
thereafter, the samples were centrifuged at 14000 rpm for 1 minute. 15 μl of
sample was then carefully pipetted into the wells of the gel, making sure to note
what sample went which well. A 3 μl protein standard was used as the ladder.
The gel was then run at 70 V for 2 hours
3.3.4.4 Western Immuno-Blot
14 pieces of 1 M filter paper were soaked in Towbin blot buffer (25 mM Tris, 192
mM glycine, 20 % methanol at pH 8.6). Some Towbin blot buffer was poured on
to the blot machines (Bio-Rad trans-blot SD semi-dry transfer cell) to make it
semi-dry, after which 7 of the pre-wetted filters were stacked on top of each
other in the machine. Here a nitrocellulose membrane (cut to gel size) was
placed on top of the filter pile and the gel, which was carefully removed from the
Bio-Rad gel system and the glass plates, was placed on top of the nitrocellulose
membrane. The rest of the pre-wetted filter papers were stacked on top and the
lid of the machine was closed. The proteins were transferred for 15 minutes at
15 V.
Once the proteins had transferred, the nitrocellulose membrane (blot) was
removed and washed with Tris buffered saline (10 mM tris and 50 mM NaCL, pH
7.6) (TBS) 0.05 % pH 7.6. It was then incubated with fresh TBS and 3 % BSA for
10 minutes (pour into tube for re-use), and rinsed again with TBS. To the tube of

13
TBS with 3 % BSA the primary antibody (1 : 25000 for Rbc1, PsbA and PsaC) was
added. This was then used to incubate the blot overnight. When finished, the blot
was rinsed with TBS twice and then incubated with TBS for 30 minutes. It was
then washed again and incubated again for 30 minutes with new TB and washed
again. A TBS solution with 1 % BSA was made and secondary anti-body (Goat
anti Rabbit peroxidase GARPO antibody 1 : 10000) and 0.5 ml of 0.05 % sodium
azide was added. This was poured over the blot and incubated for 1 hour. After
incubation the blot was washed twice with TBS.
1 ml of west femto peroxide buffer (supersignal) was added into a tray and 1 ml
of west femto luminol/enhancer solution was pipetted into the peroxide buffer
to equally mix the two. The blot was then placed face down into the solution and
the blot luminescence signals were measured on a Li-Cor Odyssey FC. The image
was then transferred to imageJ64 where the fluorescence signals can be turned
into peaks from which the relative density (fluorescence signal) can be
calculated and shown as PSI and PSII ratios.
IV. Results
4.1 Oxygen measurement results
Table 1: Light regimes used for oxygen evolution measurements. Orange
segments represent orange light (621 nm), red segments represent far-red (726
nm) and black (thinner) segments represent light ‘off’. The total length of line
corresponds to 100 µs.
Regime Number
R1
R2
R3
R4
R5
R6
Total orange
DC
0.2
0.2
0.2
0.2
0.17
0.1
Total far-red
DC
0.1
0.2
0.1 + 0.1
0.2
0.03
0.1
Total light
DC
0.3
0.4
0.4
0.2
0.2
0.2
Light diagram
14
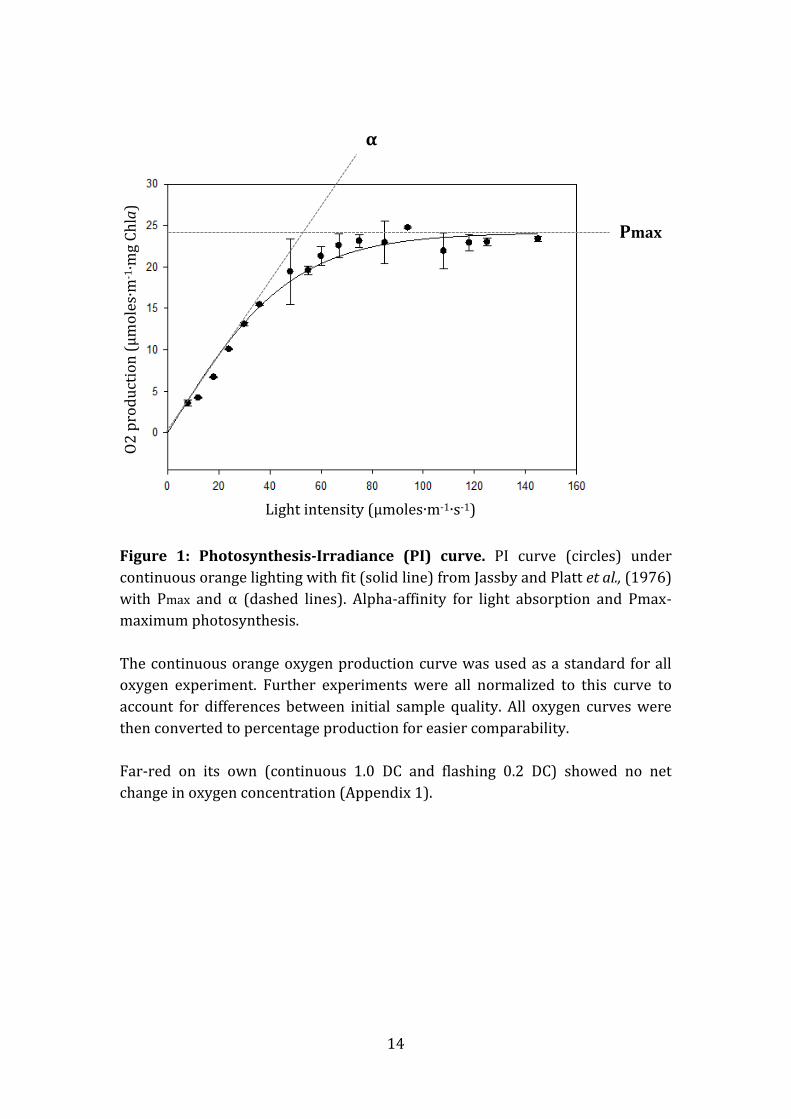
Figure 1: Photosynthesis-Irradiance (PI) curve. PI curve (circles) under
continuous orange lighting with fit (solid line) from Jassby and Platt et al., (1976)
with Pmax and α (dashed lines). Alpha-affinity for light absorption and Pmax-
maximum photosynthesis.
The continuous orange oxygen production curve was used as a standard for all
oxygen experiment. Further experiments were all normalized to this curve to
account for differences between initial sample quality. All oxygen curves were
then converted to percentage production for easier comparability.
Far-red on its own (continuous 1.0 DC and flashing 0.2 DC) showed no net
change in oxygen concentration (Appendix 1).
O2
pro
du
ctio
n (
µm
ole
s∙m
-1∙m
g C
hla
)
Light intensity (µmoles∙m-1∙s-1)
α
Pmax

15
Duty cycle, intensity and frequency were altered to find the most productive light
climate in regards to oxygen production (figure 2 above). Flashing orange (0.2
DC) gave a higher oxygen production (120 %) compared to continuous orange
(1.0 DC) (100 %). R1 (0.2 DC orange + 0.1 DC orange) on average had four
climates that surpassed flashing orange (0.2 DC) P value (with addition of 18.9,
24.9, 52 and 558 µmoles∙m-2∙s-1 far-red). Within R1 adding a little far-red shows
020406080
100120140160180200220
Or
- 0
.15
DC
49
.2
62
.3
75
.4
88
.5
31
.4
37
.8
43
.8
49
.8
55
.8
61
.8
R2 R3
. . . .
O2 p
rod
uct
ion
(%
) R2 R3
020406080
100120140160180200220
O
r -
1.0
DC
Or
- 0
.2 D
C
Or
- 0
.1 D
C
18
.9
24
.9
30
.9 43
49
52
55
R1
. . . . .
O2 p
rod
uct
ion
(%
)
R1
020406080
100120140160180200220
Or
- 0
.17
DC
* 3
.8
4.7
5.7
6.6
7.5
8.4
9.3 11
24
.9R5 R6
. . . .
O2 p
rod
uct
ion
(%
)
R5 R6
020406080
100120140160180200220
O
r -
1.0
DC
Or
- 0
.2 D
C
49
.2
62
.3
75
.4 95
10
1.6
11
4.7
12
1.1
12
7.8
R4
. . . .
O2 p
rod
uct
ion
(%
)
R4
Figure 2: Pmax (P) values from hyperbolic tangent function (Jassby and Platt
et al., 1976) for different light climate, all at frequency of 10 KHz.
Represented as % increase from continuous orange light (Or – 1.0 DC). Each
bar represents a single PI curve. Solid black line indicates Or-1.0 DC orange control
P value (set to 100 %). Dashed line indicates Or - 0.2 DC orange control P value. Or-
orange only accompanied by duty cycle used. R- light routine corresponding with
figure 1. Values under the bars of the R-light routines are the μmol∙m-2∙s-1 of far-
red added to the routine. Error bars show the standard error of the mean. *Climate
with highest production Pmax value).
R1 R2 R3
R4 R5 R6

16
promising oxygen production as both the smallest and largest amount of far-red
added showed similar oxygen production values. A slight decrease at the
addition of 30.9, 43 and 49 µmoles∙m-2∙s-1 can be seen. Flashing orange of 0.1 DC
surpassed flashing orange of 0.2 DC in maximum oxygen production although
only with a 10 % increase. In 2B both R2 (0.2 DC orange and 0.2 DC far-red) and
R3 (0.1 DC far-red + 0.2 DC orange + 0.1 DC far-red) showed lower oxygen
production compared to other climates.
In figure 2C, R4 (0.2 DC orange + 0.2 DC far-red together, no delay) had the
highest oxygen production values 147 % and 142 % were both towards at the
latter side of far-red addition 121.1 and 127.8 µmoles∙m-2∙s-1 far-red,
respectively. The rest of R4 stayed level slightly exceeding flashing orange 0.2
DC. In 2D flashing orange of even smaller DC (0.17 DC) only showed an increase
of 11 % compared to continuous orange. R5 (0.17 DC orange + 0.03 DC far-red)
showed on average much higher oxygen production compared to other routines.
The highest oxygen production was with the addition of 3.8 µmoles∙m-2∙s-1 far-
red (33 % increase compared to 0.2 DC flashing orange). No concentration
dependent relation was found between additions of far-red in routines. Both R1
and R5 show a similar pattern with a decrease in the mid-range of far-red while
both lower and higher ranges of far-red give on average the same oxygen
production.

17
When switching from continuous orange light (1.0 DC) to flashing orange light
(0.2 DC) an increase in α value can be seen. All other climates showed a higher α
value than continuous orange (100 %) but none exceeded that of flashing orange
(153 % increase).
0
20
40
60
80
100
120
140
160
180O
r -
1.0
DC
Or
- 0
.2 D
C
Or
- 0
.1 D
C
18
.9 -
30
.9
49
.2 -
88
.5
31
.4 -
61
.8
49
.2 -
12
7.8
3.8
- 1
1
24
.9R1 R2 R3 R4 R5 R6
. . . . . . . . .
slo
pe
(%
)
R1 R2 R3 R4 R5 R6
Figure 3: Average α value per climate (from hyperbolic tangent function,
Jassby and Platt et al., 1976) for different light climate, all at frequency of
10Khz. Solid black line indicates Or-1.0 DC orange control slope (α) value (set to
100 %). Dashed line indicates Or - 0.2 DC orange control α value. Or-orange only
accompanied by duty cycle used. R- light routine corresponding with figure 1.
Values under the bars indicate intensity range of µmoles∙m-2∙s-1 of far-red added.
Error bars show the standard error of the mean.
R1 R2 R3
R4 R5 R6

18
4.2 Steady state results
4.2.1 Bio-volume
Figure 4: Bio-volume of cells A) WT Synechocystis (averaged), B) flv4Δ and
isiAΔ Synechocystis for different light climates. Total light intensity on
average: a = 30 µmoles∙m-2∙s-1, b = 10 µmoles∙m-2∙s-1, c = 15 µmoles∙m-2∙s-1, d = 24
µmoles∙m-2∙s-1, e = 7 µmoles∙m-2∙s-1,* = best climate from O2 measurements figure
2 (R5 – 3.8). Or – orange and f-red – far-red. noD - no delay in far-red (light ‘on’
together).
Although the error is high in flashing orange light (0.2 DC) (A) it shows a higher
bio-volume compared to that of continuous light (1.0 DC). While both
aforementioned climates decreased with addition of far-red (no delay) the same
trend was seen as with orange only, flashing (0.2 DC) had the larger bio-volume.
In climate R5 - 3.8 the biovolume was similar to that of flashing (0.2 DC). When
looking at mutant strains (B) flv4Δ, continuous orange showed the lowest bio-
volume of just 15.09 mm3∙L-1. When the climate changed to flashing (0.2 DC)
biovolume increased by 337 mm3∙L-1. Flv4Δ R5 - 3.8 showed a slight decrease in
biovolume compared to the latter climate. The isiAΔ mutant showed an increase
in biovolume from continuous (126 mm3∙L-1) to R5 - 3.8 (430 mm3∙L-1), which
was the highest biomass produced by both mutants, although R5 - 3.8 (A)
showed the highest biomass of all climates.
0,000
100,000
200,000
300,000
400,000
500,000
600,000
700,000
800,000
900,000
Or 1.0 DCᵃ
Or + f-red 1.0 DC (noD)ᵃ
Or 0.2 DCᵃ
Or + f-red 0.2 DC (noD)ᵃ
R5-3.8*ᵈ flv4Δ Or 1.0 DCᵇ
flv4Δ Or 0.2 DCᶜ
flv4Δ R5-3.8*ᵈ
x
IsiAΔ Or 1.0 DCᵉ
IsiAΔ R5-3.8*ᵈ
Bio
vo
lum
e (
mm
3∙L
-1)
B A
R5

19
4.2.2 Ratio of Chla and PBS
Figure 5: Relative ratio of Chla (440 nm emission) in PSI (purple) and PSII
(orange) as well as relative ratio of unbound PBS (590 nm emission) (blue),
PSI - bound PBS (green) and PSII - bound (red) for wild type (WT)
Synechocystis in different light climates (averaged). Ratio calculated using
area of peaks. Total light intensity on average: a = 30 µmoles∙m-2∙s-1, * = best
climate from O2 measurements figure 2 (R5 - 3.8). noD - no delay in far-red (light
‘on’ together). Or – orange and f-red – far-red. Based on 77K fluorescence.
When looking at the distribution of Chla there isn’t much difference between the
five light climates (<5 %). PSI for all climates contained the majority of Chla
while the Chla associated with PSII remained between 7-10 % giving a ChlaPSI :
ChlaPSII ratio of 9-12 : 1, based on figure above.
In continuous orange light (1.0 DC) the PBS ratio is 2 : 1 : 1 (PSI, PSII and free
floating respectively and from this point on). When far-red light is added no
difference in PBS binding was seen (<5 %). Comparing continuous orange and
flashing orange (0.2 DC) an 8 % increase was seen in PBS attached to PSI while
both the PSII and free PBS showed no difference (<5 %).
When far-red is added to flashing orange (0.2 DC) an increase in PBS bound to
PSII increase (105 %) while those attached to PSI and free decrease by 6 %. In
R5 - 3.8, 62 % of the PBS were attached to PSI (highest PSI bound out of all wild
types) with a ratio of 4 : 1.5 : 1. As a whole, nearly half of all the PBS were
attached to PSI.
R5 - 3.8*d Or – 1.0 DCa Or – 0.2 DCa
Or + f-red 1.0 DC (noD)a Or + f-red 0.2 DC (noD)a
R5

20
Figure 6: Relative ratio of Chla (440 nm emission) in PSI (purple) and PSII
(orange) as well as relative ratio of unbound PBS (590 nm emission) (blue),
PSI-bound PBS (green) and PSII-bound (red) for flv4Δ and isiAΔ
Synechocystis in different light climates. Ratio calculated using area of peaks.
Total light intensity on average: b = 10 µmoles∙m-2∙s-1, c = 15 µmoles∙m-2∙s-1, d = 24
µmoles∙m-2∙s-1, e = 7 µmoles∙m-2∙s-1,* = best climate from O2 measurements figure
2 (R5 - 3.8). Or – orange. Based on 77K fluorescence.
Flv4Δ under continuous orange light (1.0 DC) showed a difference of 17 % in PSII
Chla fluorescence compared to flashing light (0.2 DC orange). Chla fluorescence
for all other mutant climates showed the same ratio as wild type.
440nm fluorescence in PSI accounted for 75 % of Chla giving a ChlaPSI : ChlaPSII
ratio of 3 : 1 in continuous orange but when the climate was switched to flashing
(0.2) it increased to 89 % (8 : 1). In R5 - 3.8 it increased slight further by 3 % (12
: 1). The isiAΔ mutant had a ratio of 8 : 1 in continuous orange light which
increased to 12 : 1 in the R5 – 3.8 climate.
Free-floating PBS in continuous orange accounted for 56 % of the total PBS with
only 17 % and 28 % in PSI and PSII respectively. However in flashing orange (0.2
DC) a shift occurred where a decrease in free PBS was seen (down to 31 %) and
PSI bound PBS increased to 44 %. PBS attached to PSII remained similar with
only a 3 % decrease in flashing orange (0.2 DC). In R5 - 3.8 however an increase
to 50 % of PBS attached to PSI was seen while PSII bound PBS increased by 4 %
and free floating PBS decreased to 21 %. Free floating PBS decreased along the
Flv4Δ climates (continuous, flashing (0.2 DC) and R5 - 3.8). The isiAΔ mutant in
continuous orange showed a ratio of 1 : 1 : 1. When flashing light was
implemented this changed to 1 : 1.5 : 3. Here both PSII and free PBS decreased
increasing the binding to PSI. This climate also had the lowest free floating PBS
within the mutant climates.
flv4Δ Or – 1.0 DCb flv4Δ Or – 0.2 DCc flv4Δ R5 - 3.8*d
isiAΔ Or – 1.0 DCe isiAΔ R5 - 3.8*d
R5

21
Figure 7: Chla concentrations A) WT Synechocystis (averaged), B) flv4Δ and
isiAΔ Synechocystis for different light climates. Total light intensity on
average: a = 30 µmoles∙m-2∙s-1, b = 10 µmoles∙m-2∙s-1, c = 15 µmoles∙m-2∙s-1, d = 24
µmoles∙m-2∙s-1, e = 7 µmoles∙m-2∙s-1, * = best climate from O2 measurements figure
2 (R5 -3.8), ** = Chla content under detection limit. Or – orange and f-red – far-
red. noD - no delay in far-red (light ‘on’ together).
Chla content of continuous orange (1.0 DC), continuous orange + f-red (1.0 DC)
and flashing orange and far-red (0.2 DC) showed similar amounts at around 2.9
mg∙L-1 (A) while that of flashing orange only (0.2 DC) was higher at 4.1 mg∙L-1. R5
– 3.8 contained the highest biovolume (with smallest error) at 3.1 mg∙L-1. The
mutants showed varied results (B) with Flv4Δ continuous orange having an
undetectable amount of Chla. When flashing light was added to Flv4Δ the Chla
increased to a similar amount as continuous orange and continuous orange + far-
red (approx. 2.6 mg∙L). The isiAΔ mutant showed the second lowest Chla content
although when in climate R5 – 3.8 increased form 1.4 to 2.2 mg∙L-1.
0
1
2
3
4
5
6
Or 1.0 DCᵃ
Or + f-red 1.0 DC (noD)ᵃ
Or 0.2 DCᵃ
Or + f-red 0.2 DC (noD)ᵃ
R5-3.8*ᵈ flv4Δ Or 1.0 DCᵇ**
flv4Δ Or 0.2 DCᶜ
flv4Δ R5-3.8*ᵈ
x
IsiAΔ Or 1.0 DCᵉ
IsiAΔ R5-3.8*ᵈ
Ch
loro
ph
yll
a (
mg
∙L-1
)
A B
R5

22
4.2.3 SDS page gel analysis
Figure 8: Western immuno-blot (inverted). Black bands on white
background for PSI and PSII sub-units WT Synechocystis for different light
climates (excluding R5 – 3.8). Total light intensity on average: a = 30 µmoles∙m-
2∙s-1, noD - no delay in far-red (light ‘on’ together). Or – orange and f-red – far-
red.
Figure 9: Quantitative ratio of PSI (purple) and PSII (orange) for wild type
(WT) synechocystis in different light climates (averaged), based on PSI -
PsbC and PSII - PsaA sub-units. Total light intensity on average: a = 30
µmoles∙m-2∙s-1. noD - no delay in far-red (light ‘on’ together). Or – orange and f-
red – far-red. Based on protein sub-units from averaged gels (figure 8). (No data
for WT R5 – 3.8).
Here similar to the relative ratio based from 77K fluorescence, PSI is the most
numerous photosystem. Flashing orange light (flashing orange 0.2 DC) shows an
increase of 5 % in PSII compared to continuous orange (1.0 DC). However,
addition of far-red light in both conditions decreased the amount of PSII sub-
units by 5 and 6 %, respectively. Flashing orange (0.2 DC) had the most sub-units
of PSII.
Or – 1.0 DCa
Or + f-red 1.0 DC (noD)a
Or – 0.2 DCa
Or + f-red 0.2 DC (noD)a
1) Protein standards (PSI and PSII)
2) Or – 1.0 DCᵃ
3) Or + f-red – 1.0 DC (noD)ᵃ
4) Or – 0.2 DCᵃ
5) Or + f-red – 0.2DC (noD)ᵃ
1 2 3 4 5
PSII PSI

23
V. Discussion
5.1 Oxygen measurements:
In photosynthesis there is oxygen production, through PSII water splitting and
consumption by Mehler and Mehler-like reactions (Bersanini et al., 2014).
Therefore the oxygen measured through the optodes is the NET oxygen
production. The optodes used here aren’t able to differentiate between oxygen
production and oxygen consumption through respiration and Mehler-like
reactions. In future studies, if differentiation of the two oxygen forms is wanted,
a MIMS (membrane inlet mass spectrometer) can be used alongside heavy
oxygen (18O).
5.1.1 Pmax values: continuous vs flashing
Switching to flashing light routine as opposed to continuous light increases the
maximum photosynthetic rate. As seen in figure 2, flashing orange light (0.2 DC)
increased the Pmax by 20 % and even by 28 % in shorter flashes (0.1 DC). This
shows flashing light to be a step in the right direction for increasing productivity
of PBRs. In continuous orange the amount of excited electrons compared to
available PQ is high, this build-up of excited electron forces energy to be used in
NPQ mechanisms. When that isn’t enough to decrease the excess excitation then
photo-inhibition occurs (through ROS) (Krashnakumar et al., 2013; Lambrev et
al., 2012 and Muller et al., 2001).
Photo-inhibition causes irreversibly damage to the photosystem proteins and
thus no oxygen splitting can occur causing the oxygen levels to decrease. New
proteins must be synthesised which is extremely inefficient. When flashing light
is incorporated into lighting regimes the ratio of excited electrons to PQ is higher
and the problem of over excitation is alleviated. The short flash and subsequent
dark period allows for PQ to transfer excited electrons to cytochrome b/f
complex where they have time to complete the reactions to PSI which
replenishes the PQ pool for the subsequent flash therefor decreasing photo-
inhibition as well as the need for NPQ mechanisms (Krashnakumar et al., 2013;
Lunka and Bayless, 2013; Matthijs et a., 1996). In 0.15 DC flashing orange the
Pmax decreased to below the level of continuous orange (1.0 DC), this cannot be
explained.
5.1.2 Pmax values: orange vs orange + far-red
When far-red light is added to flashing orange light a further increase in Pmax is
observed, although this is depends on the lighting pattern used. Climates R1, R4,
R5 and R6 (figure 2A, C and D) showed similar or higher Pmax values compared
Or – 0.2 DC while climates R2 and R3 which on average remained below the
percentage of flashing (0.2 DC). R1, R4 and R5 although average oxygen
production was slightly higher than Or – 0.2 DC the range of far-red intensities

24
made little difference in O2 production. This shows that adding just a small
amount of far-red can be beneficial for increasing photosynthetic rate and
provide the desired results. In both R1 and R5 decreases can be seen within the
mid-range intensity of additional far-red (Figure 2A and D) that shows the NPQ
action of state transitions.
State transition, as mentioned before, is the change from the high proportion of
excitation energy governed by PBS from PSII to PSI (Yang S et al., 2009 and
McConnell et al., 2002). Here PBS detach from their PSII-coupled state and move
to PSI (PSI-bound) equalizing the excitation of PSII (Mullineaux and Allen, 1990).
In singular PI curves when state transitions are apparent, the Pmax is affected
showing a lower value due to the skewed curve fit of Jassby and Platt (1976).
This happens because when the de-coupling of PBS-PSII takes place, there are
fewer antennas available for light harvesting in PSII resulting in a decrease in
excitation within PSII thus less O2 production. This produces a sigmoidal oxygen
curve and it is this sigmoidal section that causes the curve fit to skew towards a
lower value.
5.1.3 Pmax values: colour arrangement, DCs and dark periods
R2 and R3 climates on average showed the least oxygen production with an
average increase of only 10 % and 1.5 %. Both these climates had the largest
total light duty cycle decreasing the length of the dark period (no light). This
shows that the dark period needs to remain at least 70 % of the total light flash
to increase productivity, due to the time scale difference of the cytochrome b/f
complex.
The light independent reaction (Calvin cycle – carbon fixation) also benefits from
this dark period (Takagi et al., 2014 and Matthijs et al., 1996). The R1 oxygen
production is much higher than that of R3 while the climates are very similar,
except for the additional 0.1 DC of far-red at the beginning of the flash in R3. This
shows the importance of stimulating PSII first prior to PSI although this
difference could be due to the decrease in dark time in R3.
As previously mentioned the stimulation of PSII in the light climate produces
more oxygen when stimulated first in the series. Although R4 stimulates both
PSII and PSI at the same time, this too shows oxygen production not be at its full
capability, although better than R2 which shows the same average photon flux
density of both orange and far-red (far-red -49.2, 62.3 and 75.4). This is most
likely due to small amounts increasing the efficiency without the need to cause
state transitions. Any moment where PBSs are not bound to either photosystem
is inefficient. If small amounts of far-red increase the PSIII binding of free-
floating PBS there is no need to increase the far-red intensity further as state
transition causing PBS to un-bind therefore becoming free-floating for a period

25
of time (inefficient). DC of far-red also plays an important key factor showing to
be effective when half or less than half of the preceding orange DC. This can be
due to PSI working faster than PSII (although still within the nanosecond range)
and therefore receiving an extra ‘boost ‘of light in the far-red spectrum
specifically for PSI.
5.1.4 α Values
Continuous orange light (1.0 DC) showed the lowest α value (slope) of all light
climates (figure 3). When flashing light is used instead of continuous the slope of
the fitted curve increased by 53 %. This shows that flashing light increases the
affinity for light absorption. This is because unlike continuous light where light
energy may be lost through NPQ and photo-inhibition, flashing light allows for
the majority of the light energy to be absorbed and used for photosynthetic
processes (light efficiency).
The slope for all climates was higher than continuous orange (minimum increase
of 21 % in R1 and flashing 0.1 DC orange). In Schuurmans et al., (2014) they
found that with the addition of far-red to orange light (125 µmoles∙m-2∙s-1), both
the Pmax and α increased compared to orange light alone (100 µmoles∙m-2∙s-1).
However, with the addition of far-red in this study, the photon flux increase
caused the Pmax to be apparent at a lower intensity shifting the slope of the curve
to less than 15 µmoles∙m-2∙s-1 for which only one or two sample points were
available. This caused most of the PI curves to show a flatter curve than in both
the standard (continuous orange, figure1) and flashing orange (0.2 DC).
5.1.5 Oxygen measurement conclusions
Flashing light increases the oxygen production (Pmax) as well as the slope ( )
while far-red addition shows only an increase in slope (α). From this section we
conclude that flashing mono colour (orange) light is beneficial, up to 28 % more
productivity (oxygen production) and the addition of even a small amount of far-
red increases the productivity even more. For climates to be effective the
positioning of the far-red pulse must go behind the orange pulse as well as the
far-red pulse (DC) to be 50 % or less of the orange pulse. But most importantly,
the dark period needs to be at least 70 % of the total flash.
5.2 Steady state measurements
5.2.1 Biovolume
5.2.1.1 Wild type Synechocystis
In this study biovolume was used a measure as productivity. The biomass
increase from continuous orange (1.0 DC) to flashing orange (0.2 DC) is more
than 25 % (figure 4A) of continuous orange (although error is high). This fits
with theory that flashing light provides enough time for reaction centres to

26
become saturated with light and enough dark time to allow reactions to place
leading to an increase in light efficiency thus increasing the efficiency of carbon
fixation resulting in the formation of glucose to aid cell growth.
With the addition of far-red to the aforementioned climates, both show a
decrease in biovolume of around 54 mm3∙L-1. Showing far-red addition with no
delay to be disadvantageous in biomass production, even though flashing orange
+ far-red (0.2 DC) produced a higher biovolume then continuous orange and far-
red (1.0 DC). In R5 - 3.8 the biovolume was similar to flashing orange (0.2 DC)
although large standard error on flashing orange (0.2 DC) makes it difficult to
assess which climate is more efficient (productive).
5.2.1.2 isiA∆ and flv4∆ Synechocystis
In both flv4∆ and isiA∆, continuous orange showed the least biovolume of all
climates used (figure 4B). In flv4∆ the biomass was the lowest with 15 mm3∙L-1.
This shows flv4 in NPQ to be the most efficient quencher (Bersanini et al. 2014
and Simionata et al., 2013). When comparing 15 mm3∙L-1 with 353 mm3∙L-1 the
potential for reduced NPQ in flashing light (Or – 0.2 DC) becomes apparent. This
large increase shows how flashing light can reduce over saturation and increase
the low ratio of excited electrons and PQ. When far-red is added (R5 – 3.8) the
biomass does show a slight decreased although this difference is negligible.
With isiA∆ the same pattern was seen, although there is no flashing orange to
compare to, R5 – 3.8 showed a large increase (304 mm3∙L-1) in biovolume from
continuous orange. Here the importance of isiA∆ can be seen too. NPQ
mechanisms are able to account for nearly 80 % of the total flux dissipation,
which shows a great importance in continuous lighting (Simionata et al., 2013). A
high biovolume doesn’t necessarily mean that the climate produces light
efficiency (Gris et al., 2014) however when biomass is concerned for increase
production in a PBR scale a 0.2 DC or R5 - 3.8 (0.17 DC orange + 0.03 DC far-red
at 3.8 µmoles∙m-1∙s-1) would be of benefit. If production for cell content (oil,
ethanol, storage compounds) was the purpose, then optimal climates must be
carefully researched as far-red could produce smaller cells while showing an
increased growth rate (Schulze et al. 2014).
5.2.1.3 Conclusion of biovolume
Implantation of flashing regimes increases biovolume and has a stronger effect
that the addition of far-red. With no delay in far-red decreases in biovolume are
evident while preceding the orange flash increases biovolume, showing a time
dependent relation.
5.2.2 Chlorophyll a
With an excitation wavelength of 440 nm, emission at 680 – 695 nm shows the
amount of chlorophyll within PSII and emission between 710 - 730 nm show
27
chlorophyll fluorescence within PSI at a temperature of 77K. The majority of the
77K Chla fluorescence data showed PSI to be the dominant Chla carrier. In
literature the Chla ratio is around 90-150 (PSI) : 35-50 (PSII), giving a ChlaPSI :
ChlaPSII ratio range of 2-5 : 1 (Kopecna et al., 2012; Albertsson, 2001; McConnell
et al., 2002 and Van Thor et al., 1998). For this report we assume a mid-range
ChlaPSI : ChlaPSII ratio of 3 : 1, which is incorporated into the Chla fluorescence
(77k) data.
Like Chla ratios, the ratio of PSI : PSII is well documented in literature. The
concentration of PSI is greater than PSII giving an average ratio of 2.5 : 1 under
continuous white light. This ratio helps to maximise electron transfer from PSII
(Fraser et al., 2013 and Fuhrmann et al., 2009). Fujimori et al., (2005) and Folea
et al., (2008) showed that when using light specific towards PSII excitation an
increase in the PSI : PSII ratio can be seen from 2.5 – 4 : 1. Alternatively, light
specific towards PSI excitation decreased the ratio to as low as 1-1.5 : 1, PSI
being the variable component (Fraser et al., 2013; Fuhrmann et al., 2009;
Muramatsu et al., 2009 and Miskiewics et al., 2002).
5.2.2.1 Wild type Synechocystis
The amount (mg∙L-1) of Chla does not show much change within the first two
continuous climates (figure 7A), remaining around 2.7 mg∙L-1 contradictory to
the trends seen in literature which expect a decrease in [Chla] under high light
(continuous orange and far-red), in order to reduce light harvesting (Sfroza et al.,
2012; Fuhrmann et al. 2009; Murumatsu et al., 2009 and Miskiewics et al., 2002).
Sfroza et al., (2012) also showed that flashing light (integrated light), regardless
of frequency or durtation, produce higher amounts of Chla per cell. This doesn’t
correspond with our results as both continuous climates and flashing (0.2 DC
and R5 – 3.8) showed near similar values. This could be due to far-red light
increasing the synthesis of alternative pigments Chld and Chlf instead of Chla
(Gan et al.,2014).
Looking at the immune-blot (figure 9) a distinction in PSI : PSII ratio can be seen.
Continuous orange (2.5 : 1) decreased to 2 : 1 with the implementation of
flashing orange (0.2 DC). This is due to the improved efficiency of PSII requiring
less PSI to achieve the same maximum electron transfer. When far-red was
added to both climates an increase in PSI : PSII ratio could be seen (both 3 : 1)
contradicting literature that shows in environments of high light the PSI : PSII
ratio to decrease (Fraser et al., 2013; Fuhrmann et al., 2009; Murumatsu et al.,
2009 and Miskiewics et al., 2002). The decrease in ratio from continuous to
flashing, mentioned above, was not seen from continuous orange and far-red to
flashing orange and far-red (0.2 DC), showing far-red to have a greater effect on
PSI : PSII stoichiometry. It could be that far-red light stimulates PSI production
independent of a high light climate.

28
All climates showed a relatively high ChlaPSI : ChlaPSII fluorescence ratio (figure 5)
of around 3-4 : 1 coinciding with literature and the large PSI proportion in figure
9. Continuous orange showed the largest ratio 4 : 1 the R5 – 3.8 climate ratio was
3.3 : 1. Yet the trends from the immune-blot are not visible in the 77K
fluorescence data. One would expect a change in PSI : PSII ratio to show the same
change the ChlaPSI : ChlaPSII. This cannot be explained at this moment.
5.2.2.2 isiA∆ and flv4∆ Synechocystis
Total Chla concentration of mutant strains showed much more pronounced
differences in different climates, compared to wild type. Both flv4∆ and isiA∆
strains increased from continuous to flashing and R5 – 3.8, however in flv4∆ the
R5 – 3.8 climate showed a decrease in Chla concentration. flv4∆ in continuous
orange light was so low in total Chla that measurements were below the
detection limit of the OD reader. This extremely low value may be caused by the
lower ChlaPSI : ChlaPSII ratio (compared to all other climates) most probably due
to a sever decrease in PSI : PSII ratio as mentioned above (Hernandez-Prieto et
al., 2012; Fuhrmann et al. 2009; Murumatsu et al., 2009 and Miskiewics et al.,
2002).
The ChlaPSI : ChlaPSII ratio of flv4∆ saw increasing trends from continuous,
flashing and R5 – 3.8 (1 : 1, 2.6 : 1 and 4 : 1) and likewise from continuous to R5 –
3.8 in the isiA∆ strain (2.6 : 1 to 4 : 1). Both mutant R5 – 3.8 climates and
continuous orange WT showed a PSIChla : PSIIChla ratio of 4 : 1. Perhaps this ratio
of Chla produces less Chla in total. As 3-3.3 : 1 showed higher values. It is
possible that that isiA∆ in a flashing climate may produce a higher Chla
concentration (as seen in flv4∆) however due to time constraints the flashing
climate (0.2 DC) as well as an immune-blot was not investigated/prepared for
isiA∆. Therefore this ratio could be due to PSI : PSII ratio alterations.
5.2.2.3 Conclusions of Chla
Contrary to the literature, far-red light increased the PSI : PSII ratio, although
this study used dual colour illumination as apposed to single colour (in literature
mentioned above). Flashing orange only (0.2 DC) showed a decrease in PSI : PSII
ratio. This decrease was not seen between the continuous orange and far-red
and flashing orange with far-red (0.2 DC), showing far-red to have a greater
influence on photosystem stoichiometry and be time independent. Chla ratios
between the photosystems had little difference in wild type Synechocystis. In
both mutant strains however Chla fluorescence. Total Chla did increase with
through flashing light (orange 0,2 DC and R5 – 3.8) coinciding with Sfroza et al.,
(2012) although more pronounced in the mutant strains. Chla values are not
related to PSI : PSII or ChlaPSI : ChlaPSII ratios as no trends between parameters
can be seen.

29
5.2.3 Phycobilisomes
5.2.3.1 Wild type Synechocystis
The different light regimes show trends in PBS arrangement for wild-type
Synechocystis (figure 5). Specifically, flashing light increases PSI-bound PBS and
decreases unbound PBS, working to balance the excitations between the two
photosystems. In continuous orange light the ratio of PSI-bound to PSII-bound to
unbound PBS is kept at 2 : 1 : 1. (From this point on, the ratio of PSB bound
states is always expressed in this order). The emission wavelength of 590 nm
detects PBS, but it is possible that the first peak of fluorescence for unbound PBS
could be coupled with the fluorescence from the free floating pigment
phycocyanin (Joshua, 2005).
In continuous orange light more PBSs are needed in PSI to turn 636 nm radiation
into excitation energy at the reaction centres. PSII requires fewer PBSs, as here
flv4 - 2 combos, the unbound PBSs and OCPs (orange carotenoid proteins) assist
in energy dissipation. PSII still requires enough PBSs to prevent photo-inhibition,
however.
When the Synechocystis is switched from continuous light (Or 1.O DC) to flashing
light, the PSII-bound PBSs decrease, as the lighting conditions are less likely to
induce photo-inhibition. In such a case, fewer PBSs are needed for energy
dissipation, and they can be used elsewhere – as in PSI, which now needs to
harvest more light to equalize the excitation of PSII.
A similar phenomenon explains the opposite trend revealed in the change from
Or – 2.0 DC to R5 – 3.8. Because far-red light specifically targets PSI, the energy
flux available to PSI increases and an increase in PSII-bound PBSs then helps to
equalize the excitations between the photosystems (Allen and Nilsson, 1997).
5.2.3.2 isiA∆ and flv4∆ Synechocystis
The experiments with flv4∆ and isiA∆ show how important energy dissipation
mechanisms are. Under continuous orange light (flv4∆ Or – 1.0 DC) the ratio of
PBS is 0.3 : 0.5 : 1. A large portion of the unbound PBS is needed to dissipate the
excess energy due to the continuous illumination, although it is not known how
this happens. At the same time, PSII contains a higher proportion of PBSs than
PSI in order to prevent the formation of ROS (Foyer and Shigeoka, 2011 and Oort
et al. 2010).
Going from the continuous-light to the flashing-light regimes, and more
specifically with the addition of far-red, a decrease in unbound PBS shows the
increasing energy-efficiency of the regimes. For flv4∆, PSII binding increased

30
with the addition of far-red light – an effect that was also seen with wild-type
Synechocystis. For the isiA∆ mutatnt, the PSII binding decreased.
The isiAB operon is related to oxidative stress and iron deficiency. In B form it
replaces ferrodoxin, and in A form it can act as either a light harvester (full ring)
or a dissipater (empty ring). The lack of this protein leaves PSI more vulnerable
to over excitation (Kouril et al.2005). The increase in PSI binding of PBS could be
a way for isiA∆ to mimic either of the two functions of isiA. In R5 – 3.8 the
flashing light produces a favourable climate for PSII where PBSs are not needed.
On the other hand, the far-red addition leaves PSI vulnerable to over excitation.
In this case, PBS binds to PSI either to increase either energy dissipation or light
harvesting.
5.2.3.3 Conclusions of PBS
Flashing light causes more PBSs to bind to PSI, increasing the light harvesting
capacity to match that of PSII. Orange light has been shown to induce transitions
to state - 2 (PSI-bound PBS) (Li et al., 2004). This could explain why the majority
of PBS are bound to PSI. This also raises the question what PBS ratios will other
colours of light lean towards.
Far-red light increases the efficiency of PSI, meaning more PBSs have to couple
to PSII in order to balance the excitation energy between the two photosystems.
This coincides with the findings of Schuurmans et al. (2014) that showed how
adding far-red to the light regime increased the PBSs binding to PSII. Showing
the movement of PBS to be time dependent.
PBSs are known to move at a time scales of seconds to minutes, dependent on
the intensity and dosage of the light (Yang 2009). It may also be that the transfer
of a sample from chemostat to fluorimeter cuvette altered the original binding
site of the PBS.
5.4 Conclusion of steady states
From all the light climates with wild-type Synechocystis, R5 – 3.8 proved to be the
most productive. (This conclusion neglects Or – 0.2 DC, given its large standard
error). Biomass was 27 % larger than continuous orange. In the R5 – 3.8 regime,
the unbound PBSs were the lowest, allowing the majority of the PBS to function
in photosynthesis and harvest light for PSI or PSII. Chl a concentration, in
contrast, was the highest of all climates (3.1 mg∙L-1).
5.5 Lighting
Two types of LED panels were used in this study: LED2 pannels were used for
the chemostats while LED3 panels were used for the oxygen measurements. The
LED3 panel showed homogeneous irradiation while LED2 did not. For that
reason the chemostat units were kept at a distance of 15 cm away from LED2
31
source to maximize homogeneous irradiation. Far-red and orange lights were
chosen as they correspond to the pigments in PSI and PSII (Mullineux and Allen,
1990). In this study the amount of light was much lower than hoped for (as
decreasing DC gives a lower output).
Chemostats were illuminated with approximately 20 - 30 µmoles∙m-1∙s-1 for all
WT and mutants subjected to flashing-light regimes. Lower illumination was
needed for the mutants exposed to continuous illumination due to their photo-
sensitivity. Otherwise the measurements would have fallen under the detection
limit for most of the equipment used. In single-colour illumination
photosynthetic yield drops towards the end of the red spectrum because of the
unequal excitation of the photosystems (Pettai et al., 2005). With dual colour
(specifically orange and far-red) both photosystems can be equally excited either
simultaneously (as in R4 and Or + f-red 1.0 / 0.2DC) or in sequences.
VI. Summary
Artificial light used for large scale PBR does not have to shine continuously. It
can be switched on and off to correspond to the natural time scale of the
photosynthetic reactions. In such flashing light environments less energy (ATP)
is needed for photo-protective synthesis (Schuurmans et al., in prep). NPQ
mechanisms are triggered less frequently and the energy previously required
can use for more productive purposes (Calvin cycle or cell maintenance for
example). PBR based on flashing light regimes could therefor increase the
photosynthetic rate and the desired metabolic product (biomass/cell
content/expressed proteins) relative to those with continuous illumination
regimes (Brennan and Owende, 2010).
Not only does flashing light increase the photosynthetic efficiency of
Synechocystis but, due to the increased intensity needed to fulfil the amount of
light needed for photosynthesis, it also increases the proportion of Synechocystis
that are illuminated by the light (Lunka and Bayless, 2013 and Park and Lee,
2001). This helps to decrease self-shading of the cyanobacteria (a problem in
PBR design) and increase the biomass.
To attain high productivity within PBRs, whether it be for alcohol or lipids,
careful attention must be given to the light regime parameters (DC, light
intensity and frequency of the light and flashes). The parameters that produce
the largest concentration of the desired outcome product will vary from species
to species, as species tolerances will differ (Gris et al., 2014). The wrong value of
a single parameter can result in a production (bio-volume/cell content) decrease
(Sforza et al., 2012). The light environments chosen in this study are just a

32
fraction of the possible combinations. Further research on DC, intensity and
frequency of light and flashes are needed to gain a better picture of the optimal
light environments.
With the addition of far-red, a flashing-light environment becomes more
productive with equal excitation of both photosystems. Sudden decreases in
biomass may be seen when light climates are first altered, but after a
acclimatising period of two weeks increase in productivity becomes evident
(Gris et al., 2014).
Research pertaining to Chla, PBS placement and PSI and PSII units in
cyanobacteria exposed to flashing or coloured light is lacking. The three
parameters studied here are only a few of the many parameters used in
photosynthesis, making this area of study complicated. Future research in this
field would be of benefit to companies exploring photosynthetic approaches to,
for example, CO2 remediation and renewable energy
Flavodiiron proteins and isiA are important quenching mechanisms that only
serve to increase the production value of cyanobacteria (Pinchasov et al., 2005).
Under incorrect lighting regimes energy within cells is used to synthesis higher
concentrations of quenching molecules. Further studies on expression of both
quenching mechanisms could be of interest as well as electron microscopy to
allow determination of light harvesting or energy dissipating isiA rings. Adding
to that of course, immune-blots of all climate studied. On top of that, expression
and concentration of cytochrome b/f complex’s and PQ : Chla ratios may be of
interest as both these parameters increase electron flow (Miskiewics et al.,
2002).
The benefits of LED lighting compared to natural or other artificial lighting
(incandescent or fluorescent) are slowly being recognized. Although more
expensive in purchase (costing up to four times more than conventional lights),
the LEDs energy efficiency and working lifetime make label them a cost-effective
source of lighting for PBR (Matthijs et al., 1996, schuurmans et al., in prep).
33
VII. References
Albertsson P-A (2001) ‘A quantitative model of the domain structure of the
photosynthetic membrane’ Trends in plant science. 6 (8) 349-354
Angermayr S. A, Hellingwerf K. J, Lindblad P and De Mattos M. J. T (2011) ‘Energy
biotechnology with cyanobacteria’ current opinion in biotechnology. 20 (3) 257- 263
Bersanini L, Battchikova N, Jokel M, Rehman A, Vass I, Allahverdiyeva Y and Aro E-M
(2014) ‘Flavodiiron protein Flv2/Flv4-related photo protective mechanism dissipates
excitation pressure of PSII in cooperation with pycobilisomes in cyanobacteria’ Plant
physiology. 164 (2) 805-818
Cadoret J-C, Demouliere R, Lavaud J, Van Gorkom H. J, Houmard J and Etienne A-L
(2004) ‘Dissipation of excess energy triggered by blye light in cyanobacteria with
CP43 (isiA)’ Biochemica et biophysica acta. 1659 (1) 100-104
Checchetoo V, Teardo E, Carraretto L, Formentin E, Bergantino E, Giacometti G. M
and Szabo I ‘Regulation of photosynthesis by ion channels in cyanobacteria and
higher plants’ Bophical chemistry. 182 (SI) 51-57
Chen C. Y, Yeh K. L, Aisyah R, Lee D. J and Change J. S (2011) ‘Cultivation,
photobioreactor design and harvesting of microalgae for biodiesel production: a
critical review’ Bioresrouces and technology. 102 (1) 71-81
Cramer W. A, Zhang H, Yan J, Kurisu G and Smith J. L (2004) ‘Evolution of
photosytntheis: Time-independent structure of the cyrochrome b6f complex’ The
American chemical society. 43 (20) 5921-5929
Dang K-V, Plet J, Tolleter D, Jokel M, Cuine S, Carrier P, Auroy P, Richaud P, Johnson
X, Alric J, Allahverdiyeva Y and Peltier G (2014) ‘Combined increases in miochrondrial
cooperation and oxygen photreduction compensate for deficiency in cyclic electron
flow in chlamydomonas reinhardtii’The plant cell. 26 (7) 3036-3050
Emerson R and Arnold W (1932a) ‘A separation of the reaction in photosynthesis by
means of intermittent light’ The journal of general physiology. 16 (2) 191-205
Emerson R and Arnold W (1932b) ‘A separation of the reaction in photosynthesis by
means of intermittent light’ The journal of general physiology. 15 (4) 391-420

34
Folea I. M, Zhang P, Aro E-M and Boekema E. J (2008) ‘Domain organisation of
photosystem II in membranes of the cyanobacterium Synechocystis PCC 6803
investigated by electron microscopy’ FEBS letters. 582 (12) 1749-1754
Fuhrmann E, GathmannS, Rupprecht E, Golecki J and Schneider D (2009) ‘Thylakoid
membrane reduction affects the photosystem stoichiometry in the cyanobacterium
Synechocystis sp. PCC 6803’ Plant physiology. 149 (2) 735-744
Fujimori T, Higuchi M, Sato H, Aiba H, Muramatsu M, Hihara Y and Sonoike K (2005)
‘The mutant of sll1961 which encodes a putative transcriptional regulartor has a
defect in regulation of photosystem stoichemtetry in the cyanobacterium
Synechocystis sp. PCC 6803’ plant physiology. 139 (1) 408-416
Frazer J. M, Tulk S. E, Jeans J. A, Campbell D. A, Bibby T. S and Cockshutt A. M (2013)
‘Photophysiological and photosynthetic complex changes during iron starvation in
Synechocystis sp. PCC 6803 and Synechococcus elongates PCC 7942’ PLOS one. 8 (3)
1-11
Gris B, Morosinotto T, Giacometti G. M, Bertucco A and Sforza E (2014) ‘Cultivation
of Scenedesmus obliquus in photobioreactors: effcts of light intensities and light-dark
cycles on growth, productivity and biochemical composition’ Applied biochemistry
and biotechnology. 172 (5) 2377-2389
Grobbelaar J. U, Nedbal L and Tichy V (1996) ‘Influence of high frequency light/ark
fluctuations on photosynthetic characteristics of microalgae photo acclimated to
different light intensities and implications for mass algal cultivation’ Journal of
applied phycology. 8 (4-5) 335-343
Han F, Zhang S, Rockwell N. C, Martin S. S, Lagarias J. C and Bryant D. A (2014)
'Extensive remodeling of a cyanobacterial photosynthestic apparatus in far-red light'
Science. 345 (6202) 1312-1317
Hernandez-Prieto M. A, Tibiletti T, Abasova L, Kirilovsky D, Vass I and Funk C (2011)
‘The small CAB-like poteins of the cyanobacterium Synechocystis sp. PCC 6803: Their
involvement in chlorophull biogenesis for photosystem II’ Biochimica et biophysica
acta – bioenergetics. 1807 (9) 1143-1151
Hellingwerf K. J and De Mattos M. J. T (2009) ‘Alternative routes to biofulels: light-
driven biofuel formation from CO2 and water based on the ‘photonol’ approach’
Journal of biotechnology. 142 (1) 87-90
35
Helman Y, Tchernov D, Reinhold L, Shibata M, Ogawa T, Schwarz R, Ohad I and
Kaplan A (2003) ‘Genes encoding A-type flavoproteins are essential for
photoreduction of O2 in cyanobacteria’ current biology. 13 (3) 230-235
Huisman J, Matthijs H. C. P, Visser P. M, Balke H, Signon C. A. M, Passarge J, Weissing
F. J and Mur L. R (2002) ‘Principles of the light- limited chemostat: theory and
ecological application’ Antonie can leeuwenhoek. 81 : 117-13
Jassby A. D and Platt T (1976) ‘Mathematical formulation of the relationship
between photosynthesis and light for phytoplankton’ Limnology and oceanography.
21 (4) 540-547
Joshua S, Bailey S, Mann N. H and Mullineaux C. W (2005) ‘Involvement of
phycobilisomes diffusion in energy quenching in cyanobacteria’ Plant phycology. 138
(3) 1577-1585
Kato M. C, Hikisaka K, Hirotsu N, Makino A and Hirose T (2003) ‘The excess light
energy that is neither utilized in photosynthesis nor dissipated by photoprotective
mechanisms determines the rate of photoinactivation in photosystem II’ Plant cell
physiology. 44 (3) 318-325
Kok B (1956) ‘Photosynthesis in flashing light’ Biochemica et biophysica acta. 21 (2)
245-258
Kopecna J, Komenda J, Bucinska L and Sobotka R (2012) 'long term acclimation of the
cyanobacterium Synechocystis sp. PCC 6308 to high light is accompanied by an
enhancement production of chlorophyll that is preferentially channelled to trimeric
photosystem I' plant physiology. 160 (4) 2239-2250
Krishnakumar S, Guadana S. B, Wiswanathan G. A, Pakrasi H. B and Wangikar P. P
(2013) ‘Rhythm of carbon and nitrogen fixation in unicellular cyanobacteria under
turbulent and highly aerobic conditions’ Biotechnology and bioengineering. 110 (9)
2371 – 2379
Kouril R, Arteni A. A, Lax J, Yeremenko N, D’Haene S, Rogner M, Matthijs H. C. P,
Dekker J. P and Boekman E. J (2005) ‘Structure and functional role of
supercomplexes of isiA and photosystem I in cyanobacterial photosynthesis’ FEBS
letters. 579 (15) 3253-3257

36
Lambrev P. H, Miloslavina Y, Jahns P and Holzwarth A. R (2012) 'on the relationship
between non-photochemical quenching and photopetection of Photosystem II'
Biochimica et biophysica acta bioenergetics 1817 (5) 760-769
Laws E. A, Terry K. L, Wickman J and Chalup M. S (1983) ‘A simple algal production
system designed to utilize the flashing light effect’ Biotechnology and
bioengineering. 25 (10) 2391-2335
Li D, Xie J, Zhao J, Xia A, Li D and Gong Y (2004) ‘Light-induced excitation energy
redistribution in Spirulina platensis cells: ‘’spillover’’ or ‘’mobile PBS’’?’ Biochimica et
biophysica acta bioenergetics. 1608 (2-3) 114-121
Lunka A. A and Bayless D. J (2013) ‘effects of flashing light-emitting diodes on algal
biomass productivity’ Journal of applied phycology. 25 (6) 1679-1685
Ma W, Ogawa T, Shen Y and Mi H (2007) 'Changes in cyclic and respiratory electron
transport by the movement of phycobnilisomes in the cyanobacerium Synechocystis
sp. strain PCC 6803' Biochimica et biophysica acta bioenergetics 1767 (6) 742-749
Matthijs H. C. P, Balke H, Van Hes U. M, Kroon B. M. A, Mur L. R and Binot R. A (1996)
‘Application of light-emitting diodes in bioreactors: flashing light effects and energy
economy in algal culture (Chlorella prenoidosa)’ Biotechnology and bioengineering
50 (1) 98-107
McConnell M. D, Koop R, Vasil’ev S and Bruce D (2002) ‘Regulation of the distribution
of chlorophyll and phycobilin-absorbed excitation energy in cyanobacteria. A
structure based model for the light state transition’ Plant physiology. 130 (3) 1201-
1212
Melis A, Neidhardt J and Benemann J. R (1998) ‘Dunaliella salina (chlorophyta) with
small chlorophyll antenna sizes exhibit higher photosynthetic productivities and
photon use efficiencies than normally pigmented cells’ Journal of applied phycology.
10 (6) 515-525
Miskiewics E, Ivanov A. G and Huner N. P. A (2002) ‘Stoichiometry of the
photosynthetic apparatus and phycobilisome structure of the cyanobacterium
Plectonema boryanum UTEX 485 are regulated by both light and temperature’ Plant
physiology. 130 (3) 1414-1425

37
Mohsenpour S. F, Richards B and Willoughby N (2012) ‘Spectral conversion of light
for enhanced microalgae growth rates and photosynthetic pigment production’
Bioresource technology 125 (1) 75-81
Muller P, Li X-P and Niyogi K. K (2001) 'Non-photochemical quenching. A response to
excess light energy' American society of plant physiologists. 125 (4) 1558-1566
Mullineaux C. W and Allen J. F (1990) ‘state 1- state 2 transitiaon in the
cyanobacterium Synechococcus 6301 are controlled by the redox state of electron
carriers between photosystem 1 and 2’ Photosynthesis research. 23 (3) 297-311
Muramatrsu M, Sonoike K and Hihara Y (2009) ‘Mechanisms of down regulation of
photosystem I content under high-light conditions in the cyanobacterium
Synechocystis sp. PCC 6803’ microbiology. 155 (3) 989-996
Park K. H and Lee C. G (2001) ‘Effectiveness of flashing light for increasing
photosynthetic efficiency of microalgal cultures over a critical cell density’
Biotechnology and bioprocess engineering. 6 (3) 189-193
Pattai H, Oja V, Freiberg A and Laisk A (2005) ‘Photosynthetic activity of far-red light
in green plants’ Biochimica et biophysica acta. 1708 (3) 311-321
Phillips J. N and Myers J (1954) ‘Growth rate of chlorella in flashing light’ Plant
physiology. 29 (2) 152-161
Pinchasov Y, Kotliarevsky D, Dubinsky Z, Mauzerall D. C and Feitelson K (2005)
‘Photoacoustics as a diagnostic tool for probing the physiological status of
phytoplankton’ Israel journal of plant science. 53 (1) 1-10
Roberty S, Bailleul B, Berne N, Franck F and Cardol P (2014) ‘Mehler reaction is the
main alternative photosynthetic electron pathway in Symbiodinium sp., symbiotic
dinoflagellates of cnidarians’ New phytologist. 204 (1) 81-91
Runkle E. S and Heins R. D (2001) ‘Specific functions of red, far red and blue light in
flowering and stem extension of long-day plants’ Journal of the American socicity of
horticultous science. 126 (3) 275-282
Sanchez-Saavedra M. P, Jimenez C and Figueroa F. L (1996) ‘Far-red light inhibits
growth but romotes carotenoid accumulation in the green microalga Dunaliella
bardawil’ Physiologica plantarum. 98 (2) 419-423

38
Sforza E, Simionato D, Giacometti G. M, Bertucco A and Morosinotto T (2012)
‘Adjusted light and dark cycles can optimize photosynthetic efficiency in algae
growing in photobioreactors’ Plos one. 7 (6) 1-10
Schulze P. S. C, Barreira L. A, Pereira H. G. C, Perales J. A and Varela J. C. S (2014)
‘Light emitting diodes (LEDs) applied to microalgal production’ Trends in
biotechnology. 32 (8) 422-429
Schuurmans J. M, Schuurmans R. M and Matthijs H. C. P (in prep) ‘Defining LED
lighting modes for improved phototropic growth’
Schuurmans R. M, Schuurmans J. M, Bekker M, Kromkamp J. C, Matthijs H. C. P and
Hellingwerf K. J (2014) ‘The redox potential of the plastoquinone pool or the
cyanobacterium Synechocystis species strain PCC 6803 is under strict homeostatic
control’ Plant physiology. 165 (1) 463-475
Simionato D, Basso S, Giacometti G. M and Morosinotto T (2014) ‘Optimization of
light use efficiency for biofuel production in algae’ biophysical chemistry. 182 (SI) 71-
78
Slade R and Bauen A (2013) ‘micro-algae cultivation for biofuels: cost, energy
balance, environmental impacts and future prospects’ Biomass and bioenergy. 53
(SI) 29-38
Stroebel D, Choquet Y, Popot J-L and Picot D (2003) ‘An atypical haem in the
cyrochrome b6f complex’ Nature. 426 (6965) 413-418
Terry K. L (1986) ‘photosynthesis in modulated light – quantitative dependence of
photosynthetic enhancement on flashing rate’ Biotechnology and bioengineering. 28
(7) 988-995
Van Thor, J. J, Mullineaux C. W, Matthijs H. C. P and Hellingwerf K. J (1998) ‘Light
harvesting and state transitions in cyanobacteria’ Botanica acta. 111 (6) 430-443
Vejrazka C, Janssen M, Streefland M and Wijffels R. H (2011) ‘Photosynthetic
efficiency of Chlamydomonas reinhardtii in flashing light’ Biotechnology and
bioengineering. 108 (12) 2905-2913
Yang S, Zhang R, Hu C, Xie J and Zhao J (2009) 'The dynamic bhaviour of
phycobilisome movement during light state transitions in cyanobacerium
Synechocystis PCC6803' Photosynthesis research 99 (2) 99-106

39
Yeremenko N, Kouril R, Ihalainen J. A, D’Haene S, Van Oosterwijk N,
Andrizhiyevskaya E. G, Keegstra W, Dekker H. L, Hagemann M, Boekema E. J,
Matthijs H. C. P and Dekker J. P (2004) ‘Supramolecular organization and dual
function of the IsiA chlorophyll-binding protein in cyanobacteria’ Biochemistry. 43
(32) 10308-10313
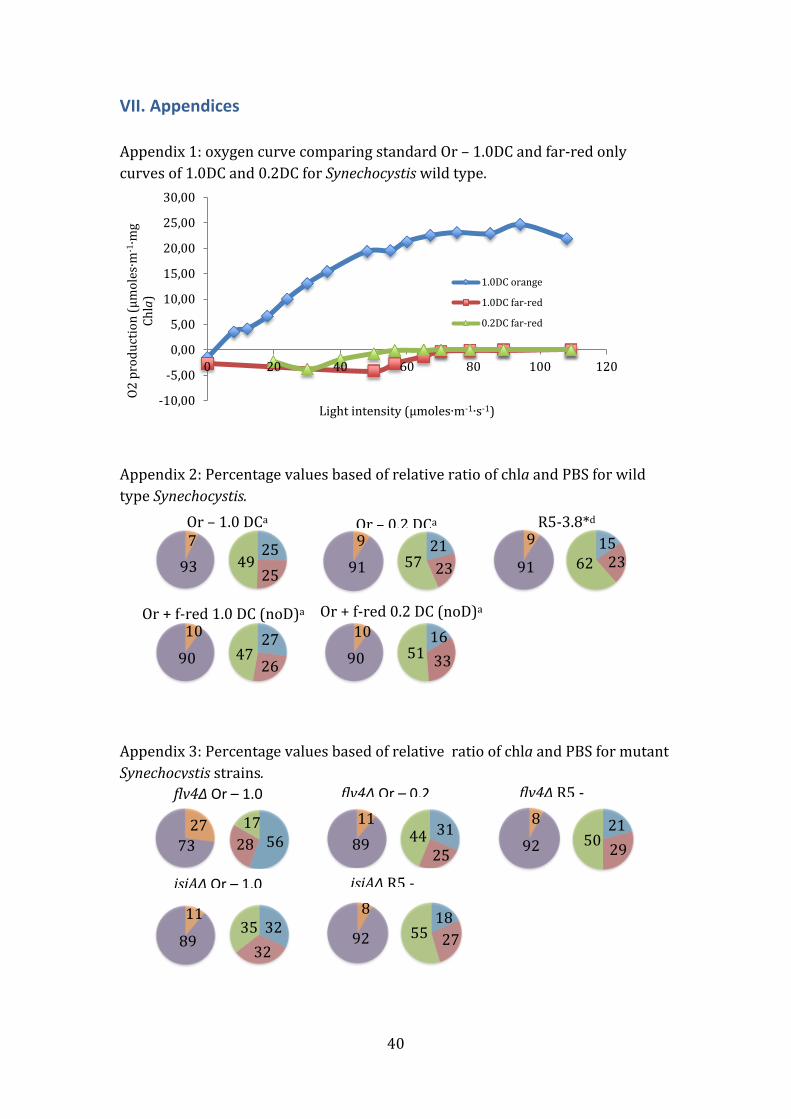
40
VII. Appendices
Appendix 1: oxygen curve comparing standard Or – 1.0DC and far-red only
curves of 1.0DC and 0.2DC for Synechocystis wild type.
Appendix 2: Percentage values based of relative ratio of chla and PBS for wild
type Synechocystis.
Appendix 3: Percentage values based of relative ratio of chla and PBS for mutant
Synechocystis strains.
25
26
15 23
62
21 57
23
25 49
47
33
27 51
16
9
10
90
91
7
93 91
9
90
10
Or – 1.0 DCa Or – 0.2 DCa
Or + f-red 1.0 DC (noD)a Or + f-red 0.2 DC (noD)a
R5-3.8*d
73
27 89
11
92
8
89
11
92
8
29
21 50
31
44 25
56
28
17
32
55
27
18
35 32
flv4Δ Or – 1.0 DCb
flv4Δ Or – 0.2 DCc
isiAΔ Or – 1.0 DCe
isiAΔ R5 -
flv4Δ R5 -
-10,00
-5,00
0,00
5,00
10,00
15,00
20,00
25,00
30,00
0 20 40 60 80 100 120
O2
pro
du
ctio
n (
µm
ole
s∙m
-1∙m
g C
hla
)
Light intensity (µmoles∙m-1∙s-1)
1.0DC orange
1.0DC far-red
0.2DC far-red
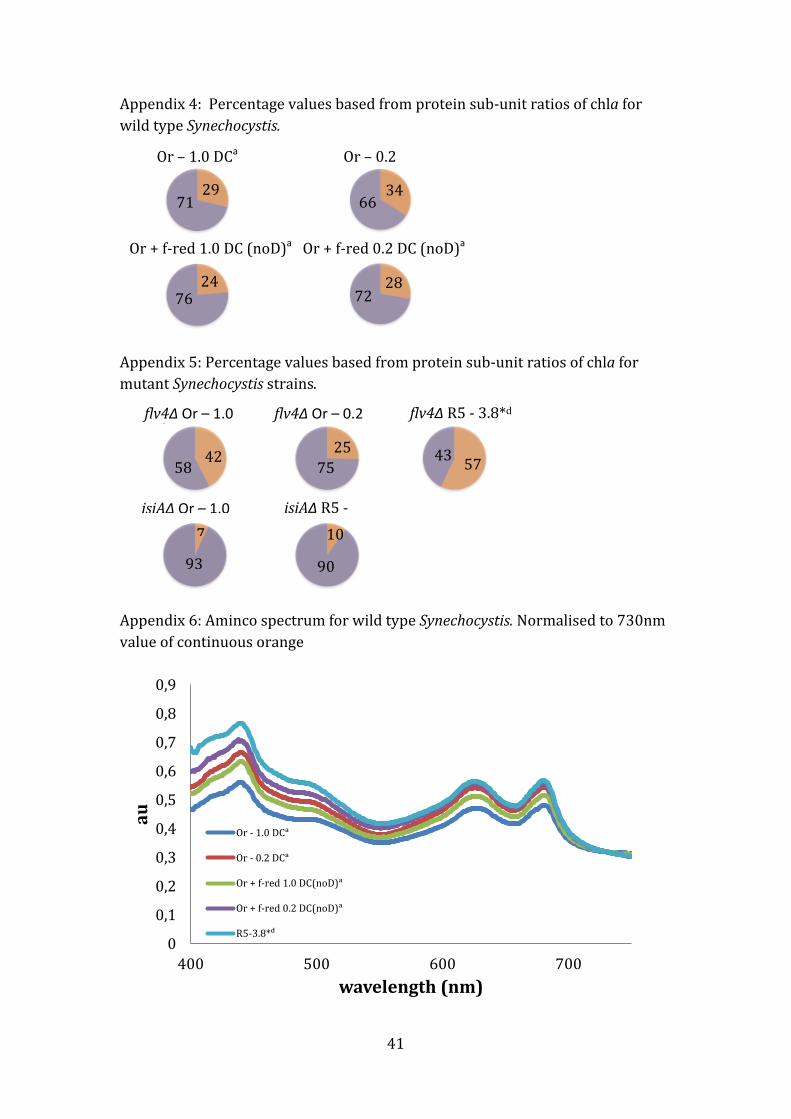
41
Appendix 4: Percentage values based from protein sub-unit ratios of chla for
wild type Synechocystis.
Appendix 5: Percentage values based from protein sub-unit ratios of chla for
mutant Synechocystis strains.
Appendix 6: Aminco spectrum for wild type Synechocystis. Normalised to 730nm
value of continuous orange
flv4Δ Or – 1.0 DCb
flv4Δ Or – 0.2 DCc
isiAΔ Or – 1.0 DCe
isiAΔ R5 - 3.8*d
flv4Δ R5 - 3.8*d
58 43
57
90
7 10
75
25 42
93
Or – 1.0 DCa Or – 0.2 DCa
Or + f-red 1.0 DC (noD)a
Or + f-red 0.2 DC (noD)a
29 66
76
34 71
72 28 24
0
0,1
0,2
0,3
0,4
0,5
0,6
0,7
0,8
0,9
400 500 600 700
au
wavelength (nm)
Or - 1.0 DCᵃ
Or - 0.2 DCᵃ
Or + f-red 1.0 DC(noD)ᵃ
Or + f-red 0.2 DC(noD)ᵃ
R5-3.8*ᵈ

42
Appendix 7: Aminco spectrum for mutant Synechocystis strains with (WT) R5-
3.8, for comparison. Normalised to 730nm value of continuous orange (from WT
– above appendix 6).
0
0,1
0,2
0,3
0,4
0,5
0,6
0,7
0,8
0,9
400 500 600 700
au
wavelength (nm)
Flv4 Or - 1.0 DCᵇ
Flv4 Or - 0.2 DCᶜ
Flv4 R5-3.8*ᵈ
Isia Or - 1.0 DCᵉ
IsiA R5-3.8*ᵈ
R5-3.8*ᵈ