Embed Size (px)
Citation preview

optimised noise barriers a state-of-the-art report
Danish roaD institutereport 194 - 2011

optimised noise barriersa state-of-the-art reportReport 194 - 2011
authors:Gilles PigasseJørgen Kragh
dated: December 2011LaYout:Vejdirektoratet
photos:Page 7 & 14, Gilles PigassePage 24, Jens V Nielsen
isbn eLectronic:978-87-92094-77-3
copYright:Vejdirektoratet, 2011
pubLished bY:Vejdirektoratet

preface 4
summarY 4
forord 5
sammenfatning 5
1. introduction 61.1 Noise barrier theory in brief 61.2 Regular noise barriers 7
2. noise barriers with improved performance 8
2.1 Covering of a road 82.2 Absorbing noise barrier 82.3 Tilted barrier 92.4 Dispersive barrier 92.5 Random edge barrier top 92.6 Active noise barrier 102.7 Barrier with novel cap 11
2.7.1 T-shaped barrier 112.7.2 L-shaped barrier 152.7.3 Cylindrical barrier top 15
2.8 Buildings as noise barriers 162.9 Earth berm 172.10 Vegetation as a noise barrier 172.11 Air cleaning noise barriers 18
2.11.1 The IPL project 192.11.2 The SPAS project 19
3. other considerations 203.1 Location of a barrier 203.2 Length of a barrier 213.3 Cost of a barrier 213.4 Measurements and prediction models 233.5 Combination of porous asphalt and noise barrier 243.6 Influence of the terrain and weather conditions 243.7 Perception by the barrier neighbours 24
4. discussion and concLusions 25
indhoLd

4
prefaceIn 1978, the Danish Road Directorate1 published its first report about noise barriers. It contained guidelines for the design and placement of acoustic shields and was the first of a series of reports on this topic from the Danish Road Directorate. The second report appeared in 19892, which, in addition to guidelines, gave many examples of noise barriers both in Denmark and other European countries. In 1999 a new report3 was published by the Danish Road Directorate with detailed examples of screens at different locations in Denmark. The present report continues this ten-year series on noise barriers. In the last ten years, new materials and new standards have been developed, and more traffic on the roads makes it even more necessary to understand how a noise barrier works, what kind of barriers are available on the market, which effects have been docu-mented in experimental studies and finally, how screens can be optimised to obtain a higher noise reduction per invested unit of money.
This report contains a state-of-the-art on the international
research carried out on noise barriers around the world.It focuses on the acoustic characteristics of the screen rather than on its appearance, design or maintenance. The report points out different types of noise barriers that might be worthwhile trying in Denmark in the coming years.
In the agreement on Green Transport Policy from the Dan-ish Parliament in 2009 10 mil. DKK was reserved for devel-opment of new methods of noise abatement in the period 2009 to 2014. As a part of this the Danish Road Directorate has started a project on optimisation of noise barriers. The present report is produced as a part of this project.
This report does not necessarily reflect the view of the Dan-ish Road Directorate or the Danish Ministry of Transport. Marks or commercial products mentioned do not constitute any endorsement or recommendation for use.
The present report was written by Gilles Pigasse and review-ed by Jørgen Kragh, both from the Danish Road Directorate.
summarYNoise barriers are one of the most effective ways to mitigate road traffic noise. They are often found along highly traf-ficked roads close to urban areas. However, compared to other known ways to mitigate traffic noise, noise barriers are among the least cost-effective, i.e. less noise reduction is achieved per price unit. There is therefore a need to study noise barriers thoroughly and try to optimise their acoustic performance in order to achieve more noise reduction per invested unit of money.
The present report reflects the first phase of the project “Op-timised Noise Barriers”, which intends to develop better and more cost-effective noise barriers. The goal of this first pha-se was to investigate which types of noise barriers can be found on the market, what the international state of research in this area is and what could be the solutions to study and optimise in the next phase of the project. This report is therefore a state-of-the-art on optimised noise barriers.
The introduction presents some basic physical principles of noise barriers. These are necessary to better understand how the sound behaves around noise barriers and also to identify where an optimisation of such barriers is possible.
The first type of barrier to be presented is regular noise barriers, i.e. flat (or vertical) barriers. The next chapter presents noise barriers with improved performance. Usually these barriers are modified versions of
the regular barrier. These barriers can be absorbing, tilted, dispersive or active. Some have specially formed tops such as random edges or forming a T-, L-, Y- or Q-shape. The last type of noise barrier presented is green noise barriers, i.e. made up of vegetation (earth berm, tree belt…). For each of the above mentioned barrier types, a summary of the study is presented and the barrier performance expressed in dB.
The final chapter of this state-of-the-art report deals with re-maining important considerations that have to be taken into account in order to benefit from any noise barrier. These are for example the location of the barrier, its length, its cost and the influence of the atmospheric conditions and the neigh-bours’ perception of the barrier.
In conclusion different types of noise barriers are found suit-able for further research and full scale testing in Denmark. These are barriers with T-top, random-edge top and Watts type (three-panel top). A suggestion is given for the proce-dure to follow in order to test the different noise barriers. This includes finding a location where the noise barrier will be tested in full scale, simulating the sound propagation with the help of a software (possibly using the boundary element method), and choosing which of the different barrier shapes provides the best noise reduction for that specific location. Following this first phase in the project is to determine a location in Denmark where noise barriers with modified top can be tested.

5
forordI 1978 udgav Vejdirektoratet den første rapport om støj-skærme1. Den indeholdt retningslinjer for design og placering af støjafskærmning. Det var den første af en række rapporter fra Vejdirektoratet om dette emne. I 1989 udkom en anden rapport2, som udover retningslinjer, giver mange eksempler på støjskærme både i Danmark og andre europæiske lande.
I 1999 udkom en rapport3 med detaljerede eksempler på skærme forskellige steder i Danmark. I de sidste ti år, er nye materialer og nye standarder blevet udviklet og med mere trafik på vejene er viden om optimerede støjskærme kun blevet mere relevant. Der er ligeledes behov for viden om hvordan skærme kan optimeres for at opnå højere dB reduktion per investeret krone.
I henhold til aftale om en grøn transportpolitik af januar 2009 er der bl.a. afsat en pulje til udvikling af nye metoder til støjbe-
Støjafskærmninger er et af de mest effektive virkemidler til reduktion af trafikstøj ved boliger og udearealer tæt på ve-jen. I forhold til andre kendte virkemidler er støjafskærmning dog blandt de mindre omkostningseffektive (omkostning pr. opnået støjreduktion). Der er behov for at få udviklet og op-timeret støjafskærmninger, så der opnås mere støjreduktion pr. investeret krone.
Denne rapport afspejler den første fase af projektet ”Opti-merede støjskærme”, som har til formål at udvikle bedre og mere omkostningseffektive støjafskærmninger langs veje. Den første fase af projektet er at undersøge, hvilke typer støjskærme der findes på markedet, hvad status er internati-onalt for forskningen på dette område, og hvilke muligheder der er for at studere og optimere i næste fase af projektet. Denne rapport er derfor en State-of-the-art om støjskærme.
Indledningsvis præsenteres nogle grundlæggende fysiske principper for støjskærme. Disse er nødvendige for at forstå, hvordan lyden opfører sig omkring støjafskærmningen og for at identificere, hvor en optimering af skærme er mulig. Den første type skærm, der beskrives er almindelige støjskær-me, dvs. flade (eller lodrette) skærme.
I andet kapitel præsenteres støjskærme med forbedret støjdæmpning. Disse skærme kan ses som modificerede versioner af den almindelige skærm. Disse skærme kan være absorberende, skrå, dispersive eller aktive.
kæmpelse i perioden 2009-2014. Som en del af dette har Vej-direktoratet igangsat et projekt om optimering af støjskærme.
Projektet begyndte i september 2009. Denne rapport inde-holder en state-of-the-art på den forskning, der udføres med optimering af støjskærme rundt om i verden. Den fokuserer på de akustiske egenskaber af skærmen og ikke så meget på dens udseende, design eller vedligeholdelse. Rapporten påpeger forskellige udformninger, det kunne være værd at prøve i Danmark i de kommende år.
Denne rapport afspejler ikke nødvendigvis holdningen til emnet i Vejdirektoratet eller Transportministeriet. Varemær-ker eller kommercielle produkter, der er omtalt er ikke med-taget specifikt for at fremhæve et produkt frem for et andet.
Denne rapport er skrevet af Gilles Pigasse og gennemset af Jørgen Kragh begge fra Vejdirektoratet/Vejteknisk Institut.
Nogle har specielt formet top såsom T-, L-, Y-eller Q-form eller såkaldt tilfældigt udformet kant.
Den sidste type støjafskærmning, der præsenteres er grøn afskærmning, dvs. jordvolde, bevoksningsbælter, etc. For hver af de ovennævnte skærmtyper, præsenteres en sammenfatning af de undersøgelser som er rapporteret i litteraturen. Støjskærmens ydelser er udtrykt i dB.
Det sidste kapitel i denne State-of-the-art rapport beskæfti-ger sig med andre vigtige overvejelser, der er nødvendige at medtage for bedre at kunne optimere en støjskærm. Disse er for eksempel skærmplacering, længde og pris, samt betydningen af de atmosfæriske forhold og naboens opfattelse af skærmen.
I konklusionen præsenteres forskellige typer af støjskærme, som vurderes at være egnet til yderligere undersøgelse. Det er f.eks. støjskærme med T-top, tilfældige-kant top og tre-panel top (Watts typen). Det foreslås at udpege en loka-litet hvor en støjskærm kan afprøves i fuld skala. Derefter skal lydudbredelsen på lokaliteten simuleres ved hjælp af en egnet model og tilhørende software (evt. ved hjælp af boundary element metoden), og til sidst skal det fastlægges hvilke af de forskellige skærmformer der giver den bedste støjreduktion på den specifikke placering. Det næste skridt bliver at finde et sted i Danmark, hvor en støjskærm med modificeret top kan afprøves i fuld skala.
sammenfatning

figure 1. This drawing shows how a screen changes the sound path length from a source (S) to a receiver (R). The path length difference is δ=a+b+c. A receiver in the illuminated zone receives the noise directly from the source while receivers in the shadow zone are acoustically protected.
Path difference: δ=a+b+c
6
1. introduction
The increasing number of noise reduction programmes in Europe and other countries shows the greater concern from society for noise pollution. The Danish Environmental Protection Agency (Miljøstyrelsen) has found that between one third and one fourth of the dwellings in Denmark are exposed to noise above 58 dB, which is the limit for the road noise. The noise may come from highways, railways, air-ports or industrial areas and residential areas may be very close to them. The most typical mitigation of traffic noise is to build noise barriers along the roads. The ever increasing traffic has led to more noise barriers through the years and there is a wide range of designs, shapes, colours, materials and acoustic benefits. The goal of this report is to present a state-of-the-art on noise barriers, with a focus on their acoustic performance. It introduces various types of noise barriers, either completely new or with modified designs. Such optimised noise barriers can be used to improve sound reduction along the roadside.
An important parameter for noise barrier performance is the weather. The attenuation effect of a barrier is sensitive to the atmospheric conditions because of diffraction and refraction. The influence of these phenomena varies with the weather. This makes it difficult to calculate how much reduction a noise barrier can actually bring. This point should be remembered when different types of screen and their performance are presented in the following chapters. Another project for the Ministry of Transport4, carried out by
the Danish Road Directorate, aims at analysing noise barrier performance in all weather conditions occurring within a typi-cal year in Denmark. This will have important implications for noise mapping and for the number of affected dwellings. The reader is referred to this project for further details. Some noise barriers have a really refined design but almost no effect on noise while others are quite effective but not very nice to look at. The next section of this chapter intro-duces some basic principles of noise barrier acoustics. In Chapter 2 various noise barriers with improved performance are presented. Chapter 3 focuses on other important con-siderations that may affect the noise barrier effect. Finally, in Chapter 4, it is concluded how the existing noise barriers can be optimised and what solutions can best reduce noise in residential areas.
1.1 noise barrier theorY in briefWithout a screen, the sound propagates directly between the source and the receiver. Figure 1 shows the direct path length c between the source S and the receiver R.
When a screen is placed between S and R, the space is divided into two: an illuminated zone and a shadow zone. All observation points in the shadow zone perceive a reduction of the sound level while those in the illuminated zone get very little advantage from the barrier. This may for example occur for the upper floors of tall buildings.

7
( )P1
P2
The noise reduction in the shadow zone depends on the dif-ference between the direct path length (c) and the indirect path length (a+b) travelled by the sound between the source and the receiver. This path length difference is denoted δ=a+b+c and it has been estimated5 that a theoretical limit for noise reduction is obtained for δ ≈ 3 m and gives approx. 20 dB attenuation.
Another important concept to understand is by how many decibels (dB) the sound level is dropped at a specific ob-servation point when building a screen. In other words, how large is the screen effect in dB. This is called the barrier Insertion Loss and is calculated as
Insertion Loss = 20 log dBWhere P1 is the sound pressure at the observation point with screen and P2 is the sound pressure without screen. This concept will be used later when presenting the different types of noise barriers. To be effective, it is important that the noise barrier does not let noise pass through its struc-ture, meaning that the direct energy transmission should be as little as possible. In practice, it happens if the energy trans-ferred through the screen is more than 10 dB below the en-ergy that passes over the top and around the edges. This is a requirement that noise barrier manufacturers have to fulfil.
So far the sound has been thought of as an entity. The sound is actually made of different frequencies which do not react the same way when encountering a noise bar-rier. The acoustic performance of a noise barrier can be defined in terms of the Fresnel number N = 2 δ
λ where δ is as defined above and in Fig. 1 and λ is the wavelength of the sound in air. With this Fresnel number it can be seen that the lower the frequency, i.e. the longer the wavelength, the lower N. In other words, noise barriers are less effective (bring less attenuation) for low frequency noise.
One last concept that can help understanding how a noise barrier works is the imaginary line source. When the noise is diffracted at the top edge of the barrier (see Fig. 1), this
edge can be seen as a new source of noise – seen from the receiver side. This important acoustic concept is called ”imaginary line source”. It helps to understand how noise is perceived and what solutions may exist for increasing the at-tenuation. It is particularly important when the noise barriers should be optimised since new shaped- and absorbing-tops can possibly reduce the strength of this imaginary source. This is the concept behind many research projects and some of them are presented in next chapter.
The way the human ear perceives noise at different frequen-cies can be described by an A-weighting of the noise levels. Traffic noise is generally described by the energy-equivalent, constant A-weighted sound pressure level, LAeq in dB. In the next chapters LAeq is used to describe the sound barrier performance.
1.2 reguLar noise barriersA regular noise barrier can be described as the simplest form of noise barriers; it is typically a vertical screen, as shown in Fig. 1. The main requirement is that the screen must be high and long enough to maximise the shadow zone. The noise reduction in practise can be up to 15 dB, under good conditions. When the buildings to be protected are near a busy road, a regular screen provides sound reduction actually closer to 5-10 dB. However, this regular vertical noise barrier has some disadvantages, such as be-ing highly reflective, i.e. it can increase the noise level on the other side of the road.
One solution is then to extend the noise screen vertically but this may conflict with the landscape and can be perceived as visually disturbing to those it should actually protect. A plain vertical noise barrier may therefore be of limited bene-fit, and in the last many years a lot of projects were under-taken to try to improve its effect. There was indeed a need to optimise the barrier materials and their shapes. The next chapter presents some of the most relevant studies that have been published about the optimisation of noise barriers.

figure 2. Left: Reflections between two parallel screens can increase the noise level on the adjacent side. Right: Multiple reflections between a high vehicle and a noise barrier can have similar consequences. In both examples absorbing material on the road side of the noise barrier may reduce the reflections. From ref.10, © 2009, reproduced by permission of Taylor & Francis Books UK.
8
The regular vertical noise barrier, which was presented in the previous chapter is the simplest form of protection against noise and has limited effect. Increasing the height of a screen can increase its effect but brings other problems. The challenge of constructing a noise barrier is to think it through regarding design, landscape, acoustic performanc-es and especially costs (including maintenance costs). It can be expensive to increase the height of a noise barrier and for all these reasons acoustic engineers have been working on new innovative solutions to improve the sound barrier efficiency. This chapter presents different models that could be considered when a noise barrier must be optimised.
There exist of course several types of noise screens and in-terested readers are referred to the literature, especially ref-erence 6,7,8,9 and the book by Kotzen and English10. Earlier reports from the Danish Road Directorate [1, 2, 3] contain many examples of noise barriers in Denmark and abroad and also focus on other than purely acoustic considerations.
2.1 covering of a roadThe best protection against traffic noise is obviously to cover the driving lanes completely. A tunnel is by far the most ef-fective way to mitigate the noise. There are many examples showing up to 30 dB of noise reduction [10, p. 198], i.e. much higher than the 10-15 dB provided by a high conven-tional noise barrier.
A major problem with building a tunnel is its high cost and it can rarely be done only because of the noise. A tunnel also brings around issues with air renewal and lighting. These can be avoided with some openings along the tunnel (called louvres). It is also possible to add absorbing material in the tunnel to attenuate the noise but because of the high costs, a full coverage solution will often be discarded. To put it in a nutshell, a partial or full coverage of a road can be chosen when the area is environmentally sensitive or when the road is then covered with buildings.
In the case where noise barriers are located on either side of a road, some reflections may occur between the screens. This may have important implications for buildings on the oth-er side of the road, i.e. not directly behind a screen. The next three sections present solutions to reduce such reflections between screens: using absorbing material on the screen, tilting the screen or using special geometries which dissipate the noise. It should be remembered that what creates noise on the dwelling side are the diffractions at the screen edge; it means that these three solutions will not do so much to mitigate noise directly behind the screen. There are however other solutions that may enhance the effect of the diffraction at the top edge of the screen, for example noise barriers with random edges, active noise screens or screens with a modi-fied top edge. These are mentioned afterwards.
2.2 absorbing noise barrierA way to enhance the effect of a vertical sound barrier is to use sound absorbing elements. This may attenuate the in-coming sound wave and therefore reduce the effects of re-flections which contribute to the sound level in the vicinity. Absorbing noise barriers are also effective when vertical noise barriers are placed on either side of a road.
The absorbing elements minimise the reflections between the screens and hence the noise level at the receiver side. An example is shown in Fig. 2 left. Another situation where absorbing noise barriers are effective is when the reflec-tions between a moving car and the screen must be sup-pressed, see Fig. 2 right.
Examples of absorbing materials are mineral wool, wood fi-bre, fibre glass and concrete with holes or a mixture of dif-ferent materials. Although absorbing noise barriers have been used along roads or railways they are expensive compared to conventional noise barriers. This means that one should in vestigate if this solution provides the best acoustic performance.
2. noise barriers with improved performance

figure 3. Example of parallel screens tilted outwards. Such a con-figuration reflects the noise upward and reduces reflections between the screens. From ref. 10, © 2009, reproduced by permission of Taylor & Francis Books UK
figure 4. Example of a dispersive screen viewed from above. The incoming sound wave spreads in all directions and hence reduces the noise level at the buildings behind the barrier.
9
2.3 tiLted barrierMay and Osman11 showed that a screen tilted outwards does not bring any extra reduction compared to a verti-cal screen of the same height. On the other hand, when it comes to parallel screens, i.e. on either side of the road, an outward tilted screen is a good solution because the sound is reflected away from housing, see Fig. 3
Slutsky and Bertoni12 showed that only a 3° angle is enough to remove the effect of multiple reflections between screens (for a 45 m wide road). For narrower roads, the angle should be between 10° and 15°. Since absorbing materials are quite expensive, it might be a good and more cost effective alternative to tilt the noise barriers instead.
2.4 dispersive barrierIf a tilted screen is too expensive to implement, it is also pos-sible to use a kind of dispersive screen. An example is shown in Fig. 4. This solution can be used to reduce the effect of re-flections between the screens placed on either side of a road.
This kind of barrier is better than the ordinary flat screen because the energy is reflected in all directions, i.e. the sound is spread more and if it reaches a building its energy is reduced. May and Osman [11] showed in a modelling study that it might bring up to 1.1 dB additional noise reduc-tion compared to a flat screen. The limitation with this type of screen is that low frequencies can not be reduced because their wavelength is larger than the screen size. This solution can be chosen depending on the surroundings.
2.5 random edge barrier topMenounou et al.13 carried out a 1/10 model experiment and found that a screen with uneven and sharp edges can re-duce noise in the shadow zone: the signal amplitude was only one third compared to a conventional vertical screen performance. They measured 30 cm behind the screen and 42.5 cm high with a ”spark” sound source of 4-20 kHz. An example of such a screen is shown in Fig. 5. According to Menounou et al. the effect is as good as with a noise barrier with absorbing material. The great advantage of a random edge barrier is its low cost. This type of barrier can for example be included on an already existing barrier. In the study [13] there are however no calculations in terms of sound level, it is therefore difficult to assess whether this kind of noise barrier top works in practice. Parnell et al.14 have investigated the performance of flat, T-top and random edge barrier in a 1:1 experiment. They concluded that the random edge top yields better performance than the others.
Ho et al.15 conducted a few laboratory experiments on random-edge barriers, see Fig. 5. They found that the more random the edges, the more attenuation it brings. Their laboratory scale model showed that the attenuation is only improved at frequencies above 5 kHz.

There is a need for further studies to prove the effectiveness of such barriers since there seems to be a potential im-provement with multi-edge barriers. These types of screens seem to be good candidates for full-scale experiments. Multi-edge barriers might be a good solution to bring extra noise reduction when a screen already exists.
2.6 active noise barrierActive noise barriers use active noise control to mute the sound. The barriers contain a number of microphones that record the traffic noise and some loudspeakers are included in the structure as well.
The speakers produce the same sound that is coming in, just 180° out of phase so that it cancels the original sound (from the road). Started in Japan, active noise barriers were also tried in other countries. For example in Holland, in the context of the IPG program16 different configurations were
tested. Some limitations of such a system were observed, mainly due to noise which can only be reduced at a certain position (e.g. at a house) and not in a broad area. Moreover, the number of necessary microphones is really high. The conclusion of this sub-project in the IPG framework was that active noise systems provide better reduction than conven-tional noise barriers for houses up to two storeys.
For higher buildings or bigger facade areas this will require even more speakers and microphones to achieve an accept-able level, and this would increase the cost of such a system.
Ise et al.17 also reported that there were some practical issues with the implementation of an active noise barrier, e.g. there should be a second noise source away from the screen to include the effect of terrain reflections.
All in all the active noise barriers are not such a good solu-tion unless the dwelling to be protected is a one-storey house.
figure 5. Examples of jagged or random edge barrier tops. Top is a ”Jagged Edge” (from [13]) and Bottom is a ”random edge” from [15]. Both experiments are scale models.
2.5 cm ↕ 5 cm↔ ↕
3.6 cmmax
2.5 cm ↕ 5 cm↔ ↕
3.6 cmmax
10

2.7 barrier with noveL cap
2.7.1 t-shaped barrierA T-shaped barrier can be viewed as a conventional verti-cal screen with an horizontal panel on top. An example is shown in Figure 6. This kind of screen can be an alternative to increasing the height of a screen. What a T-top screen does is to move the imaginary source line further away from the receiver.
The shadow zone behind the screen increases and can protect a larger space. The shadow zone 1 in Fig. 6 is below the line of sight and the shadow zone 2 is where the second diffraction occurs at the furthest top edge, seen from the road. Therefore an L-shaped screen would bring a smaller shadow zone behind the screen than would a T-shaped screen.
With regard to noise attenuation an IPG report [16] shows that a T-shaped noise barrier brings up to 2.7 dB of
additional attenuation if the receiver is in the shadow zone, see Figure 7 and Kaptein et al. (2004)18.
The black dots in figure 7 indicate the locations of the measurement points; the black text shows the experimental results and the red text shows the results of predictions. Measurements were performed behind a barrier along the N11 motorway in Holland and the exact location of the measurement positions can be found in ref.18.
According to the IPG report a T-shaped noise barrier is cost efficient. It costs just as much to build a T-shaped noise barrier as it costs to increase an already existing noise barrier by 1m, in the case where the foundations should not be strengthened or modified. And when the insertion loss of the barrier is taken into account, the cost for a T-shaped noise barrier proved to be 5 to 15% less than for increasing the height of a screen.
figure 6. Example of a T-screen. Adding a top is an alternative to increasing the barrier height. The shadow zone behind the screen becomes larger and increases the shielding. A T-top brings extra diffrac-tion compared to a conventional vertical screen. Shadow zone 1 is below the line of sight and in shadow zone 2 a second diffraction occurs at the furthest top edge, seen from the road.
11

figure 7. Experimental setup for the noise measurements at two screens with different tops: a 3-panel top and a T-top. The black dots indicate the measurement points, the black text shows the experimental results and the red text shows results of the calculations. From ref. 18, reproduced with permission from the authors.
12

figure 8. The four different types of noise barrier, whose acoustic properties Monazzam et al. studied: T-shape, cylindrical, arrow and Y-shape. Reprinted from ref. 25, ©2005, with permission from Elsevier.
figure 9. Vertical section of a Qua-dratic Residue Diffuser (QRD) mounted on a T-shaped barrier. Reprinted from ref. 24, © 2008, with permission from Elsevier.
13
2.7.1.1 t-shaped barrier with absorbing materiaLsHothersall et al.19 compared different types of noise barrier tops: T-, Y- and arrow-shaped (see Figure 8). They showed that a T-shaped noise barrier with an absorbing surface on its top is more effective than a simple vertical noise barrier and gives approx. 2.5 dB extra attenuation20. This was con-firmed by in situ measurements reported by Watts21.
Fujiwara et al.22 have studied a series of noise barrier tops with rigid, absorbing and soft surfaces. They concluded that a T-shaped noise barrier with a soft surface provides most attenuation. However, there are practical disadvantages of using an absorbing surface. Such materials are not all suitable for being used close to highways. They might also be damaged by moisture, water and dust and lose their properties over time.
Fortunately, there is also another kind of damping which can be as effective as the absorbing material. It is called a Schroeder diffuser. A special case of Schroeder diffusers is presented in the next section.
2.7.1.2 t-shaped barrier with schroeder diffusersA Schroeder diffuser is a structure that contains a series of wells or channels side by side and of various depths. These different depths cause the sound wave to be reflected with a difference in time and space from each well. The energy of the incoming sound wave is spread in all directions and this reduces the reflections from the incoming wave.
This type of diffuser was introduced by M.R. Schroeder in the 1970s23 with the primary goal to improve the sound quality in a concert hall. A popular Schroeder diffuser is a quadratic residue diffuser (QRD) of which an example is given in Fig. 9.
Monazzam et al.25 compared the acoustic properties of sound barriers with different top shapes: cylindrical-, arrow-, Y-and T-shape with QRD.

14
Monazzam et al. [25] made the comparison by using a 2-D boundary element method (BEM) model (see Section 3.4) and they have calculated the Insertion Loss in various situa-tions. They found that the QRD increased the noise attenua-tion in all cases investigated and concluded that a T-shaped noise barrier with a QRD tuned to around 400 Hz provides an additional attenuation of up to 3.5 dB relative to a simple T-shaped noise barrier.
A countour plot level curve was calculated with 2-D BEM using a sound source with a traffic noise spectrum, and it showed better attenuation than from a simple T-shape bar-rier at positions close to the ground behind the screen and also at positions 4 to 7m above the ground 30 m behind the screen [25, Fig. 12].
Other variations of the QRD are possible, and it was found that a higher absorption can be achieved if the bottom part of the wells is skewed26. If the wells are covered with a per-forated plate, then the Insertion Loss of the screen can be improved by approx. 2 dB compared to a basic T-shaped noise barrier [24]. This is an average value over nine points (20, 50 and 100 m behind the screen and 0, 1.5 and 3m
above the ground), calculated with 2-D BEM. Wu et al.27,28, showed that a QRD Schroeder diffuser could also be effec-tive at frequencies lower than its resonance frequency.
A full-scale experiment was conducted along a railway in Hong Kong29. The effect turned out to be not as good as ex-pected. The sound reduction was somehow problematic at low frequencies. The main reason was explained to be some holes and leaks through the commercial product they used.
They also showed that the addition of absorbing material on the top of the screen actually makes it less effective, the reason being that noise reduction comes from the reso-nance of the wells and it is reduced when absorbing material is used. All in all, noise barriers with QRD on their top still yield 4 to 5 dB better attenuation compared to the conven-tional noise barriers.
The choice of a T-shaped barrier may be best when the en-vironment does not allow having a higher screen. It is also a good solution if it becomes too expensive to extend the screen vertically. A test could be conducted using a QRD T-screen after the costs of such a solution has been investigated.

figure 10. Okubo et al. [32] investigated different types of cylindrical barrier top. This is an example of a simple form. The sound with wavelength λ is reflected from the bottom of the cylinder and is cancelled by the incoming antiphase sound. Typical sizes are 25 cm for the inner cylinder diameter and 17 cm for the panel length. Reprinted with permis-sion from [32], © 1999, Acoustic Society of America.
figure 11. A new design of a barrier top with measures given in millimetres. The five different channel lengths cor-respond to a quarter-wavelength at 200, 250, 330, 530 and 940 Hz, respectively. Reprinted with permission from [32] © 1999, Acoustic Society of America.
15
2.7.2 L-shaped barrierSakuma et al.30 calculated the insertion loss of an L-shaped screen using the BEM. The screen was 5 m high, 90 m long and the L was 3 m wide; the source was a point source 10 m from the screen assumed to emit sound at five different frequencies below 500 Hz. The measurement points were 15 m behind the screen. They showed that an L-shaped screen brings 3 to 5 dB more attenuation than a conven-tional vertical screen.
2.7.3 cYLindricaL barrier topSome experiments were also conducted with a cylindrical barrier top. In 1991 Fujiwara and Furuta31 showed that a screen with a cylindrical top can reduce noise. They inves-tigated both in theory and in an experiment the effect of applying hard or sound absorbing cylindrical screen tops. Their full-scale experiments were with a 3 m high screen with a 50 cm absorbing cylinder; the measuring point was
6 m behind the screen and below the road level (see [31, Fig.9]). It showed a 2 - 3 dB decrease in noise level.With these results in mind Okubo et al.32 developed new types of cylindrical tops; one of them is shown in Fig. 10. This type of barrier top looks like a waterwheel, where a specific frequency is caught between the panels. It is the same principle as an acoustic Schroeder diffuser: the sound of a specific frequency is reflected from the bottom of the well and is cancelled by the incoming antiphase sound. The reflected sound is therefore attenuated.
The effect of this type of barrier top is very frequency-depen-dent and it does not work so well for a broadband noise (like traffic noise). From their BEM analysis Okubo et al. predicted only a 1.7 dB decrease in the overall sound pressure level 25 m behind the screen, despite more than 10 dB attenuation at 630 Hz. They therefore tried to improve the absorption proper-ties of the cylindrical barrier top by using absorbing materials and different panel lengths. An example is shown in Fig. 11.

27
noise source by about 13 dB. Further rows of buildings may only produce a smalladditional benefit, e.g. 1–2 dB beyond the second row only [1].
When sound propagates through areas with detached houses, the losses byscreening and scattering are small. A typical value is 5 dB/100 m, but not morethan 10 dB overall. Single buildings should always be situated parallel to the streetor railway. Then at least the windows on the backside are in the sound shadow ofthe house, where the sound level is much lower than on the front side [7].
It is not recommended to situate houses perpendicular to the street, because thenboth sides are almost fully exposed to the traffic noise. The traditional arrange-ment of closed rows of buildings along the streets is the best way to create quietzones. These serve as screens for houses or areas and backyards behind them. Thehigher the buildings alongside the street are, the better the zones are quiet. Exist-ing gaps should be closed, if possible.
Combination of buildings and barriers
Screening can also be realised with a combination of a building and a barrier:1. A row of single-family houses combined with a mound or a dike; earth
against the totally closed facades on the side of the road (dwellingsbuilt into a dike); sound reduction up to 13 dB, depending on theheight of the dwellings
2. A noise screen (of glass) combined with a gallery-type of block offlats (the screen forms the outer facade of the building on the side ofthe road); sound reduction up to 20 dB.
3.2.4 Tunnels
A tunnel is the most effective means of noise screening, but very expensive andseldom possible because of noise abatement reasons only. Tunnels are built in ur-ban centers where land is very expensive, and especially when they can be coveredwith buildings. Construction costs and the costs for maintenance, illumination andventilation of tunnels are high.
(a)
(b)
Fig. 10. Examples of the use of buildings as noise barriers: (a) to be avoided, (b)preferred [1].
figure 13. Examples of the use of buildings as noise barriers. Top: Configuration to avoid, where buildings reflect sound to the other buildings. Bottom: Preferred configuration, where buildings reflect the sound back to the road. From ref 34
figure 12. Measurement setup used by Okubo et al. to investigate the effect of the new top design from Figure 11. Such a screen top can, in theory, yield between 2 and 7 dB extra noise reduction, depending on the receiver and source position. Reprinted with permission from [32], © 1999, Acoustic Society of America.
16
2.8 buiLdings as noise barriersIn addition to all these shapes of screen, other solutions can be used to protect residential areas from road traffic noise. Buildings can for example be used as shielding. It can be a great advantage to have this in mind during planning, so that buildings can be arranged in a way providing efficient noise reduction.
A large building or a series of parallel buildings can protect a house or many houses further away.A two-storey building along a road can for example reduce noise by approx. 13 dB.33 Housing blocks oriented parallel to the road can protect the areas behind the buildings. Some examples are presented in Fig. 13.
It is also possible to add noise barriers between the build-ings to create an unbroken facade. This can minimise the sound propagation between the road and the dwellings. An example in Sweden showed that an additional noise reduc-tion of 2-3 dB in the inner yard could be achieved35. Such a solution may be combined with extra facade insulation.
This screen top shape has been chosen assuming that only the upper part of the structure is effective and that double bends of the channels prevent reflections. The five different channel lengths are equivalent to one quarter wavelength at 200, 250, 330, 530 and 940 Hz, respectively. This geometry is suitable for the noise spectrum that Okubo et al. meas-ured and it would be different for another frequency spectrum.
Implementing this kind of top leads to a 2 to 7 dB decrease of the overall sound pressure level in a measuring region of 5 to 30 m behind the screen; the results depend on the height of the screen (3, 5 or 8 m) and on the distance to the source (5, 12.5 or 20 m from the screen), see Fig. 12 for the experimental setup. Such a cylindrical screen top is more efficient for a high screen close to the source; it means that such a cylinder can increase the efficiency of an already effective screen.
Watts [21] noted, however, that such cylindrical shapes are theoretically effective but difficult to implement in practice. That is the reason for not choosing such a solution in the current project.

figure 14. Comparison of the acoustic performance of a vertical noise barrier and an earth berm. A 4 m high earth berm is equivalent, acoustically speaking, to a 3.25 m high screen (H2). From 10, © 2009, reproduced by permission of Taylor & Francis Books UK.
17
2.9 earth bermEarth berms can be a clever way to reduce noise. Berms appear environmentally friendly and may be designed aes-thetically pleasant. Applying earth berms makes sense in rural areas where they fit well with the surroundings. They have advantages compared to conventional screens [10]:
1. They have a natural appearance and they may not be perceived as noise barriers.
2. They create an open area feeling.3. They do not require extra security fence.4. Costs are lower for construction and maintenance.5. They have a higher perceived effectiveness [36].6. They usually have an unlimited lifespan.
They are however not as effective, acoustically speaking, as the classic noise barriers. Fig. 14 shows a comparison between vertical noise barriers and earth berms. A 4 m high earth berm corresponds, acoustically speaking, to a 3.25 m high screen (H2).
An earth berm is wide and it therefore requires much space to be effective. Hothersall et al. [19] showed that an earth berm with a 2 m wide flat top brings 3 dB extra noise reduc-tion compared to a wedge-shaped berm of the same height.
Some guidelines about the implementation of an earth berm can be found in the Danish Road Directorate report37 or on
the Danish Road Directorate website38, where rules, tips and guidelines are given for the construction of earth embank-ments. These reports do not contain information on how much noise reduction an earth berm can bring. Some examples of earth berms can be found in other reports [3, 39] from the Danish Road Directorate. In conclusion, an earth berm is an interesting solution if there is enough space to build it.
2.10 vegetation as a noise barrierA screen can be partially or totally built by vegetation. Advice on planting is given in the Danish Road Directorate report 183 [3]. There are different ways to use plantation, for exam-ple at the bottom of a barrier so that climbers may cover the screen over time. Vegetation can also be placed at the top of a screen where cabinets can be positioned so the plants and bushes can cover the screen. Disguising the screen is an important benefit of vegetation; it can reduce the sense of monotony and of being in an enclosed area.
Vegetation gives the experience of being in a green area and not near a road. This partly explains their popularity without their acoustic efficiency being demonstrated. There is the usual perception that what is not visible is not audi-ble and the effect of green barriers is often overestimated among architects. It is hard to demonstrate their effective-ness since they should be investigated through different seasons (full leaves, without leaf, falling leaves) and different plant types (swirl, tree, shrub ...).

figure 15. The model of the IPL test location between a beach and a highway. This shows three different types of noise barrier. Image reprinted with acknowledgement from Rijkswater-staat Centre for Transport and Navigation and M+P, see ref. 46.
18
A first attempt by Kragh in 198240 showed that the advan-tage of a 15 to 40 m wide belt of trees and shrubs is higher at low frequencies (around 250 Hz) and high frequencies (above 1 kHz). Such tree belts bring about 6 to 8 dB extra attenuation compared to a conventional lawn of the same width. They do not bring such a big advantage in the fre-quency range where traffic noise is dominant. Huddart41 drew a similar conclusion in a later study.
The higher efficiency at low frequencies may be explained by plant roots and the fallen leaves and branches leading to increased terrain porosity. Attenuation at high frequencies is caused by the vegetation itself. A major disadvantage is that the growth of vegetation takes several years and other solutions must be applied in the meantime. As pointed out in the Danish Road Directorate report [3], proper maintenance of the vegetation is often demanding and expensive.
As a conclusion on the green barriers, it can be said that they make sense either to increase the efficiency of an existing earth berm or barrier, or to ”decorate” an area
where a large noise reduction is not required. A list of climb-er plants can be found in [10, p. 215].
2.11 air cLeaning noise barriersWhen a noise barrier is built the airflow in its surroundings is disturbed. This has an impact on air pollution in the area around the screen. The barrier creates a ”breaking” of the wind leading to an increase of the air flow (i.e. the pollution) on the neighbouring side and also produces extra turbu-lences that tend to reduce the pollution.
The combination of these two effects leads to a new pollu-tion concentration behind the barrier42,43. There was there-fore a need for research on barriers that can reduce the pol-luted air flowing over it.
Two European projects included studies of screens that ab-sorb noise and dust. There is on one hand the Dutch-based IPL project (Innovatie Programma Luchtkwaliteit)44 and the Austrian based SPAS project (Sound and Particle Absorbing System)45.

19
2.11.1 the ipL projectIn the IPL project, six different barrier situations were com-pared along a highway46:
1. No barrier2. Reference screen i.e., a 4 m high glass screen3. 7 m high screen4. 4 m high T-screen5. 4 m high screen with vegetation6. 4 m high concrete screen with catalytic coating.
A model of the experimental site is illustrated in Fig. 15. There are three measurement positions, located 5, 10 and 28.5 m behind the barrier. They have measured the con-centration of NO2 and of dust (PM: particulate matter). The results mainly focus on air pollution rather than on the noise level. It showed that the noise barriers have a positive effect on the air quality. The concentrations of NO2 and PM10 10 meters behind a 4 m screen are significantly lower than at a measurement site without a screen (14% and 34% lower respectively)47.
2.11.2 the spas projectThe Sound and Particle Absorbing System (SPAS) project is a part of the EU Environment Project LIFE [45]. The SPAS project has three full-scale tests in Austria, including
a 450 m long noise- and dust-absorbing barrier in Viktring. Some extra filters made of mineral wool are mounted on the noise barrier, these filters were produced by the Austrian company CBS, see the example in Fig. 16.
In the Viktring test, there are three measurement positions48:
1. 1.5 m high, approximately 15 m from the road,2. at the first-floor height, approx. 10 m from the road3. 1.5 m high, behind a house, approx.
10 m behind the screenThe exact positions are not indicated in the report and the results show that these noise and dust absorbing barriers yield 5.1, 0.5 and 6.7 dB noise reduction, respectively, at the three positions. While the sound barrier in Viktring was brand new, another experiment added new absorbing pan-els to an already existing noise barrier in Wölfnitz. Here the extra panels appeared to bring 2.1 dB extra attenuation. The air pollution is also supposed to be measured at these two places during the project.
These two projects showed that it is possible to combine noise and dust absorbing barriers. It could be an interesting type of barrier to develop in Denmark, especially at places where air pollution is a problem and the screen can be built close to the road.
figure 16. Test of a noise and dust absorbing barrier in Viktring, Austria. This study is part of the European project ”Life-SPAS” [45]. © City of Kla-genfurt, Dep. Environment Protection, Austria.

figure 17. Noise absorbing crash barrier. This is the patent-protected ”Laghi” model of a New Jersey crash barrier, which has been used along a highway in Italy [10] , © 2009, reproduced by permission of Taylor & Francis Books UK.
20
3.1 Location of a barrierTo achieve optimal performance of the noise barrier a gener-al rule is to place it as close as possible to the noise source, i.e. the vehicles, industrial areas, railways, etc. This advice applies only in cases where the road is at the same level as or higher than the receiver. When the road is below the receiver level, the screen may be placed on top of the hill instead. It is however not possible to place a screen close to all lanes, and consequently the noise from the farthest lane tends to be dominant. One solution is to increase the height of the screen but it may cause great dissatisfaction due to visual obstruction. A solution can be to build a noise barrier in the central reservation. It should preferably be lower than the screens along the road to avoid reflections from them. In [16] different possibilities for noise barrier location were examined. The five options are:
1. Reference location: noise barrier along the road (at the minimum recommended distance, i.e. approx. 7.45 m from the centre of the outside lane).
2. Noise barrier integrated into the crash barrier (see Fig. 17).3. Noise barrier very close to the road (about 0.6 m from
painted line), also integrated with a crash barrier.4. Similar to option 3 with a 2 m top on.5. Similar to solution 1 with sound-absorbing noise barrier
in the central reservation.
The results show that the most effective way to reduce noise is option 5, in other words there should be a noise reducing device between the two lanes of the road.
There are also other advantages such as blocking the view of the oncoming cars, it minimises light reflections from the cars and also avoid queuing in the vicinity of an accident on the other side of the road. In practice, the noise barrier can be placed between the two rows of safety barriers or be in-tegrated into the crash barrier itself.
The traffic safety should also be taken into account when implementing this solution. With regard to the geometry of such a noise barrier, it was argued [16] that barriers should be angled away from the road and the screen in the central reservation should stand upright and be lower than the other screens.
The construction of noise barriers with absorbing material on both sides of the road can have a positive effect (see Chap-ter 2). It may be that there are some drawbacks regarding the optimum positioning of a barrier and compromises have to be made between the architect’s idea, the acoustic per-formances and safety.
3. other considerations
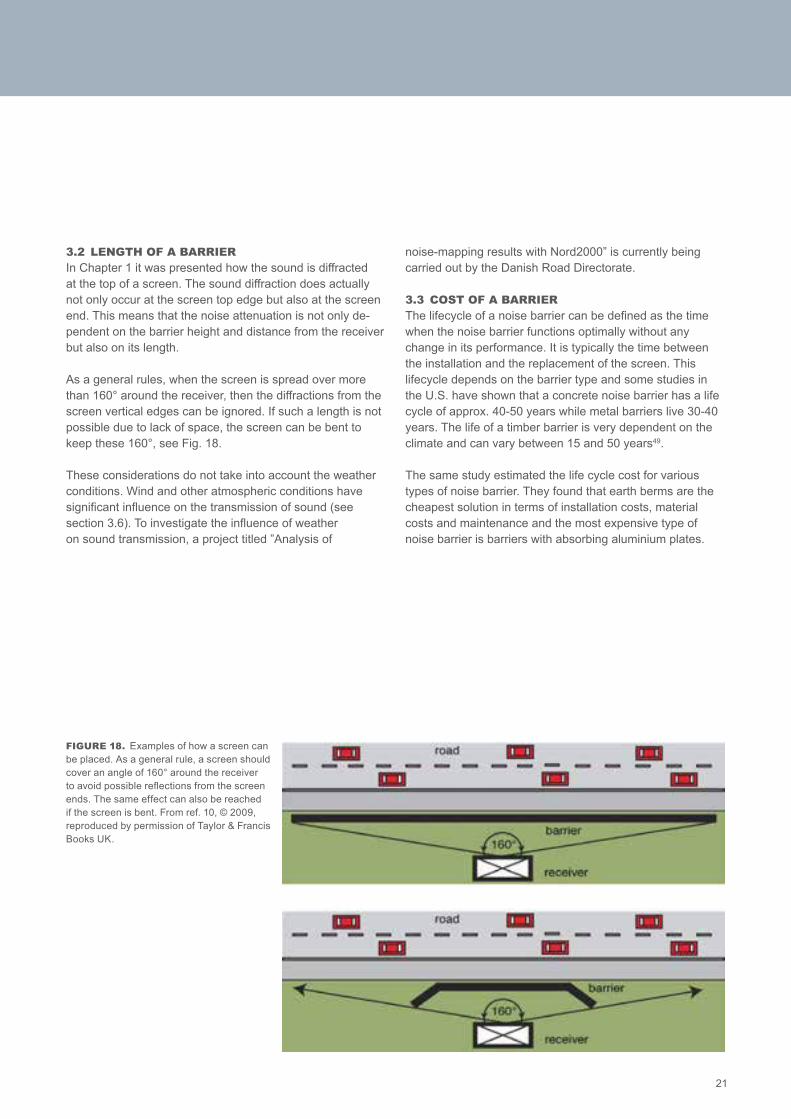
figure 18. Examples of how a screen can be placed. As a general rule, a screen should cover an angle of 160° around the receiver to avoid possible reflections from the screen ends. The same effect can also be reached if the screen is bent. From ref. 10, © 2009, reproduced by permission of Taylor & Francis Books UK.
21
noise-mapping results with Nord2000” is currently being carried out by the Danish Road Directorate.
3.3 cost of a barrierThe lifecycle of a noise barrier can be defined as the time when the noise barrier functions optimally without any change in its performance. It is typically the time between the installation and the replacement of the screen. This lifecycle depends on the barrier type and some studies in the U.S. have shown that a concrete noise barrier has a life cycle of approx. 40-50 years while metal barriers live 30-40 years. The life of a timber barrier is very dependent on the climate and can vary between 15 and 50 years49.
The same study estimated the life cycle cost for various types of noise barrier. They found that earth berms are the cheapest solution in terms of installation costs, material costs and maintenance and the most expensive type of noise barrier is barriers with absorbing aluminium plates.
3.2 Length of a barrierIn Chapter 1 it was presented how the sound is diffracted at the top of a screen. The sound diffraction does actually not only occur at the screen top edge but also at the screen end. This means that the noise attenuation is not only de-pendent on the barrier height and distance from the receiver but also on its length.
As a general rules, when the screen is spread over more than 160° around the receiver, then the diffractions from the screen vertical edges can be ignored. If such a length is not possible due to lack of space, the screen can be bent to keep these 160°, see Fig. 18.
These considerations do not take into account the weather conditions. Wind and other atmospheric conditions have significant influence on the transmission of sound (see section 3.6). To investigate the influence of weather on sound transmission, a project titled ”Analysis of

figure 19. Estimated Life-Cycle Cost for various types of noise barrier [49]. The cheapest type is an earth berm and the most expensive is a noise barrier with absorbing aluminium plates (noishield aluminum). Figure from [49] reprinted with permission from ASCE
22
Fig. 19 shows the calculated life cycle costs for various types of noise barrier in $/m2. The cheapest are earth berms at a cost of approx. 140 $/m2 (105 €/m2) and the most ex-pensive are absorbing aluminium plates with approx. 500 $/m2 (376 €/m2). Between these two extremes the other mate-rials are around 300 $/m2 (226 €/m2). Durisol and Carsonite are two commercial products, Carsonite is a type of fiber-glass screen and Durisol type is not given in the article.
The Danish Road Directorate report [3] presented various examples of noise barriers in Denmark and gave the costs for planning, design, construction and in some cases for maintenance. It also gave an idea about the expenses re-lated to a noise barrier. A part of the EU project SILENCE is about noise barriers and it was reported [50, p. 84] that a 4 m
high and 500 m long screen on both sides of a road costs approx. 1.2 Mil. €, i.e. approx. 300 €/m². This figure is an average across Europe and prices in Denmark are closer to 500 €/m².
One way to reduce the cost of a noise barrier is to build it from modules that can be added together. When a product is manufactured in series, it costs significantly less. Such series production also makes it easier to choose between different modules, so there will not be spending time on thinking about design or appearance of the noise barrier. A direct consequence may be a more uniform landscape along the road network instead of the great disparity that currently exist between the various types of barriers (timber, beton, PVC,…).

figure 20. The performance of a screen with modified edge depends on the two angles θS and θR and does not depend on their radii. The insertion loss of a screen with a modified edge is the sum of the insertion loss of a regular screen and the absorption difference between the two screens. Reprinted from ref. 57, © 2007, with permission from Elsevier.
23
3.4 measurements and prediction modeLsThe European Committee for Standardisation (CEN) has published standards for noise barriers [51, 52, 53, 54, 55]. They define various measurement methods to test noise barrier performance in a laboratory and in situ. This includes both “green” and ordinary screens and also includes a sec-tion on a methodology for performance measurement of bar-riers with modified edges. The standard does not, however, give any guidance on the influence of the terrain or other local conditions and it is therefore difficult to conclude if the noise barrier will be really effective at a particular location. According to a German report56 it might be better to meas-ure the noise barrier attenuation by using a microphone array instead of a single microphone. Usually, at least 200 m of noise barrier are needed to avoid an edge effect. By using a microphone array this length may be reduced to approx. 20 m.
Okubo et al.57 have pointed out limitations of the ISO and the CEN standards about measuring outdoor noise barrier effect. They suggest new ways to calculate the perform-ance of barriers with modified edges. Their method has two steps: first they measure in a laboratory what the difference in insertion loss is between the barrier with modified top and a standard barrier. This difference is a function of frequency and of the angles θS and θR. It is written ΔLedge,up as shown in figure 20. The second step is to calculate the efficiency of the modified top outdoors. The insertion loss of this screen is the sum of the insertion loss of a regular screen (calcu-lated with a propagation model such as Harmonoise58 or Nord2000), based on the sum of the four diffracted paths around the screen that has a direct path between the source and receiver, and ΔLedge,up (the absorption difference).
Another method for these new types of barriers (T-or L-shaped) is to calculate a correction term, CT, to add to the
noise barrier insertion loss [16, p. 263]. In the same way, a correction term is calculated when a noise barrier is placed in the central reservation of a road [16, p. 266]. This correc-tion depends on the barrier height and the distance from the receiver.
Since it is quite expensive to build a noise barrier, it is best if the performance of the barrier is known (estimated) in advance. In situ or laboratory measurements make it possible to know the barrier properties only after they have been built. Two popular prediction models are the Boundary Element Method (BEM) and the Finite Element Method (FEM). These two methods make it possible to calculate the noise level at a given observation point for a defined screen geometry. BEM uses discrete points on the boundary of the geometry while FEM uses discrete points throughout the geometry. BEM is most commonly used as it does not require as much computation time as FEM. This time is often a limitation and most of the studies are therefore limited to 2D BEM. A major advantage of BEM is the possibility to include modified barrier edges with a reasonably complex geometry.
A common limitation for these prediction models is that they do not take the influence of the weather into account. The wind speed and its direction are two important factors in how effective a noise barrier is. Another problem with the predic-tion models is that it is not possible to take into account the entire traffic; users have to choose which lane they want to model. Highways are often modelled as a single source point in a 2-D model.
Some commercial software can be used to calculate the insertion loss of a noise barrier with BEM, for example MICADO from CSTB. Such software has each their limita-tions and different price levels.

24
3.6 infLuence of the terrain and weather conditionsThe terrain is a significant component in noise propaga-tion. Its type influences how much wave interference or sound absorption occurs and its shape determines how the sound is scattered. There is a direct path between the source and the receiver and also an indirect path in which the sound wave is reflected from the ground. Interferences occur between these two sound waves and the amount of interference depends on the terrain type. Hutchins et al.60 showed that over a lawn, the destructive interferences were maximum around 500 Hz and were approximately 12 dB with a source-receiver distance of 40 m, source and receiver height were 0.7 m and 1.5 m respectively.
The first reason why the sound pressure level measured behind a screen may prove higher than one predicted with models is the atmospheric influence. The sound propaga-tion is indeed influenced by changes in the sound velocity and this change depends on temperature gradient and wind velocity changes61. Some studies found that wind variation alone can bring up to 10 dB difference for the receiver62.
This limits how much noise reduction can be achieved with a barrier. The physical reason for this is that the sound wave does not propagate in a straight line from the source to the receiver but follows curved paths because the atmosphere is not uniform. This induces that the sound waves are bent over the top edge of the barrier and the performance of the noise barrier can therefore be drastically reduced. There is howev-er not so much to do about it. A modified-edge barrier can help a little and few prediction models have up to now taken the atmospheric conditions into account (Harmonoise [58]).
3.7 perception bY the barrier neighboursNoise barriers are less effective at low frequencies (see Section 1.1), and this means that there is a dominance of low frequency noise in residential areas. The residents’ opinion on noise barrier effect is important and it should be considered when a noise abatement project is undertaken. May and Osman63 showed that listeners preferred a screen reducing noise at a moderate noise level to the same screen in a noisier situation, i.e. a screen which only partially solves the noise problem. This should be taken into account when building a noise barrier.
3.5 combination of porous asphaLt and noise barrierWatts et al.59 investigated the benefit of porous asphalt over dense asphalt with and without a noise barrier. Their BEM calculations showed that, without a screen, porous asphalt yields 6.3 dB of attenuation (the source was 8 m from the roadside, at a height of 5 cm, and the receiver 1.5 m high, 40 m from the roadside). With a 4 m high noise barrier be-tween the source and the receiver the porous asphalt yields only 4.5 dB attenuation. The only case where there was a gain to have porous asphalt + screen instead of porous asphalt alone is when the screen is on the other side of the road, i.e. the source is between the screen and the receiver. These calculations were theoretical and the results have not been confirmed by in situ measurements.

25
This chapter concludes on the types of screens presented in this report. A discussion then follows about what solutions might be relevant to try in Denmark in the next few years and what steps should be followed to optimise the process (analysis-decision-implementation).
Covering a road (partially or fully) is generally a very effec-tive way to mitigate noise. A major disadvantage is the high cost of building such a structure. This is the reason why tun-nels are often rejected as a solution.
Absorptive noise barriers are commonly used and are quite efficient. Their primary goal is to minimise the reflections from the screen. Their high cost explains however that con-ventional screens often are preferred. It is therefore neces-sary to perform a cost-benefit analysis and examine more precisely whether it is the best solution.
Tilted and scattering noise barriers are more efficient than regular vertical noise barriers. They can be a good and
4. discussion and concLusions
cheaper alternative to absorptive screens, especially when screens are located on either side of a road.
Active noise control has been shown to have an impact only on a restricted area and it is hard to find use for such mitiga-tion in reality.
Multi-edged screens appear to be potentially more efficient than conventional barriers; this type of screen should be in-vestigated further in a full scale experiment.
Screens with modified edge such as T, arrow or cylinder have different acoustic benefits. Studies have shown that a T-shaped barrier is the most effective, especially when absorbing materials or Schroeder diffusers are used. These types of screen can be a good way to increase the noise reduction for little extra cost and without taking additional area or bring more visual disturbance. A T-shaped barrier is therefore a good candidate for further investigation and it would be relevant to test it in Denmark in the next few years.

26
It can be concluded that the effectiveness of a screen is very dependent on its location. The various experiments described in this report are valid only under specific condi-tions, i.e., size, location and distance from the road. It is however possible to calculate the influence and impact a barrier will have with the help of prediction methods such as BEM or ray tracing. There is some software that include these methods and that can give a good estimate of the barrier performance.
A proper way to plan the implementation of a new screen is to first choose a place where a barrier could attenuate the noise level, for example between a very busy road and a residential area. The next step is to build a model in a pro-gram that can find the optimum screen design with regards to the location, height, width, shape, material, etc.
One of the programs which might be used for such predic-tion is MICADO developed by the French CSTB, and collab-oration with this research centre could be a valuable option.
In these times where almost everything is about finding a ”green” angle to a product, it may be a good idea to think of a noise barrier designed in an environmentally friendly manner. Future screens could be environmentally friendly in the way they are built, the material they contain and their potential air-purifying properties. Some experiments were conducted with screens containing photovoltaic cells (e.g. in Fløng [3] and Germany [10]). This may be a good way to produce ”green” energy while reducing the noise level; this can probably increase the acceptance from the resident’s side. Another option would be to combine an optimised bar-rier (T-, L-or multi-edged top) with a ”bio” screen (earth berm or plantation). This would combine the effectiveness with environmental friendliness.
Using buildings as noise shield can only be done in large projects where a town or a neighbourhood is to be built. This cost effective solution needs to be kept in mind.
Earth berms are the cheapest solution for noise barriers and may be preferred in situations where there is enough space and where it would fit better with the surroundings, typically in the countryside.
Despite a growing interest in vegetation on barriers, tests are missing to show how effective they actually are. It is dif-ficult to calculate how much reduction a tree belt, shrubs or climbers can bring. This kind of barrier generally requires more treatment and maintenance than a conventional noise barrier. This solution can be chosen in order to provide an environmentally friendly aspect to the area, to disguise a screen or when only limited noise reduction is required.
Air-cleaning noise barriers are still in an experimental phase and the on-going European projects (IPL and SPAS) should be followed. This could be a very interesting future solution if particle filters could also absorb noise. There is a need for further studies to conclude whether these barriers are ef-ficient enough.
The conclusion of the present report is close to the sugges-tions made in the European project Silence [50, p. 85].It claims that five different types of noise barrier could show bet-ter results compared to the conventional vertical noise barrier:
1. Noise barrier with absorbing material,2. Noise barrier with T, L or other top, 3. Tilted noise barrier, 4. Earth berms as additional solutions,5. Noise barrier covering the road completely or partially.

27
references1 Vejdatalaboratoriet (part of the Danish Road Directorate).
Sound barriers [Støjafskærmninger]. 1978. rapport 22, in Danish
2 Bendtsen, H. and Skou, K. Noise Barrier: a catalog of ideas [Støjafskærmning : et ide-katalog], 1989, rapport 81, in Danish with English summary the Danish Road Directorate.
3 Vejdirektoratet. Noise barriers: examples and experiences [Støjskærme: Eksempler og erfaringer]. 1999. Rapport 183.
4 Kragh. J. TM5: Analysis of the results of the noise mapping with Nord2000
5 Department of Transport and Welsh Office. Calculation of Road Traffic Noise. HMSO, London, 1988.
6 Watts, G. Acoustic performance of traffic noise barriers a state-of-the-art review. Euro-symposium on the Mitigation of Traffic Noise in Urban Areas, pages 219-246, Nantes, France, 1992.
7 Ekici, I. and Bougdah, H. A review of research on envi-ronmental noise barriers. Building Acoustics, 10(4):289--323, 2003.
8 The Highways Agency. Design Manual for Roads and Bridges. London, UK, 1992. Volume 10, Section 5, Part 1 HA65/94 - Design Guide for Environmental Barriers http://www.standardsforhighways.co.uk/dmrb/vol10/section5.htm.
9 The Highways Agency. Design Manual for Roads and Bridges. London, UK, 1992. Volume 10, Section 5, Part 2 HA65/94 - Environmental Barriers: Technical Requirements http://www.standardsforhighways.co.uk/dmrb/vol10/section5.htm.
10 Kotzen, B. and English, C. Environmental noise barriers: a guide to their acoustic and visual design. Taylor & Francis USA, 2nd edition, 2009.
11 May, D.N. and Osman, M.M. Highway noise barriers: new shapes. Journal of Sound Vibration, 71:73--101, 1980.
12 Slutsky, S. and Bertoni, H.L. Analysis and programs for assessment of absorptive and tilted parallel barriers. Technical report, Transportation Research Board, 1988.
13 Menounou, P. and You, J.H. Experimental study of the diffracted sound field around jagged edge noise barriers. The Journal of the Acoustical Society of America, 116(5):2843, 2004.
14 J. Parnell, S. Samuels and C. Tsitsos “The acoustic performance of novel noise barrier profiles measured at the roadside” Acoustics Australia, 38(3):123-128, 2010
15 S. Ho and I. J. Busch-Vishniac and D. T. Blackstock. Noise reduction by a barrier having a random edge profile. The Journal of the Acoustical Society of America, 101(5):2669-2676, 1997.
16 P A Morgan. IPG: Scientific Strategy Document - End Report. IPG-TNO, DVS-2008-016, RWS, Dienst Weg- en Waterbouwkunde, 2008.
17 Ise,S. and Yano,H. and Tachibana,H. Basic study on active noise barrier. Journal of the Acoustical Society of Japan (E), 12(6):299-306, 1991.
18 D. Kaptein et al. Praktijkproef Schermtoppen Eindrapport IPG 4.2.2., DWW-2004-022, Dienst Weg- en Waterbouw-kunde, 2004.
19 Hothersall, D.C. and Crombie, D.H. and Chandler-Wilde, S.N. The performance of T-shape profile and associated noise barriers. Appl. Acoust., 32(4):269-281, 1991.
20 Hothersall, D.C. and Chandler-Wilde, S.N. and Hajmir-zae, M.N. Efficiency of single noise barriers. J. Sound. Vibr., 146(2):303-322, 1991.
21 G. R. Watts, Acoustic performance of a multiple edge noise barrier profile at mo-torway sites, Applied Acous-tics, Volume 47, Issue 1, 1996, Pages 47-66
22 Fujiwara, K. and Hothersall, D.C. and Kim, C.H. Noise barriers with reactive surfaces. Applied acoustics, 53(4):255--272, 1998.
23 Schroeder, M.R. Diffuse sound reflection by maximum-length sequences. The Journal of the Acoustical Society of America, 57(1):149, 1975.
24 Monazzam, M.R. and Lam, Y.W. Performance of T-shape barriers with top surface covered with absorptive quadratic residue diffusers. Applied Acoustics, 69(2):93--109, 2008.
25 Monazzam, M.R. and Lam, Y.W. Performance of profiled single noise barriers covered with quadratic residue dif-fusers. Applied Acoustics, 66(6):709--730, 2005.
26 Commins, D.E. and Auletta, N. and Suner, B. Diffusion and absorption of quadratic residue diffusers. Proceed-ings of the Institue of Acoustics, 10(2):223-232, 1988.
27 Wu, T. and Cox, TJ and Lam, YW. From a profiled diffuser to an optimized absorber. The Journal of the Acoustical Society of America, 108:643, 2000.
28 Wu, T. and Cox, T.J. and Lam, Y.W. A profiled structure with improved low frequency absorption. The Journal of the Acoustical Society of America, 110(6):3064, 2001.
29 Yiu Wai Lam. Effect of absorption on the performance of diffusive T shape barriers. Euronoise 2009 Conference Proceedings, 2009.
30 Sakuma, T.; Takamura, N.; Yasuda, Y. & Sakamoto, S. Numerical analysis of the additional attenuation due to the tops of edge modified barriers Proc. Inter-Noise 2005.
31 K. Fujiwara and N. Furuta. Sound shielding efficiency of a barrier with a cylinder at the edge. Noise Control Eng. J., 5:5-11, 1991.

28
49 Morgan, S.M. and Kay, D.H. and Bodapati, S.N. Study of Noise Barrier Life-Cycle Costing. Journal of Transporta-tion Engineering, 127:230, 2001.
50 Kloth, M. and Vancluysen, K. and Clement, F. and Ellebjerg L. Practitioner Handbook for Local Noise Action Plans. Technical report, SILENCE project on Quieter Surface Transport in Urban Areas, 2008.
51 EN 1793-1 Road Traffic Reducing Devices. Test Method for Determining the Acoustic Performance: Part 1: Intrin-sic Characteristics of Sound Absorption. 1997.
52 EN 1793-2 Road Traffic Reducing Devices. Test Method for Determining the Acoustic Performance: Part 2: Intrin-sic Characteristics of Airborne Sound Insulation. 1997.
53 EN 1793-3 Road Traffic Reducing Devices. Test Method for Determining the Acoustic Performance: Part 3: Normalized Traffic Noise Spectrum. 1998.
54 CEN/TS 1793-4 Road Traffic Reducing Devices. Test Method for Determining the Acoustic Performance: Part 4: Intrinsic characteristics - In situ values of sound diffraction. 2003.
55 CEN/TS 1793-5 Road Traffic Reducing Devices. Test Method for Determining the Acoustic Performance: Part 5: Intrinsic characteristics - In situ values of sound reflec-tion and airborne sound insulation. 2003.
56 Schulze, C. and Hübelt, J. and Auerbach, M. and Bartolomeus, W. Determination of insertion loss at noise barriers of decreased length. Lärmbekämpfung, 4(5):196-199, 2009.
57 Okubo, T. and Yamamoto, K. Procedures for determining the acoustic efficiency of edge-modified noise barriers. Applied Acoustics, 68(7):797--819, 2007.
58 Salomons, E. and Heimann, D. Harmonoise: Description of the Reference model. Technical report, HAR29TR-041118-TNO10, TNO TPD Environmental Acoustics De-partment, 2004.
59 Watts, G.R. and Chandler-Wilde, S.N. and Morgan, P.A. The combined effects of porous asphalt surfacing and barriers on traffic noise. Applied Acoustics, 58(3):351--377, 1999.
60 D. A. Hutchins and H. W. Jones and L. T. Russell. Model studies of barrier performance in the presence of ground surfaces. Part I---Thin, perfectly reflecting barriers. The Journal of the Acoustical Society of America, 75(6):1807-1816, 1984.
61 Rasmussen, K.B. Outdoor sound propagation under the influence of wind and temperature gradients. Journal of Sound Vibration, 104:321--335, 1986.
62 E. Salomons and D. van Maercke and A. Randrianoelina. Noise barriers and the Harmonoise sound propagation model. Euronoise 2009 Conference Proceedings, 2009.
63 May, D.N. and Osman, M.M. Highway noise barrier percei- ved benefit. Journal of Sound Vibration, 70:153--165, 1980.
32 Okubo, T. and Fujiwara, K. Efficiency of a noise barrier with an acoustically soft cylindrical edge for practical use. The Journal of the Acoustical Society of America, 105(6):3326, 1999.
33 Nelson, P.M. Transportation noise reference book. Butterworths, 1987.
34 Paikkala, S.-L.; Talasch, W.; Kihlman, T.; Nikitara, I.; Stöcker-Meier, E.; Curcuruto, S.; Clinton, F.; Nagel, E.; Ross, B.; Kuiper, J. & Pärjälä, E. Inventory of noise mitigation methods The European Commission, 2002.
35 J. Forssén and P. Thorsson. Road traffic noise propaga-tion to an inner yard - Measurements before and after the construction of gap filling buildings. Euronoise 2009 Conference Proceedings, Edinburgh, 2009.
36 Cohn, L.F. Highway noise barriers. Technical report, 87, National Cooperative Highway Research Program, synthesis of highway practice, Transportation Research Board, Washington D.C., 1981.
37 J. Vedel and M. Cueto and M. K. Quist and C. Sauer and H. Bengtsson. Råd og retningslinjer om jordvolde. Vejdirektoratet, 2009. ISBN: 978-87-7060-222-8.
38 Vejsektoren. Råd og retningslinjer om jordvolde, http:// www.vejsektoren.dk/wimpdocasp?page=document&objno=301739
39 Vejdirektoratet. Støjskærme: Eksempler og erfaringer - II. 2004. Rapport 282.
40 Kragh, J. Road traffic noise attenuation by belts of trees and bushes. Danish Acoustical Laboratory, Report No, 31, 1982.
41 Huddart, L. The use of vegetation for traffic noise screen-ing. Technical report, 238, Transport and Road Research Laboratory Research, Crowthorne, England, 1990.
42 Dietrich Heimann. Harmonoise: WP2 Reference model, Chapter 13 “Meteorology”. Technical report, HAR22TR-020220-TNO11, TNO TPD Environmental Acoustics De-partment, 2004.
43 IPL project: Benchmark CFD-modelleringen, DVS, November 2009
44 Innovatie Programma Luchtkwaliteit (IPL) http://www.ipl-airquality.nl/.
45 European Life Project http://www.life-spas.at/english/startseite.htm.
46 J. Hooghwerff and G.J. van Blokland. Eindrapport Proeftuin Schermen [Experimental screens – final report]. Technical report, M+P. DWW.06.16.28, Road and Hydraulic Engineering Division, 2009.
47 Toepassingsadvies Schermen, Rapportnummer IPL-1b48 Pabinger and Partner. Schallopegelmessungen - SPAS
Elemente. Technical report, Amt der Kärntner Landes-regierung, 2009.

29
Rapport / Report
Nr./No. Titel/Title Forfatter/Author
175 Paper Temperature influence on noise measurements EURONOISE 2009 - Edinburgh
Hans Bendtsen Qing Lu Erwin Kohler Bruce Rymer
176 Bituminous binders - Results of Danish Round Robins for CEN test methods from 2000-2009
Erik Nielsen
177 Ageing of bituminous binders Erik Nielsen
178 DVS-DRI. Super Quiet Traffic International search for pavement providing 10 dB noise reduction
Jørgen Kragh
179 Støjreduktion med tolags drænasfalt Øster Søgade – de første otte år
Lars Ellebjerg Hans Bendtsen
180 Traffic Flow and noise – A method study Gilles Pigasse
181 The Blue Spot Concept Methods to predict and handle flooding on highways
Klas Hansson, VTI, Sweden Fredrik Hellman, VTI, Sweden Marianne Grauert, DRI Michael Larsen, DRI
182 Background Report Literature, questionnaire and data collection for blue spot identification
Marianne Grauert, DRI Klas Hansson, VTI, Sweden Fredrik Hellman, VTI, Sweden
183 The Blue Spot Model Development of a screening method to assess flood risk on highways
Michael Larsen, DRI
184 Inspection and Maintenance Guide for reducing vulnerability due to flooding of roads
Fredrik Hellman, VTI, Sweden Knud A. Pihl, DRI Klas Hansson VTI, Sweden
185 Blue Spot Konceptet Metode til udpegning og håndtering af oversvømmelser på motorveje
Klas Hansson, VTI, Sweden Fredrik Hellman, VTI, Sweden Marianne Grauert, DRI Michael Larsen, DRI
186 Surface dressings optimized for low tyre/road noise. Paper for Inter·Noise 2010 in Lisbon, Portugal
Bent Andersen Hans Bendtsen
187 Beboernes opfattelse af støjen ved Motorring 3. Undersøgelse før og efter udvidelsen af M3 Sammenfatningsrapport
Hans Bendtsen Emine Celik Christensen
188 Road surface texture - low noise and low rolling resistance CPX trailer comparison - Copenhagen 2009
Jørgen Kragh Bent Andersen Jens Oddershede
189 Støjreduktion langs veje - planlægningsværktøjer og eksempler Hans Bendtsen
190 Optimization of Thin Asphalt Layers Final Report
Jørgen Kragh, DRI, Denmark Luc Goubert, BRRC, Belgium Ulf Sandberg, VTI, Sweden Robert Karlsson, VTI, Sweden Erik Nielsen, DRI, Denmark Erik Olesen, DRI, Denmark Stefan Vansteenkiste, BRRC, Belgium Joëlle De Visscher, BRRC, Belgium
191 Sedimentanalyser fra 70 regnvandsbassiner - fokus på miljøfremmede stoffer
Marianne Grauert Michael Ruben Anker Larsen Mikkel Mollerup
192 PERSUADE - CBA tool for economic appraisal Model documentation and user instructions
Gilles Pigasse, DRI,
Mads Paabøl Jensen (COWI)
193 NordFoU projektafslutningsrapport Susanne Baltzer
194 Optimised noise barriers
A state-of-the-art report
Gilles Pigasse

Vejdirektoratet has local offices in Aalborg, Fløng, Middelfart, Næstved, Skanderborg and it’s head office in Copenhagen.
Find more information on vejdirektoratet.dk
VejdirektoratetGuldalderen 12, FløngDK-2640 HedehusenePhone +45 7244 7000