Embed Size (px)
Citation preview

Optimisation of high-performance liquid chromatography withdiode array detection using an automatic peak trackingprocedure based on augmented iterative target transformationfactor analysis
P. V. van Zomeren,* A. Hoogvorst, P. M. J. Coenegracht and G. J. de JongDepartment of Analytical Chemistry and Toxicology, University of Groningen, P.O. Box 1969700 AD Groningen, The Netherlands. E-mail: [email protected]; Fax: +31 503637582; Tel: +31 50 3633336
Received 10th October 2003, Accepted 26th January 2004First published as an Advance Article on the web 9th February 2004
An automated method for the optimisation of high-performance liquid chromatography is developed. First of all, thesample of interest is analysed with various eluent compositions. All obtained data are combined into one augmented datamatrix. Subsequently, augmented iterative target transformation factor analysis performs the integrated tasks of curveresolution and peak tracking. Since this type of curve resolution processes all data at once, it can deal with strong peakoverlap and reveal the correspondence of compounds between runs, i.e. peak tracking. The retention time and peak widthat half height for each component of the sample are determined for every eluent composition. Next, models are built forthe retention time and the peak width at half height. These models are used to predict the resolution and the analysistime for each point in factor space. Finally, a multi-criterion decision-making method, Pareto optimality, is used to findthe optimum. The method completes all calculations within a few minutes and without user intervention. By means ofthis procedure, a mixture of three benzodiazepines is successfully separated using a ternary mobile phase. There are tworequirements for the automated optimisation method to work correctly. Firstly, all components of the sample must havesufficiently different spectra. Secondly, each compound should have the same spectrum under all experimentalconditions.
Introduction
Selectivity in liquid chromatography is influenced by severalvariables. Changing the composition of the mobile phase is themost powerful method for influencing the selectivity.1 Therefore,optimisation of a liquid chromatographic separation is usuallyaccomplished by optimisation of the mobile phase composition.Several approaches may be used.2–4 First of all, the entire variablespace can be searched in a stepwise manner. This approach isknown as a grid search. Although this method is extremelystraightforward, it requires a large number of experiments.Secondly, the variable space can be searched partially in a guidedmanner. The direction of the search is determined by a chromato-graphic response function, which characterises the quality of thechromatographic separation in a single number. This approach isknown as a directed search or sequential method. An example issimplex optimisation.5 This method has a number of advantages. Itcan handle many variables, it does not require a model, newvariables can be added at any time, and it requires less experimentsthan a grid search. Unfortunately, the choice of a suitablechromatographic response function is difficult. Furthermore, localoptimums can be found. Thirdly, experimental models can beused.6,7 This approach requires less experiments than a directedsearch. It will generally find the global optimum. Although it ispossible to model chromatographic response functions, it is usuallybetter to model the retention behaviour of individual solutes.8
Therefore, it is necessary to determine the elution order in eachchromatogram which is called peak tracking.
A wide range of peak tracking methods have been developed.7–10
The least complicated approach is the analysis of pure standardsunder the same experimental conditions as the samples. Thismethod has some major disadvantages: it requires a relatively largenumber of experiments, all components of the samples must beknown, and a pure standard must be available for each component.A different approach is the comparison of peak areas. This methodonly works when all components in the chromatograms have a
different peak area. Furthermore, each individual component musthave the same peak area in all chromatograms. This is not a trivialrequirement, since changing the experimental conditions caninfluence the peak area. The occurrence of peak overlap is also animportant limitation. As a result, it is difficult to determine thenumber of components. In order to deal with peak overlap, thechromatogram with the highest number of components is used as areference. Furthermore, peak areas are expressed relative to thetotal peak area which also corrects for changes in peak areasbetween runs.11 An advanced way of performing peak tracking,based on peak area, is the use of fuzzy theory.12–14 This method canalso use the elution order of the components as a source ofinformation for the peak tracking procedure, since the elution orderusually does not change abruptly when changing from oneexperimental condition to another. The method takes into accountunknown components and peak overlap.
The previously discussed peak tracking methods are suitable forsingle-wavelength detection, but can also be used for a multi-wavelength detection. Other approaches require multi-wavelength(or in some cases dual-wavelength) detection. The absorbance ratiomethod performs peak tracking based on the ratio between theabsorbances at two different wavelengths.15 Although this methodis suitable for chromatograms with partial peak overlap, it issensitive to changes in experimental conditions. A differentapproach is the direct comparison of spectra between chromato-grams.16–19 All components in one chromatogram must havedifferent spectra and individual components must have identicalspectra in different chromatograms. If these criteria are notsufficiently met, the performance of peak tracking can be improvedby simultaneous comparison of the peak areas.18 The use of multi-wavelength detection also offers the possibility to resolve over-lapping peaks. A peak tracking method using curve resolution,followed by a comparison of the obtained spectra, was described byStrasters et al.20–23 This method starts with the division of allchromatograms into peak clusters based on an absorbance thresh-old. Each continuous part of the chromatogram with an absorbance
T h i s j o u r n a l i s © T h e R o y a l S o c i e t y o f C h e m i s t r y 2 0 0 4
DO
I: 10
.103
9/b
3131
65c
2 4 1A n a l y s t , 2 0 0 4 , 1 2 9 , 2 4 1 – 2 4 8
Publ
ishe
d on
09
Febr
uary
200
4. D
ownl
oade
d by
Pur
due
Uni
vers
ity o
n 27
/08/
2014
11:
08:5
7.
View Article Online / Journal Homepage / Table of Contents for this issue

higher than the threshold is considered to be a peak cluster.Subsequently, all clusters are analysed separately using principalcomponent analysis (PCA) to determine the number of compo-nents, and iterative target testing factor analysis (ITTFA) to obtainpure spectra and chromatographic profiles. Then, peak tracking isperformed based on comparison of spectra and peak areas. Finally,unresolved clusters are analysed using target factor analysis (TFA)in which the already obtained pure spectra are used as targets. Thismethod is quite insensitive to peak overlap; i.e. ITTFA performswell at resolutions of 0.4, while TFA even works at resolutions aslow as 0.1. It is still sensitive to changes in the experimentalconditions, e.g. influence of pH on the spectra.
Unfortunately, curve resolution methods do not always providethe true chromatographic profiles and spectra, when they areapplied to a data matrix which is obtained in a single measurement.The reason for this are the ambiguities which are inherent to factoranalysis. One of these ambiguities, the intensity ambiguity, iscaused by the fact that all estimated concentrations and spectra arescaled by some unknown factor. This is not important forqualitative analysis, but it interferes with quantitation. Rotationalambiguity is caused by the fact that the estimated spectra are linearcombinations of the true spectra. Both ambiguities interfere withpeak tracking, since the comparison of peak areas depends on acorrect determination of the concentrations, while the directcomparison of spectra requires an accurate determination of the truespectra.24–26 Furthermore, single data matrices are often rankdeficient; the mathematical rank of the matrices is lower than thenumber of components because of severe chromatographic peakoverlap. This does not result in a correct determination of thenumber of compounds.27,28 In order to solve these problems, curveresolution can be applied simultaneously to multiple data matrices.A wavelength-wise augmented two-way data matrix is constructedfrom individual data matrices, which have one order, in this casewavelength, in common. As a result, the spectra of common speciesin different experiments should be equal. The individual datamatrices supply complementary and independent information; if apreferred separation is not achieved in a single experiment, it willprobably be achieved by the combination with other experi-ments.24,26,29–34 Simultaneous analysis of correlated data matricescan remove the ambiguities which are caused by factor analysis.While intensity ambiguities are generally removed by augmentedanalysis, rotational ambiguities are removed only when at least oneof the experiments provides selective information.24,26,29,35,36
Consequently, simultaneous analysis increases the resolution andimproves the recovery of chromatographic profiles and spec-tra.31,37–40 Results can be improved even further by simultaneousanalysis of mixtures and standards. The standards supply selectiveinformation, which is necessary to remove rotational ambiguities.39
Furthermore, they enable absolute quantitation by elimination ofthe intensity ambiguities.41–44 Simultaneous analysis can alsoprovide rank augmentation, and, therefore, eliminate rank defi-ciency problems. Rank augmentation enables the correct determi-nation of the total number of components present. Finally,simultaneous analysis can be used to determine the correspondencebetween components in various experiments. This approach wasused by Gargallo et al.25 for the assignment of species inspectrophotometric titrations. It is even possible to analyse a wholeset of data at once, as was shown by Vives et al.33 for the UV-VISabsorption, fluorescence and circular dichroism spectra of poly-nucleotides. They used this method to determine the overall rank ofthe data and, so, the total number of compounds. The application ofaugmented curve resolution to bilinear data, originating fromchromatography combined with a spectrometric technique, isprobably a suitable method for the assignment of a set ofcompounds in various chromatograms. When the whole set of datamatrices (e.g. all chromatograms) is analysed simultaneously, itmight even be possible to perform complete peak tracking in oneaugmented analysis. This hypothesis will be tested in the presentpaper.
It has been shown in a previous paper by van Zomeren et al.45
that ALS performs better than ITTFA when an appropriateinitialisation method is used. However, this is only true forsimulated data with added Gaussian noise. For real data with erraticnoise, the differences between both methods appear to be verysmall. Since the ITTFA algorithm is much faster than the ALSalgorithm, it is advantageous to use ITTFA. Therefore, in thispaper, a peak tracking method based on augmented ITTFA46,47 willbe used as part of an automated method for the optimisation of high-performance liquid chromatography with diode array detection(HPLC-DAD). First of all, augmented ITTFA provides augmentedchromatographic profiles and spectra. Since all chromatographicprofiles for one compound are combined in a single augmentedchromatographic profile, and, since this is true for all compoundspresent, the correspondence between the compounds in differentexperiments is known. Then, the chromatographic profiles are usedto determine the retention times and peak widths, and models arebuilt for the retention times and peak widths at half height. Afterselection of the most appropriate models, chromatographic resolu-tions and analysis times are predicted using these models. Finally,the optimum separation conditions are found by simultaneousmaximisation of the chromatographic resolution and minimisationof the analysis time, using a method for multi-criterion decision-making.
TheoryAugmented ITTFA
Individual data matrices can be combined to form a single datastructure, in order to enable simultaneous analysis. There areseveral methods to obtain this single data structure. First of all, it ispossible to superimpose matrices. This process is known asstacking. Secondly, matrices can be linked together. This chain ofmatrices can be achieved row-wise or column-wise in a processwhich is known as augmentation. Matrices must have at least oneorder in common to perform augmentation, while stacking requiresthat the matrices have both orders in common. In chromatographythe analysis time usually varies between runs, since the retentiontimes of compounds depend on the experimental conditions. Thewavelength scale, however, does not change, because the samedetector is used. Therefore, bilinear data matrices that are obtainedusing HPLC-DAD only have one order (wavelength) in common.As a result, only wavelength-wise augmentation is possible. Whenseveral matrices are combined using wavelength-wise augmenta-tion, one new matrix is formed, which has a number of wavelengthpoints equal to the number of wavelength points in each individualmatrix, and a number of time points equal to the sum of the numberof time points in all individual matrices.
Augmented ITTFA does not differ fundamentally from normalITTFA. Only a few minor modifications of the algorithm arenecessary to accommodate for the fact that augmented chromato-graphic profiles contain multiple peaks, while normal chromato-graphic profiles are unimodal. These multiple peaks all correspondto the same compound under various experimental conditions. Thealgorithm used in this paper is based on a paper by Vandeginste etal.47 In the first step, principal component analysis (PCA) isperformed on the complete data matrix. Since augmentation doesnot change the number of chemical species present, this methodprovides an estimate of the total number of compounds. Thisnumber also indicates which of the obtained abstract spectra andabstract augmented chromatographic profiles are significant.Subsequently, an iterative target testing procedure is used to changethe abstract augmented chromatographic profiles into true aug-mented chromatographic profiles. First of all, a Varimax rotation48
is used. This type of rotation tries to obtain a few large loadings andas many near-zero loadings as possible. In other words, it attemptsto make the chromatographic profiles unimodal. Therefore, it isapplied separately to each part of the augmented chromatographicprofile that originates from a single chromatographic run. After
A n a l y s t , 2 0 0 4 , 1 2 9 , 2 4 1 – 2 4 82 4 2
Publ
ishe
d on
09
Febr
uary
200
4. D
ownl
oade
d by
Pur
due
Uni
vers
ity o
n 27
/08/
2014
11:
08:5
7.
View Article Online

rotation, the separated parts are recombined to form augmentedstart targets. Subsequently, these start targets are processed, one ata time. A rotation matrix is calculated based on the first target.Then, the obtained rotation matrix is used to calculate a predictedtarget. Finally, this predicted target is evaluated and adapted.Elements of the predicted target which are below a certain thresholdare set to zero, and minor peaks which are separated from the mainpeak by one or more zeros are eliminated. For obvious reasons, thispart of the algorithm is performed separately for each part of theaugmented predicted target that originates from a single chromato-graphic run. After adaptation the target is resubmitted to theiterative procedure. Iteration is stopped, when a maximum numberof iterations is reached, adaptation of the target is not possible, orthe predicted and adapted target are sufficiently similar. Theiterative procedure is repeated for the remaining start targets.Finally, the accepted targets are scaled to unit length to obtainaugmented chromatographic profiles. Linear regression is used tocalculate the spectra based on these augmented chromatographicprofiles and the augmented data matrix.
Building and selection of models
All models in this paper are based on three variables; the water (x1),methanol (x2), and acetonitrile (x3) content of the eluent. Sincemixture variables always add up to unity, it is impossible tocalculate the intercept as well as all factorial terms at the same time.Scheffé models do not contain intercepts, while in Cox models oneof the factorial terms is removed in order to calculate the intercept.In this paper Scheffé models will be used, since in this way theeffect of each component of the eluent is explained by a singlefactorial term. This may help to elucidate the contribution ofdifferent eluent constituents to the separation mechanism. Thesetype of mixture models contain non-linear blending of the form xixj,which are obtained from the first-order linear terms and second-order interaction terms. A well-known mixture model is the specialcubic Scheffé model, a full second-order polynomial model withone third-order special cubic term:49
y = b1x1 + b2x2 + b3x3 + b12x1x2 + b13x1x3 + b23x2x3
+ b123x1x2x3 + e (1)
Model selection is a very important issue. Although models,which contain one or more terms that are not statisticallysignificant, generally describe the training points well, they,usually, do not provide good predictions. Therefore, it is importantto remove redundant terms to prevent models from overfitting. AStudent’s t-test is used to determine the statistical significance ofthe parameter estimates. In this paper, only terms with a p-valuelower than 0.05 are accepted to be statistically significant. Newmodels are built, removing the least significant term of the specialcubic model. This process, which is known as backward selection,is continued, one term at a time, until models are obtained, whichcontain only significant terms. However, since models, whichcontain one or more terms that are marginally insignificant,sometimes predict better than models with significant terms only,and, since the choice of the significance level is arbitrary, selectionof the appropriate models is based on a simultaneous evaluation ofa number of statistical criteria.
First of all, the residual sum of squares (SSres) and total sum ofsquares (SStot) are used to perform analysis of variance (ANOVA)goodness-of-fit. If the p-value, based on the obtained F-value(Fgof), is less than 0.05, the model shows a significant goodness-of-fit. Subsequently, the part of the SSres caused by measurementerrors (SSpe) and the part of the SSres caused by lack-of-fit of themodel (SSlof), are used to perform ANOVA lack-of-fit. If the p-value, based on the obtained F-value (Flof), is higher than 0.05, themodel does not show a significant lack-of-fit.49,50 The SSpe iscalculated based on replicate measurements. All sum of squares areexpressed as ratio of their corresponding degrees of freedom, inorder to take into account the number of model parameters. One of
these so-called mean squares, the pure error mean square (MSpe), issuitable for comparison with relative prediction errors, e.g. theMSEP, which will be mentioned below. Finally, the SSres and theSStot can also be used to determine the adjusted correlationcoefficient (R2
adj)49
(2)
where n is the number of training points, ni is the number ofmeasurements for each individual training point, and p is thenumber of model parameters. While a normal correlation coeffi-cient (R2) always increases when the number of model parametersis increased, regardless whether these additional terms actuallyimprove the model or not, R2
adj decreases when the number ofmodel parameters is increased without improving the model.Therefore, R2
adj is more useful for model selection than R2.The R2
adj, Fgof and Flof indicate how well models describetraining points. However, they do not provide any indication as tohow well models predict points that are not included in the trainingset. The latter is very important, since the obtained models are usedfor predictions. In this paper, two criteria are used to determine thepredictive quality of models. In the first place, cross-validation isused. All measurements, including replicates (yij), for one trainingpoint (i) are removed. A model that it is built on the remainingtraining points is used to predict the removed point (y\i). Thisprocess is repeated until all points have been removed from thetraining set once. In this way, the predictive residual error sum ofsquares (PRESS) is calculated:51,52
(3)
Furthermore, it is also possible to predict the points in a test set,since these points are not used to build models. The mean squarederror of prediction (MSEP) is calculated as a function of theobserved response in the test set (ykj), the predicted response (yk),the number of test points (m), and the number of replicates per testpoint (nk):52,53
(4)
Calculation of the PRESS does not require additional measure-ments, while for calculation of the MSEP a set of test points has tobe obtained. It is time-consuming to perform these extra measure-ments. Furthermore, it is difficult to select appropriate test points,which are distributed equally over factor space at representativelocations. If one of the training points has a strong influence on theshape of the model, removal of this point will make calculation ofthe PRESS troublesome. Furthermore, interpretation of the statis-tical properties of the PRESS is not straightforward. As the MSEPand PRESS have their own advantages and disadvantages, bothstatistical criteria will be used for model selection.
Four different responses are modelled in the current paper;retention time, natural logarithm of the retention time, peak widthat half height, and natural logarithm of the peak width at half height.For each response a set of models is built. Since it is easier to usemodels that do not require data transformation, models of theresponse are generally preferred over models of the naturallogarithm of the response. Therefore, the criteria for accepting thelatter type of models are very strict. These models will be preferredonly, if they simultaneously show a higher R2
adj, a lower PRESS, alower MSEP, and a higher Flof than the other type of models. Sincethe mean of the response is not equal to the mean of the naturallogarithm of the response, PRESS as well as MSEP requiremodification before comparison. After selection of the preferredtype of response, i.e. with or without logarithmic transformation,
A n a l y s t , 2 0 0 4 , 1 2 9 , 2 4 1 – 2 4 8 2 4 3
Publ
ishe
d on
09
Febr
uary
200
4. D
ownl
oade
d by
Pur
due
Uni
vers
ity o
n 27
/08/
2014
11:
08:5
7.
View Article Online
one specific model has to be selected within the preferred set. Thispreferred set contains various models of the preferred response,starting with a special cubic Scheffé model, followed by a series ofmodels with decreasing number of model parameters. The modelsof this set that have the highest R2
adj, the lowest PRESS, the lowestMSEP, the lowest Fgof, and the highest Flof are selected. Thearithmetic mean of the number of model parameters of the selectedmodels is used to estimate the number of model parameters of themodel of choice.
ExperimentalChemicals
The benzodiazepines, nitrazepam, clonazepam, and lorazepamwere donated by several pharmaceutical companies. Since theirmolecular structures are closely related (Fig. 1), they have rathersimilar UV spectra.54 HPLC grade acetonitrile and methanol wereobtained from Labscan (Dublin, Ireland). An ELGA Maxima ultrapure water system (Salm & Kipp, Breukelen, the Netherlands) wasused to prepare deionised water. A solution in methanol containing200 mg L21 of each of the benzodiazepines was prepared.
HPLC system
An HP 1090 liquid chromatograph (Agilent, Waldbronn, Germany)was used, equipped with a diode array detection system. Systemcontrol, data acquisition, and data analysis were performed usingChemStation Release 04.02. An ODS Hypersil C18 column withdimensions 250 3 4 mm and particle size 5 mm was supplied byAgilent (Waldbronn, Germany). Eluents containing water (H2O),methanol (MeOH), and acetonitrile (MeCN) were used accordingto Table 1. Flow was kept constant at 0.8 mL min21. A built-inautosampler was used to inject 5 mL portions of the sample solution.The syringe was rinsed three times with 20 mL of methanol betweeninjections. Spectra were obtained from 220–350 nm using a 2 nmresolution and 1.3 Hz sample rate.
Software
The obtained data were saved in ASCII format using an HPChemStation macro. For each run, one matrix with the measuredabsorbance as a function of time and wavelength, and two vectorswith time and wavelength labels, respectively, were stored. Allcomponents of the algorithm that was used to perform automatic
optimisation, were programmed in Matlab 5.3 (Mathworks, Natick,MA, USA). Curve resolution and peak tracking based onaugmented ITTFA, calculation of the retention time and peak widthat half height, the construction of linear and exponential models ofthe retention time and peak width, the calculation and interpretationof statistical criteria, the selection of the correct models, theprediction of the resolution and the analysis time, and thecalculation of the optimum conditions, were all performed in onealgorithm. Matlab was also used to generate figures.
Results and discussionUV spectra
Standard solutions in pure methanol containing either 200 mg L21
of nitrazepam, clonazepam, or lorazepam were analysed using theHPLC-DAD. Data were obtained for all training and test pointslisted in Table 1. These results are not used in the automatedoptimisation method, since that method does not require the use ofstandards. They are used to demonstrate that in the current researchthe basic spectral requirements are met, i.e. the differences betweenthe spectra of one compound at several experimental conditions areconsiderably smaller than the differences between the spectra ofvarious compounds at one experimental condition. Furthermore,retention times are also useful to check the performance of the peaktracking method.
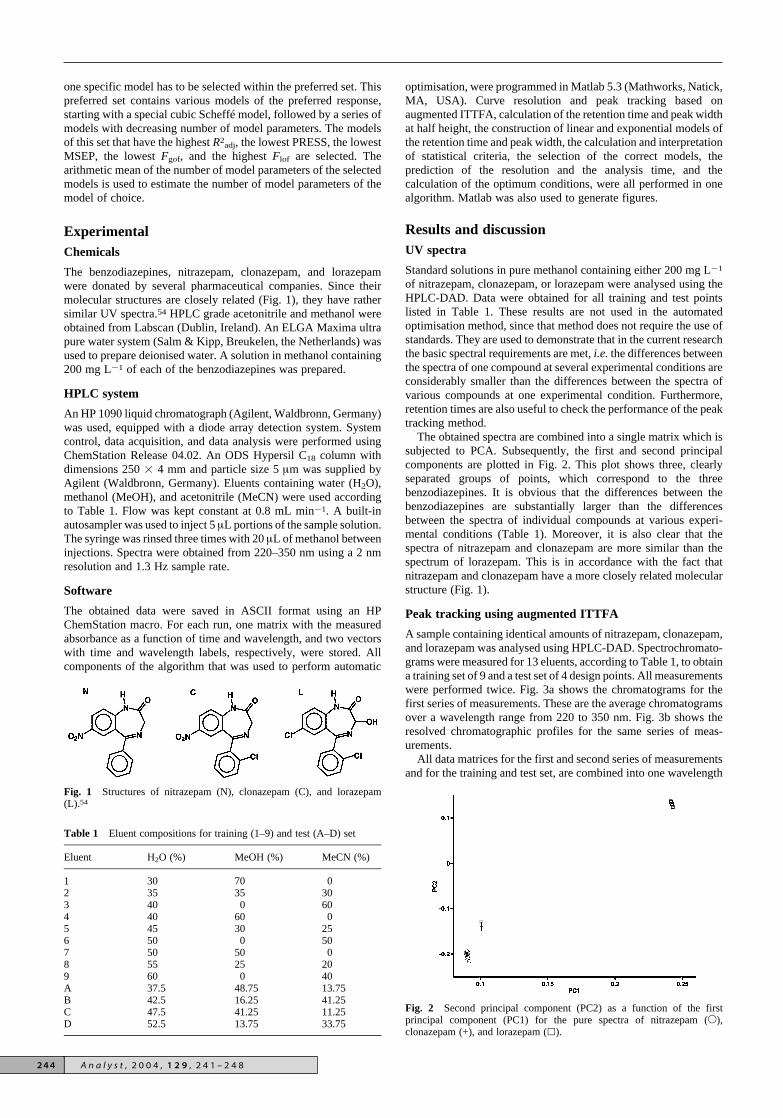
The obtained spectra are combined into a single matrix which issubjected to PCA. Subsequently, the first and second principalcomponents are plotted in Fig. 2. This plot shows three, clearlyseparated groups of points, which correspond to the threebenzodiazepines. It is obvious that the differences between thebenzodiazepines are substantially larger than the differencesbetween the spectra of individual compounds at various experi-mental conditions (Table 1). Moreover, it is also clear that thespectra of nitrazepam and clonazepam are more similar than thespectrum of lorazepam. This is in accordance with the fact thatnitrazepam and clonazepam have a more closely related molecularstructure (Fig. 1).
Peak tracking using augmented ITTFA
A sample containing identical amounts of nitrazepam, clonazepam,and lorazepam was analysed using HPLC-DAD. Spectrochromato-grams were measured for 13 eluents, according to Table 1, to obtaina training set of 9 and a test set of 4 design points. All measurementswere performed twice. Fig. 3a shows the chromatograms for thefirst series of measurements. These are the average chromatogramsover a wavelength range from 220 to 350 nm. Fig. 3b shows theresolved chromatographic profiles for the same series of meas-urements.
All data matrices for the first and second series of measurementsand for the training and test set, are combined into one wavelength
Fig. 1 Structures of nitrazepam (N), clonazepam (C), and lorazepam(L).54
Table 1 Eluent compositions for training (1–9) and test (A–D) set
Eluent H2O (%) MeOH (%) MeCN (%)
1 30 70 02 35 35 303 40 0 604 40 60 05 45 30 256 50 0 507 50 50 08 55 25 209 60 0 40A 37.5 48.75 13.75B 42.5 16.25 41.25C 47.5 41.25 11.25D 52.5 13.75 33.75
Fig. 2 Second principal component (PC2) as a function of the firstprincipal component (PC1) for the pure spectra of nitrazepam (2),clonazepam (+), and lorazepam (8).
A n a l y s t , 2 0 0 4 , 1 2 9 , 2 4 1 – 2 4 82 4 4
Publ
ishe
d on
09
Febr
uary
200
4. D
ownl
oade
d by
Pur
due
Uni
vers
ity o
n 27
/08/
2014
11:
08:5
7.
View Article Online

wise augmented two-way data matrix. Augmented ITTFA is used,as described in the Theory section, to decompose the matrix. Thiscurve resolution method provides two matrices; one matrix iscomposed of vectors which contain pure spectra, and the other iscomposed of vectors which contain augmented chromatographicprofiles. Each augmented chromatographic profile contains allindividual chromatographic profiles for one specific compound.These distinct chromatographic profiles originate from the differenttraining and test points. Therefore, this particular compound can betracked over the complete design. Since an augmented chromato-graphic profile is obtained for each compound, all compounds areassigned in each chromatographic run. As a result, the elution orderis determined for all experimental conditions, and complete peaktracking is performed using the augmented curve resolutionprocedure.
The resolved chromatographic profiles (Fig. 3b) are extractedfrom the augmented chromatographic profiles. They are used tocalculate the retention time and peak width at half height for allcompounds, both for the training set, and for the test set. For thefirst and second series of measurements, the retention times andpeak widths are calculated separately. The standards provideexactly the same retention times and peak widths at half height asthe automated peak tracking method. This proves that theautomated method works well, although severe peak overlap isobtained in parts of the design and standards are not used.
Modelling of the retention time and peak width at halfheight
For each compound two models are selected, one for the retentiontime and one for the peak width at half height, using the approach
described in the Theory section All models of the untransformedresponse show a significant lack-of-fit. The models of the naturallogarithm of the peak width at half height, however, do not showlack-of-fit. Although models of the natural logarithm of theretention time show lack-of-fit, it is less than that of thecorresponding models of the retention time. For all models, theamount of variance described by the model is significantly higherthan the residual variance (all p-values are less than 0.000001).Therefore, this criterion is not useful for selection. R2
adj, on theother hand, is consistently lower for models of the untransformedresponse than for the corresponding models of the transformedresponse, respectively, 0.93–0.96 and 0.99 for the retention time,and 0.94–0.96 and 0.98–0.99 for the peak width at half height. Aftermodification, the PRESS as well as the MSEP is lower for modelsof the transformed response than for the corresponding models ofthe untransformed response.
A full special cubic Scheffé model eqn. (1) of the naturallogarithm of the retention time appears to be the best for allcompounds. The same type of model of the natural logarithm of thepeak width at half height seems to be the best for nitrazepam andlorazepam. However, for clonazepam, the best model for thelogarithm of the peak width at half height contains less modelparameters:
In(y) = b1x1 + b2x2 + b12x1x2 + b13x1x3 + b123x1x2x3 + e (5)
The MSEP and MSpe for the selected models are shown in Table2. Since the MSEP is the sum of a systematic error, caused by theprediction inaccuracy of the model, and a random error, caused bythe irreproducibility of the measurements, the MSEP is generallyhigher than the MSpe, which only depends on random errors. Forthe models of the natural logarithm of the retention time, the MSEPis indeed 3–4 times as high as the MSpe based on the training points.Consequently, the predictions are somewhat inaccurate. However,for the models of the natural logarithm of the peak width at halfheight, the MSEP and MSpe based on the training points areapproximately equal. It should be noticed that the MSpe is normallycalculated based on the training points. Since the random error maydepend on the level of the response and on measurement conditions,the random error in the training points is not always equal to therandom error in the test points. Therefore, in this paper, the MSpe isalso calculated based on the test points. This leads to slightlydifferent results; for models of the natural logarithm of the retentiontime, the MSEP is 2–3 times as high as the MSpe based on the testpoints, while, for models of the natural logarithm of the peak widthat half height, the MSEP is almost exactly equal to the MSpe basedon the test points.
Prediction of the resolution
Using the selected models, the retention time (tR) and peak width athalf height (wh) of nitrazepam, clonazepam, and lorazepam arepredicted for a grid of points in factor space. This grid is formedsearching the complete factor space with an interval of 0.02. Forevery point, the chromatographic resolutions are calculated basedon the retention times and peak widths at half height. Theresolutions between nitrazepam and clonazepam (Fig. 4a), ni-trazepam and lorazepam (Fig. 4b), and clonazepam and lorazepam
Fig. 3 Mixture design with training points 1–9 (2) and test points A–D (+)showing the obtained chromatograms (a) and chromatograms after curveresolution (b).
Table 2 MSEP, MSpe based on the training points (a), and MSpe based onthe test points (b) for the selected models
Model MSEP MSpea MSpe
b
ln(tR) Nitrazepam 0.00085 0.00029 0.00048Clonazepam 0.00112 0.00027 0.00043Lorazepam 0.00131 0.00034 0.00052
ln(wh) Nitrazepam 0.00146 0.00121 0.00147Clonazepam 0.00112 0.00173 0.00121Lorazepam 0.00120 0.00132 0.00123
A n a l y s t , 2 0 0 4 , 1 2 9 , 2 4 1 – 2 4 8 2 4 5
Publ
ishe
d on
09
Febr
uary
200
4. D
ownl
oade
d by
Pur
due
Uni
vers
ity o
n 27
/08/
2014
11:
08:5
7.
View Article Online

(Fig. 4c) are shown as a function of the water, methanol, andacetonitrile content of the eluent.
If the water content of the eluent is increased, the elution order ofnitrazepam and clonazepam gradually changes (Fig. 4a); at lowwater contents nitrazepam elutes first, while at high water contentsclonazepam elutes first. The elution order of nitrazepam andclonazepam is also influenced by the type of modifier; withacetonitrile as a modifier clonazepam elutes first, while withmethanol as a modifier nitrazepam elutes first.
This is also observed in Fig. 3b. Clonazepam has a strongerdipole moment than nitrazepam, since it contains a chlorine group.Therefore, it probably dissolves better in acetonitrile, which showsstrong dipole interactions. Furthermore, the different pKa values for
the tertiary amine in nitrazepam and clonazepam, 3.2 and 1.5,respectively,55 might play a role.
If the type of modifier is changed from methanol to acetonitrile,the elution order of lorazepam and the other benzodiazepinessuddenly changes at low amounts of methanol (Fig. 4b and c);nitrazepam and clonazepam elute first at moderate to high methanolcontent, while lorazepam elutes first in the absence of methanol.This is also observed in Fig. 3b. The secondary amine has a pKa
value of 10.8 and 10.5 for nitrazepam and clonazepam, re-spectively, while it has a pKa value of 11.5 for lorazepam.55
Therefore, nitrazepam and clonazepam are better proton donorsthan lorazepam. As a result, these compounds probably dissolvebetter in methanol, which is a good proton acceptor.
Although the actual peak orders cannot be inferred from eitherFig. 3 or 4, both figures clearly show the occurrence of peakcrossover. The true peak order was determined by matching thechromatographic profiles in Fig. 3b to the corresponding spectra.
Optimisation of resolution and analysis time
Based on the predicted resolutions of nitrazepam, clonazepam, andlorazepam (Fig. 4), the minimum resolution is determined for eachgrid point. The response surface of the minimum resolution (Fig. 5)contains several valleys. In these regions the minimum resolution isclose to zero. Therefore, severe peak overlap occurs. Two valleysare located close together at low methanol content (0–10%), whilea third valley roughly connects two corners of factor space, i.e. onewith high water content and methanol as modifier, and the otherwith low water content and acetonitrile as modifier. The irregularappearance of the response surface clearly indicates that directmodelling of the minimum resolution is not a suitable approach.This confirms that the approach used in this paper, modelling of theretention time and peak width at half height, is a preferableapproach, since these response surfaces gradually increase fromone side of factor space to the other without valleys. The retentiontime of the last eluting compound is used as an indication of theanalysis time. The analysis time (Fig. 6) gradually increases fromlow water content with acetonitrile as modifier to high watercontent with methanol as modifier.
In order to optimise the separation system, the minimumresolution is maximised, while, at the same time, the analysis timeis minimised. To facilitate this simultaneous optimisation, a groupof grid points is selected for which the following statement is true:none of the remaining points have a shorter analysis time and ahigher minimum resolution at the same time. These points areknown as Pareto optimal points.56 For these points, the minimumresolution is shown as a function of the analysis time (Fig. 7). The
Fig. 4 Predicted resolutions for nitrazepam and clonazepam (a), ni-trazepam and lorazepam (b), and clonazepam and lorazepam (c). Resolu-tions are in the range 0.0–0.1 (·), 0.1–0.5 (3), 0.5–1.0 (2), 1.0–1.5 (+),1.5–2.0 (8), 2.0–2.5 (*), or > 2.5 (no marker).
Fig. 5 Predicted minimum resolutions. Resolutions are in the range0.0–0.1 (·), 0.1–0.5 (3), 0.5–1.0 (2), 1.0–1.5 (+), or 1.5–2.0 (8). Paretooptimal points are marked (◊) from the fastest analysis (∂) to the highestresolution (D).
A n a l y s t , 2 0 0 4 , 1 2 9 , 2 4 1 – 2 4 82 4 6
Publ
ishe
d on
09
Febr
uary
200
4. D
ownl
oade
d by
Pur
due
Uni
vers
ity o
n 27
/08/
2014
11:
08:5
7.
View Article Online

location of the Pareto optimal points in factor space is also indicated(Fig. 5). If the water content of the eluent is increased from 40 to50% in the absence of methanol, the minimum resolution willincrease dramatically from close to 0 up to approximately 0.8without seriously increasing the analysis time. On the other hand, ifthe minimum resolution is higher than 1.5, the analysis time willincrease significantly without increasing the minimum resolution.Since a minimum resolution of at least 1.5 is required for baselineseparation, an optimum is found for a minimum resolution of 1.66and an analysis time of 12.18 min. This result is obtained for aneluent containing 56% water, 12% methanol, and 32% acetonitrile.The optimum eluent composition is rather close to the compositionof test point D (Table 1). The peaks in the obtained chromatogramfor this test point are indeed quite well separated (Fig. 3a).
ConclusionsIt is possible to optimise the HPLC separation of a sampleautomatically without analysing standards and without userintervention. The procedure, which includes augmented curveresolution for peak tracking, construction and selection of modelsfor the retention time and peak width at half height, prediction ofthe minimum resolution and analysis time based on the obtainedmodels, and selection of an appropriate optimum based on multi-criterion decision-making, requires only a few minutes to performthe necessary calculations. This procedure does not only give theoptimum eluent composition, but it also provides response surfaces.Response surfaces of the resolution can be used to explain thedifferences in the behaviour of compounds as a result of changes inthe eluent composition, while figures of the minimum resolution,
analysis time and Pareto optimal points can be used to evaluate theruggedness of the optimum. It is clear that an optimum which islocated in a part of factor space where the minimum resolution oranalysis time changes rapidly is less rugged than an optimum whichis located on a plateau. Furthermore, guided by a plot of the Paretooptimal points, one might decide to sacrifice some resolution for afaster analysis or vice versa.
The versatility of the procedure enables the use of variousexperimental designs. For example, a simple five point design withfour training points in the corners and one test point in the centremay be used. Although this will save a lot of time, a less complexmodel, e.g. a linear Scheffé model, is required for. As aconsequence only linear effects can be modelled. Since theoptimisation procedure is automated and very fast, the experi-mental design can also be expanded easily, if these linear modelsprove to be inadequate for optimisation.
There are some limitations for the use of this automaticoptimisation procedure. First of all, all components of the samplemust have sufficiently different spectra. Furthermore, the spectra ofthe compounds should not change when the eluent composition ischanged. A large change in the water content, or the replacement ofone modifier by an other, generally only has a relatively smalleffect on the UV spectra. However, changing the pH over a rangethat includes the pKa values of the compounds may have aconsiderable effect on the UV spectra. Therefore, this automaticoptimisation procedure often can not be used, when the pH of theeluent is changed.
As a result of the above mentioned limitations the method is lesssuitable for complex natural samples. The probability that complexnatural samples contain compounds with similar spectra is largerthan for a simple mixture of three compounds, since naturalsamples generally contain much more compounds. Furthermore,natural samples are more likely to contain closely relatedcompounds with similar spectra. In addition, natural samples ofteninclude nitrogen containing compounds which exhibit acid–basebehaviour in the pH range that is normally used in HPLC. Finally,natural samples may contain compounds at trace levels, whichcould lead to problems with the applied threshold in the ITTFAalgorithm.
References1 P. B. Bowman, J. G. D. Marr, D. J. Salvat and B. E. Thompson, J.
Pharm. Biomed. Anal., 1993, 11, 1303.2 J. C. Berridge, Anal. Chim. Acta, 1986, 191, 243.3 N. Lundell and K. Markides, J. Chromatogr., 1993, 639, 117.4 A. M. Siouffi and R. Phan-Tan-Luu, J. Chromatogr., A., 2000, 892,
75.5 J. C. Berridge, J. Chromatogr., 1989, 485, 3.6 P. M. J. Coenegracht, A. K. Smilde, H. J. Metting and D. A. Doornbos,
J. Chromatogr., 1989, 485, 195.7 H. A. H. Billiet and L. de Galan, J. Chromatogr., 1989, 485, 27.8 L. de Galan, Anal. Proc., 1985, 22, 328.9 P. J. Schoenmakers, Optimisation of Chromatographic Selectivity,
Elsevier, Amsterdam, 1986, pp. 233–245.10 G. Szepesi, HPLC in Pharmaceutical Analysis, Vol 1, General
Considerations, CRC Press, Boca Raton, 1990, pp. 151–168.11 I. Molnar, K. H. Gober and B. Christ, J. Chromatogr., 1991, 550, 39.12 M. Otto, W. Wegscheider and E. P. Lankmayr, Anal. Chem., 1998, 60,
517.13 E. P. Lankmayr, W. Wegscheider, J. Daniel-Ivad, I. Kolossváry, G.
Csonka and M. Otto, J. Chromatogr., 1989, 485, 557.14 N. M. Djordjevic, F. Erni, B. Schreiber, E. P. Lankmayr, W.
Wegscheider and L. Jaufmann, J. Chromatogr., 1991, 550, 27.15 A. C. J. H. Drouen, H. A. H. Billiet and L. de Galan, Anal. Chem., 1984,
56, 971.16 A. C. J. H. Drouen, H. A. H. Billiet and L. de Galan, Anal. Chem., 1985,
57, 962.17 T. P. Bridge, M. H. Williams and A. F. Fell, J. Liq. Chromatogr., 1989,
12, 23.18 P. M. J. Coenegracht, H. J. Metting, E. M. van Loo, G. J. Snoeijer and
D. A. Doornbos, J. Chromatogr., 1993, 631, 145.19 A. J. Round, M. I. Aguilar and M. T. W. Hearn, J. Chromatogr., A.,
1994, 661, 61.
Fig. 6 Predicted analysis times. Analysis times are in the range 4.2–7.1 (·),7.1–9.9 (3), 9.9–12.8 (2), 12.8–15.7 (+), 15.7–18.6 (8), or 18.6–21.5 (*)min.
Fig. 7 The minimum resolution as a function of the analysis time for thePareto optimal points.
A n a l y s t , 2 0 0 4 , 1 2 9 , 2 4 1 – 2 4 8 2 4 7
Publ
ishe
d on
09
Febr
uary
200
4. D
ownl
oade
d by
Pur
due
Uni
vers
ity o
n 27
/08/
2014
11:
08:5
7.
View Article Online

20 J. K. Strasters, H. A. H. Billiet, L. de Galan, B. G. M. Vandeginste andG. Kateman, J. Chromatogr., 1987, 385, 181.
21 J. K. Strasters, H. A. H. Billiet, L. de Galan, B. G. M. Vandeginste andG. Kateman, J. Liq. Chromatogr., 1989, 12, 3.
22 J. K. Strasters, H. A. H. Billiet, L. de Galan and B. G. M. Vandeginste,J. Chromatogr., 1990, 499, 499.
23 J. K. Strasters, F. Coolsaet, A. Bartha, H. A. H. Billiet and L. de Galan,J. Chromatogr., 1990, 499, 523.
24 R. Tauler, A. Izquierdo-Ridorsa and E. Casassas, Chemom. Intell. Lab.Syst., 1993, 18, 293.
25 R. Gargallo, R. Tauler and A. Izquierdo-Ridorsa, Biopolymers, 1997,42, 271.
26 R. Tauler and D. Barceló, Trends Anal. Chem., 1993, 12, 319.27 R. Tauler, A. Smilde and B. Kowalski, J. Chemom., 1985, 9, 31.28 M. Amrhein, B. Srinivasan, D. Bonvin and M. M. Schumacher,
Chemom. Intell. Lab. Syst., 1996, 33, 17.29 E. Casassas, R. Gargallo, I. Giménez, A. Izquierdo-Ridorsa and R.
Tauler, Anal. Chim. Acta, 1993, 283, 538.30 R. Tauler, Chemom. Intell. Lab. Syst., 1995, 30, 133.31 J. Saurina, S. Hernández-Cassou and R. Tauler, Anal. Chem., 1995, 67,
3722.32 R. Gargallo, R. Tauler and A. Izquierdo-Ridorsa, Anal. Chem., 1997, 69,
1785.33 M. Vives, R. Gargallo and R. Tauler, Anal. Chim. Acta, 2000, 424,
105.34 R. Tauler, R. Gargallo, M. Vives and A. Izquierdo-Ridorsa, Chemom.
Intell. Lab. Syst., 1999, 46, 275.35 B. S. Grabaric, Z. Grabaric, R. Tauler, M. Esteban and E. Casassas,
Anal. Chim. Acta, 1997, 341, 105.36 R. Tauler, A. Izquierdo-Ridorsa, R. Gargallo and E. Casassas, Chemom.
Intell. Lab. Syst., 1995, 27, 163.37 J. Mendieta, M. S. Díaz-Cruz, M. Esteban and R. Tauler, Biophys. J.,
1998, 74, 2876.38 J. S. Salau, M. Honing, R. Tauler and D. Barceló, J. Chromatogr., A.,
1998, 795, 3.
39 A. Garrido Frenich, M. Martínez Galera, J. L. Martínez Vidal, D. L.Massart, J. R. Torres-Lapasió, K. De Braekeleer, Ji-Hong Wang and P.K. Hopke, Anal. Chim. Acta, 2000, 411, 145.
40 A. Garrido Frenich, D. Picón Zamora, J. L. Martínez Vidal and M.Martínez Galera, Anal. Chim. Acta, 2001, 449, 143.
41 R. Tauler, B. Kowalski and S. Fleming, Anal. Chem., 1993, 65, 2040.42 R. Tauler, A. K. Smilde, J. M. Henshaw, L. W. Burgess and B. R.
Kowalski, Anal. Chem., 1994, 66, 3337.43 S. Lacorte, D. Barceló and R. Tauler, J. Chromatogr., A., 1995, 697,
345.44 R. Tauler, S. Lacorte and D. Barceló, J. Chromatogr., A., 1996, 730,
177.45 P. V. van Zomeren, H. Darwinkel, P. M. J. Coenegracht and G. J. de
Jong, Anal. Chim. Acta, 2003, 487, 155.46 P. J. Gemperline, J. Chem. Inf. Comput. Sci., 1984, 24, 206.47 B. G. M. Vandeginste, W. Derks and G. Kateman, Anal. Chim. Acta,
1985, 173, 253.48 K. V. Mardia, J. T. Kent and J. M. Bibby, Multivariate Analysis,
Academic Press, London, 1979, pp. 268.49 J. A. Cornell, Experiments With Mixtures–Designs, Models, and the
Analysis of Mixture Data, John Wiley & Sons, New York, 1981.50 D. L. Massart, B. G. M. Vandeginste, S. N. Deming, Y. Michotte
and L. Kaufman, Chemometrics: a Textbook, Elsevier, Amsterdam,1988.
51 M. Stone, J. R. Stat. Soc., Ser. B., 1974, 36, 111.52 O. Bunke and B. Droge, Ann. Stat., 1984, 12, 1400.53 D. A. Harville and D. R. Jeske, J. Am. Stat. Assoc., 1992, 87, 724.54 S. Budavari, M. J. O’Neil, A. Smith, P. E. Heckelman and J. F.
Kinneary, The Merck Index, Merck Research Laboratories, WhitehouseStation, NJ, 1996, pp. 404, 953, and 1129.
55 E. G. C. Clarke, A. C. Moffat and J. V. Jackson, Clarke’s Isolation andIdentification of Drugs in Pharmaceuticals, Body Fluids, and Post-mortem Materials, The Pharmaceutical Press, London, 1986.
56 M. M. W. B. Hendriks, J. H. de Boer, A. K. Smilde and D. A. Doornbos,Chemom. Intell. Lab. Syst., 1992, 16, 175.
A n a l y s t , 2 0 0 4 , 1 2 9 , 2 4 1 – 2 4 82 4 8
Publ
ishe
d on
09
Febr
uary
200
4. D
ownl
oade
d by
Pur
due
Uni
vers
ity o
n 27
/08/
2014
11:
08:5
7.
View Article Online