Embed Size (px)
Citation preview

Article
Optimisation of a reduced volume PCR amplification for PowerPlex® Fusion kit using FTA™ cards and generation of population genetic data for Brunei population
Liew, Paul Vun Onn, Riccardi, Laura Natalia, Afolabi, Abimbola Olatunde, Goodwin, William H and Hadi, Ss
Available at http://clok.uclan.ac.uk/23971/
Liew, Paul Vun Onn, Riccardi, Laura Natalia, Afolabi, Abimbola Olatunde, Goodwin, William H and Hadi, Ss ORCID: 0000000229943083 (2018) Optimisation of a reduced volume PCR amplification for PowerPlex® Fusion kit using FTA™ cards and generation of population genetic data for Brunei population. ELECTROPHORESIS, 39 (23). pp. 29792990. ISSN 01730835
It is advisable to refer to the publisher’s version if you intend to cite from the work.http://dx.doi.org/10.1002/elps.201800256
For more information about UCLan’s research in this area go to http://www.uclan.ac.uk/researchgroups/ and search for <name of research Group>.
For information about Research generally at UCLan please go to http://www.uclan.ac.uk/research/
All outputs in CLoK are protected by Intellectual Property Rights law, includingCopyright law. Copyright, IPR and Moral Rights for the works on this site are retained by the individual authors and/or other copyright owners. Terms and conditions for use of this material are defined in the http://clok.uclan.ac.uk/policies/
CLoKCentral Lancashire online Knowledgewww.clok.uclan.ac.uk

www.electrophoresis-journal.com Page 1 Electrophoresis
Received: 06 26, 2018; Revised: 07 24, 2018; Accepted: 08 06, 2018
This article has been accepted for publication and undergone full peer review but has not been
through the copyediting, typesetting, pagination and proofreading process, which may lead to
differences between this version and the Version of Record. Please cite this article as doi:
10.1002/elps.201800256.
This article is protected by copyright. All rights reserved.
Optimisation of a reduced volume PCR amplification for PowerPlex® Fusion kit using FTA™ cards
and generation of population genetic data for Brunei population
Paul Vun Onn Liew1, Laura Natalia Riccardi1, Abimbola Olatunde Afolabi1, William Goodwin1, Dr.
Sibte Hadi PhD1*
1School of Forensic and Applied Sciences, University of Central Lancashire, Preston, UK
Dr. Sibte Hadi PhD1 *
1School of Forensic and Applied Sciences, University of Central Lancashire, Preston, UK
*Corresponding Author
Email: [email protected]
Telephone: +44 1772894395
http://orcid.org/0000-0002-2994-3083
Abstract
The commercial PowerPlex® Fusion kit is an autosomal STR multiplex kit that has high discrimination
power and is more informative in forensic, paternity and relationship-testing cases. Key features of
this multiplex system are the possibility to direct amplify FTA™ card punches as well as non-FTA
cards and commonly used swabs; optimised inhibitor tolerance and high sensitivity generating full
profiles from as little as 100 pg of human DNA.
This study focused on the optimization of performance variables such as FTA™ punch sizes, reduced
reaction volumes, and FTA™ purification reagent aiming to increase the analytical sensitivity,
decrease the sample consumption and cost effectiveness. LOD and LOQ values demonstrated high

www.electrophoresis-journal.com Page 2 Electrophoresis
This article is protected by copyright. All rights reserved.
sensitivity of the PowerPlex® Fusion system. In addition, population databases of Brunei Malay and
Chinese from the Brunei Darussalam were established, and parameters of forensic importance were
calculated. Overall, the forensic parameters indicated an enhanced utility of the PowerPlex® Fusion
kit for forensic evidence analysis and paternity testing in Brunei Malay and Chinese populations.
Keywords: Brunei population, Forensic genetics, FTA™ cards, PCR optimization, PowerPlex® Fusion,
STRs
Additional supporting information may be found in the online version of this article at the
publisher’s web-site.
1 Introduction
Forensic DNA typing is constantly evolving and new commercial STR kits have been released with
increased number of loci, improving the discrimination capacity of the kits. PowerPlex® Fusion kit
allows simultaneous amplification of 22 autosomal STR loci using extracted DNA or FTA™ punches,
generating profiles suitable for comparison with databases like the expanded CODIS or European
Standard Set (ESS) requirements. The system has some key features like the inclusion of DYS391,
which serves as an additional gender confirmation marker catering for individuals exhibiting
Amelogenin deletion and an expanded STR loci panel improving genotyping accuracy and efficiency
[1, 2]. Furthermore, nine loci yielding PCR products under 220 bp are integrated into the PowerPlex®
Fusion kit ensuring a higher success rate with degraded casework samples. Sensitivity of the kit is
able to meet the challenges of low template DNA samples as it can reliably generate full profiles
from as little as 100 pg of human DNA
(https://ita.promega.com/resources/webinars/worldwide/archive/powerplex-fusion-system-
overview-and-developmental-validation-preliminary-summary/).

www.electrophoresis-journal.com Page 3 Electrophoresis
This article is protected by copyright. All rights reserved.
FTA™ cards have become a standard substrate for collection of DNA samples. DNA profiles
generated from FTATM card punches usually produce higher peak heights, and proved better than
extracted DNA in an EDTA titration study displaying a higher allele call rate even in the presence of
inhibitors [1]. The gold standard to avoid PCR inhibition is to purify DNA from the sample, but for
FTATM card punches this is unavoidable to some extent as they are directly amplified or are washed
and amplified. In body fluids like blood, polypeptides, haemoglobin and lactoferrin have been
identified as PCR inhibitors which interact with DNA polymerase blocking its activity [1]. Proven
methods to overcome inhibition are increasing the amount of DNA polymerase, adding amplification
facilitators such as Bovine Serum Albumin (BSA) or filtering or diluting the DNA extract [2]. Due to
the nature of FTATM card, reducing the punch size would result in DNA template dilution in the PCR
reaction and the advantage would be conservation of the sample. However, a reduction of the PCR
reaction volume poses some challenges as the kinetics of the reaction lead to stochastic effects due
to enhanced sensitivity [3, 4]. Conversely, the increased sensitivity of the reduced volume reaction
can enhance the interpretation of DNA mixtures favouring the detection of peaks from the minor
contributor [3, 5]. Reduced volume PCR for the STR multiplex kits used for forensic purposes has
been employed with normal and fast PCR protocols/different enzymes with positive results [6, 7].
The main advantage being the ability to amplify low template samples shown through sensitivity
studies. However, the PCR optimisation needs to be carefully carried out so that PCR artefacts do not
compromise the results.
The aim of this study was to optimise a reduced volume PCR reaction for the PowerPlex® Fusion kit in
order to increase the analytical sensitivity while decreasing sample consumption. Performance
variables crucial in determining the reliability and reproducibility of an optimised assay such as FTA™
punch sizes, reduced reaction volumes, and FTA™ purification reagent, were tested, and statistically
analysed.
The population samples from Brunei Malay and Chinese were then analysed using optimised
conditions and evaluated, to establish population databases. All work was conducted at the Forensic

www.electrophoresis-journal.com Page 4 Electrophoresis
This article is protected by copyright. All rights reserved.
Biology/DNA Laboratory of the Department of Scientific Services, Brunei Darussalam and School of
Forensic and Applied Sciences, University of Central Lancashire, Preston, UK.
2 Material and Methods
2.1 PCR optimisation study
The influence of FTA™ punch sizes, reduced reaction volumes, and FTA™ purification reagent
(Whatman, Maidstone, UK) on PCR was assessed using FTA™ punches of 0.5 or 1.2 mm taken blood
stained FTA™ Micro Card (GE Healthcare, Buckinghamshire, UK), from 8 donors (2 males and 6
females). DNA samples from these donors were amplified in triplicate for establishing the genotypes.
All replicate punches were made within a few mm area preventing intra-sample variation. The punch
was cleaned by punching a fresh FTA™ card twice in between punching different samples. Ethical
approval for conducting the study was granted by the Department of Scientific Services, Ministry of
Health in Brunei Darussalam and University of Central Lancashire.
2.1.1 FTA™ punch size study
According to manufacturer’s protocol a 1.2 mm FTA™ punch contains about 5-20 ng of DNA, whereas
a 0.5 mm punch would yield approximately 2-8 ng [4]. These were used to evaluate the impact of
the reduced amount of input DNA in terms of sensitivity, fluorescence intensity, and STR peak
morphology [8]. Allelic ladders and positive/negative controls were verified against manufacturer’s
data to determine PCR efficiency, null alleles and artefacts such as stutters, split peaks,
microvariants, tri-allelic patterns, spikes, and mutations [8].
2.1.2 Reaction volume study
An equivalent amount of input DNA was amplified in a final volume of 12.5 and 6.25 μL to determine
PCR sensitivity, profile accuracy/quality and stochastic effects of reduced volume reactions.
Triplicate PCRs were prepared for this study including the positive and negative controls.

www.electrophoresis-journal.com Page 5 Electrophoresis
This article is protected by copyright. All rights reserved.
2.1.3 Purification study
A batch of the 10 FTA™ punches (0.5 mm) were washed thrice with 200 μl of FTA™ purification
reagent (Whatman, Maidstone, UK) and twice in 200 μl of TE buffer (10 mM Tris-HCl, 1 mM EDTA,
pH 8.0). They were then dried on a hot block at 72°C for 3 minutes.
2.2 Population samples collection
Blood stains spotted on FTA™ Micro Card (GE Healthcare, Buckinghamshire, UK) were collected using
finger prick method from 505 healthy unrelated individuals (age 12-60 yr) after obtaining written
informed consent. Participants were citizens or permanent residents of Brunei Darussalam and were
asked to provide detailed ethnic information through a questionnaire; also four-generation pedigree
charts were recorded. Only participants having at least three-generation of consistent Brunei
Darussalam Malay or Chinese heritage were included. Subjects of mixed ethnic background were not
included in this study.
2.3 PCR amplification
PCR amplification was performed using the PowerPlex® Fusion kit (Promega, Madison, WI) according
to the manufacturer’s instructions, except for the reduced reaction volumes (6.25/12.5 μL) and 26
PCR cycles. For the FTA™ punch size study as well as for the purification study, all PCRs were carried
out using 0.5/1.2 mm punches in a final reaction volume of 6.25 and 12.5 μL. For comparison, 10 PCR
amplifications were carried out using 0.5/1.2 mm punches in 25 μL volume as well. Furthermore, 50
negative controls were amplified in triplicate in PCR volumes of 6.25 and 12.5 μL.
FTA™ card samples collected from Brunei Darussalam Malay and Chinese populations were punched
using the Harris Micro-Punch® (Whatman, Maidstone, UK) with 1.2 mm punches which were purified
using FTA™ purification reagent and amplified in a final reaction volume of 12.5 μL. The puncher
was cleaned by punching a fresh FTA™ card twice in between punching successive samples.

www.electrophoresis-journal.com Page 6 Electrophoresis
This article is protected by copyright. All rights reserved.
2.4 Capillary electrophoresis
1 μ1 PCR products were prepared in 8.7 μl formamide and 0.8 μl CC5 ILS and injected into a 3130xl
Genetic Analyser (ThermoFisher Scientific, Waltham, MA, USA) using an injection time of 10 s at 3 kV
using. Reference allelic ladder provided with the PowerPlex® Fusion kit (Promega, Madison, WI) were
prepared like the amplifications and were used in each injection. Raw data were analysed using the
GeneMapper® ID-X v1.2 software using 50 RFU allele calling threshold and all other parameters were
kept at default values (ThermoFisher Scientific, Waltham, MA, USA). A GeneMapper® ID-X minus 4
stutter filter was set at 15%.
2.5 Statistical analysis
2.5.1 Optimisation study
The STR profile quality was evaluated following the routine protocol employed at the Department of
Scientific Services, Ministry of Health of Brunei Darussalam [9]. Furthermore, the average peak
heights for each locus, the mean heterozygote peak height ratios, and the percentage of the known
DNA profile detected were measured for all the variables considered in the optimisation study [10].
2.5.2 Limit of detection (LOD) and limit of quantification (LOQ)
Data from 50 negative amplification controls were pooled to assess baseline noise in order to
calculate the LOD and LOQ. The peak amplitude threshold of the GeneMapper® ID-X software
analysis method was adjusted to 1 relative fluorescent unit (RFU) to capture all data points, and the
analysis range was modified to correspond to the expected range of fragment sizes (75-475bp). Peak
heights attributed to spikes were removed from the data set, and the remaining data exported to a
Microsoft® Excel spreadsheet to calculate the average RFU values as well as the standard deviation
values of peak heights for each dye. LOD threshold was set to the average noise of the negative
controls plus 3 standard deviations, and LOQ was set at 10 standard deviations.

www.electrophoresis-journal.com Page 7 Electrophoresis
This article is protected by copyright. All rights reserved.
2.5.3 Population study
AmpFℓSTR® Identifiler kit (unpublished data) results from 203 Malay and 198 Chinese samples which
were previously genotyped using the kit, were used to perform a concordance check of genotypes.
For any observed discrepancy a re-amplification was performed to confirm it.
PowerStats 1.2 Microsoft® Excel spreadsheet (Promega, Madison, WI) [11] was used to calculate
allele frequencies and bio-statistic forensic parameters useful to assess the utility of the loci for
forensic and paternity purposes, namely Observed (Ho) and Expected Heterozygosity (He), Power of
Discrimination (PD), Power of Exclusion (PE), Match Probability (MP), Polymorphic Information
Content (PIC), Typical Paternity Index (TPI) and exact test (p) were estimated.
Analysis of Molecular Variance (AMOVA), departures from Hardy–Weinberg Equilibrium (HWE)
expectations and Linkage Disequilibrium (LD) between each pair of loci and pairwise FST values and
non-differentiation exact tests were performed using the software Arlequin version 3.5 [12]. Allele
frequencies of the Brunei Darussalam Malay were compared with previously published data from
Singapore and Malaysia Malay, East Timor population and Filipinos from the Philippines [13, 14, 15].
Brunei Chinese were compared with previously published allele frequencies from Singapore and
Malaysia Chinese, Hong Kong Chinese, Taiwanese, Koreans and Japanese [13, 16, 17, 18, 19].
3 Results
3.1 Profile quality assessment
3.1.1 FTA™ punch size study
The 0.5 and 1.2 mm FTA™ punches from four samples were amplified in a final volume of 6.25 μL at
26 PCR cycles (Supplemental Fig. 1). All loci showed balanced heterozygote peaks in the replicates
though differences in peak heights across the four samples were observed (Supplemental Table 1).

www.electrophoresis-journal.com Page 8 Electrophoresis
This article is protected by copyright. All rights reserved.
One of the two 0.5 mm punches showed dropouts at TPOX and D22S1045 loci, as well as low peak
heights at the D19S433 and FGA loci (Supplemental Fig. 2).
3.1.2 Reaction volume study
Reducing reaction volumes to half (12.5 μL) or to a quarter (6.25 μL) produced EPGs with higher peak
intensities (Supplemental Fig. 3), and peak height balance was maintained in all the samples
(Supplemental Table 2).
3.1.3 Purification study
Purified samples showed a better balance of peak heights compared to all the other tested
conditions (Supplemental Table 3 and 4), and samples exhibited higher peak intensities
(Supplemental Fig. 4).
3.2 Average peak heights
Peak heights for each locus were averaged between samples for two punch sizes (0.5 and 1.2 mm)
and both 6.25 and 12.5 µl PCR amplifications (Supplemental Table 4).
3.3 Peak height ratio
Profiles generated from 0.5 and 1.2 mm punches, in different PCR reaction volumes for un purified
punches and purified with the FTA™ purification reagent, were used to calculate the peak height
ratio (PHR) between sister alleles. Mean PHRs with standard error are reported in Supplemental
Table 5.
3.4 Percentage of the known DNA profile detected
Full, concordant profiles were obtained from most of the samples assigning 100% of the expected
alleles for all the variables tested (see concordance section for details).
3.5 Additional DNA samples
Balanced peaks were observed across loci for all the eight samples analysed in triplicate, except for
one sample which failed to amplify once. Loci affected by low peak heights were D10S1248,

www.electrophoresis-journal.com Page 9 Electrophoresis
This article is protected by copyright. All rights reserved.
D13S317, D2S1338, CSF1PO, TPOX, D22S1045, D19S433, FGA plus the Y-chromosome marker
DYS391; stutters, spikes, and microvariant were the observed artefacts. Except locus D2S1358 where
the minus 4 stutter was noted at approx 10 RFU of the corresponding allelic peak; all other loci had
minus 4 stutter below 10% of the allelic peak (data not shown). In 3 amplifications reactions
dropouts occurred at TPOX, D22S1045, and D10S1248 loci. We attributed this to less number of cells
deposited on the FTA paper rather than the technique.
Average peak height spanned from 213 RFU at DYS391 to 4410 RFU at the amelogenin locus, while
the highest value of mean peak height ratio was 98.7% for the D5S818 marker reducing to 27.2% for
TH01. Finally, all the profiles showed a 100% allele-calling consistency across the three replicates.
3.6 LOD and LOQ baseline calculations
Values for LOD and LOQ calculated from amplification of 50 negative samples (Supplemental Table
6).
3.7 Population study
3.7.1 Concordance
The concordance rate for the Brunei Darussalam Malay and Chinese datasets for Identifiler and
Fusion kits were 99.94% and 99.98% respectively (Supplemental Table 7). Five discordant calls
occurred at loci D16S539, D8S1179 and D21S11 within four Malay samples and one Chinese sample
(Supplemental Table 8). Discrepancies observed at D16S539 and D8S1179 loci were probably due to
PCR primer position differences causing the large-allele drop out. PowerPlex® Fusion kit (Promega,
Madison, WI) recovered the microvariant allele 30.3 at D21S11 locus which the AmpFℓSTR®
Identifiler kit failed to assign. The discordant samples were excluded from the calculation of allele
frequencies. All samples showing discordant alleles were amplified and injected in the genetic DNA
analyser twice for confirmation.

www.electrophoresis-journal.com Page 10 Electrophoresis
This article is protected by copyright. All rights reserved.
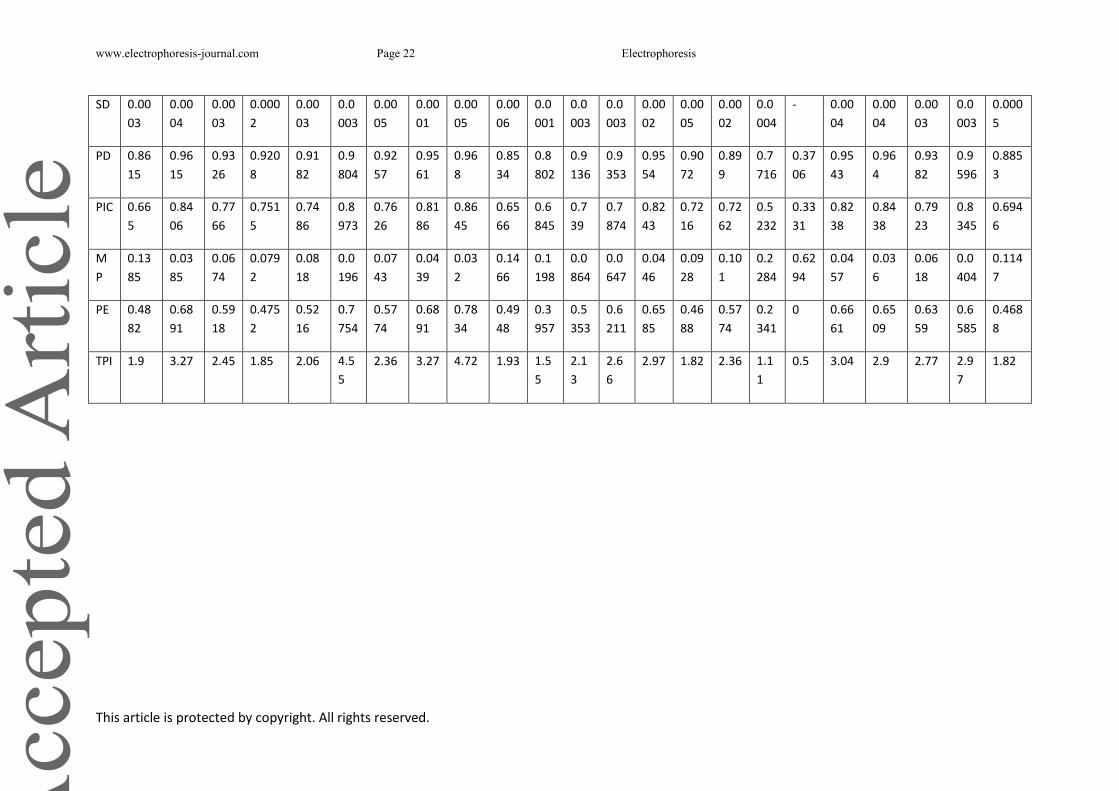
3.7.2 Allele frequencies
Allele frequencies and forensic parameters for all the loci included in the PowerPlex® Fusion
multiplex kit were calculated for the Brunei Darussalam Malay (Table 1) and Chinese (Table 2)
separately, and as one population (Table 3).
The Malay population showed significant departure from Hardy-Weinberg equilibrium at Penta D (p
= 0.0060) and D10S1248 (p = 0.0351) loci. Conversely, no departures were observed in the Chinese
population. The combined data showed Hardy-Weinberg equilibrium for all loci except D10S1248 (p
= 0.0386). However, Bonferroni’s correction (p = 0.0023) yielded no significant departures for this
locus.
The combined matching probability calculated for the 22 autosomal STR loci, was 2.11x10⁻²⁶ in
Malay; 3.36x10⁻²⁶ in Chinese, and 8.10x10⁻²⁷ in the pooled population; whereas the combined PD
values were >0.999999999999999999999999999 and the combined power of exclusion
>0.99999999.
The observed gene diversity for the Y-chromosome marker DYS391 was 0.3680 in Malay, 0.3185 in
Chinese, and 0.3502 when combine; while match probability 0.6294, 0.6841 and 0.6504 respectively,
and PD values were 0.3706, 0.3159 and 0.3496.
The AMOVA analysis (p = 0.051639) showed no significant differences between Brunei Malay and
Chinese. Furthermore, linkage disequilibrium was tested on the combined population, as well as on
both populations separately, and it was observed only in the Brunei Malay population for the
D7S820 locus with Penta D (p = 0.00391) and D10S1248 (p = 0.02151). However, the statistical
significances were corrected after applying Bonferroni’s correction (p = 0.0002).
4 Discussion
Reducing total PCR volume of commercial kits can help increase detection limits, sensitivity, and
reduce sample consumption which is crucial for Forensic DNA laboratories. However, altering
manufacturer’s recommended protocols requires optimisation in order to generate robust and

www.electrophoresis-journal.com Page 11 Electrophoresis
This article is protected by copyright. All rights reserved.
acceptable results in terms of signal intensity and heterozygote balance. In DNA profiling, different
parameters can be altered to find out the best conditions resulting in an optimal performance. In
this study we choose to use the manufacturer’s recommended PCR conditions and tested reduced
volume PCR. Furthermore, the influence of FTA™ punch sizes and use of FTA™ purification reagent
were evaluated for amplification of FTA™ punches using PowerPlex® Fusion kit.
Reduction of FTA™ punch sizes from 1.2 to 0.5 mm was challenging due to static forces causing
punches to jump out into another tube or well, requiring re-punching. Moreover, pipetting
represented a critical factor as small punches could be sucked into the tip when performing washes
with FTA™ purification reagent. Generally 0.5 mm punches gave better intensity peaks than 1.2 mm
punches probably due to less amount of inhibitors competing with PCR products.
The peak intensities when using 0.5 mm punches were around 3000 RFU in height indicating
efficient PCR amplification. Low peaks observed at the DYS391 locus were expected and previously
described [2]. Some other markers showed low signal intensity (Supplemental Table 2). Most of
these markers were located in the mid molecular weight region of the PowerPlex® Fusion panel:
D10S1248 (250-300bp), D13S317 (300-350bp), D2S1338 (225-300bp), CFS1PO (320-350bp), D19S433
(200-250bp) and FGA (270-410bp) [1]. The minimum and maximum average peak heights were
higher for 1.2 mm punch samples than the 0.5 mm, conversely, the minimum PHR of the 1.2 mm
punches was lower than that of 0.5 mm punches spanning from 64.8% to 98.1%. The profiles
generated from both punch sizes were correctly called for all the samples with two dropouts
occurring at TPOX and D22S1045 loci in two samples.
The reduced volume of 6.25 μL PCR reaction yielded the highest minimum and maximum average
peak heights. Also PHR was not affected by PCR volume as comparable average values for 6.25 μL
and 12.5 μL reactions were observed. Furthermore, testing of additional samples in triplicates
allowed to test the reliability of the 6.25 μL reaction and all but three amplifications showed full
profiles. Amplification of 0.5 mm size punches allowed also to calculate the LOD and LOQ values
demonstrating the high sensitivity of the PowerPlex® Fusion system.

www.electrophoresis-journal.com Page 12 Electrophoresis
This article is protected by copyright. All rights reserved.
Washing the 0.5 mm punches with the FTA™ purification reagent prior to the 6.25/12.5 μL PCR
resulted in higher signal intensity and a better PHR.
Concordance evaluations for the PowerPlex® Fusion kit had highlighted a severely imbalanced allele
9 at D16S539 before and this was corrected in the developmental validation study of the PowerPlex®
Fusion system [1], however our results showed that it still existed. A severe imbalance was also
observed at D8S1179 locus which might be due to sequence differences of the different primer set
used in the two kits. The microvariant allele 30.3 at D21S11 locus was correctly assigned using the
PowerPlex® Fusion system demonstrating an increased genotyping accuracy. However, sequencing of
the discordant samples might help to determine the nature of the discordances.
In this study population databases for Brunei Malay and Chinese, as well as the combined allele
frequency database were established for the Brunei population. Among the 22 STR loci, the Penta E
locus appeared to be the most informative marker showing similar Power of discrimination (PD)
values 0.9804 in Malay, 0.9829 in Chinese, and 0.9842 in the Brunei pooled population. TPOX locus
had lower PD values of 0.7716, 0.7506 and 0.7625 for the Malay, Chinese and Brunei populations
respectively. This was consistent with the Polymorphic Information Content (PIC) values observed.
Overall, the forensic parameters indicated quite an enhanced utility of the PowerPlex® Fusion kit for
forensic evidence analysis and paternity testing in Brunei Malay and Chinese. Since AMOVA results
indicated no significant genetic variation between Brunei Malay and Chinese, the combined allele
frequencies of these two ethnic groups can be used to calculate match probability.
Based on pairwise FST comparison between Brunei Malay and neighbouring populations the most
distant populations were East Timorese, Singapore and Malaysia Malay followed by Indonesian and
Filipinos. The Malays from the peninsula of Malaysia and Singapore consist of various sub-ethnic
groups which might have different ancestral origins based on their migrations centuries ago. The
exact origins of the Malaysia and Singapore Malays are still unknown due to migrating populations
from surrounding areas which brought varying degrees of genetics admixtures [20], but Singapore
Malays might have underwent more admixture due to the geographical position of Singapore and to

www.electrophoresis-journal.com Page 13 Electrophoresis
This article is protected by copyright. All rights reserved.
international migrations contributing to shape the Singapore population as it is today. Perhaps
Brunei Malay genetic makeup derives from the Borneo indigenous groups.
(http://www.dnatribes.com/dnatribes-digest-2013-06-01.pdf).
We show that Brunei Chinese were equally distant from Malaysia Singapore, Taiwan and Hong Kong
Chinese, this could be explained by migration and ethnical crossbreeding or admixture of the Brunei
Chinese population [21].
The Brunei Chinese were initially brought in by the British during the British protectorate period to
develop Brunei back in 1905 (http://www.dnatribes.com/dnatribes-digest-2013-06-01.pdf). They
came from Kinmen or Quemoy, a Taiwanese county. After the discovery of oil in 1929, there was an
influx of Chinese from Sarawak, Singapore and Hong Kong. This explains the high similarity of the
Brunei Chinese with the Chinese from Malaysia, Singapore, Hong Kong, and Taiwan. The Koreans and
Japanese the two groups most distant from Brunei population among the populations studied here.
Geographically, Japan and Korea are very distant from Brunei and the genetic dissimilarity is well
accepted.
The authors have declared no conflict of interest.
5 References
[1] Oostdik, K., Lenz, K., Nye, J., Schelling, K., Yet, D., Bruski, S., Strong, J., Buchanan, C., Sutton, J.,
Linner, J., Forensic Sci. Int. Genet. 2014, 12, 69–76.
[2] Turrina, S., Ferrian, M., Caratti., S, De., Leo, D., Int. J. of Legal Med. 2014, 128, 281-283.
[3] Bessetti, J., Profiles in DNA 2007, 10, 9–10.
[4] Aladdini, R., Forensic Sci. Int. Genet. 2012, 6, 297–305.
[5] Wong, H. Y., Lim, E. S. S., Tan-Siew, W.F., Forensic Sci. Int. Genet. 2012, 6, 176–179.
[6] Butts, E. L. 1., Vallone, P. M., Electrophoresis 2014, 35, 3053-61.
[7] Connon, C. C., LeFebvre, A. K., Benjamin, R.C., Forensic Sci. Int. Genet. 2016, 25, 112-124

www.electrophoresis-journal.com Page 14 Electrophoresis
This article is protected by copyright. All rights reserved.
[8] Butler, J. M., Forensic DNA typing: biology, technology and genetics of STR markers, Academic
Press, London, 2005.
[9] DNA Profiling Quality Manual Ver. 1.2, State Printers, Brunei Darussalam, 2013.
[10] Scientific Working Group on DNA Analysis Methods, SWGDAM Interpretation Guidelines for
Autosomal STR Typing by Forensic DNA Testing Laboratories, 2010, http://www.fbi.gov/about-
us/lab/codis/swgdam.pdf.
[11] Tereba, A., Profiles in DNA 1999, 2, 14-16
[12] Excoffier, L., Lischer, H. E. L., Mol. Ecol. Res. 2011, 10, 564–567.
Limprasert, P., Feisal, M. A., Rizman-Idid, M., Zilfalil, B. A., PLoS One 2014, 8, 5.
[13] Seah, L. H., Jeevan, N. H., Othman, M. I., Jaya, P., Ooi, Y. S., Wong, P. C., Kee, S.S ., Forensic Sci.
Int. Genet. 2003, 138, 134-137.
[14] Outo, L., Tavares, F., Moreira, H., Corte-Real, F., Forensic Sci. Int. Genet. Suppl Series 2013, 4,
e105-e106.
[15] Smith, B. G., Lee, B., Budowle, B., Allen, R. W., Int. J. Legal Med. 2009, 11, 159-161.
[16] Law, M., To, K., Ho, S., Pang, B., Wong, L., Wun, H., Yau, S., Chan, K., Forensic Sci. Int. Genet.
2009, 129, 64-67
[17] Wang, C., Chen, D., Chen, C., Lu, S., Sun, C., Forensic Sci. Int. Genet. 2003, 138, 119-122.
[18] Park, J., Hong, S., Kim, J., Chong, Y., Han, S., Jeon, C., Ahn, H., Forensic Sci. Int. Genet. 2013, 7,
e76-e77.
[19] Fuji, K., Iwashima, Y., Kitayama, T., Nakahara, H., Mizuno, N., Sekiguchi, K., Int J of Leg Med.
2014, 16 234-237.
[20] Hatin, A. W. I., Nur-Shafawati, A. R., Zahri, M. K., Xu, S., Jin, L., Tan, S. G., Rizman-Idid, M,, Zilfalil,
B. A., PLoS One 2011, e18312.
[21] Hatin, A. W. I., Nur-Shafawati, A. R., Etemad, A., Jin, W., Qin, P., Xu, S., Jin, L., Tan, S. G., PLoS
One 2014, 8, 5

www.electrophoresis-journal.com Page 15 Electrophoresis
This article is protected by copyright. All rights reserved.

www.electrophoresis-journal.com Page 16 Electrophoresis
Received: 06 26, 2018; Revised: 07 24, 2018; Accepted: 08 06, 2018
This article has been accepted for publication and undergone full peer review but has not been through the copyediting, typesetting, pagination and
proofreading process, which may lead to differences between this version and the Version of Record. Please cite this article as doi: 10.1002/elps.201800256.
This article is protected by copyright. All rights reserved.
Table captions:
Table 1: Allele frequencies and forensic statistical parameters for the 22 STR loci in Brunei Malay population
All
ele
D3S
1358
D1S
1656
D2S
441
D10S
1248
D13
S317
Pen
ta E
D16
S539
D18
S51
D2S
1338
CSF
1PO
Pen
ta
D
TH
01
vW
A
D21
S11
D7S
820
D5S
818
TP
OX
DYS
391
D8S
1179
D12
S391
D19
S433
FG
A
D22S
1045
5 0.0
31
6 0.0
04
0.0
98
7 0.00
2
0.00
2
0.0
25
0.3
2
0.00
2
0.01
8 0.24
7
0.0
02
0.01
2
0.00
4
0.0
18
0.1
43
0.17
8
0.00
4
0.5
27
9 0.10
8
0.0
12
0.19
6
0.00
2
0.03
1
0.4
45
0.2
86
0.05
3
0.04
5
0.1
02
0.06
1
0.00
4
9.1 0.01
9.3 0.0
51

www.electrophoresis-journal.com Page 17 Electrophoresis
This article is protected by copyright. All rights reserved.
10 0.00
2
0.18
6
0.11
4
0.0
39
0.16
5
0.00
2
0.25
1
0.1
2
0.1
02
0.2 0.28 0.0
12
0.77
3
0.07
8
11 0.12
4
0.29
4
0.30
6
0.1
84
0.31 0.01 0.31 0.0
55
0.37
6
0.26
9
0.3
39
0.16
6
0.13
3
0.00
2
0.28
11.
3
0.14
9
12 0.02
5
0.17
1
0.078 0.19
6
0.1
08
0.17
8
0.06
7
0.35
7
0.2
39
0.16
1
0.25
9
0.0
2
0.07
5
0.02
4
12.
3
0.00
2
13 0.00
2
0.10
4
0.02
5
0.267 0.02
2
0.0
73
0.11
4
0.06
7
0.04
3
0.0
78
0.02
4
0.12
2
0.24
1
0.23
7
0.008
13.
2
0.04
5
13.
3
0.00
2
14 0.01
2
0.11
6
0.14
9
0.28 0.00
6
0.1
08
0.02
5
0.21 0.00
2
0.0
06
0.1
57
0.00
6
0.01 0.17
8
0.18 0.027
14.
2
0.11
6
15 0.29
6
0.23
1
0.01
2
0.194 0.1
12
0.28
8
0.0
1
0.1
02
0.00
2
0.15
5
0.00
6
0.09
4
0.0
02
0.371

www.electrophoresis-journal.com Page 18 Electrophoresis
This article is protected by copyright. All rights reserved.
15.
2
0.00
2
0.26
3
15.
3
0.00
8
16 0.29
6
0.19
8
0.00
2
0.143 0.0
69
0.12
5
0.02 0.1
37
0.11
6
0.02
2
0.00
4
0.124
16.
2
0.02
4
16.
3
0.00
8
17 0.31
8
0.05
9
0.035 0.0
73
0.08
2
0.11
2
0.2
2
0.01
4
0.09
2
0.00
6
0.175
17.
2
0.00
6
17.
3
0.07
8
18 0.07
1
0.01
4
0.002 0.0
53
0.04
9
0.05
1
0.2
75
0.00
6
0.15
7
0.0
12
0.004
18.
3
0.03
1
0.00
2
19 0.00
6
0.00
2
0.0
41
0.04
7
0.16
3
0.0
96
0.18
4
0.0
86
0.012

www.electrophoresis-journal.com Page 19 Electrophoresis
This article is protected by copyright. All rights reserved.
19.
2
0.0
02
20 0.0
49
0.01
6
0.09
8
0.0
14
0.21
2
0.0
27
20.
2
21 0.0
2
0.01
2
0.02
4
0.09
4
0.2
18
21.
2
0.0
02
22 0.0
2
0.00
2
0.10
2
0.12
5
0.2
12
22.
2
0.0
12
23 0.0
02
0.00
8
0.16
5
0.04
9
0.1
73
23.
2
0.0
04
24 0.0
02
0.00
8
0.16
7
0.02
4
0.1
12
24.
2
0.0
02

www.electrophoresis-journal.com Page 20 Electrophoresis
This article is protected by copyright. All rights reserved.
25 0.0
04
0.00
2
0.07
1
0.00
6
0.02
4
0.0
57
25.
2
0.0
04
26 0.02
4
0.00
8
0.0
45
26.
2
0.0
02
27 0.00
6
0.00
4
0.00
2
0.0
2
28 0.03
5
0.0
08
28.
2
0.00
2
29 0.21
4
0.0
02
30 0.24
5
30.
2
0.02
2
31 0.16
5

www.electrophoresis-journal.com Page 21 Electrophoresis
This article is protected by copyright. All rights reserved.
31.
2
0.07
1
32 0.04
9
32.
2
0.10
2
33 0.00
2
33.
2
0.07
1
34 0.00
2
34.
2
0.00
8
35.
2
0.00
4
Ho 0.73
26
0.84
88
0.79
46
0.728
7
0.75
97
0.8
876
0.77
91
0.84
88
0.89
54
0.74
03
0.6
783
0.7
636
0.8
14
0.83
33
0.72
48
0.79
07
0.5
543
- 0.83
72
0.82
95
0.82
17
0.8
333
0.724
8
He 0.71
95
0.85
82
0.80
67
0.785
3
0.78
45
0.9
07
0.79
46
0.83
82
0.87
9
0.71
26
0.7
213
0.7
737
0.8
151
0.84
45
0.75
86
0.76
7
0.5
981
- 0.84
35
0.86
2
0.81
79
0.8
542
0.739
p 0.82
29
0.52
17
0.47
53
0.035
1
0.11
73
0.7
497
0.62
69
0.99
17
0.32
52
0.45
67
0.0
06
0.9
175
0.1
829
0.80
79
0.46
34
0.05
27
0.6
726
- 0.45
02
0.59
98
0.76
41
0.7
676
0.479
5
www.electrophoresis-journal.com Page 22 Electrophoresis
This article is protected by copyright. All rights reserved.
SD 0.00
03
0.00
04
0.00
03
0.000
2
0.00
03
0.0
003
0.00
05
0.00
01
0.00
05
0.00
06
0.0
001
0.0
003
0.0
003
0.00
02
0.00
05
0.00
02
0.0
004
- 0.00
04
0.00
04
0.00
03
0.0
003
0.000
5
PD 0.86
15
0.96
15
0.93
26
0.920
8
0.91
82
0.9
804
0.92
57
0.95
61
0.96
8
0.85
34
0.8
802
0.9
136
0.9
353
0.95
54
0.90
72
0.89
9
0.7
716
0.37
06
0.95
43
0.96
4
0.93
82
0.9
596
0.885
3
PIC 0.66
5
0.84
06
0.77
66
0.751
5
0.74
86
0.8
973
0.76
26
0.81
86
0.86
45
0.65
66
0.6
845
0.7
39
0.7
874
0.82
43
0.72
16
0.72
62
0.5
232
0.33
31
0.82
38
0.84
38
0.79
23
0.8
345
0.694
6
M
P
0.13
85
0.03
85
0.06
74
0.079
2
0.08
18
0.0
196
0.07
43
0.04
39
0.03
2
0.14
66
0.1
198
0.0
864
0.0
647
0.04
46
0.09
28
0.10
1
0.2
284
0.62
94
0.04
57
0.03
6
0.06
18
0.0
404
0.114
7
PE 0.48
82
0.68
91
0.59
18
0.475
2
0.52
16
0.7
754
0.57
74
0.68
91
0.78
34
0.49
48
0.3
957
0.5
353
0.6
211
0.65
85
0.46
88
0.57
74
0.2
341
0 0.66
61
0.65
09
0.63
59
0.6
585
0.468
8
TPI 1.9 3.27 2.45 1.85 2.06 4.5
5
2.36 3.27 4.72 1.93 1.5
5
2.1
3
2.6
6
2.97 1.82 2.36 1.1
1
0.5 3.04 2.9 2.77 2.9
7
1.82

www.electrophoresis-journal.com Page 23 Electrophoresis
Received: 06 26, 2018; Revised: 07 24, 2018; Accepted: 08 06, 2018
This article has been accepted for publication and undergone full peer review but has not been
through the copyediting, typesetting, pagination and proofreading process, which may lead to
differences between this version and the Version of Record. Please cite this article as doi:
10.1002/elps.201800256.
This article is protected by copyright. All rights reserved.

www.electrophoresis-journal.com Page 24 Electrophoresis
Received: 06 26, 2018; Revised: 07 24, 2018; Accepted: 08 06, 2018
This article has been accepted for publication and undergone full peer review but has not been through the copyediting, typesetting, pagination and
proofreading process, which may lead to differences between this version and the Version of Record. Please cite this article as doi: 10.1002/elps.201800256.
This article is protected by copyright. All rights reserved.
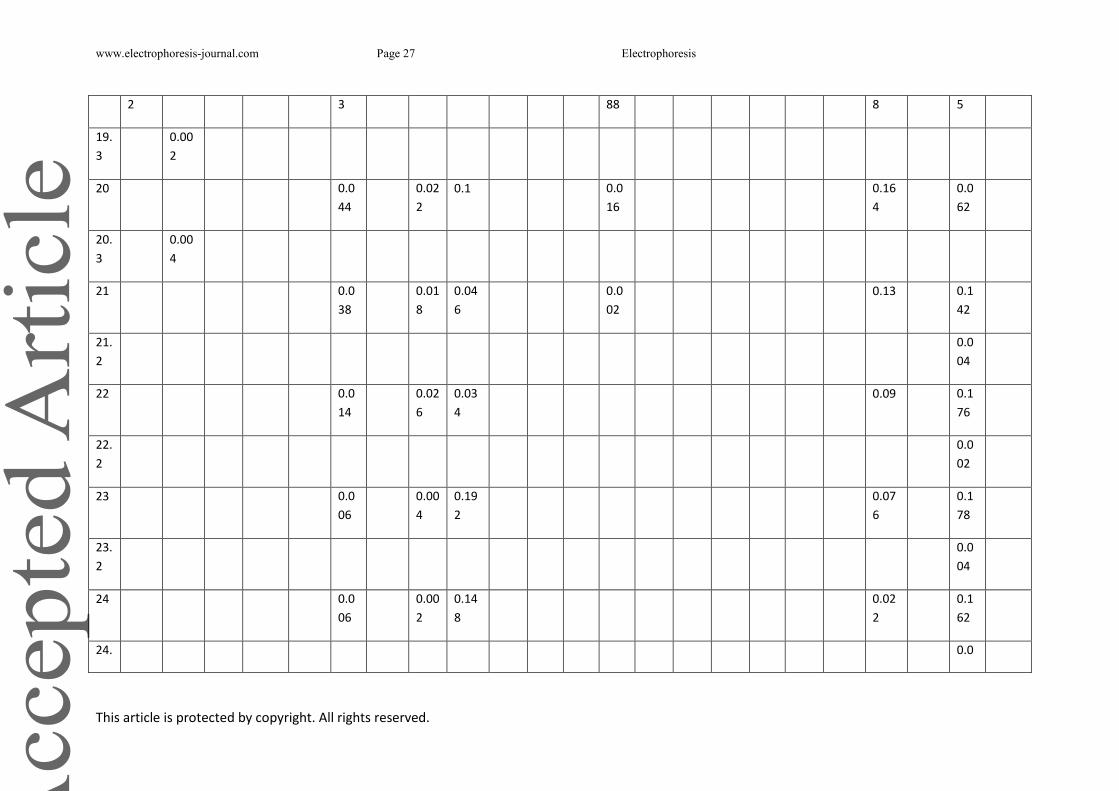
Table 2: Allele frequencies and forensic statistic parameters for the 22 STR loci in Brunei Chinese population
All
ele
D3S
1358
D1S
1656
D2S
441
D10S
1248
D13
S317
Pen
ta E
D16
S539
D18
S51
D2S
1338
CSF
1PO
Pen
ta
D
TH
01
vW
A
D21
S11
D7S
820
D5S
818
TP
OX
DYS
391
D8S
1179
D12
S391
D19
S433
FG
A
D22S
1045
5 0.0
58
6 0.00
2
0.1
28
7 0.00
6
0.0
06
0.2
7
0.00
2
0.02
6
8 0.00
2
0.29
2
0.0
04
0.00
2
0.00
4
0.0
66
0.0
52
0.15
2
0.01
6
0.5
8
9 0.11
4
0.0
2
0.24
2
0.03 0.3
56
0.4
56
0.06
4
0.06
6
0.0
92
0.01
8
9.1 0.02
4
9.3 0.0
28
10 0.00 0.24 0.15 0.0 0.12 0.00 0.25 0.1 0.0 0.13 0.19 0.0 0.81 0.14

www.electrophoresis-journal.com Page 25 Electrophoresis
This article is protected by copyright. All rights reserved.
2 8 4 48 8 4 4 3 66 4 8 26 3
10.
1
0.00
2
11 0.06
2
0.33 0.26
6
0.1
56
0.29
6
0.00
2
0.25
8
0.1
04
0.38
4
0.33
4
0.2
86
0.16
1
0.08
4
0.00
2
0.192
11.
3
0.07
4
12 0.00
2
0.03
8
0.16 0.092 0.12
2
0.1
1
0.21
6
0.05
2
0.37
8
0.1
66
0.23
8
0.19
4
0.0
14
0.00
9
0.14
6
0.04
2
0.004
12.
2
0.00
2
13 0.09
6
0.01
8
0.254 0.04 0.0
54
0.09
6
0.16
2
0.04
8
0.1
2
0.02
2
0.16 0.0
02
0.21
6
0.29
8
0.004
13.
2
0.03
14 0.03
8
0.10
8
0.13
4
0.272 0.01
2
0.0
62
0.01
6
0.18
6
0.02
2
0.0
44
0.2
74
0.00
4
0.00
6
0.17
4
0.25 0.038
14.
2
0.15
15 0.34
6
0.31
2
0.00
8
0.246 0.0
82
0.00
2
0.21
6
0.0
06
0.0
32
0.16
8
0.01
2
0.06 0.34
15. 0.12

www.electrophoresis-journal.com Page 26 Electrophoresis
This article is protected by copyright. All rights reserved.
2 2
15.
3
16 0.30
2
0.20
2
0.112 0.0
92
0.13
8
0.01
8
0.0
02
0.1
42
0.05
6
0.00
2
0.01
4
0.0
04
0.216
16.
2
0.02
6
16.
3
0.00
6
17 0.25
6
0.06
2
0.022 0.0
98
0.08
8
0.06
2
0.2
4
0.01
6
0.07
2
0.00
2
0.0
02
0.178
17.
2
0.00
2
17.
3
0.07
17.
4
0.0
02
18 0.05
4
0.02 0.002 0.0
7
0.04 0.09
6
0.2
06
0.23
2
0.0
44
0.026
18.
3
0.01
6
19 0.00 0.0 0.04 0.21 0.0 0.18 0.0 0.002
www.electrophoresis-journal.com Page 27 Electrophoresis
This article is protected by copyright. All rights reserved.
2 3 88 8 5
19.
3
0.00
2
20 0.0
44
0.02
2
0.1 0.0
16
0.16
4
0.0
62
20.
3
0.00
4
21 0.0
38
0.01
8
0.04
6
0.0
02
0.13 0.1
42
21.
2
0.0
04
22 0.0
14
0.02
6
0.03
4
0.09 0.1
76
22.
2
0.0
02
23 0.0
06
0.00
4
0.19
2
0.07
6
0.1
78
23.
2
0.0
04
24 0.0
06
0.00
2
0.14
8
0.02
2
0.1
62
24. 0.0

www.electrophoresis-journal.com Page 28 Electrophoresis
This article is protected by copyright. All rights reserved.
2 1
25 0.0
06
0.07
8
0.01
2
0.0
94
25.
2
0.0
02
26 0.01
6
0.0
46
26.
2
0.0
12
27 0.0
06
28 0.05
8
28.
2
0.00
2
29 0.24
4
30 0.26
30.
2
0.00
6
30.
3
0.00
2

www.electrophoresis-journal.com Page 29 Electrophoresis
This article is protected by copyright. All rights reserved.
31 0.09
2
31.
2
0.08
6
32 0.03
4
32.
2
0.14
6
33 0.00
4
33.
2
0.05
6
34 0.00
2
34.
2
0.00
8
Ho 0.74 0.80
8
0.77
6
0.792 0.78 0.9
2
0.79
2
0.85
6
0.85
6
0.74
8
0.7
96
0.7 0.7
84
0.84 0.72
4
0.81
2
0.5
88
- 0.80
8
0.84
8
0.83
6
0.8
48
0.796
He 0.72
06
0.82
79
0.78
12
0.781
1
0.79
22
0.9
183
0.78
29
0.86 0.86
59
0.72
37
0.7
988
0.6
963
0.7
973
0.82
96
0.75
17
0.78
22
0.5
736
- 0.84
52
0.84
89
0.80
58
0.8
731
0.768
6
p 0.58
01
0.52
18
0.86
53
0.115
3
0.98
15
0.2
514
0.86
19
0.89
81
0.51
89
0.65
47
0.6
321
0.5
13
0.2
718
0.57
24
0.61
2
0.27
9
0.8
431
- 0.93
74
0.16
78
0.67
47
0.5
142
0.706
1

www.electrophoresis-journal.com Page 30 Electrophoresis
This article is protected by copyright. All rights reserved.
SD 0.00
04
0.00
04
0.00
04
0.000
3
0.00
01
0.0
004
0.00
03
0.00
03
0.00
05
0.00
04
0.0
004
0.0
005
0.0
004
0.00
02
0.00
05
0.00
03
0.0
003
- 0.00
03
0.00
04
0.00
03
0.0
003
0.000
4
PD 0.86
7
0.95
25
0.91
76
0.906
7
0.92
48
0.9
829
0.91
6
0.96
34
0.96
34
0.86
75
0.9
328
0.8
552
0.9
234
0.94
24
0.90
23
0.91
69
0.7
506
0.31
59
0.95
58
0.95
4
0.93
36
0.9
672
0.905
7
PIC 0.66
73
0.80
74
0.74
77
0.744
4
0.76 0.9
105
0.74
71
0.84
27
0.84
97
0.67
42
0.7
736
0.6
507
0.7
652
0.80
7
0.71
37
0.74
87
0.5
096
0.28
08
0.82
38
0.82
91
0.77
83
0.8
58
0.730
7
M
P
0.13
3
0.04
75
0.08
24
0.093
3
0.07
52
0.0
171
0.08
4
0.03
66
0.03
66
0.13
25
0.0
672
0.1
448
0.0
766
0.05
76
0.09
77
0.08
31
0.2
494
0.68
41
0.04
42
0.04
6
0.06
64
0.0
328
0.094
3
PE 0.49
28
0.61
4
0.55
53
0.584
3
0.56
25
0.8
364
0.58
43
0.70
67
0.70
67
0.50
64
0.5
916
0.4
283
0.5
697
0.67
53
0.46
64
0.62
15
0.2
767
0 0.61
4
0.69
09
0.66
75
0.6
909
0.591
6
TPI 1.92 2.6 2.23 2.4 2.27 6.2
5
2.4 3.47 3.47 1.98 2.4
5
1.6
7
2.3
1
3.13 1.81 2.66 1.2
1
0.5 2.6 3.29 3.05 3.2
9
2.45

www.electrophoresis-journal.com Page 31 Electrophoresis
Received: 06 26, 2018; Revised: 07 24, 2018; Accepted: 08 06, 2018
This article has been accepted for publication and undergone full peer review but has not been
through the copyediting, typesetting, pagination and proofreading process, which may lead to
differences between this version and the Version of Record. Please cite this article as doi:
10.1002/elps.201800256.
This article is protected by copyright. All rights reserved.

www.electrophoresis-journal.com Page 32 Electrophoresis
Received: 06 26, 2018; Revised: 07 24, 2018; Accepted: 08 06, 2018
This article has been accepted for publication and undergone full peer review but has not been through the copyediting, typesetting, pagination and
proofreading process, which may lead to differences between this version and the Version of Record. Please cite this article as doi: 10.1002/elps.201800256.
This article is protected by copyright. All rights reserved.
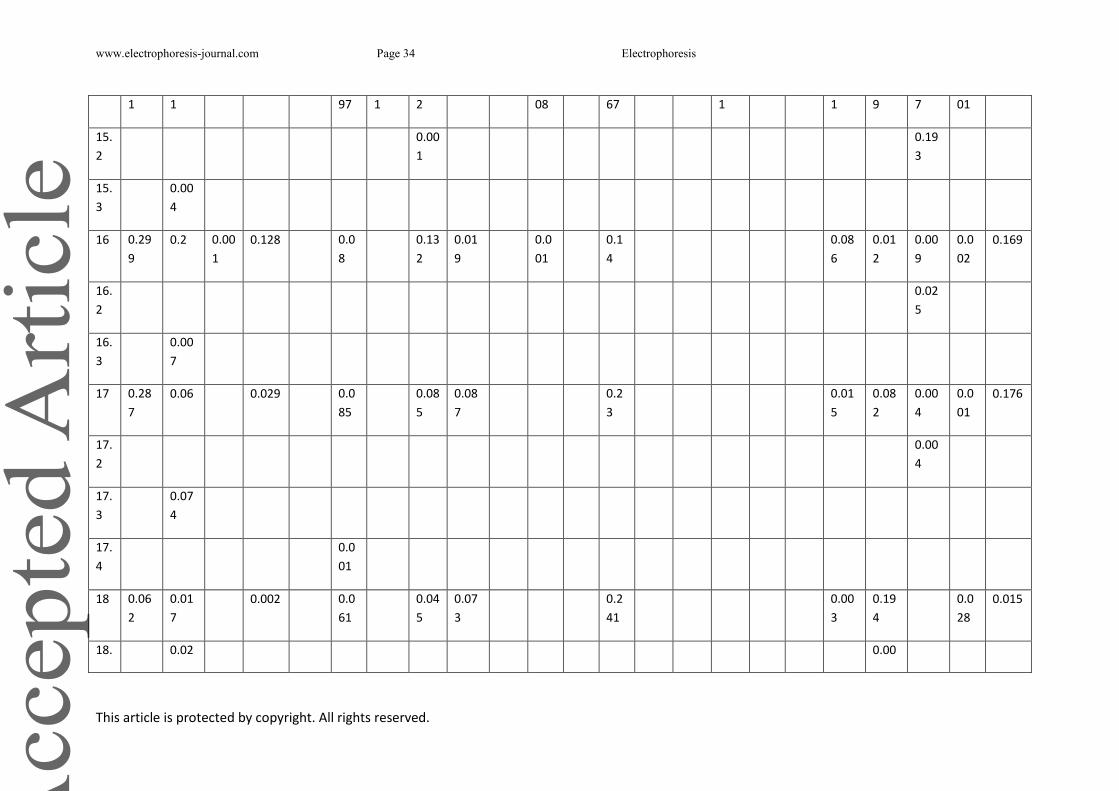
Table 3: Allele frequencies and forensic statistical parameters for the 22 STR loci in the Brunei combined (Malay and Chinese) population
All
ele
D3S
1358
D1S
1656
D2S
441
D10S
1248
D13
S317
Pen
ta E
D16
S539
D18
S51
D2S
1338
CSF
1PO
Pen
ta
D
TH
01
vW
A
D21
S11
D7S
820
D5S
818
TP
OX
DYS
391
D8S
1179
D12
S391
D19
S433
FG
A
D22S
1045
5 0.0
45
6 0.00
1
0.0
02
0.1
13
7 0.00
1
0.00
4
0.0
16
0.2
95
0.00
2
0.01
8
8 0.00
1
0.26
9
0.0
03
0.00
7
0.00
4
0.0
42
0.0
98
0.16
5
0.01 0.5
53
9 0.11
1
0.0
16
0.21
9
0.00
1
0.03
1
0.4
01
0.3
7
0.05
8
0.05
5
0.0
97
0.04
4
0.00
2
9.1 0.01
7
9.3 0.0
4
10 0.00 0.21 0.13 0.0 0.14 0.00 0.25 0.1 0.0 0.16 0.24 0.0 0.78 0.10

www.electrophoresis-journal.com Page 33 Electrophoresis
This article is protected by copyright. All rights reserved.
2 7 4 44 7 3 2 25 84 7 19 8 9
10.
1
0.00
1
0
11 0.09
3
0.31
2
0.28
6
0.1
7
0.30
3
0.00
6
0.28
4
0.0
79
0.38 0.30
1
0.3
13
0.16
4
0.10
9
0.00
2
0.237
11.
3
0.11
2
12 0.00
1
0.03
2
0.16
5
0.085 0.15
9
0.1
09
0.19
7
0.05
9
0.36
7
0.2
03
0.19
9
0.22
7
0.0
17
0.00
3
0.11 0.03
3
0.002
12.
2
0.00
1
0.00
1
13 0.00
1
0.1 0.02
2
0.26 0.03
1
0.0
63
0.10
5
0.11
4
0.04
6
0.0
99
0.02
3
0.14
1
0.0
01
0.22
9
0.26
7
0.006
13.
2
0.03
8
13.
3
0.00
1
14 0.02
5
0.11
2
0.14
2
0.276 0.00
9
0.0
85
0.02
1
0.19
8
0.01
2
0.0
25
0.2
15
0.00
5
0.00
8
0.17
6
0.21
5
0.033
14.
2
0.13
3
15 0.32 0.27 0.01 0.22 0.0 0.00 0.25 0.0 0.0 0.00 0.16 0.00 0.07 0.0 0.355
www.electrophoresis-journal.com Page 34 Electrophoresis
This article is protected by copyright. All rights reserved.
1 1 97 1 2 08 67 1 1 9 7 01
15.
2
0.00
1
0.19
3
15.
3
0.00
4
16 0.29
9
0.2 0.00
1
0.128 0.0
8
0.13
2
0.01
9
0.0
01
0.1
4
0.08
6
0.01
2
0.00
9
0.0
02
0.169
16.
2
0.02
5
16.
3
0.00
7
17 0.28
7
0.06 0.029 0.0
85
0.08
5
0.08
7
0.2
3
0.01
5
0.08
2
0.00
4
0.0
01
0.176
17.
2
0.00
4
17.
3
0.07
4
17.
4
0.0
01
18 0.06
2
0.01
7
0.002 0.0
61
0.04
5
0.07
3
0.2
41
0.00
3
0.19
4
0.0
28
0.015
18. 0.02 0.00

www.electrophoresis-journal.com Page 35 Electrophoresis
This article is protected by copyright. All rights reserved.
3 4 1
19 0.00
4
0.00
1
0.0
36
0.04
4
0.18
6
0.0
92
0.18
6
0.0
68
0.007
19.
3
0.00
1
0.0
01
20 0.0
47
0.01
9
0.09
9
0.0
15
0.18
8
0.0
45
20.
3
0.00
2
21 0.0
29
0.01
5
0.03
5
0.0
01
0.11
2
0.1
8
21.
2
0.0
03
22 0.0
17
0.01
4
0.06
8
0.10
8
0.1
94
22.
2
0.0
07
23 0.0
04
0.00
6
0.17
8
0.06
2
0.1
75
23.
2
0.0
04
24 0.0 0.00 0.15 0.02 0.1

www.electrophoresis-journal.com Page 36 Electrophoresis
This article is protected by copyright. All rights reserved.
04 5 7 3 37
24.
2
0.0
06
25 0.0
05
0.00
1
0.07
4
0.00
3
0.01
8
0.0
75
25.
2
0.0
03
26 0.02 0.00
4
0.0
46
26.
2
0.0
07
27 0.00
3
0.00
2
0.00
1
0.0
13
28 0.04
7
0.0
04
28.
2
0.00
2
29 0.22
9
0.0
01
30 0.25
2
30. 0.01

www.electrophoresis-journal.com Page 37 Electrophoresis
This article is protected by copyright. All rights reserved.
2 4
30.
3
0.00
1
31 0.12
9
31.
2
0.07
8
32 0.04
2
32.
2
0.12
4
33 0.00
3
33.
2
0.06
3
34 0.00
2
34.
2
0.00
8
35.
2
0.00
2
Ho 0.73 0.82 0.78 0.762 0.76 0.9 0.78 0.85 0.87 0.74 0.7 0.7 0.8 0.83 0.72 0.8 0.5 - 0.82 0.83 0.82 0.8 0.758

www.electrophoresis-journal.com Page 38 Electrophoresis
This article is protected by copyright. All rights reserved.
66 77 42 4 83 03 81 15 53 46 366 327 76 48 683 18 76 77 396 4
He 0.72
15
0.84
51
0.79
58
0.784 0.79
01
0.9
133
0.78
93
0.85
23
0.87
49
0.71
77
0.7
639
0.7
456
0.8
113
0.83
91
0.75
66
0.77
8
0.5
867
- 0.84
8
0.85
76
0.81
89
0.8
662
0.756
7
p 0.96
12
0.71
89
0.37
76
0.038
6
0.69
73
0.8
127
0.41
7
0.97
21
0.47
92
0.31
23
0.1
525
0.5
248
0.3
937
0.55
79
0.32
48
0.23
29
0.9
047
- 0.58
68
0.26
32
0.87
09
0.5
142
0.745
8
SD 0.00
02
0.00
02
0.00
04
0.000
2
0.00
04
0.0
002
0.00
04
0.00
01
0.00
04
0.00
03
0.0
003
0.0
004
0.0
005
0.00
03
0.00
05
0.00
04
0.0
002
- 0.00
03
0.00
03
0.00
03
0.0
004
0.000
3
PD 0.86
64
0.95
98
0.92
88
0.917
4
0.92
41
0.9
842
0.92
26
0.96
24
0.96
91
0.86
13
0.9
147
0.8
937
0.9
354
0.95
2
0.90
71
0.91
25
0.7
625
0.34
96
0.95
81
0.96
23
0.94
12
0.9
661
0.899
8
PIC 0.66
81
0.82
72
0.76
59
0.749
2
0.75
76
0.9
058
0.75
66
0.83
52
0.86
11
0.66
63
0.7
358
0.7
064
0.7
833
0.81
88
0.72
13
0.74
22
0.5
176
0.31
37
0.82
86
0.84 0.79
43
0.8
506
0.718
2
M
P
0.13
36
0.04
02
0.07
12
0.082
6
0.07
59
0.0
158
0.07
74
0.03
76
0.03
09
0.13
87
0.0
853
0.1
063
0.0
646
0.04
8
0.09
29
0.08
75
0.2
375
0.65
04
0.04
19
0.03
77
0.05
88
0.0
339
0.100
2
PE 0.49
05
0.65
15
0.57
36
0.527
7
0.54
16
0.8
055
0.58
08
0.69
78
0.74
52
0.50
05
0.4
872
0.4
806
0.5
954
0.66
68
0.46
76
0.59
9
0.2
546
0 0.64
01
0.67
06
0.65
15
0.6
745
0.527
7
TPI 1.91 2.9 2.34 2.09 2.16 5.2
6
2.38 3.37 4.01 1.96 1.9 1.8
7
2.4
8
3.04 1.82 2.5 1.1
6
0.5 2.81 3.08 2.9 3.1
2
2.09

www.electrophoresis-journal.com Page 39 Electrophoresis
Received: 06 26, 2018; Revised: 07 24, 2018; Accepted: 08 06, 2018
This article has been accepted for publication and undergone full peer review but has not been
through the copyediting, typesetting, pagination and proofreading process, which may lead to
differences between this version and the Version of Record. Please cite this article as doi:
10.1002/elps.201800256.
This article is protected by copyright. All rights reserved.