Embed Size (px)
Citation preview
Optimal Pricing of Services with Switching Costs
Qian Liu Garrett van Ryzin
June 2011
Abstract
Customer switching costs are an important factor in account-based services such as telecommu-
nications, financial, insurance and brokerage services. In these businesses, existing customers
incur significant costs if they switch to another provider. Such costs include physical config-
uration and installation costs, contractual costs (e.g. termination fees) and cognitive costs of
learning. These switching costs enable a firm to extract more revenue from incumbent customers
by charging them higher prices. However, higher prices disproportionately deter new customers
from buying, because, ex ante, they face similar set-up and learning costs with all providers and
hence are more price sensitive. This raises an important question of how best to balance the
tradeoff between short-term revenue gains and long-run account growth. We develop an optimal
control model to study this tradeoff. We show that a simple target market share policy is the
optimal strategy. In particular, there exists a target price and target market share such that the
firm should price to reach the target market share as fast as possible, at which point it should
switch to the target price. We also examine how these targets change with the competitive
outside price, shopping frequency of customers, firm’s discount rate and market growth rate. In
addition, we extend the basic monopoly model to the duopoly case in which two firms compete
for market share and maximize their expected discounted revenue. We also look at the situation
in which a firm is able to charge a lower introductory price to attract new customers.
1 Introduction
Switching costs are the costs associated with changing from one alternative product or service to
another. On a broad level, they include physical costs such as setups and installation, artificial and
1

contractual costs such as cancelation fees and loyalty rebates, cognitive costs such as learning to
use a new technology or service, and even psychological costs, e.g., the pain of giving up a benefit
is more pronounced than the pleasure of gaining a new benefit for loss-averse customers. [7] Indeed,
notions of “brand loyalty” and “customer relationships” are pervasive in strategic pricing analyses,
and there is extensive research on switching costs and their effects in the economics, marketing
and behavioral science communities. As Shapiro and Varian [16] note: “You just cannot compete
effectively unless you know how to identity, measure, and understand switching costs and map
strategy accordingly.”
The economics literature studies the role of switching costs in turning ex ante homogenous
goods into ex post heterogeneous ones. They focus on fundamental switching cost economics,
including inter-temporal pricing and its impact on social welfare and industrial organization. See
for example Klemperer [8] [10] [11] [12] [13], Fudenberg and Tirole [3], Shapiro and Varian [16].
Marketing researchers have examined search and cognitive lock-in behavior in e-commerce sites and
explain this behavior with the power law of practice. See Johnson et al. [4] [5].
Yet there is a more limited understanding of the impact of switching costs on operational
pricing decisions. Current revenue management methods, in particular, largely ignore how short-
term pricing decisions affect customers’ willingness to switch to a competing firm and the resulting
long-term consequences for revenues. For instance, executives at a major low-cost airline have
commented to us that they do not price as aggressively as they could in several markets in which they
have a dominant position because they feel high prices could damage their long-run perception as a
“value-based” airline. They therefore override the recommendations of their revenue management
system, setting upper bounds on prices. This is just one case of short-run pricing decisions being
tempered by long-run strategic considerations. There are many others. Yet the approaches used
to manage such important trade-off in practice are largely ad hoc.
Similar factors are important in financial, communication and information services, where cus-
tomer retention and loyalty are widely regarded as critically important to sustaining and growing
profits. To take one example, British Telecom launched a package that slashed prices for six months
to undercut Internet telephony provider Skype (Best[1]). The strategy seems sensible, yet the im-
2

pact of such a move on profits is ambiguous; on the one hand, lower prices attract new customers
because new customers incur similar setup costs with all service providers and hence they are quite
price sensitive. So offering lower, more competitive prices helps insure that the firm’s customer
base grows over time. However, lowering prices creates an immediate revenue loss from the base of
existing, locked-in customers, who will typically tolerate higher prices due to the switching costs
they incur if they defect to another firm. Therefore, there is a tradeoff between profiting from the
existing customer base through high prices and attracting new customers to grow the customer base
through low prices. How best to balance the tradeoff is an important question for both researchers
and practitioners.
1.1 Literature Review
As mentioned, the economics literature has extensively addressed switching costs and their effects.
A series of papers by Klemperer [8], [10], [9], [11], [12], investigate a setting in which there are price
wars in an entry period, price increases in a post-entry period, and deterrence of new entrants into
the market. They also analyze the competitiveness of markets with and without switching costs.
The main results are that in a market with switching costs, a firm can earn monopoly profits from
repeated purchasers even though it faces oligopolistic competition. As a result, firms often follow
a bargains-then-ripoffs price pattern. That is, they vie fiercely for early adopters and then exploit
them later by charging higher prices (a so-called “penetration pricing” strategy). This result helps
explain practices such as the low introductory price offers commonly used in cable TV and Internet
services. They also explore the role that switching costs play in deterring new entrants. They show
that a market with high switching costs may be socially inefficient because a large amount of social
surplus is dissipated by the resulting barriers to entry. For more details see Klemperer [13] and
Farrell and Klemperer [2].
Recently, Lewis and Yildirim [14] explore procurement in multiple periods when buyers strategi-
cally manage switching costs to reduce procurement costs. They find that the bargains-then-ripoffs
price pattern may not hold in a multiple period procurement setting when customers anticipate
switching costs and respond strategically.
3
The behavioral science and marketing literature has empirically and experimentally investigated
switching costs. For example, online shoppers, contrary to popular belief, exhibit significant loyalty
and stickiness due to efficiencies gained from learning through repeated experience. Experimental
results by Johnson etc. [5] suggest that customers surprisingly visit very few shopping sites online,
even though other sites “just a mouse click away” could save them money. On average, households
visit only 1.2 book sites, 1.3 CD sites, and 1.8 travel sites during a month for each category before
they make online purchases. Johnson etc. [4] explain such cognitive lock-in behavior in e-commerce
environments by the “power law of practice,” a cognitive psychology concept; efficiency gains re-
sulting from learning reduce the number of sites visited and strengthen customer “stickiness” or
loyalty to familiar sites. Jones et al. [6] propose a multidimensional conceptual framework to mea-
sure various switching cost perceptions. They conceptualize services switching costs along several
dimensions including lost performance costs, pre-switching and evaluation costs, post-switching be-
havioral and cognitive costs. They examine various relationships among switching cost dimensions,
both conceptually and empirically, and discuss potential cross-industry differences in perceptions
of service switching costs.
To date little work exists in the revenue management literature on incorporating switching costs
into tactical pricing optimization. A notable exception is the work of Phillips [15], who considers
a fixed-term service contract in which repricing may occur at various times (e.g. home insurance).
Using a Markov chain model, he analyzes the optimal initial price (acquisition price) and subsequent
re-pricing policy over time.
While such a personalized pricing policy is feasible in industries like insurance, for industries like
telecommunications and financial services, prices are typically advertised broadly and are applied
uniformly (e.g. mobile phone rate plans, flat-fees for brokerage trades, Internet service provider
(ISP) monthly rates, etc.). In such settings, it is difficult to discriminate among customers when
pricing or repricing or to charge new customers a different price than incumbent customers. In
fact, our research on this topic was motivated by a consulting engagement with a major on-line
brokerage firm that was struggling with just such a pricing decision. The firm competed based on
a flat fee-per-trade pricing scheme. This fee was an integral part of the firm’s marketing and was
4

heavily advertised. A competitor had recently lowered it’s comparable fixed fee-per-trade. The firm
needed to to respond but faced a difficult choice: keep their fixed fee-per-trade at the current level
and maintain short-term revenues, but risk losing new accounts and thus face a dwindling customer
base over time; or cut prices and absorb an immediate – and quite substantial – short-term revenue
drop, but maintain growth in their account base. This is the precisely trade-off we analyze.
1.2 Overview
The remainder of the paper is organized as follows. We first study a monopoly firm that offers
an account-based service and chooses prices over time to maximize its discounted revenue over an
infinite horizon. In section 2.2, we show the firm’s optimal pricing strategy in this situation is what
we call a a target market share policy. Namely, there exists a target price and target market share
such that the optimal strategy of the firm is to price to reach this target market share as quickly
as possible, at which point the firm switches to the target price. This means pricing as high as
possible if the market share is above the target and pricing as low as possible if the market share
is below the target.
In section 2.3, we examine how the target price and target market share are affected by the
firm’s discount rate, the market growth rate, the outside market price, and customers’ shopping
frequency. These quasi-statics provide some interesting insights. For example, we show that when
the competitive outside price drops, the initial optimal response of the firm can be to increase price.
The reason is that with a lower competitive price, the future market is less promising (i.e. has a
lower target share and lower target price); as a result, the firm is better off extracting revenue from
its current customers than building market share for the (now bleaker) future, and so it increases
its price.
We then extend the analysis in section 3 to a duopoly market in which two firms compete for
market share and each firm maximizes its own expected discounted revenue, and in section 4 we
analyze the case where the firm is able to charge a lower introductory price to new customers.
Finally, concluding remarks are provided in section 5.
5
2 The Monopoly Model
We first consider a single firm that offers an account-based service, such as telecommunications,
insurance, banking or brokage service. We assume that the potential market size is deterministic
and grows at rate θ. The potential market size at time t is denoted by Neθt. Note that θ > 0 implies
the market is expanding while θ < 0 corresponds to a shrinking market; θ = 0 indicates the market
size is constant over time. The number of accounts the firm has at time t is denoted by x(t). The
firm charges p1(t) for its service at time t. There are competitors which charge a prevailing market
price p0, which we assume is exogenously given. We interpret p0 as a proxy for the prevailing
price of competitive alternatives. Based on the firm’s price p1(t) and an outside alternative price
p0, new customers decide whether to sign up for service or not, and current customers of the firm
decide whether to continue service or switch to the outside alternative. We assume these purchase
decisions are made at rate α, called the shopping frequency, which reflects the frequency with which
customers renew or review their service purchase options. The average time between purchase or
re-purchase decisions is then 1/α. For example, most mobile companies offer one to two year
wireless contracts, insurance is normally renewed annually, etc.
We assume that the fraction of customers willing to purchase or defect is a linear function of
prices. In particular, the fraction of new customers willing to purchase is defined by d(p0, p1, t) =
B + b0p0 − b1p1(t) where 0 < b0 < b1, which implies that demand is more sensitive to a change
in the firm’s own price than it is to a simultaneous change in the outside price. The fraction of
current customers willing to defect from the firm is defined by g(p0, p1, t) = A−a0p0+a1p1(t) where
0 < a0 < a1. Again, this implies that defection is more sensitive to the firm’s price than to the
competitive price. The rate at which new customers purchase service (the acquisition rate) is then
given by (Neθt−x(t))α(B+ b0p0− b1p1(t)); that is, the acquisition rate is a multiplicative function
of three components: the available external market size Neθt − x(t), the shopping frequency α at
which customers make purchase decisions, and the fraction of new customers willing to purchase,
B+ b0p0− b1p1(t). Similarly, the rate at which current customers defect to the outside market (the
defection rate) is x(t)α(A − a0p0 + a1p1(t)). We assume that A − a0p0 ≥ 0. This is a reasonable
assumption; it simply says even when the firm offers free service, there are still customers who
6
defect for exogenous reasons other than price. Intuitively, the acquisition rate decreases in the
firm’s own price p1 and increases in the outside price p0; and the defection rate increases in p1 and
decreases in p0. To guarantee 0 ≤ d(p0, p1, t) ≤ 1 and 0 ≤ g(p0, p1, t) ≤ 1, we require the firm’s
price p1 satisfies
max
{B + b0p0 − 1
b1,a0p0 −A
a1
}≤ p1 ≤ min
{B + b0p0
b1,a0p0 −A+ 1
a1
}. (1)
Current and new customers have different price sensitivities since current customers incur
switching costs when they defect while new customers do not. Most of the economics literature
on switching costs assumes that switching costs are exogenously given or can be directly expressed
as a function of location (e.g., distance). In contrast, we implicitly incorporate switching costs
by postulating that current and new customers have different responses to price. In particular, let
ϵd(pi) be the price elasticity of demand from new customers at price pi; ϵg(pi) be the price elasticity
of defections of current customers at price pi, and i = 0, 1. That new customers are more price
sensitive implies that ϵd(pi) > ϵg(pi), i = 0, 1, which requires
p1 > max
{a1B − b1A+ (a0b1 + a1b0)p0
2a1b1,a0B − b0A+ 2a0b0p0
a1b0 + a0b1
}. (2)
One sufficient condition under which ϵd(pi) > ϵg(pi), i = 0, 1 for any price p1 is the following:
biai
>B + b0p0A− a0p0
, i = 0, 1.
We can easily see that the ratio of price elasticities of acquisition to defection, ϵd(pi)ϵg(pi)
, increases in
bi and decreases in ai, i = 0, 1. A large ratio of these price elasticities can be interpreted as high
switching costs. Hence, a larger bi and (or) a smaller ai implies that existing customers incur higher
switching costs when they defect. Note also that
ϵd(p1)
ϵg(p1)
/ϵd(p0)
ϵg(p0)=
b1a1
/b0a0
. (3)
When b1a1/ b0a0
> 1, (3) says that the ratio of price elasticities of acquisition to defection is more pro-
nounced for a change in the firm’s own price than for the same amount of change in the competitor’s
price (outside market price).
7

2.1 Model Formulation
We assume that future revenue is discounted at rate δ. The firm’s initial customer base is denoted
x0. We assume p and p are, respectively, the lowest and highest prices the firm could charge. For
example, prices may be constrained by historical norms, competitors’ prices, internal policies, etc.
At a more abstract level, p and p simply represent the lowest and highest prices that the firm
would consider using. Particularly, these bounds on price are constrained by (1) and (2). The
firm’s problem is to choose prices at each point in time to maximize its discounted revenue over an
infinite horizon, namely
max
∫ ∞
0e−δtp1(t)x(t)dt (4)
s.t.
x(t) = (Neθt − x(t))α(B + b0p0 − b1p1(t))− x(t)α(A− a0p0 + a1p1(t)),
x(0) = x0,
p ≤ p1(t) ≤ p,
0 ≤ x(t) ≤ Neθt.
To simplify the analysis, we reformulate the problem (4) by a change of variable. Replacing x(t)
by y(t)Neθt, then y(t) can be interpreted as the firm’s market share at time t; that is, the fraction
of the total market potential acquired by the firm at time t. We denote the firm’s initial market
share by y0 = x0/N . The optimization problem (4) can then be rewritten as
N max
∫ ∞
0e−(δ−θ)tp1(t)y(t)dt (5)
s.t.
y(t) = α(B + b0p0 − b1p1(t))− y(t)(θ + α(A+B) + α(b0 − a0)p0 − α(b1 − a1)p1(t)),
y(0) = y0,
p ≤ p1(t) ≤ p,
0 ≤ y(t) ≤ 1.
We assume δ > θ to ensure that total discounted revenue is finite.
8
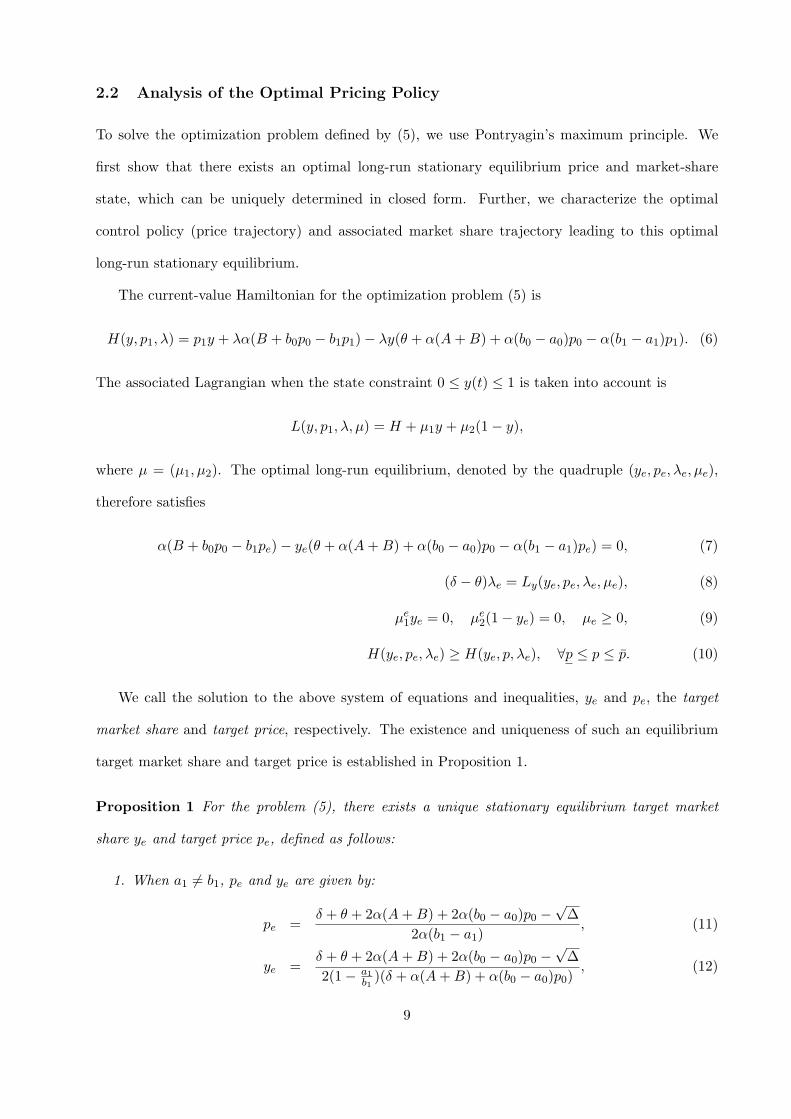
2.2 Analysis of the Optimal Pricing Policy
To solve the optimization problem defined by (5), we use Pontryagin’s maximum principle. We
first show that there exists an optimal long-run stationary equilibrium price and market-share
state, which can be uniquely determined in closed form. Further, we characterize the optimal
control policy (price trajectory) and associated market share trajectory leading to this optimal
long-run stationary equilibrium.
The current-value Hamiltonian for the optimization problem (5) is
H(y, p1, λ) = p1y + λα(B + b0p0 − b1p1)− λy(θ + α(A+B) + α(b0 − a0)p0 − α(b1 − a1)p1). (6)
The associated Lagrangian when the state constraint 0 ≤ y(t) ≤ 1 is taken into account is
L(y, p1, λ, µ) = H + µ1y + µ2(1− y),
where µ = (µ1, µ2). The optimal long-run equilibrium, denoted by the quadruple (ye, pe, λe, µe),
therefore satisfies
α(B + b0p0 − b1pe)− ye(θ + α(A+B) + α(b0 − a0)p0 − α(b1 − a1)pe) = 0, (7)
(δ − θ)λe = Ly(ye, pe, λe, µe), (8)
µe1ye = 0, µe
2(1− ye) = 0, µe ≥ 0, (9)
H(ye, pe, λe) ≥ H(ye, p, λe), ∀p ≤ p ≤ p. (10)
We call the solution to the above system of equations and inequalities, ye and pe, the target
market share and target price, respectively. The existence and uniqueness of such an equilibrium
target market share and target price is established in Proposition 1.
Proposition 1 For the problem (5), there exists a unique stationary equilibrium target market
share ye and target price pe, defined as follows:
1. When a1 = b1, pe and ye are given by:
pe =δ + θ + 2α(A+B) + 2α(b0 − a0)p0 −
√∆
2α(b1 − a1), (11)
ye =δ + θ + 2α(A+B) + 2α(b0 − a0)p0 −
√∆
2(1− a1b1)(δ + α(A+B) + α(b0 − a0)p0)
, (12)
9
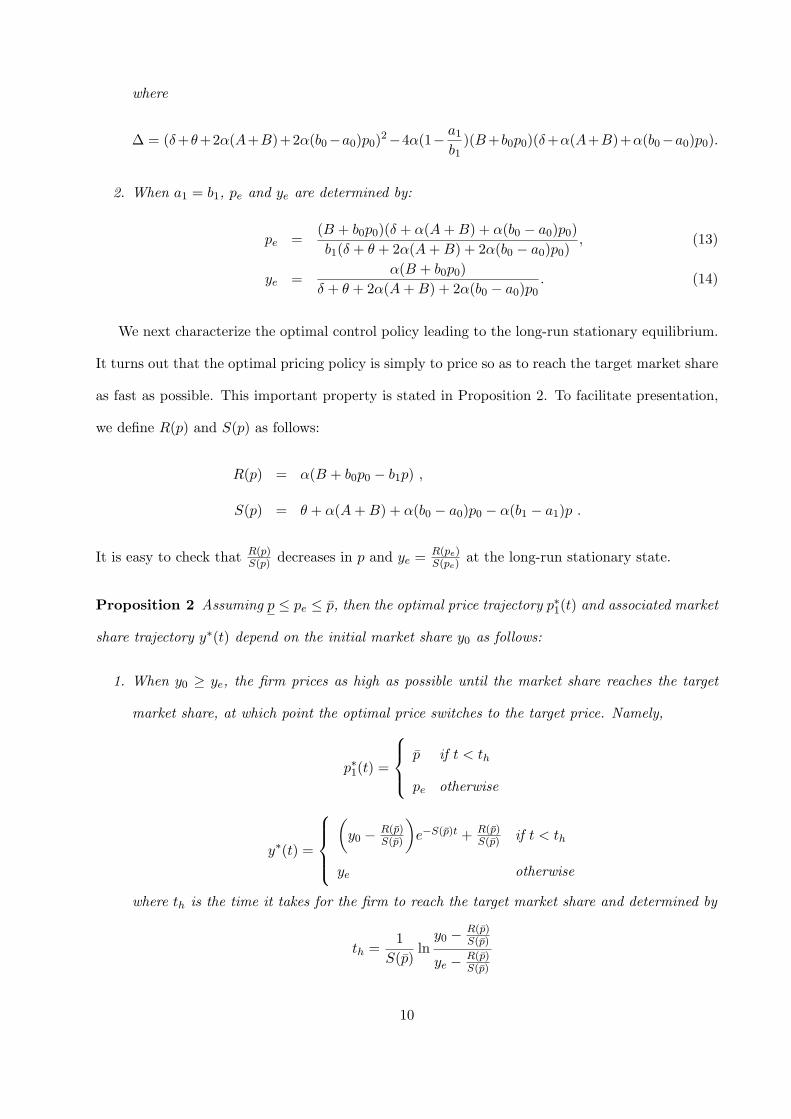
where
∆ = (δ+θ+2α(A+B)+2α(b0−a0)p0)2−4α(1− a1
b1)(B+b0p0)(δ+α(A+B)+α(b0−a0)p0).
2. When a1 = b1, pe and ye are determined by:
pe =(B + b0p0)(δ + α(A+B) + α(b0 − a0)p0)
b1(δ + θ + 2α(A+B) + 2α(b0 − a0)p0), (13)
ye =α(B + b0p0)
δ + θ + 2α(A+B) + 2α(b0 − a0)p0. (14)
We next characterize the optimal control policy leading to the long-run stationary equilibrium.
It turns out that the optimal pricing policy is simply to price so as to reach the target market share
as fast as possible. This important property is stated in Proposition 2. To facilitate presentation,
we define R(p) and S(p) as follows:
R(p) = α(B + b0p0 − b1p) ,
S(p) = θ + α(A+B) + α(b0 − a0)p0 − α(b1 − a1)p .
It is easy to check that R(p)S(p) decreases in p and ye =
R(pe)S(pe)
at the long-run stationary state.
Proposition 2 Assuming p ≤ pe ≤ p, then the optimal price trajectory p∗1(t) and associated market
share trajectory y∗(t) depend on the initial market share y0 as follows:
1. When y0 ≥ ye, the firm prices as high as possible until the market share reaches the target
market share, at which point the optimal price switches to the target price. Namely,
p∗1(t) =
p if t < th
pe otherwise
y∗(t) =
(y0 − R(p)
S(p)
)e−S(p)t + R(p)
S(p) if t < th
ye otherwise
where th is the time it takes for the firm to reach the target market share and determined by
th =1
S(p)ln
y0 − R(p)S(p)
ye − R(p)S(p)
10
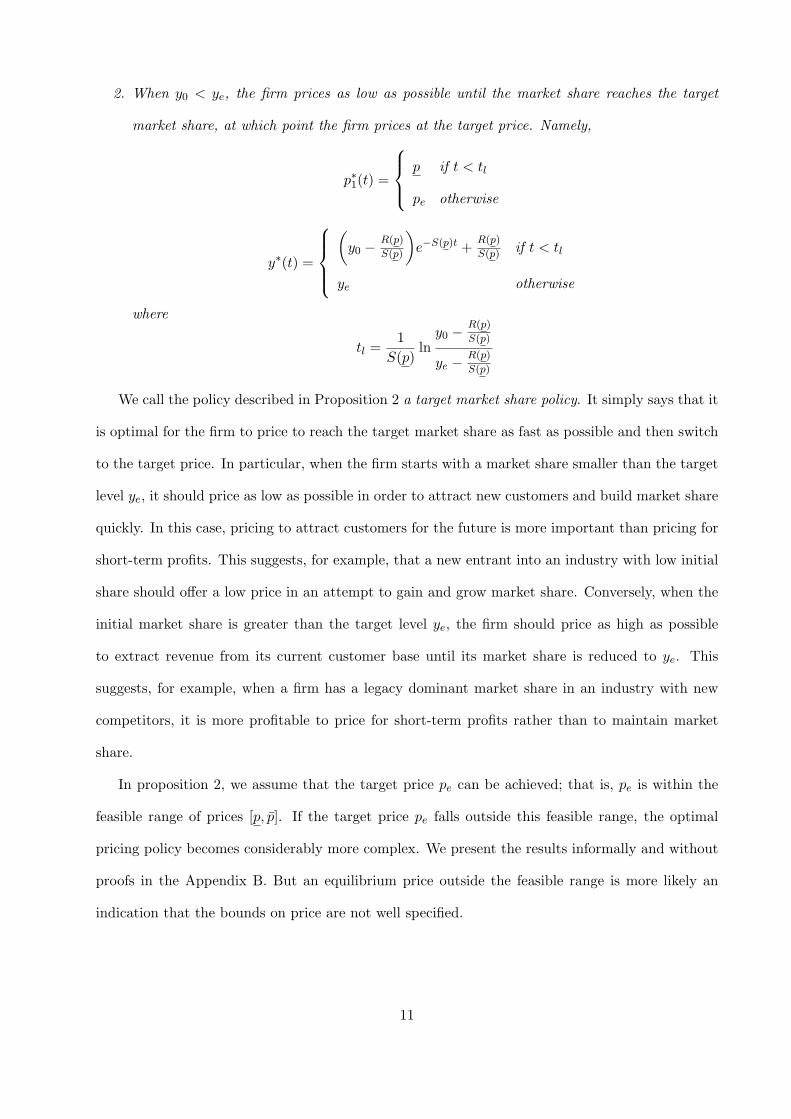
2. When y0 < ye, the firm prices as low as possible until the market share reaches the target
market share, at which point the firm prices at the target price. Namely,
p∗1(t) =
p if t < tl
pe otherwise
y∗(t) =
(y0 −
R(p)
S(p)
)e−S(p)t +
R(p)
S(p) if t < tl
ye otherwise
where
tl =1
S(p)ln
y0 −R(p)
S(p)
ye −R(p)
S(p)
We call the policy described in Proposition 2 a target market share policy. It simply says that it
is optimal for the firm to price to reach the target market share as fast as possible and then switch
to the target price. In particular, when the firm starts with a market share smaller than the target
level ye, it should price as low as possible in order to attract new customers and build market share
quickly. In this case, pricing to attract customers for the future is more important than pricing for
short-term profits. This suggests, for example, that a new entrant into an industry with low initial
share should offer a low price in an attempt to gain and grow market share. Conversely, when the
initial market share is greater than the target level ye, the firm should price as high as possible
to extract revenue from its current customer base until its market share is reduced to ye. This
suggests, for example, when a firm has a legacy dominant market share in an industry with new
competitors, it is more profitable to price for short-term profits rather than to maintain market
share.
In proposition 2, we assume that the target price pe can be achieved; that is, pe is within the
feasible range of prices [p, p]. If the target price pe falls outside this feasible range, the optimal
pricing policy becomes considerably more complex. We present the results informally and without
proofs in the Appendix B. But an equilibrium price outside the feasible range is more likely an
indication that the bounds on price are not well specified.
11
2.3 Comparative Statics of the Target State
In this section, we investigate the comparative statics of the target price and target market share.
Specially, we examine how the target price and target market share are affected by the discount
rate δ, the market growth rate θ, the shopping frequency α, the outside competitive price p0, and
the coefficients of the willingness-to-pay function coefficients ai, bi, i = 0, 1.
Proposition 3 The target price pe and the target market share ye defined in (11) and (12) vary
with the problem parameters as follows:
1. The target price pe increases in p0, δ and a0, and decreases in θ, a1, b0 and b1; pe decreases
in α if pe ≤(B+b0p0
b1
)δ
δ+θ and increases in α otherwise.
2. The target market share ye increases in a0, b1 and α, and decreases in θ, δ and a1; ye decreases
in p0 if ye ≥1−
√√√√1−1−a1
b11−a0
b0
1−a1b1
and a1b1
≥ a0b0, and it increases in p0 otherwise; ye decreases in b0 if
ye ≥1−
√a1b1
1−a1b1
and increases in b0 otherwise.
Some results here are quite intuitive. For example, as the discount rate δ increases, future profits
become less important than current profits, leading to more extraction from existing customers and
less market share building. Hence, higher discount rates lead to a higher target price and a smaller
target market share.
The quasi-statics with respect to the purchase frequency α are more subtle and reflect two main
effects. As the shopping frequency increases, the rate at which potential new customers consider
the firm’s offering increases, but so does the rate at which current customers reconsider whether
to stay or defect. A higher α will therefore increase both the rate of acquisition of new customers
as well as the rate of defections of current customers. Which of these two effects dominates as α
increases is determined by the condition
pe ≤(B + b0p0
b1
)δ
δ + θ. (15)
The important term here is the ratio δδ+θ , which depends on how the discount rate δ compares
to the market growth rate θ (which can be negative). If the discount rate is large relative to
12
the growth rate, then δδ+θ is close one (when θ ≤ 0, this ratio is always greater than 1) and the
condition (15) will be satisfied due to the price constraint (1). In this case the present value of
future new customer acquisitions is less important than defections of current customers. So an
increase in shopping frequency impacts defection costs more than future acquisition benefits, which
leads to a lower equilibrium price to avoid defections. Conversely, if the market growth rate is
much larger than the discount rate, δδ+θ is close to 1
2 (we require θ < δ to ensure a finite total
discounted revenue) and the inequality (15) may not be satisfied. In this case, the present value
of new customer acquisitions becomes more significant than defections from current customers. So
an increase in shopping frequency impacts future acquisition benefits more than defection costs,
leading to a higher equilibrium price to profit from the higher rate of new customer purchases.
Some of the quasi-statics in Proposition 3 lead to somewhat counter-intuitive conclusions.
Specifically, when the outside competitive price p0 declines, under certain conditions the results
imply that the optimal response for the firm (at least initially) is to increase its price. To see why,
note when a1b1
< a0b0
(implying the ratio of price elasticity of acquisition to elasticity of defection is
greater for the firm’s own price change than for the outside price; see (3)) the target market share
is decreasing in p0. This means if the firm is operating in equilibrium at its target market share
and the outside competitive price p0 suddenly declines (e.g. due to a competitive price cut), the
new target market share will fall below the current market share. In this case, the firm’s optimal
response is to move to the new target market share as quickly as possible, i.e. increase its price as
much as possible to p. Only when the market share drops to the new lower target will the firm
reduce price to the new (lower) target price. So we get the counter-intuitive result that the initial
optimal response to a competitive price cut can be a price increase. The intuition is that lower
competitive prices reduce the value of the market in the future, since lower prices and lower market
share will eventually be the new equilibrium. With this more dismal future to look forward to, the
firm finds itself suddenly less concerned with maintaining growth of new accounts and switches to
generating profits from exploiting its (initially relatively large) current base of customers.
Lastly, some special cases of the quasi-static results are also worth noting. When a1 = b1 (i.e.,
the absolute change of acquisition rate is equal to the absolute change of defection rate given a
13
change of price), one can easily check that the target price pe given in (13) increases in δ, p0, and
b0, while it decreases in θ, α and a0; the target market share ye given in (14) increases in p0, α,
a0, and b0, while decreases in δ and θ. Furthermore when α → +∞ (corresponding to continuous
reviewing of purchase decisions), the target price becomes B+b0p02b1
, which is exactly the optimal
price when maximizing the revenue rate below pointwise:
max
∫ ∞
0e−(δ−θ)tNα(B + b0p0 − b1p1(t))p1(t)dt .
That is, with infinite shopping frequency and no price sensitivity difference between current and
new customers, the firm prices to maximize revenue myopically.
3 A Duopoly Market
In this section, we consider the duopolistic version of the model (4). The salient feature of this
model is that, for each firm, the outside market price is no longer static but is the result of a
competitor’s price optimization over time. We model this as a differential game between the two
competing firms.
3.1 Model Formulation
For compactness, we use the same notation as in the monopoly case wherever possible, though some
new notation is introduced for the duopoly case. In particular firms are indexed by i = 1, 2,; pi(t)
is the price charged by firm i at time t; yi(t) is the market share of firm i at time t; di(p1, p2) is the
willingness-to-purchase function of new customers for firm i; gi(p1, p2) is the willingness-to-defect
function of current customers for firm i. Specifically,
d1(p1, p2) = B1 − b11p1 + b12p2, d2(p1, p2) = B2 + b21p1 − b22p2.
g1(p1, p2) = A1 + a11p1 − a12p2, g2(p1, p2) = A2 − a21p1 + a22p2.
For analytical convenience, we assume a perfectly symmetric market; that is, the coefficients of the
willingness-to-purchase and willing-to-defect functions for each firm are the same,
d1(p1, p2) = B − b1p1 + b2p2, d2(p1, p2) = B + b2p1 − b1p2.
14
g1(p1, p2) = A+ a1p1 − a2p2, g2(p1, p2) = A− a2p1 + a1p2.
We assume that b1 > b2 and a1 > a2. This implies that the willingness-to-purchase and willingness-
to-defect functions for each firm are more sensitive to a change in their own price than they are
to a change in the competitor’s price. Let ϵdi(pj) denote the price elasticity of acquisition rate for
new customers at firm i relative to price pj , and ϵgi(pj) be the price elasticity of defection rate for
existing customers at firm i relative to price pj , i, j = 1, 2. That new customers are more price
sensitive than existing customers requires that the price elasticity of the acquisition rate be larger
than the price elasticity of the defection rate at both the firm’s own price and the competitor’s
price, that is, ϵdi(pj) ≥ ϵgi(pj), i, j = 1, 2. We assume that the allowable price range for each
firm is the same, that is, p ≤ p1, p2 ≤ p. These price elasticity assumptions then require that
b1A− a1B ≥ (a1b2 + a2b1)p− 2a1b1p and b2A− a2B ≥ 2a2b2p− (a1b2 + a2b1)p.
Note that the ratio of elasticity of acquisition rate to elasticity of defection rate,ϵdi (pi)
ϵgi (pi), increases
in b1 while decreases in a1, i = 1, 2. Therefore, a larger b1 and (or) a smaller a1 leads to a larger
ratio of demand elasticities to the firm’s own price. The ratioϵdi (pj)
ϵgi (pj)(i, j = 1, 2 and i = j) increases
in b2 while decreases in a2. This implies a larger b2 and (or) a smaller a2 result in a larger ratio
of demand elasticities to the competitor’s price. In any case, a large ratio ofϵdi (pj)
ϵgi (pj)(i, j = 1, 2)
corresponds to the case of high switching costs. Notice also that
ϵdi(pi)
ϵgi(pi)
/ϵdi(pj)
ϵgi(pj)=
b1a1
/b2a2
, i, j = 1, 2.
When b1a1/ b2a2
> 1, the ratio of elasticity of acquisition to elasticity of defection is larger for the
firm’s own price change than for the competitor’s price.
Each firm chooses prices simultaneously at each point in time to maximize its own discounted
revenue over an infinite horizon. In particular, given the price of its opponent, each firm optimally
selects its own price such that this pair of prices constitute a Nash equilibrium. Given firm 2’s price
p2(t), firm 1’s decision problem can be written as follows:
15
max J1 = N
∫ ∞
0
e−(δ−θ)tp1(t)y1(t)dt,
s.t.
y1(t) = (1− y2(t))α(B − b1p1(t) + b2p2(t))− y1(t)(θ + α(A+B − (b1 − a1)p1(t) + (b2 − a2)p2(t))),
y2(t) = (1− y1(t))α(B + b2p1(t)− b1p2(t))− y2(t)(θ + α(A+B + (b2 − a2)p1(t)− (b1 − a1)p2(t))),
y1(0) = y01 , 0 ≤ y1(t) ≤ 1,
y2(0) = y02 , 0 ≤ y2(t) ≤ 1,
p ≤ p1(t), p2(t) ≤ p.
Similarly, firm 2 maximizes its discounted revenue, denoted J2, given firm 1’s price p1(t):
max J2 = N
∫ ∞
0e−(δ−θ)tp2(t)y2(t)dt
subject to the same constraints as in firm 1’s problem.
If there exist p∗1(t) and p∗2(t) such that p∗1(t) maximizes J1 given p∗2(t) and p∗2(t) maximizes J2
given p∗1(t), then (p∗1(t), p∗2(t)) is a Nash equilibrium.
Because the state differential equation for each firm depends on the market share state of the
other firm, it is difficult to derive closed-form equilibrium solutions. Hence, to simplify the problem
somewhat we consider next a special case of an infinitely large potential market.
3.2 Solution for a Large-Market Case
Here we address a special case of the duopoly model in which we assume the potential market
size is large enough that we can neglect the saturation effect of the existing customers of the two
competing firms. That is, the size of the external market is not affected by each firm’s current
16
market share. In this case, firm 1’s decision problem given firm 2’s price p2(t) is the following:
max J1 = N
∫ ∞
0e−(δ−θ)tp1(t)y1(t)dt (16)
s.t.
y1(t) = α(B − b1p1(t) + b2p2(t))− y1(t)(θ + α(A+ a1p1(t)− a2p2(t))
y2(t) = α(B + b2p1(t)− b1p2(t))− y2(t)(θ + α(A− a2p1(t) + a1p2(t))
y1(0) = y01, y2(0) = y02
p ≤ p1(t), p2(t) ≤ p.
Firm 2 maximizes its discounted revenue given firm 1’s price p1(t):
max J2 = N
∫ ∞
0e−(δ−θ)tp2(t)y2(t)dt (17)
subject to the same constraints as in firm 1’s problem (16). Again, if p∗1(t) maximizes (16) given
p∗2(t), and p∗2(t) maximizes (17) given p∗1(t), then (p∗1(t), p∗2(t)) constitutes an open-loop Nash equi-
librium.
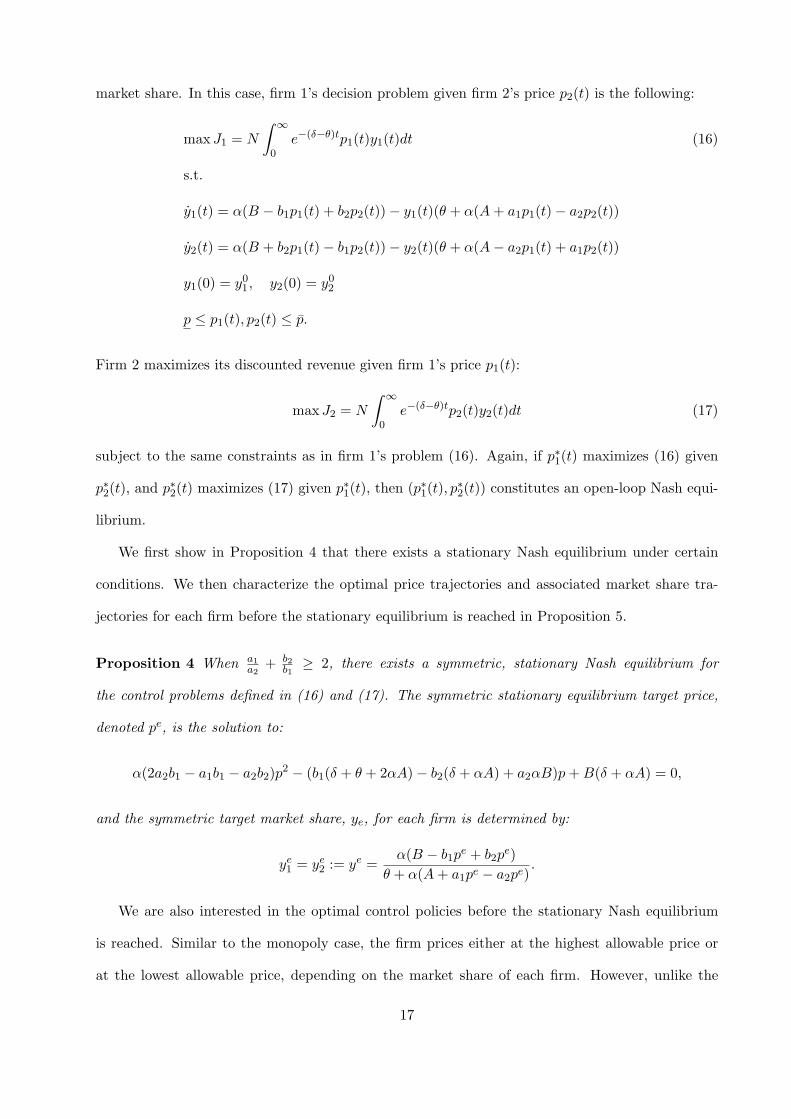
We first show in Proposition 4 that there exists a stationary Nash equilibrium under certain
conditions. We then characterize the optimal price trajectories and associated market share tra-
jectories for each firm before the stationary equilibrium is reached in Proposition 5.
Proposition 4 When a1a2
+ b2b1
≥ 2, there exists a symmetric, stationary Nash equilibrium for
the control problems defined in (16) and (17). The symmetric stationary equilibrium target price,
denoted pe, is the solution to:
α(2a2b1 − a1b1 − a2b2)p2 − (b1(δ + θ + 2αA)− b2(δ + αA) + a2αB)p+B(δ + αA) = 0,
and the symmetric target market share, ye, for each firm is determined by:
ye1 = ye2 := ye =α(B − b1p
e + b2pe)
θ + α(A+ a1pe − a2pe).
We are also interested in the optimal control policies before the stationary Nash equilibrium
is reached. Similar to the monopoly case, the firm prices either at the highest allowable price or
at the lowest allowable price, depending on the market share of each firm. However, unlike the
17
monopoly case, the firm may price at some intermediate level for part of the trajectory because of
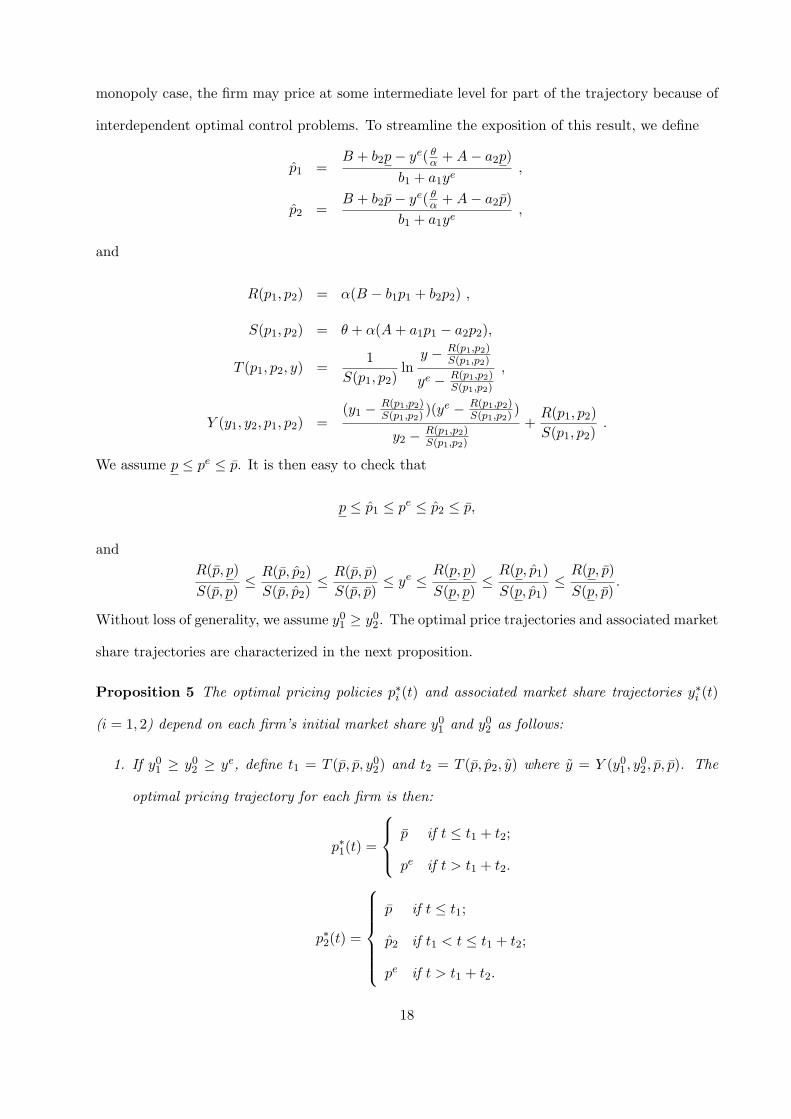
interdependent optimal control problems. To streamline the exposition of this result, we define
p1 =B + b2p− ye( θα +A− a2p)
b1 + a1ye,
p2 =B + b2p− ye( θα +A− a2p)
b1 + a1ye,
and
R(p1, p2) = α(B − b1p1 + b2p2) ,
S(p1, p2) = θ + α(A+ a1p1 − a2p2),
T (p1, p2, y) =1
S(p1, p2)ln
y − R(p1,p2)S(p1,p2)
ye − R(p1,p2)S(p1,p2)
,
Y (y1, y2, p1, p2) =(y1 − R(p1,p2)
S(p1,p2))(ye − R(p1,p2)
S(p1,p2))
y2 − R(p1,p2)S(p1,p2)
+R(p1, p2)
S(p1, p2).
We assume p ≤ pe ≤ p. It is then easy to check that
p ≤ p1 ≤ pe ≤ p2 ≤ p,
and
R(p, p)
S(p, p)≤ R(p, p2)
S(p, p2)≤ R(p, p)
S(p, p)≤ ye ≤
R(p, p)
S(p, p)≤
R(p, p1)
S(p, p1)≤
R(p, p)
S(p, p).
Without loss of generality, we assume y01 ≥ y02. The optimal price trajectories and associated market
share trajectories are characterized in the next proposition.
Proposition 5 The optimal pricing policies p∗i (t) and associated market share trajectories y∗i (t)
(i = 1, 2) depend on each firm’s initial market share y01 and y02 as follows:
1. If y01 ≥ y02 ≥ ye, define t1 = T (p, p, y02) and t2 = T (p, p2, y) where y = Y (y01, y02, p, p). The
optimal pricing trajectory for each firm is then:
p∗1(t) =
p if t ≤ t1 + t2;
pe if t > t1 + t2.
p∗2(t) =
p if t ≤ t1;
p2 if t1 < t ≤ t1 + t2;
pe if t > t1 + t2.
18
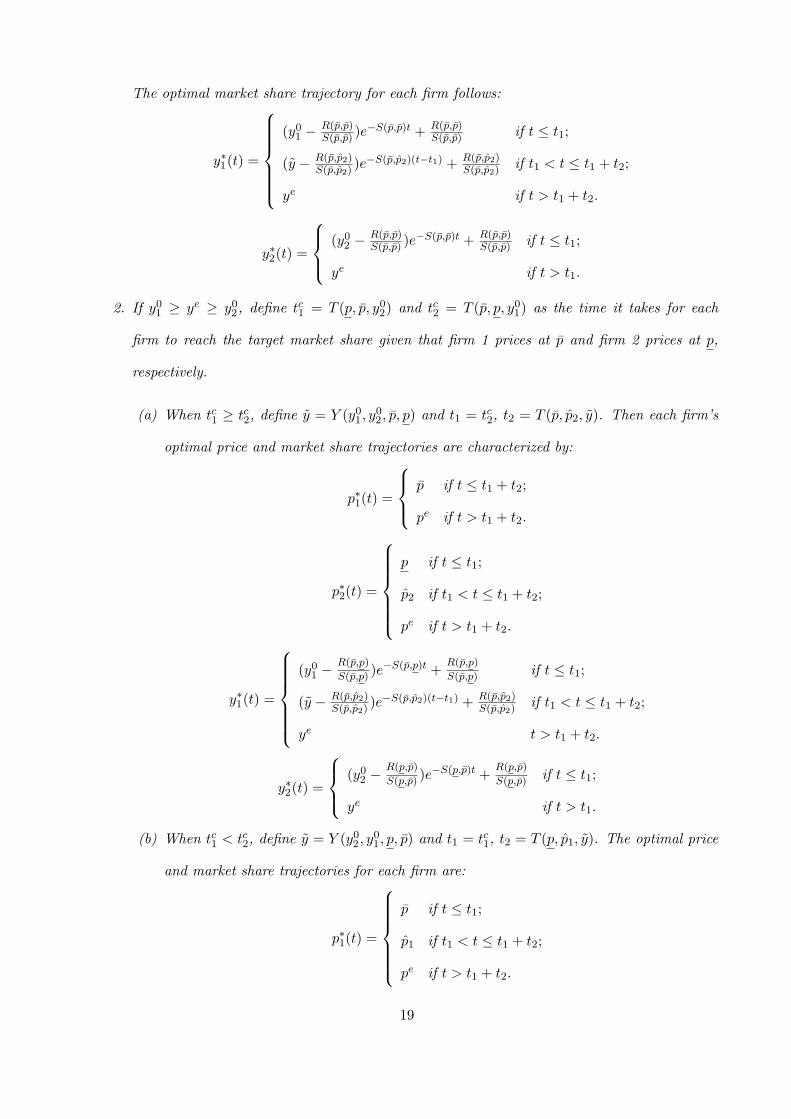
The optimal market share trajectory for each firm follows:
y∗1(t) =
(y01 −
R(p,p)S(p,p) )e
−S(p,p)t + R(p,p)S(p,p) if t ≤ t1;
(y − R(p,p2)S(p,p2)
)e−S(p,p2)(t−t1) + R(p,p2)S(p,p2)
if t1 < t ≤ t1 + t2;
ye if t > t1 + t2.
y∗2(t) =
(y02 −R(p,p)S(p,p) )e
−S(p,p)t + R(p,p)S(p,p) if t ≤ t1;
ye if t > t1.
2. If y01 ≥ ye ≥ y02, define tc1 = T (p, p, y02) and tc2 = T (p, p, y01) as the time it takes for each
firm to reach the target market share given that firm 1 prices at p and firm 2 prices at p,
respectively.
(a) When tc1 ≥ tc2, define y = Y (y01, y02, p, p) and t1 = tc2, t2 = T (p, p2, y). Then each firm’s
optimal price and market share trajectories are characterized by:
p∗1(t) =
p if t ≤ t1 + t2;
pe if t > t1 + t2.
p∗2(t) =
p if t ≤ t1;
p2 if t1 < t ≤ t1 + t2;
pe if t > t1 + t2.
y∗1(t) =
(y01 −
R(p,p)
S(p,p) )e−S(p,p)t +
R(p,p)
S(p,p) if t ≤ t1;
(y − R(p,p2)S(p,p2)
)e−S(p,p2)(t−t1) + R(p,p2)S(p,p2)
if t1 < t ≤ t1 + t2;
ye t > t1 + t2.
y∗2(t) =
(y02 −R(p,p)
S(p,p) )e−S(p,p)t +
R(p,p)
S(p,p) if t ≤ t1;
ye if t > t1.
(b) When tc1 < tc2, define y = Y (y02, y01, p, p) and t1 = tc1, t2 = T (p, p1, y). The optimal price
and market share trajectories for each firm are:
p∗1(t) =
p if t ≤ t1;
p1 if t1 < t ≤ t1 + t2;
pe if t > t1 + t2.
19

p∗2(t) =
p if t ≤ t1 + t2;
pe if t > t1 + t2.
y∗1(t) =
(y01 −R(p,p)
S(p,p) )e−S(p,p)t +
R(p,p)
S(p,p) if t ≤ t1;
ye if t > t1.
y∗2(t) =
(y02 −
R(p,p)
S(p,p) )e−S(p,p)t +
R(p,p)
S(p,p) if t ≤ t1;
(y − R(p,p1)
S(p,p1))e−S(p,p1)(t−t1) +
R(p,p1)
S(p,p1)if t1 < t ≤ t1 + t2;
ye if t > t1 + t2.
3. If ye ≥ y01 ≥ y02, define t1 = T (p, p, y01) and t2 = T (p, p1, y) where y = Y (y02, y01, p, p). The
optimal price and market share trajectories for each firm are given by:
p∗1(t) =
p if t ≤ t1;
p1 if t1 < t ≤ t1 + t2;
pe if t > t1 + t2.
p∗2(t) =
p if t ≤ t1 + t2;
pe if t > t1 + t2.
y∗1(t) =
(y01 −R(p,p)
S(p,p) )e−S(p,p)t +
R(p,p)
S(p,p) if t ≤ t1;
ye if t > t1.
y∗2(t) =
(y02 −
R(p,p)
S(p,p) )e−S(p,p)t +
R(p,p)
S(p,p) if t ≤ t1;
(y − R(p,p1)
S(p,p1))e−S(p,p1)(t−t1) +
R(p,p1)
S(p,p1)if t1 < t ≤ t1 + t2;
ye if t > t1 + t2.
Note that in contrast to the monopoly model in which the firm always price at either the
maximum, minimum or equilibrium level, when two firms compete, one of them may price at an
intermediate level before both firms reach the target market share. In particular, when both firms
start with a larger market share than the target level, both price high so as to extract more revenues
from their large customer base until one firm’s market share is reduced to the target level (the firm
with smaller initial share). At this point, the “smaller” firm switches to an intermediate price (still
20
higher than the target price) and maintains its customer base at the target level, while the “larger”
firm continues to price high until its market share reaches the target. The intuition is that the firm
that first reaches the target share faces a competitor with a high price, so it can afford to price
higher than the target price and still maintain its target share. Once its larger competitor reaches
the target share, however, it must lower its price to the target price to continue to maintain the
target share. Conversely, when both firms start with a lower market share than the target level,
then both price low initially to build up their base of customers. The one with a higher market
share reaches the target level first and, as a result, it prices at an intermediate value (lower than the
target price) because it wants to maintain the target share yet faces a low-price competitor. The
large firm then switches to the higher target price once its smaller competitor reaches the target
share and raises its price.
4 Repricing Opportunity
In this section, we extend the basic model to the case in which a firm can charge an introductory
price for new customers, as is often observed in practice. For example, in cable TV service, a
promotional package is often offered to new customers only for the first year of service, while
a regular (full) price is charged to regular customers. To model this setting, we need to use
different state variables to describe introductory and regular customers. Let x1(t) and x2(t) denote,
respectively, the number of introductory and regular customers the firm has at time t. The prices
charged for introductory customers and regular customers at time t are denoted by p1(t) and p2(t).
Again, there is an external market with a size of N and an outside market price p0.
New customers decide to enter into service or not based on the outside market price p0 and the
prices charged for introductory and regular customers, p1(t) and p2(t), which we call the introductory
and regular price, respectively. The acquisition rate of new customers is, again, comprised of their
shopping frequency, denoted α1, the external market size N , and the fraction of customers willing
to purchase, denoted B + b0p0 − b1p1(t)− b2(p2(t)− p1(t)) where b0, b1, b2 ≥ 0.
A few comments are in order. First, we assume customers behave strategically in the sense that
they take into account both the introductory and regular prices when making their purchase deci-
21
sions. When customers anticipate that future prices will be higher, they become more reluctant to
buy service. This is reflected in the last term in the fraction of customers willing to purchase func-
tion, b2(p2(t)−p1(t)), which represents the decrease in the willingness-to-purchase when the regular
price is higher than the introductory price, where b2 characterizes the sensitivity of customers to
this price difference. Also, to avoid triviality, we assume b1 > b2, else demand is increasing in the
regular price. Lastly, as in the duopoly analysis, we assume that the external market size is large
enough to ignore the impact of the firm’s customer base on the number of potential new customers
(no saturation effects).
Introductory customers become regular customers at a rate of µ, so 1/µ can be interpreted
as the duration of the introductory price offer. Regular customers decide to stay with the firm
or defect based on the outside price, p0, and the regular price, p2(t). The rate at which regular
customers defect from the firm is determined by their shopping frequency, denoted α2, the number
of accounts x2(t), and the fraction of customers willing to defect, denoted A− a0p0 + a1p2(t).
The firm decides its introductory and regular prices at each point in time so as to maximize its
total discounted revenue over time. The revenue is discounted at a rate of δ. Namely,
max
∫ ∞
0e−δt(p1(t)x1(t) + p2(t)x2(t))dt (18)
s.t.
x1(t) = Nα1(B + b0p0 − b1p1(t)− b2(p2(t)− p1(t)))− µx1(t),
x2(t) = µx1(t)− α2x2(t)(A− a0p0 + a1p2(t)),
x1(0) = x10, x2(0) = x20,
p1≤ p1(t) ≤ p1, p
2≤ p2(t) ≤ p2,
The following proposition shows that there exists a long-run stationary equilibrium state under
certain conditions.
Proposition 6 If the long-run stationary state exists for the optimal control problem (18), then
22

denote it by (pe1, xe1, p
e2, x
e2). These equilibrium prices and account levels are determined by:
pe1 =δ + µ
(b1 − b2)(δ + 2µ)(B + b0p0 +
b2a1
(A− a0p0)−b2
2a1α2(∆− δ))
−µ2(∆− δ − 2α2(A− a0p0))
a1α2(δ + 2µ)(∆ + δ), (19)
pe2 =∆− δ
2a1α2− A− a0p0
a1, (20)
xe1 =Nα1
µ(B + b0p0 − b1p
e1 − b2(p
e2 − pe1)), (21)
xe2 =Nα1(B + b0p0 − b1p
e1 − b2(p
e2 − pe1)
α2(A− a0p0 + a1pe2), (22)
where ∆ =√
δ2 + 4µ( b1b2 − 1)(δ + α2(A− a0p0)).
One can easily show that the regular price pe2 increases in µ and b1, while it decreases in b2.
The introductory price pe1 decreases in µ and b1, while it increases in b2. Note that there exists a µ
such that pe1 = pe2. Since pe2 strictly increases in µ and pe1 strictly decreases in µ, for any µ > µ, it
must be that pe1 < pe2. Since 1/µ is the duration of the introductory price, this implies that, ceteris
paribus, reducing the duration of the introductory price period leads to a lower introductory price
and a higher regular price. The reason is that with a shorter introductory period, the firm loses
less revenue when offering low introductory prices. Hence, the cost of acquiring customers with a
low introductory price declines, which leads to both more aggressive (lower) introductory prices,
but also to higher regular price, since defecting customer can be replaced at lower cost.
When b2 = 0, the acquisition rate at which new customers purchase service depends only on
the firm’s introductory price p1 and the outside market price p0. In this case, customers’ purchase
decisions are affected by the introductory price only. We call such customers myopic. The next
proposition characterizes the long-run stationary introductory and regular prices when customers
are myopic.
Proposition 7 When b2 = 0, the long-run stationary equilibrium introductory and regular prices,
denoted pe1 and pe2, are determined by:
p1e =(δ + µ)(B+b0p0
b1)− µ2p2
δ+α2(A−a0p0+a1p2)
δ + 2µ,
pe2 = p2.
23
Furthermore, compared with the case of strategic customers (i.e., b2 > 0), when customers are my-
opic (i.e., b2 = 0), the optimal equilibrium introductory price is lower while the optimal equilibrium
regular price is higher.
Proposition 7 implies that the firm charges a higher introductory price for new customers and a
lower regular price for long term customers when they are strategic as opposed to myopic. This is
intuitive, since myopic customers are easy to acquire with low introductory prices. In then makes
sense to use a “bait-and-switch” policy of offering very low introductory prices followed by high
regular prices. However, such a strategy is less likely to attract customers who are forward looking,
so the introductory and regular price are more similar.
5 Conclusion
Our optimal control model with linear demand functions enables us to investigate the important
tradeoff between extracting revenue from existing customers with higher prices versus growing
market share with lower prices in account-based services. We show that a simple target market
share policy is optimal; the firm should price in order to reach the target market share as fast as
possible. In other words, pricing at the upper bound when the market share is above the target,
pricing at the lower bound if the market share is below the target, and pricing at the equilibrium
target price when the market share is at the target. These results can also be extended to a duopoly
market for a large potential market size and to a differentiated market case in which customers
strategically respond to introductory and regular prices.
The model proposed here is quite stylized and could be extended in a number of ways. For
one, we assume linear demand functions, which leads to the simple ”bang-bang” result of the target
market share policy. A nonlinear demand function would likely lead to smoother behavior. It would
be worth analyzing the optimal pricing policy for more general classes of demand functions to see
if a similar target-market-share policy is optimal. We also assume there is no time variability or
uncertainty in demand, and these assumptions too would be worth relaxing. Lastly, it would be
worthwhile investigating implementation issues in real-world settings.
24
References
[1] J. Best. BT cuts prices as VoIP market hots up. http://www.zdnet.co.uk/. Sep.,2005.
[2] J. Farrell and P. Klemperer. Coordination and lock-in: Competition with switching costs and
network effects. http://www.paulklemperer.org/.
[3] D. Fudenberg and J. Tirole. The fat-cat effect, the puppy-dog ploy, and the lean and hungry
look. The American Economic Review, 74:361–366, 1984.
[4] E. J. Johnson, S. Bellman, and G. L. Lohse. Cognitive lock-in and the power law of practice.
Journal of Marketing, 67:62–75, 2003.
[5] E. J. Johnson, W. W. Moe, P. S. Fader, S. Bellman, and G. L. Lohse. On the depth and
dynamics of online search behavior. Management Science, 50:299–308, 2004.
[6] M. A. Jones, D. L. Mothersbaugh, and S. E. Beatty. Why customers stay: Measuring the
underlying dimensions of services switching costs and managing their differential strategic
outcomes. Journal of Business Research, 55:441–450, 2002.
[7] D. Kahneman and A. Tversky. Prospect theory: An analysis of decision under risk. Econo-
metrica, 47:263–292, 1979.
[8] P. Klemperer. The competitiveness of markets with switching costs. The RAND Journal of
Economics, 18:138–150, 1987.
[9] P. Klemperer. Entry deterrence in markets with consumer switching costs. The Economic
Journal, 97:99–117, 1987.
[10] P. Klemperer. Markets with consumer switching costs. The Quarterly Journal of Economics,
102:375–394, 1987.
[11] P. Klemperer. Welfare effects of entry into markets with switching costs. The Journal of
Industrial Economics, 37:159–165, 1988.
25

[12] P. Klemperer. Price wars caused by switching costs. The Review of Economic Studies, 56:405–
420, 1989.
[13] P. Klemperer. Competition when consumers have switching costs: An overview with appli-
cations to industrial organization, macroeconomics, and international trade. The Review of
Economic Studies, 62:515–539, 1995.
[14] T. Lewis and H. Yildirim. Managing switching costs in multiperiod procurements with strate-
gica buyers. Working paper, Duke University, 2003.
[15] R. Phillips. Acquisition pricing with future repricing opportunities. INFORMS Revenue Man-
agement Section Conference. June, 2006.
[16] C. Shapiro and H. R. Varian. Information rules. Harvard Business School Press, 1999.
Appendix A: Proofs
Proof of Proposition 1
First, using (7), (8), (9) and (10), it is easy to show that 0 < ye < 1. Therefore, µ1e = µ2
e = 0. The
optimal long-run stationary state is then determined by the following system of equations:
α(B + b0p0 − b1pe)− ye(θ + α(A+B) + α(b0 − a0)p0 − α(b1 − a1)pe) = 0,
λe(δ + α(A+B) + α(b0 − a0)p0 − α(b1 − a1)pe)− pe = 0,
ye − αb1λe + α(b1 − a1)λeye = 0.
Solving the above system of equations when a1 = b1, note that 0 < ye < 1, we have
pe =δ + θ + 2α(A+B) + 2α(b0 − a0)p0 −
√∆
2α(b1 − a1),
ye =δ + θ + 2α(A+B) + 2α(b0 − a0)p0 −
√∆
2(1− a1b1)(δ + α(A+B) + α(b0 − a0)p0)
,
λe =δ + θ + 2α(A+B) + 2α(b0 − a0)p0 −
√∆
α(b1 − a1)(δ − θ +√∆)
,
where
∆ = (δ + θ + 2α(A+B) + 2α(b0 − a0)p0)2 − 4α(1− a1
b1)(B + b0p0)(δ + α(A+B) + α(b0 − a0)p0).
26
Recall that we assume A− a0p0 ≥ 0, so it must be that ∆ > 0.
When a1 = b1, solving the above system of equations yields:
ye =α(B + b0p0)
δ + θ + 2α(A+B) + 2α(b0 − a0)p0,
pe =(B + b0p0)(δ + α(A+B) + α(b0 − a0)p0)
b1(δ + θ + 2α(A+B) + 2α(b0 − a0)p0),
λe =B + b0p0
b1(δ + θ + 2α(A+B) + 2α(b0 − a0)p0).
Proof of Proposition 2
We first ignore the state constraint 0 ≤ y(t) ≤ 1 in the optimization problem (5), then later
verify the resulting state trajectory indeed satisfies this constraint. The current-value Hamiltonian
function is given by
H(y, p1, λ) = p1y + λα(B + b0p0 − b1p1)− λy(θ + α(A+B) + α(b0 − a0)p0 − α(b1 − a1)p1),
and the current-value adjoint equation is
λ = (δ − θ)λ− ∂H
∂y= λ(δ + α(A+B) + α(b0 − a0)p0 − α(b1 − a1)p1)− p1.
The optimal control is obtained by maximizing the Hamiltonian function with respect to p1, that
is
p∗1(t) = argmaxp1(t)
{(y∗(t)− αb1λ(t) + α(b1 − a1)λ(t)y
∗(t))p1(t)
+α(B + b0p0)λ(t)− (θ + α(A+B) + α(b0 − a0)p0)λ(t)y∗(t)
}.
Hence, the optimal policy is a bang-bang control; namely
p∗1(t) =
p if y∗(t)− αb1λ(t) + α(b1 − a1)λ(t)y∗(t) < 0;
p if y∗(t)− αb1λ(t) + α(b1 − a1)λ(t)y∗(t) > 0;
p ≤ p ≤ p if y∗(t)− αb1λ(t) + α(b1 − a1)λ(t)y∗(t) = 0.
(23)
27
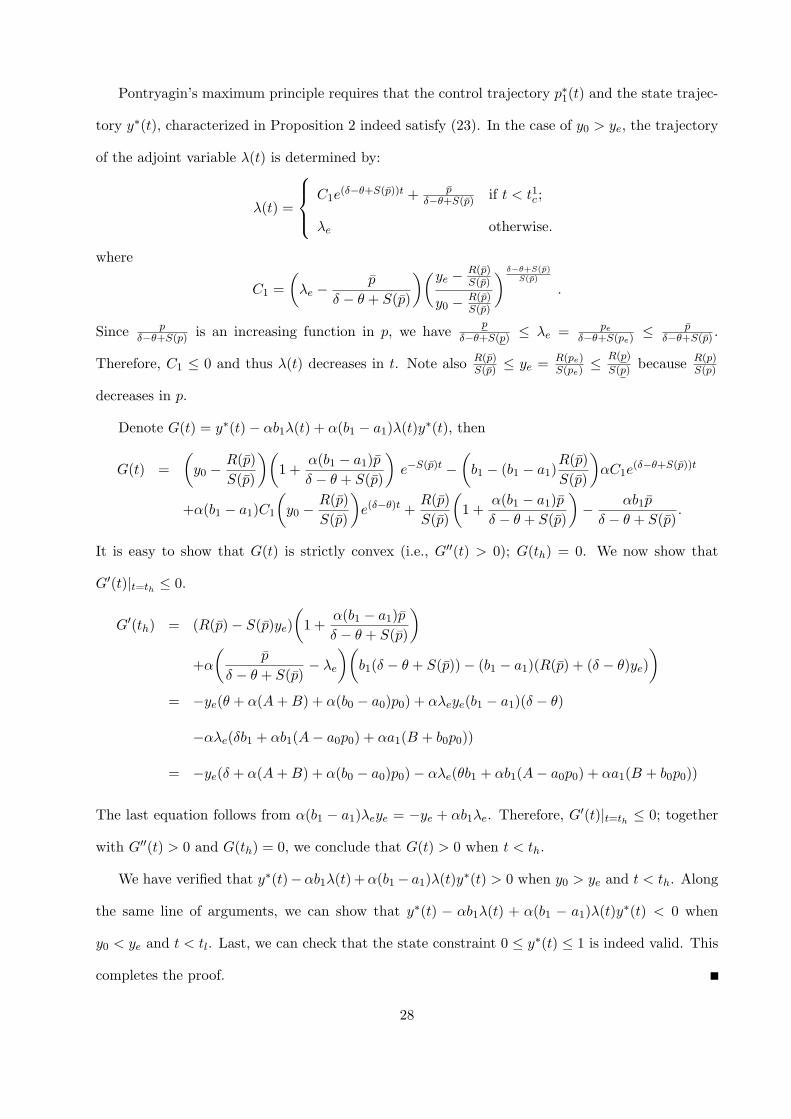
Pontryagin’s maximum principle requires that the control trajectory p∗1(t) and the state trajec-
tory y∗(t), characterized in Proposition 2 indeed satisfy (23). In the case of y0 > ye, the trajectory
of the adjoint variable λ(t) is determined by:
λ(t) =
C1e(δ−θ+S(p))t + p
δ−θ+S(p) if t < t1c ;
λe otherwise.
where
C1 =
(λe −
p
δ − θ + S(p)
)(ye − R(p)S(p)
y0 − R(p)S(p)
) δ−θ+S(p)S(p)
.
Since pδ−θ+S(p) is an increasing function in p, we have
p
δ−θ+S(p) ≤ λe = peδ−θ+S(pe)
≤ pδ−θ+S(p) .
Therefore, C1 ≤ 0 and thus λ(t) decreases in t. Note also R(p)S(p) ≤ ye = R(pe)
S(pe)≤ R(p)
S(p) because R(p)S(p)
decreases in p.
Denote G(t) = y∗(t)− αb1λ(t) + α(b1 − a1)λ(t)y∗(t), then
G(t) =
(y0 −
R(p)
S(p)
)(1 +
α(b1 − a1)p
δ − θ + S(p)
)e−S(p)t −
(b1 − (b1 − a1)
R(p)
S(p)
)αC1e
(δ−θ+S(p))t
+α(b1 − a1)C1
(y0 −
R(p)
S(p)
)e(δ−θ)t +
R(p)
S(p)
(1 +
α(b1 − a1)p
δ − θ + S(p)
)− αb1p
δ − θ + S(p).
It is easy to show that G(t) is strictly convex (i.e., G′′(t) > 0); G(th) = 0. We now show that
G′(t)|t=th ≤ 0.
G′(th) = (R(p)− S(p)ye)
(1 +
α(b1 − a1)p
δ − θ + S(p)
)+α
(p
δ − θ + S(p)− λe
)(b1(δ − θ + S(p))− (b1 − a1)(R(p) + (δ − θ)ye)
)= −ye(θ + α(A+B) + α(b0 − a0)p0) + αλeye(b1 − a1)(δ − θ)
−αλe(δb1 + αb1(A− a0p0) + αa1(B + b0p0))
= −ye(δ + α(A+B) + α(b0 − a0)p0)− αλe(θb1 + αb1(A− a0p0) + αa1(B + b0p0))
The last equation follows from α(b1 − a1)λeye = −ye + αb1λe. Therefore, G′(t)|t=th ≤ 0; together
with G′′(t) > 0 and G(th) = 0, we conclude that G(t) > 0 when t < th.
We have verified that y∗(t)−αb1λ(t)+α(b1 − a1)λ(t)y∗(t) > 0 when y0 > ye and t < th. Along
the same line of arguments, we can show that y∗(t) − αb1λ(t) + α(b1 − a1)λ(t)y∗(t) < 0 when
y0 < ye and t < tl. Last, we can check that the state constraint 0 ≤ y∗(t) ≤ 1 is indeed valid. This
completes the proof.
28

Proof of Proposition 3
According to the proof of Proposition 1, the optimal long-run stationary state satisfies:
α(B + b0p0 − b1pe)− ye(θ + α(A+B) + α(b0 − a0)p0 − α(b1 − a1)pe) = 0,
λe(δ + α(A+B) + α(b0 − a0)p0 − α(b1 − a1)pe)− pe = 0,
ye − αb1λe + α(b1 − a1)λeye = 0.
Rearranging the above system of equations, one can show that ye and pe are separated as follows:
(1−a1b1
)(δ+α(A+B)+α(b0−a0)p0)y2e−(δ+θ+2α(A+B)+2α(b0−a0)p0)ye+α(B+b0p0) = 0, (24)
α(b1−a1)p2e−(δ+θ+2α(A+B)+2α(b0−a0)p0)pe+
1
b1(B+b0p0)(δ+α(A+B)+α(b0−a0)p0) = 0.
(25)
Applying the Implicit Function Theorem to (24) and (25), the results follow from straightforward
algebraic calculations. We omit the details for conciseness.
Proof of Proposition 4
For the optimal control problems defined in (16) and (17), the current-value Hamiltonian functions
for each firm are given by:
H1(p1, p2, y1, y2, λ1, λ2) = p1y1 + λ1
(α(B − b1p1(t) + b2p2(t))− y1(t)(θ + α(A+ a1p1(t)− a2p2(t))
)+λ2
(α(B + b2p1(t)− b1p2(t))− y2(t)(θ + α(A− a2p1(t) + a1p2(t))
),
H2(p1, p2, y1, y2, γ1, γ2) = p2y2 + γ1
(α(B − b1p1(t) + b2p2(t))− y1(t)(θ + α(A+ a1p1(t)− a2p2(t))
)+γ2
(α(B + b2p1(t)− b1p2(t))− y2(t)(θ + α(A− a2p1(t) + a1p2(t))
).
29
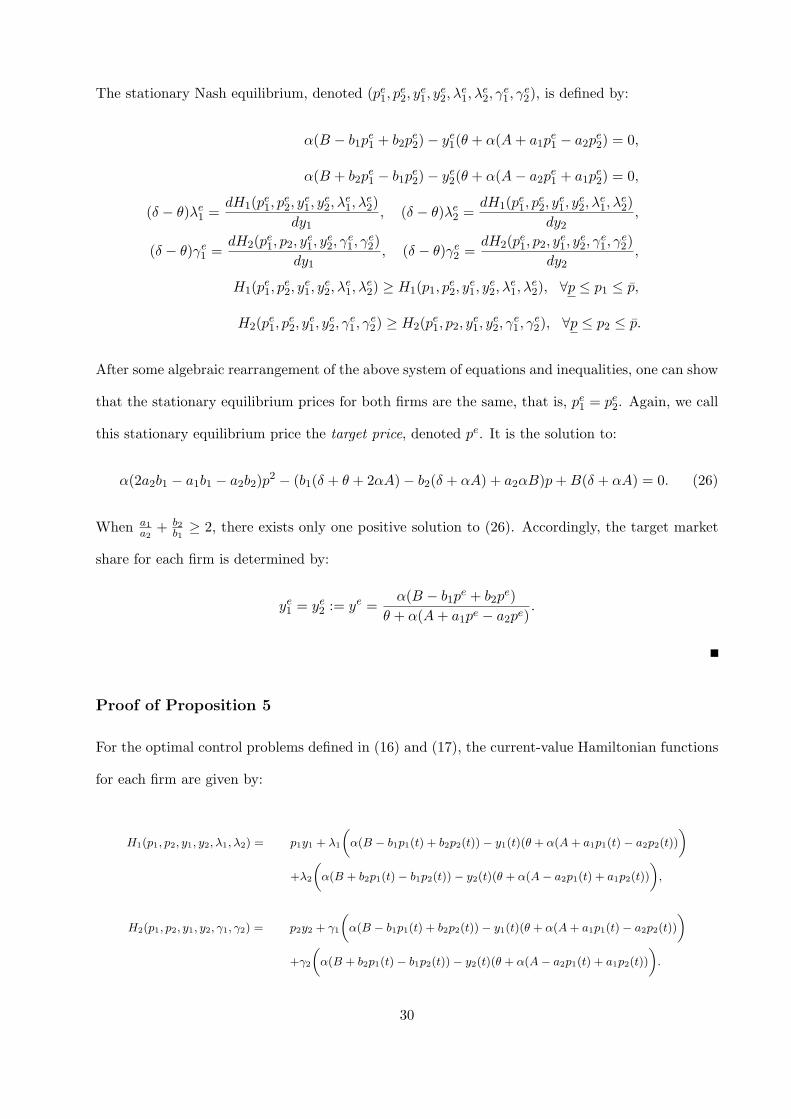
The stationary Nash equilibrium, denoted (pe1, pe2, y
e1, y
e2, λ
e1, λ
e2, γ
e1, γ
e2), is defined by:
α(B − b1pe1 + b2p
e2)− ye1(θ + α(A+ a1p
e1 − a2p
e2) = 0,
α(B + b2pe1 − b1p
e2)− ye2(θ + α(A− a2p
e1 + a1p
e2) = 0,
(δ − θ)λe1 =
dH1(pe1, p
e2, y
e1, y
e2, λ
e1, λ
e2)
dy1, (δ − θ)λe
2 =dH1(p
e1, p
e2, y
e1, y
e2, λ
e1, λ
e2)
dy2,
(δ − θ)γe1 =dH2(p
e1, p2, y
e1, y
e2, γ
e1, γ
e2)
dy1, (δ − θ)γe2 =
dH2(pe1, p2, y
e1, y
e2, γ
e1, γ
e2)
dy2,
H1(pe1, p
e2, y
e1, y
e2, λ
e1, λ
e2) ≥ H1(p1, p
e2, y
e1, y
e2, λ
e1, λ
e2), ∀p ≤ p1 ≤ p,
H2(pe1, p
e2, y
e1, y
e2, γ
e1, γ
e2) ≥ H2(p
e1, p2, y
e1, y
e2, γ
e1, γ
e2), ∀p ≤ p2 ≤ p.
After some algebraic rearrangement of the above system of equations and inequalities, one can show
that the stationary equilibrium prices for both firms are the same, that is, pe1 = pe2. Again, we call
this stationary equilibrium price the target price, denoted pe. It is the solution to:
α(2a2b1 − a1b1 − a2b2)p2 − (b1(δ + θ + 2αA)− b2(δ + αA) + a2αB)p+B(δ + αA) = 0. (26)
When a1a2
+ b2b1
≥ 2, there exists only one positive solution to (26). Accordingly, the target market
share for each firm is determined by:
ye1 = ye2 := ye =α(B − b1p
e + b2pe)
θ + α(A+ a1pe − a2pe).
Proof of Proposition 5
For the optimal control problems defined in (16) and (17), the current-value Hamiltonian functions
for each firm are given by:
H1(p1, p2, y1, y2, λ1, λ2) = p1y1 + λ1
(α(B − b1p1(t) + b2p2(t))− y1(t)(θ + α(A+ a1p1(t)− a2p2(t))
)+λ2
(α(B + b2p1(t)− b1p2(t))− y2(t)(θ + α(A− a2p1(t) + a1p2(t))
),
H2(p1, p2, y1, y2, γ1, γ2) = p2y2 + γ1
(α(B − b1p1(t) + b2p2(t))− y1(t)(θ + α(A+ a1p1(t)− a2p2(t))
)+γ2
(α(B + b2p1(t)− b1p2(t))− y2(t)(θ + α(A− a2p1(t) + a1p2(t))
).
30
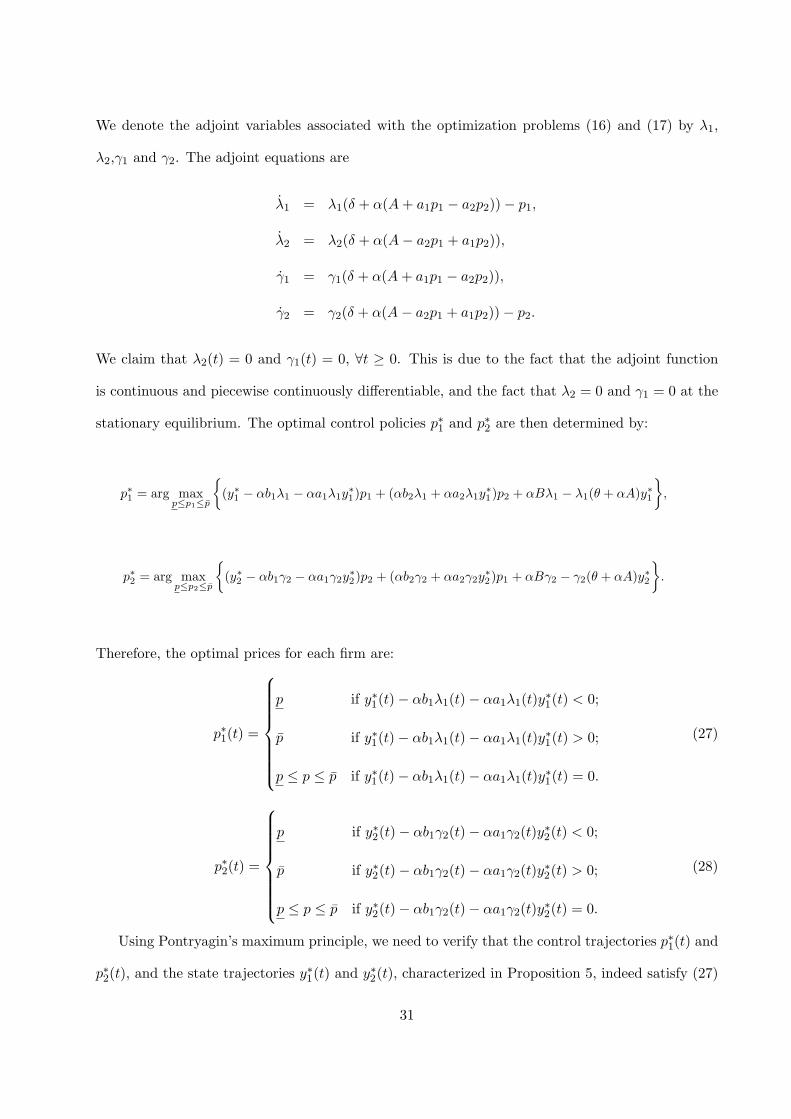
We denote the adjoint variables associated with the optimization problems (16) and (17) by λ1,
λ2,γ1 and γ2. The adjoint equations are
λ1 = λ1(δ + α(A+ a1p1 − a2p2))− p1,
λ2 = λ2(δ + α(A− a2p1 + a1p2)),
γ1 = γ1(δ + α(A+ a1p1 − a2p2)),
γ2 = γ2(δ + α(A− a2p1 + a1p2))− p2.
We claim that λ2(t) = 0 and γ1(t) = 0, ∀t ≥ 0. This is due to the fact that the adjoint function
is continuous and piecewise continuously differentiable, and the fact that λ2 = 0 and γ1 = 0 at the
stationary equilibrium. The optimal control policies p∗1 and p∗2 are then determined by:
p∗1 = arg maxp≤p1≤p
{(y∗1 − αb1λ1 − αa1λ1y
∗1)p1 + (αb2λ1 + αa2λ1y
∗1)p2 + αBλ1 − λ1(θ + αA)y∗1
},
p∗2 = arg maxp≤p2≤p
{(y∗2 − αb1γ2 − αa1γ2y
∗2)p2 + (αb2γ2 + αa2γ2y
∗2)p1 + αBγ2 − γ2(θ + αA)y∗2
}.
Therefore, the optimal prices for each firm are:
p∗1(t) =
p if y∗1(t)− αb1λ1(t)− αa1λ1(t)y∗1(t) < 0;
p if y∗1(t)− αb1λ1(t)− αa1λ1(t)y∗1(t) > 0;
p ≤ p ≤ p if y∗1(t)− αb1λ1(t)− αa1λ1(t)y∗1(t) = 0.
(27)
p∗2(t) =
p if y∗2(t)− αb1γ2(t)− αa1γ2(t)y∗2(t) < 0;
p if y∗2(t)− αb1γ2(t)− αa1γ2(t)y∗2(t) > 0;
p ≤ p ≤ p if y∗2(t)− αb1γ2(t)− αa1γ2(t)y∗2(t) = 0.
(28)
Using Pontryagin’s maximum principle, we need to verify that the control trajectories p∗1(t) and
p∗2(t), and the state trajectories y∗1(t) and y∗2(t), characterized in Proposition 5, indeed satisfy (27)
31

and (28). Here we give the proof for the case of y01 ≥ y02 ≥ ye only. The other cases follow the same
line of argument.
We now show that y∗2(t) − αb1γ2(t) − αa1γ2(t)y∗2(t) > 0 when t < t1 and y∗2(t) − αb1γ2(t) −
αa1γ2(t)y∗2(t) = 0 when t = t1.
Note that γe2 = pe
δ−θ+S(pe,pe) and γ2(t1) = γe2, we then have
γ2(t) =
( pe
δ−θ+S(pe,pe) −p
δ−θ+S(p,p) )
(ye−R(p,p)
S(p,p)
y02−
R(p,p)S(p,p)
) δ−θ+S(p,p)S(p,p)
e(δ−θ+S(p,p))t + pδ−θ+S(p,p) if t < t1;
pe
δ−θ+S(pe,pe) if t ≥ t1.
When t < t1,
G2(t) = y∗2(t)− αb1γ2(t)− αa1γ2(t)y∗2(t) (29)
=R(p, p)
S(p, p)
(1− αa1p
δ − θ + S(p, p)
)− αb1p
δ − θ + S(p, p)+
(y02 −
R(p, p)
S(p, p)
)(1− αa1p
δ − θ + S(p, p)
)e−S(p,p)t
−αa1
(y02 −
R(p, p)
S(p, p)
)(pe
δ − θ + S(pe, pe)− p
δ − θ + S(p, p)
)(ye − R(p,p)S(p,p)
y02 −R(p,p)S(p,p)
) δ−θ+S(p,p)S(p,p)
e(δ−θ)t
−α
(b1 + a1
R(p, p)
S(p, p)
)(pe
δ − θ + S(pe, pe)− p
δ − θ + S(p, p)
)(ye − R(p,p)S(p,p)
y02 −R(p,p)S(p,p)
) δ−θ+S(p,p)S(p,p)
e(δ−θ+S(p,p))t .
Because pe
δ−θ+S(pe,pe) <p
δ−θ+S(p,p) and y02 ≥ ye, we can easily show that G2(t) is strictly convex by
G′′2(t). Also at t = t1,
G2(t1) = ye(1− αa1p
δ − θ + S(p, p)
)− αb1p
δ − θ + S(p, p)+ α
(pe
δ − θ + S(pe, pe)− p
δ − θ + S(p, p)
)(−a1y
e − b1)
= ye − αa1peye
δ − θ + S(pe, pe)− αb1p
e
δ − θ + S(pe, pe)= 0.
G′2(t1) =
(1− αa1p
δ − θ + S(p, p)
)(R(p, p)− S(p, p)ye)
−α
(pe
δ − θ + S(pe, pe)− p
δ − θ + S(p, p)
)(a1(R(p, p) + (δ − θ)ye) + b1(δ − θ + S(p, p)))
= −ye(δ + α(A− a2p) + α(B + b2p))− αγe2(b1S(p, p) + a1R(p, p))
The last equation uses the result of γe2 = pe
δ−θ+S(pe,pe) and ye − αb1γe2 − αa1γ
e2y
e = 0. Therefore,
G′2(t1) < 0. It then follows G2(t) > 0 when t < t1.
32

We next show that y∗1(t)−αb1λ1(t)−αa1λ1(t)y∗1(t) > 0 when t < t1+ t2 and y∗1(t)−αb1λ1(t)−
αa1λ1(t)y∗1(t) = 0 when t = t1 + t2. Note that λe
1 =pe
δ−θ+S(pe,pe) and λ1(t1 + t2) = λe1. The adjoint
function λ1(t) is given by:
λ1(t) =
(λc1 −
pδ−θ+S(p,p)
)e(δ−θ+S(p,p))(t−t1) + p
δ−θ+S(p,p) if t ≤ t1;(λe1 −
pδ−θ+S(p,p2)
)e(δ−θ+S(p,p2))(t−t1−t2) + p
δ−θ+S(p,p2)if t1 < t ≤ t1 + t2;
λe1 if t > t1 + t2.
where λc1 =
pδ−θ+S(p,p2)
+
(λe1 −
pδ−θ+S(p,p2)
)e−(δ−θ+S(p,p2))t2 .
When t ≤ t1,
G1(t) = y∗1(t)− αb1λ1(t)− αa1λ1(t)y∗1(t)
=R(p, p)
S(p, p)− αb1p
δ − θ + S(p, p)− αa1pR(p, p)
S(p, p)(δ − θ + S(p, p))+
(y01 −
R(p, p)
S(p, p)
)(1− αa1p
δ − θ + S(p, p)
)e−S(p,p)t
−α
(λc1 −
p
δ − θ + S(p, p)
)(b1 + a1
R(p, p)
S(p, p)
)e(δ−θ+S(p,p))(t−t1)
−αa1
(λc1 −
p
δ − θ + S(p, p)
)(y01 −
R(p, p)
S(p, p)
)e−(δ−θ+S(p,p))t1+(δ−θ)t .
Since λc1 <
pδ−θ+S(p,p) and y01 > ye, thus G1(t) is strictly convex. We can also check that G(t1) > 0
and G′(t1) < 0. Therefore, G1(t) > 0 when t ≤ t1.
When t1 < t ≤ t1 + t2,
G1(t) = y∗1(t)− αb1λ1(t)− αa1λ1(t)y∗1(t)
=R(p, p2)
S(p, p2)− αb1p
δ − θ + S(p, p2)− αa1pR(p, p2)
S(p, p2)(δ − θ + S(p, p2))
+
(y − R(p, p2)
S(p, p2)
)(1− αa1p
δ − θ + S(p, p2)
)e−S(p,p2)(t−t1)
−α
(λe1 −
p
δ − θ + S(p, p2)
)(b1 + a1
R(p, p2)
S(p, p2)
)e(δ−θ+S(p,p2))(t−t1−t2)
−αa1
(λe1 −
p
δ − θ + S(p, p2)
)(y − R(p, p2)
S(p, p2)
)e−(δ−θ+S(p,p2))t2+(δ−θ)(t−t1) .
Again, we can show that G′′1(t) > 0, G1(t2) = 0 and G′
1(t2) < 0. Hence, G1(t) > 0 when
t1 < t < t1 + t2.
33
Proof of Proposition 6
The current-value Hamiltonian function is given by:
H(x1, x2, p1, p2, λ1, λ2) = p1x1 + p2x2 + λ1Nα1(B + b0p0 − b1p1 − b2(p2 − p1))− λ1µx1
+λ2µx1 − λ2α2x2(A− a0p0 + a1p2).
The optimal control policies are obtained by maximizing the Hamiltonian function with respect to
p1 and p2, respectively; that is,
p∗1(t) = argmaxp1(t)
{(x1(t)−Nα1b1λ1(t) +Nα1b2λ1(t))p1(t) + (x2(t)−Nα1b2λ1(t)− α2a1x2(t)λ2(t))p2(t)
+Nα1λ1(t)(B + b0p0)− µλ1(t)x1(t) + µλ2(t)x1(t)− α2x2(t)λ(t)(A− a0p0)
}. (30)
p∗2(t) = argmaxp2(t)
{(x2(t)−Nα1b2λ1(t)− α2a1x2(t)λ2(t))p2(t) + (x1(t)−Nα1b1λ1(t) +Nα1b2λ1(t))p1(t)
+Nα1λ1(t)(B + b0p0)− µλ1(t)x1(t) + µλ2(t)x1(t)− α2x2(t)λ(t)(A− a0p0)
}. (31)
The optimal control policy is then a bang-bang control; namely,
p∗1(t) =
p1 if x∗1(t)−Nα1b1λ1(t) +Nα1b2λ1(t) > 0;
p1
if x∗1(t)−Nα1b1λ1(t) +Nα1b2λ1(t) < 0;
p1≤ p1 ≤ p1 if x∗1(t)−Nα1b1λ1(t) +Nα1b2λ1(t) = 0.
(32)
p∗2(t) =
p2 if x∗2(t)−Nα1b2λ1(t)− α2a1x∗2(t)λ2(t) > 0;
p2
if x∗2(t)−Nα1b2λ1(t)− α2a1x∗2(t)λ2(t) < 0;
p2≤ p2 ≤ p2 if x∗2(t)−Nα1b2λ1(t)− α2a1x
∗2(t)λ2(t) = 0.
(33)
The adjoint equations are:
λ1(t) = (δ + µ)λ1 − λ2µ− p1,
λ2(t) = δλ2 + α2(1− a0p0 + a1p2)λ2 − p2.
34
The long-run stationary equilibrium, denoted by (pe1, xe1, p
e2, x
e2), if it exists, satisfies:
Nα1(B + b0p0 − b1pe1 − b2(p
e2 − pe1))− µxe1 = 0,
µxe1 − α2(A− a0p0 + a1pe2)x
e2 = 0,
δλe1 = Hx1(x
e1, x
e2, p
e1, p
e2, λ
e1, λ
e2),
δλe2 = Hx2(x
e1, x
e2, p
e1, p
e2, λ
e1, λ
e2),
H(xe1, xe2, p
e1, p
e2, λ
e1, λ
e2) ≥ H(xe1, x
e2, p1, p2, λ
e1, λ
e2), ∀p
1≤ p1 ≤ p1, p
2≤ p2 ≤ p2.
This is equivalent to solving the following system of equations:
Nα1(B + b0p0 − b1p1 − b2(p2 − p1))− µx1 = 0,
µx1 − α2(A− a0p0 + a1p2)x2 = 0,
(δ + µ)λ1 − µλ2 − p1 = 0,
δλ2 + α2(A− a0p0 + a1p2)λ2 − p2 = 0,
x1 −Nα1b1λ1 +Nα1b2λ1 = 0,
x2 −Nα1b2λ1 − α2a1x2λ2 = 0.
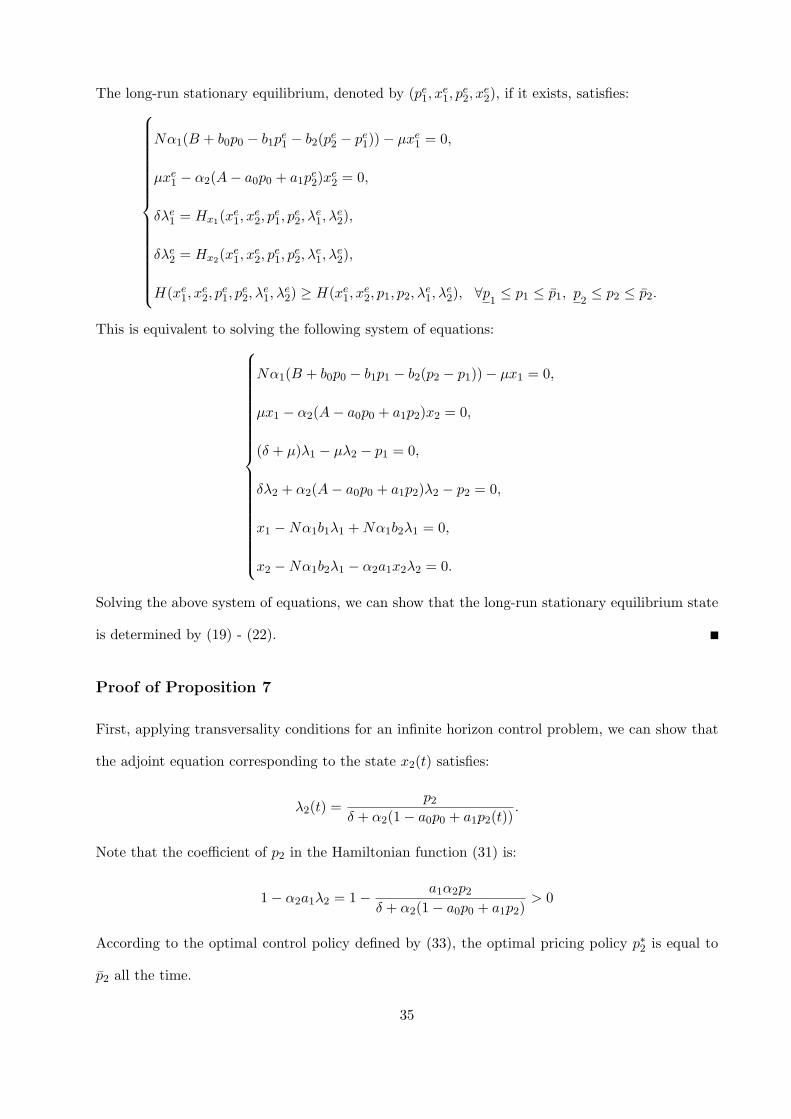
Solving the above system of equations, we can show that the long-run stationary equilibrium state
is determined by (19) - (22).
Proof of Proposition 7
First, applying transversality conditions for an infinite horizon control problem, we can show that
the adjoint equation corresponding to the state x2(t) satisfies:
λ2(t) =p2
δ + α2(1− a0p0 + a1p2(t)).
Note that the coefficient of p2 in the Hamiltonian function (31) is:
1− α2a1λ2 = 1− a1α2p2δ + α2(1− a0p0 + a1p2)
> 0
According to the optimal control policy defined by (33), the optimal pricing policy p∗2 is equal to
p2 all the time.
35
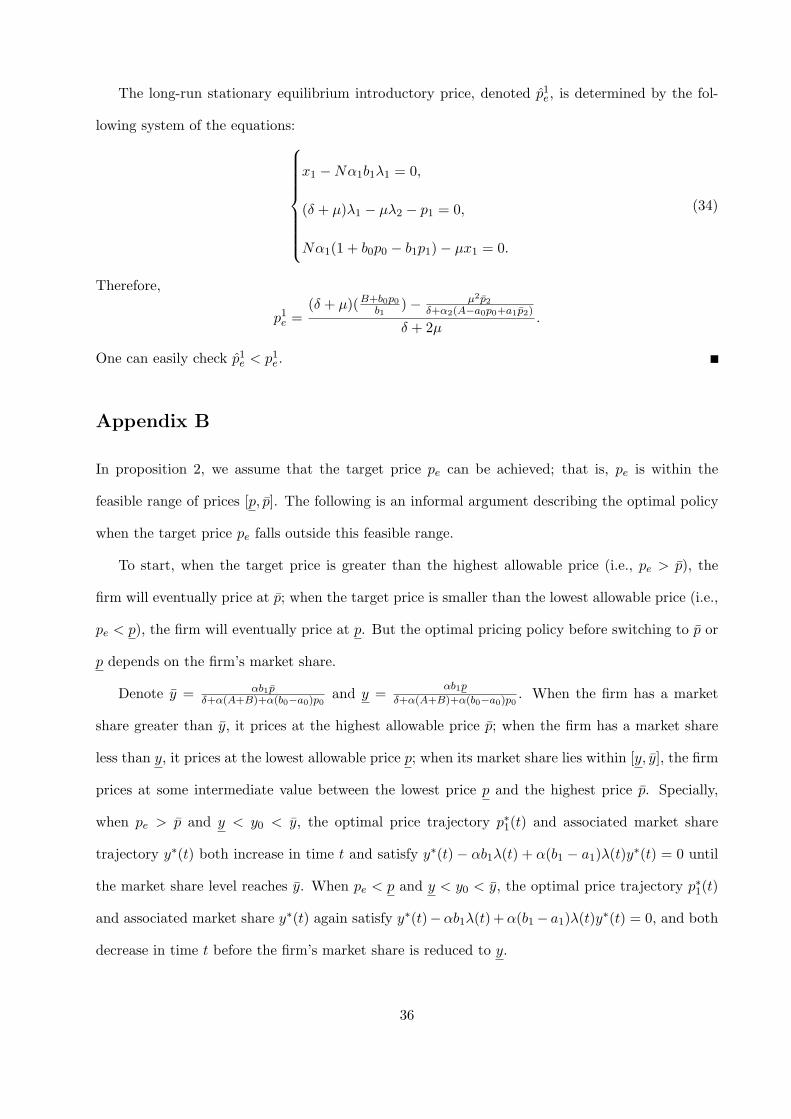
The long-run stationary equilibrium introductory price, denoted p1e, is determined by the fol-
lowing system of the equations:
x1 −Nα1b1λ1 = 0,
(δ + µ)λ1 − µλ2 − p1 = 0,
Nα1(1 + b0p0 − b1p1)− µx1 = 0.
(34)
Therefore,
p1e =(δ + µ)(B+b0p0
b1)− µ2p2
δ+α2(A−a0p0+a1p2)
δ + 2µ.
One can easily check p1e < p1e.
Appendix B
In proposition 2, we assume that the target price pe can be achieved; that is, pe is within the
feasible range of prices [p, p]. The following is an informal argument describing the optimal policy
when the target price pe falls outside this feasible range.
To start, when the target price is greater than the highest allowable price (i.e., pe > p), the
firm will eventually price at p; when the target price is smaller than the lowest allowable price (i.e.,
pe < p), the firm will eventually price at p. But the optimal pricing policy before switching to p or
p depends on the firm’s market share.
Denote y = αb1pδ+α(A+B)+α(b0−a0)p0
and y =αb1p
δ+α(A+B)+α(b0−a0)p0. When the firm has a market
share greater than y, it prices at the highest allowable price p; when the firm has a market share
less than y, it prices at the lowest allowable price p; when its market share lies within [y, y], the firm
prices at some intermediate value between the lowest price p and the highest price p. Specially,
when pe > p and y < y0 < y, the optimal price trajectory p∗1(t) and associated market share
trajectory y∗(t) both increase in time t and satisfy y∗(t)− αb1λ(t) + α(b1 − a1)λ(t)y∗(t) = 0 until
the market share level reaches y. When pe < p and y < y0 < y, the optimal price trajectory p∗1(t)
and associated market share y∗(t) again satisfy y∗(t)−αb1λ(t)+α(b1 − a1)λ(t)y∗(t) = 0, and both
decrease in time t before the firm’s market share is reduced to y.
36
An informal argument for why such a policy is optimal is as follows: consider the case of
pe > p and y < y0 < y for illustration. We can check that the coefficient of the control
variable p1 in the Hamiltonian function (6), that is, y∗(t) − αb1λ(t) + α(b1 − a1)y∗(t), becomes
− αb1p1−y0(δ+α(A+B)+α(b0−a0)p0)δ+α(A+B)+α(b0−a0)p0−α(b1−a1)p1
given the firm’s price p1 at t = 0. If the firm prices at p, this
coefficient is negative, which contradicts the optimal pricing policy described in (23). If the firm
prices at p, the coefficient is positive, which again contradicts (23). Hence, the optimal price at
t = 0 must be equal to p∗1(0) = y0(δ+α(A+B)+α(b0−a0)p0)αb1
and p < p∗1(0) < p. We can easily verify
that dy∗
dt |t=0 > 0. Therefore, the associated market share is increasing in [0, δt] where δt is an in-
finitesimal time interval. Suppose the market share increases to y∗(δt) at time δt. Using the same
argument as in the case of t = 0, we can show that p∗1(δt) =y∗(δt)(δ+α(A+B)+α(b0−a0)p0)
αb1, which is
greater than p∗1(0) because y∗(δt) > y0. Repeat this process until the market share reaches y, and
the optimal price increases to p. Hence, the optimal price and the associated market share continu-
ally increase in time until the market share reaches y when the firm’s initial market share is within
[y, y] and pe > p. This implies that the firm may use continually increasing or decreasing (when
pe < p) prices for part of the optimal control trajectory when the target price is not attainable.
37


![Option Pricing Under a Discrete-Time Markov Switching ... · arXiv:2006.15054v1 [q-fin.PR] 26 Jun 2020 Option Pricing Under a Discrete-Time Markov Switching Stochastic Volatility](https://img.dokumen.tips/doc/110x75/5fc5bcca12dd631bfe463aea/option-pricing-under-a-discrete-time-markov-switching-arxiv200615054v1-q-finpr.jpg)