Embed Size (px)
Citation preview

366 Magnetic Resonance in Medical Sciences | Vol. 19, No. 4
Optimal Plane Selection for Measuring Post-prandial Blood Flow Increase within the Superior Mesenteric Artery: Analysis Using
4D Flow and Computational Fluid Dynamics
Masataka Sugiyama1, Yasuo Takehara1*, Masanori Kawate2, Naoki Ooishi2, Masaki Terada3, Haruo Isoda4, Harumi Sakahara5, Shinji Naganawa6,
Kevin M. Johnson7,8, Oliver Wieben7,8, Tetsuya Wakayama9, Atsushi Nozaki9, and Hiroyuki Kabasawa9
Purpose: 2D cine phase contrast (PC)-MRI is a standard velocimetry for the superior mesenteric artery (SMA); however, the optimal localization of the measurement plane has never been fully discussed previ-ously. The purpose of this Institutional Review Board approved prospective and single arm study is to test whether flow velocimetry of the SMA with combined use of 2D cine PC-MRI and meal challenge is depen-dent on the localizations of the measurement planes and to seek optimal section for velocimetry.Methods: Seven healthy volunteers underwent cardiac phase resolved ECG gated 2D cine PC-MRI pre- and 30 min post-meal challenge at three measurement planes: proximal, curved mid section and distal straight section of the SMA at 3T. 4D Flow using 3D cine PC-MRI with vastly undersampled isotropic projection imaging (PC VIPR) was also performed right after 2D cine PC-MRI to delineate the flow dynamics within the SMA using streamline analysis. Two radiologists measured flow velocities, and rated the appearances of the abnormal flow in the SMA on streamlines derived from the 4D Flow and the computational fluid dynamics (CFD).Results: 2D cine PC-MRI measured increased temporally averaged flow velocity (mm/s) after the meal challenge only in the proximal (129.3 vs. 97.8, P = 0.0313) and distal section (166.9 vs. 96.2, P = 0.0313), not in the curved mid section (113.1 vs. 85.5, P = 0.0625). The average velocities were highest and their standard errors (8.5–26.5) were smallest at the distal straight section both before and after the meal challenge as com-pared with other sections. The streamline analysis depicted more frequent appearances of vertical or helical flow in the curved mid section both on 4D Flow and CFD (κ: 0.27–0.68).Conclusion: SMA velocimetry with 2D cine PC-MRI was dependent on the localization of the measure-ment planes. Distal straight section, not in the curved mid section is recommended for MR velocimetry.
Keywords: 4D Flow, phase contrast image, superior mesenteric artery, flow measurement, post-prandial hyperemia
Published Online: January 31, 2020Magn Reson Med Sci 2020; 19; 366–374doi:10.2463/mrms.mp.2019-0089
1Department of Fundamental Development for Advanced Low Invasive Diagnostic Imaging, Nagoya University Graduate School of Medicine, Aichi, Japan
Received: July 3, 2019 | Accepted: December 21, 2019
2Department of Radiological Technology, Hamamatsu University Hospital, Shizuoka, Japan3Department of Radiological Technology, Iwata Municipal Hospital, Shizuoka, Japan4Brain & Mind Research Center, Nagoya University, Aichi, Japan5Department of Diagnostic Radiology & Nuclear Medicine, Hamamatsu University School of Medicine, Shizuoka, Japan6Department of Radiology, Nagoya University Graduate School of Medicine, Aichi, Japan7Department of Medical Physics, University of Wisconsin, Madison, WI, USA8Department of Radiology, University of Wisconsin, Madison, WI, USA9GE Healthcare, Global Applied Science Laboratory, Tokyo, Japan
MAJOR PAPER
*Corresponding author: Department of Fundamental Development for Advanced Low Invasive Diagnostic Imaging, Nagoya University Graduate School of Medicine, 65 Tsurumai-cho, Shouwa-ku, Nagoya, Aichi 466-8550, Japan. Phone: +81-52-744-2327, Fax: +81-52-744-2335, E-mail: [email protected]
©2020 Japanese Society for Magnetic Resonance in MedicineThis work is licensed under a Creative Commons Attribution-NonCommercial- NoDerivatives International License.
367Vol. 19, No. 4
Optimal Plane for PC Velocimetry in SMA
IntroductionFlow velocity measurement of the superior mesenteric artery (SMA) to assess acute or chronic small bowel ischemia has been one of the classical clinical topics in abdominal radiology.1–4 Doppler ultrasonography and 2D cine phase contrast (PC)-MRI are established techniques that have tradi-tionally been utilized with or without meal challenge to measure blood flow velocity.3,4 However, there have been few investigations concerning the optimal plane selection for flow velocity measurements. We hypothesized that the meas-urement of blood flow velocity may be dependent on plane localization, because abnormal blood flow dynamics can be generated by abruptly curved pathways of the SMA.
To visually access the flow dynamics, streamline anal-ysis based on 4D Flow in vivo and computational fluid dynamics (CFD) in silico are two best methods currently available. For in vivo study, we used one of the cutting edge sequences innovated for 4D Flow. Three dimensional cardiac phase resolved phase contrast MRI techniques (4D Flow) utilizing 3D cine phase contrast imaging with vastly under-sampled isotropic projection imaging (PC VIPR)5–8 uses non-Cartesian 3D radial data with k-space sampling, which has shown its ability to produce high spatial and temporal resolution data of the blood flow velocity, and thereby, visu-alize 3D streamlines of the blood flow.9 Recent studies have validated the ability of PC VIPR to visualize and quantify the abdominal aorta as well as visceral arteries5 including SMA.10 Typical MRI uses Cartesian data sampling, on the other hand, PC VIPR samples data using a radial trajectory, similar appearances to a “koosh ball”. Since all the data lines includes k-space center or low frequency data components, PC VIPR provides a high level of robustness to motion and undersampling. Resultant short TE allows for avoidance of intravoxel de-phasing, thereby, beneficial for the assessment of the flow analysis. PC VIPR allows for measuring not only time-resolved velocity data during a cardiac cycle, but high definition 3D MRA when maximum intensity projection (MIP) reconstruction of the temporally averaged magnitude images are performed.5 By using this MR method, temporal and whole spatial velocity as well as the morphology data within the main trunk of SMA or its branches are acquired. For in silico validations, we used CFD as well.
With an aid of 4D Flow and CFD, the purpose of this Institutional Review Board (IRB) approved prospective and single arm study is to test whether flow velocimetry in the SMA with combined use of 2D cine PC and meal challenge is dependent on the localizations of the measurement planes and to seek optimal section for velocimetry.
Materials and MethodsVolunteersThe IRB approved study (#25–40) was performed enrolling seven healthy male volunteers with age ranging from 23 to
53 years. Written informed consent was provided by each volunteers.
Meal challengeAfter 5 h of fasting, MR images were acquired before and 30 min after the intake of 400 kcal of a dietary supplement (Calorie Mate, Otsuka Pharm Co., Ltd., Japan). The contents of the supplement are as follows; protein: 8 g, fat: 21.9 g, sugars: 41.7 g, dietary fiber: 2 g, sodium: 280 mg, potassium: 110 mg, calcium: 200 mg, iron: 2.5 mg, magnesium: 50 mg, phosphorus: 80 mg, vitamin A: 225 μg, vitamin B1: 0.5 mg, vitamin B2: 0.6 mg, vitamin B6: 0.5 mg, vitamin B12: 1 μg, niacin: 5.5 mg, pantothenic acid: 2.8 mg, folic acid: 100 μg, vitamin C: 40 mg, vitamin D: 2.5 μg, vitamin E: 4 mg. The supplement was provided with 100 mL of mineral water (hardness of 24) in the sitting position on the MR cradle.
MR scannerAll studies were conducted on a 3T MR scanner (Discovery MR750, General Electric, Waukesha, WI, USA) with a 12-channel phased array coil.
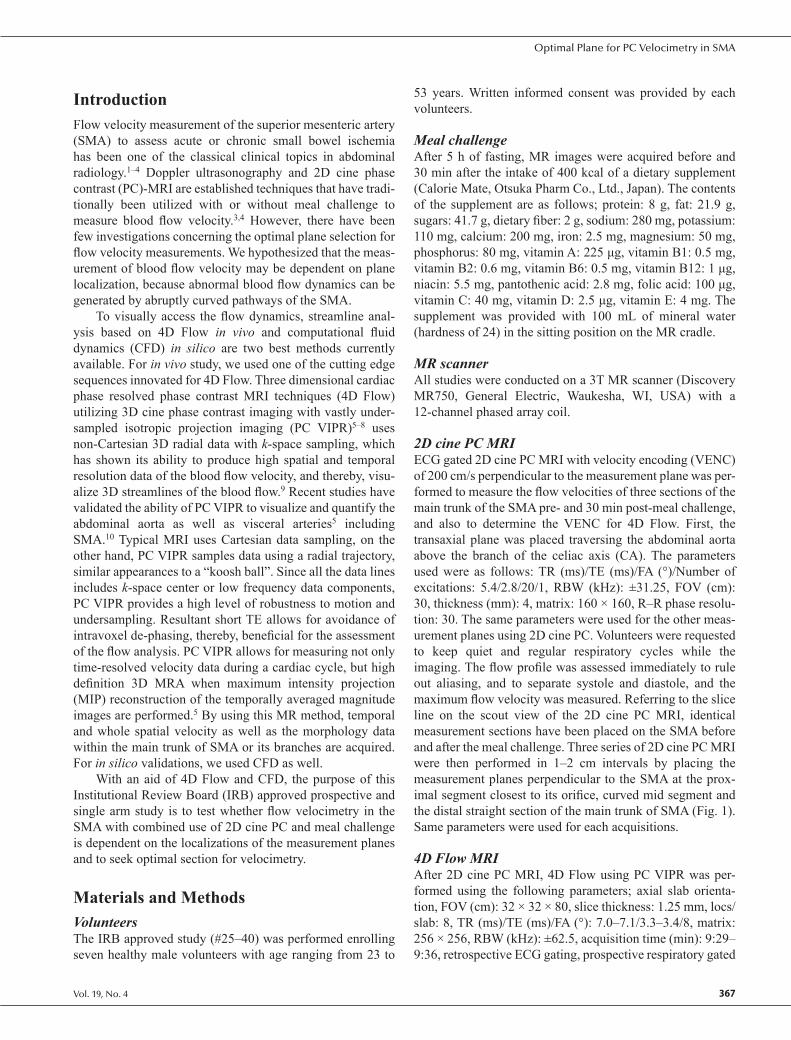
2D cine PC MRIECG gated 2D cine PC MRI with velocity encoding (VENC) of 200 cm/s perpendicular to the measurement plane was per-formed to measure the flow velocities of three sections of the main trunk of the SMA pre- and 30 min post-meal challenge, and also to determine the VENC for 4D Flow. First, the transaxial plane was placed traversing the abdominal aorta above the branch of the celiac axis (CA). The parameters used were as follows: TR (ms)/TE (ms)/FA (°)/Number of excitations: 5.4/2.8/20/1, RBW (kHz): ±31.25, FOV (cm): 30, thickness (mm): 4, matrix: 160 × 160, R–R phase resolu-tion: 30. The same parameters were used for the other meas-urement planes using 2D cine PC. Volunteers were requested to keep quiet and regular respiratory cycles while the imaging. The flow profile was assessed immediately to rule out aliasing, and to separate systole and diastole, and the maximum flow velocity was measured. Referring to the slice line on the scout view of the 2D cine PC MRI, identical measurement sections have been placed on the SMA before and after the meal challenge. Three series of 2D cine PC MRI were then performed in 1–2 cm intervals by placing the measurement planes perpendicular to the SMA at the prox-imal segment closest to its orifice, curved mid segment and the distal straight section of the main trunk of SMA (Fig. 1). Same parameters were used for each acquisitions.
4D Flow MRIAfter 2D cine PC MRI, 4D Flow using PC VIPR was per-formed using the following parameters; axial slab orienta-tion, FOV (cm): 32 × 32 × 80, slice thickness: 1.25 mm, locs/slab: 8, TR (ms)/TE (ms)/FA (°): 7.0–7.1/3.3–3.4/8, matrix: 256 × 256, RBW (kHz): ±62.5, acquisition time (min): 9:29–9:36, retrospective ECG gating, prospective respiratory gated

368 Magnetic Resonance in Medical Sciences
M. Sugiyama et al.
(adaptive acceptance window: 50%), projection number: 10000, and VENC (cm/s): 100–200 (The optimum VENC for 4D Flow was determined individually based on the +20% over the maximum velocities that was measured with 2D cine PC MRI at the abdominal aorta above CA.). 4D Flow was also performed pre- and post-meal challenge. Twenty cardiac phase resolved images were obtained for all cases. Tempo-rally averaged magnitude signals were post-processed with maximum intensity projection algorithm and the MRA was used to verify the morphologies of the visceral branches.
Flow velocity measurements with 2D cine PCUsing dedicated flow analysis software (FLOVA II, Rꞌ Tech, Hamamatsu, Japan), velocity measurements were performed by two diagnostic radiologists (MS and WY). They meas-ured cardiac phase resolved flow velocities by placing the largest possible region of interest (ROI) (26–40 pixels) on each cross-section of the SMA at (1) proximal section of the SMA, (2) curved mid section of the SMA and (3) distal straight section before branching the first jejunal branch, and then, time velocity curves were automatically drawn. The ROIs were copied from the systolic cardiac phase of the image, and pasted on the other cardiac phase resolved sec-tions on the SMA, and then misregistrations were manually corrected. The acquired values were then averaged. Same procedures were repeated before and after the meal.
Depictions of the streamline patterns with 4D Flow datasetsUsing FLOVA II, the boundary of the vessel was segmented using the reconstruction planes of temporary averaged mag-nitude signals derived from the PC VIPR. Somewhat larger boundaries were selected by setting lower thresholds and/or region growing method in order not to omit any velocity
vectors inside the SMA. The 3D flow velocity vectors were interpolated using a spatial resolution of 1.25 × 1.25 × 1.25 mm3 from the three-dimensional data sets. Streamlines were then generated using the Runge–Kutta method.11
Depictions of the streamline patterns using computational fluid dynamicsStreamlines were also depicted with computer simulations. CFD simulations were performed using a general purpose solver that is capable of performing thermal fluid simulations (Ansys CFX ver. 14.5, Ansys, PA, USA). The simulation was performed by solving the Navier–Stokes equations, which is a set of equations describing the motion of fluids in a finite volume. The simulation was based on several assumptions as follows: rigid vessel walls, an incompressible Newtonian fluid, and zero flow velocity at the vessel wall. Viscosity and density values were set to the standard blood values (3.8e−3 kg/m * s, 1054.0 kg/m3). 3D MR angiography was recon-structed with maximum intensity projection algorithm using temporally averaged magnitude images, which was exported by FLOVA II in STereo Lithography (STL) format. The STL data was then verified and moderated by 3D modeling soft-ware (MIMICS 3-Matic, Materialize, Leuven, Belgium). Time resolved inflow volume data measured at the abdom-inal aorta above the CA was used for the boundary conditions that was determined from the 4D Flow measurement. For the outflow condition, the pressure at the main trunk of the SMA as well as each measurable branches of the SMA, bilateral renal arteries, the main trunk of the CA, and the aortic sec-tion below the visceral arteries were set to null. The rationale for the delineations of the streamline using CFX is elaborated elsewhere.12 The seeding points was 25.
3D flow dynamics assessmentTwo diagnostic radiologists (MS and WY) with more than 5 years of experience each in flow analysis assessed the flow patterns over the cardiac cycle within the SMA based on the streamline post-processed by PC VIPR as well as the simulation data derived from the CFD. Viewing the cine loops of the streamlines from arbitrary directions on a monitor display of the work station, abnormal flow patterns were visually rated on three point scale as 0: mostly laminar (parabolic or Wormersley) flow, 1: mild vortex and/or helical flow and 2: severe vortex and/or helical flow. Systole and diastole were rated separately (Fig. 2a–2d).
StatisticsThe increase of blood flow velocity at each plane measured with 2D cine PC MRI was statistically analyzed. Temporally averaged flow velocity was calculated for each section before and after meal challenge. The increase in temporally aver-aged flow velocity at each plane was statistically analyzed by Wilcoxon test of paired samples for its significance. Cardiac phase resolved flow velocities pre- and post-meal were also compared and the results were analyzed by Wilcoxon test.
Fig. 1 Three measurement planes were set perpendicular to the superior mesenteric artery (SMA). The scheme shows Pro: proximal section, CurvMid: curved mid section, DistStra: distal straight sec-tion on the MR angiography of the upper abdomen.

369Vol. 19, No. 4
Optimal Plane for PC Velocimetry in SMA
Inter-observer and inter-modality agreements in flow pattern analysis was assessed with linear weighted kappa statistics. κ-values below 0.2 were interpreted as poor, 0.21–0.40 as fair, 0.41–0.60 as moderate, 0.61–0.8 as good, and 0.81–1.0 as very good agreements. Statistical application (MedCalc Statistical Software version 14.10.2, MedCalc Software bvba, Ostend, Belgium) was used for the analysis. P-value <0.05 was considered significant.
ResultsAll the MR examinations were successfully performed. No obstruction or deformity were found within the SMA in six out of seven volunteers by MR angiography. One volunteer had replaced right hepatic artery (rRHA) as a normal vascular var-iant. Cardiac rate reflected by R–R interval did not change sig-nificantly between pre- and post-meal challenge, which were
pre: 1.176 (CI: 1.051–1.182) vs. post: 1.111 (CI: 1.004–1.116), P = 0.125.
The velocity data measured by 2D cine PC MRI showed an increase in blood flow velocity after the meal challenge (Fig. 3); however, significant increase of temporally aver-aged velocities was observed only at the proximal (97.8 ± 23.5 mm/s vs. 129.3 ± 35.6 mm/s; P = 0.0313) and the distal section (96.2 ± 8.5 mm/s vs. 166.9 ± 20.5 mm/s; P = 0.0313). Significant increase of the velocity during diastole was observed only at distal straight section (20.3 ± 5.0 mm/s vs. 64.7 ± 14.1; P = 0.0313) (Table 1). The velocity value after meal was highest at the distal straight section irrespective of cardiac phase.
The streamline delineated mostly laminar, undisturbed antegrade flow at the distal straight segment of the SMA; however, disturbed (i.e., vortex and/or helical) flow was dominant at the curved mid section. At the proximal section
Fig. 2 The representative ratings for an individual on 4D Flow. (a) The representative ratings for flow disturbances assessed on 4D Flow. Proximal section was rated 0 (laminar), mid section 1 (mild vortex and/or helical flow) and distal section: 0 (laminar). (b) Proximal section: rated 1 (mild vortex and/or helical flow), mid section: 2 (severe vortex and/or helical flow), and the distal section: rated 1 (mild vortex and/or helical flow). The representative ratings for 2 different individuals on computational fluid dynamics (CFD). (c) The representative ratings for flow disturbances assessed on CFD. Proximal section was rated 1 (mild vortex and/or helical flow), mid section 2 (severe vortex and/or helical flow) and distal section: 1 (mild vortex and/or helical flow). (d) Proximal section: rated 0 (laminar), mid section: 1 (mild vortex and/or helical flow), and the distal section: rated 1 (mild vortex and/or helical flow).
a b
c
a
d

370 Magnetic Resonance in Medical Sciences
M. Sugiyama et al.
Table 1 2D cine PC MRI measured increased temporally averaged flow velocity after the meal challenge only in the proximal and distal section, not in the curved mid section. The average velocities were highest and their standard errors were smallest at the distal straight section both before and after the meal challenge as compared to other sections irrespective of cardiac phase.
AUC (mm/s × 1 cardiac cycle) (median ± SE)P
Before meal CI After meal CI
Whole cardiac cycle
Proximal 97.8 ± 23.5 27.7–171.8 129.3 ± 35.6 70.4–270.8 0.0313*
Mid 85.5 ± 38.6 56.1–272.1 113.1 ± 36.9 92.8–296.2 0.0625
Distal 96.2 ± 8.5 68.1–115.9 166.9 ± 26.5 76.2–234.0 0.0313*
Systole Proximal 76.6 ± 11.7 48.0–119.1 92.0 ± 18.9 70.9–177.1 0.0625
Mid 66.9 ± 23.9 51.9–183.3 78.9 ± 25.1 66.7–202.2 0.0625
Distal 73.3 ± 4.2 62.5–87.9 101.6 ± 14.3 62.4–148.7 0.0625
Diastole Proximal 21.2 ± 12.0 20.3–52.7 37.3 ± 17.0 −0.5–93.9 0.0625
Mid 18.6 ± 14.8 4.2–88.8 34.2 ± 12.1 26.1–94.0 0.0938
Distal 20.3 ± 5.0 5.6–32.2 64.7 ± 14.1 13.8–101.8 0.0313*
*Significant increase of flow velocity (P < 0.05). AUC, area under the curve.
Fig. 3 Graphs show phase resolved blood flow velocity measured at each plane with 2D cine PC MRI before and after meal challenge (Averaged values). Most of the significant increase of the flow velocities at each phase points are detected mainly at distal straight section, whereas least increase are seen at the curved mid sec-tion. *Significant increase of flow velocity (P < 0.05).

371Vol. 19, No. 4
Optimal Plane for PC Velocimetry in SMA
of the SMA, partially turbulent or helical flow patterns that were not parallel to the vessel were also delineated (Fig. 4a and 4b). The CFD also delineated disturbed vortex and/or helical flow patterns within the curved mid section, and helical flow at the proximal section (Fig. 5a and 5b). The streamline analysis based on CFD simulation in silico vali-dated the result based on PC VIPR measurement in vivo by showing the same trend in blood flow patterns (Fig. 6).
The inter-observer agreement concerning the assess-ments of the SMA flow patterns indicated that the visual evaluation of the streamlines was moderate to good agree-ments for both 4D Flow (systole; k = 0.43, diastole; k = 0.56) and CFD simulation (systole; k = 0.42, diastole; k = 0.68).
The inter-modarity agreement concerning the assess-ments of the SMA flow patterns indicated that the visual evaluation of the streamlines was also fair to good agreements; systole: k = 0.44–0.67 (moderate to good), diastole: k = 0.27–0.29 (fair).
DiscussionPhase contrast velocimetry is an established technique; how-ever, many concerns are advocated when it comes to the flowmetry in non-laminar flow. O’Brien et al. found that phase contrast MR flowmetry is robust in non-stenosed flow path; however, it suffered from more velocity errors in the
Fig. 4 Representative streamline in the superior mesenteric artery (SMA) at systole (a: left) and diastole (b: right) after meal challenge depicted by 4D Flow. Helical and/or vortex flow was dominant at the curved mid section at systole and diastole, whereas mostly laminar flow was observed at the proximal and distal straight section.
a b
Fig. 5 The same trend of the flow dynamics within the superior mesenteric artery (SMA) was observed based on the computational fluid dynamics streamline analysis for the SMA model derived from the same volunteer as shown in Fig. 4 depicted at systole (a: left) and diastole (b: right) after meal challenge.
a b

372 Magnetic Resonance in Medical Sciences
M. Sugiyama et al.
stenotic flow path. Whereas, the errors reduced with shorter TEs. They speculated that this type of errors are based on the intravoxel phase dispersions, which is reflected by “Salt and pepper artifacts” on the phase images.13
Postprandial blood flow increase in the SMA seen on phase contrast MRI is a widely recognized physiological reaction. According to a meta-analysis, significant increase of blood flow ranging from 58% to 250% has been reported.14 Wide range of the values is probably due to the amount of meal and measured timing. In the current study, MR veloci-metry measured increased phase averaged post-prandial flow velocity at the proximal section and the distal straight section; however, failed to show statistical increase at the curved mid section of the main trunk of the SMA. The standard errors of the measured velocity values at the curved mid section were consistently larger than those in proximal or distal straight section (Table 1). We presume this was a failure of veloci-metry at the section where rotational flow was dominant due to the sharp turn of the SMA. Those disturbed flow patterns seen at the proximal and curved mid section were considered to have prevented accurate measurements of the flow velocity. Visceral arteries such as SMA typically form abrupt or sharp curve and/or off-branching variant vessels in their pathway. In such vessels, the hemodynamics are not as simple as para-bolic or Wormersley flow that is usually seen in the straight flow path. The blood flow within the curved vessels may gen-erate disturbed flow such as vortex and/or helical flow. As a result, fluctuated flow velocities create larger standard errors in the measured data, and thereby, obscure significant post-prandial hyperemia as temporally averaged flow velocities.
This type of velocimetry failure due to complex flow is even more prevalent in the pathological status. When the orifice of visceral arteries are narrowed, the time velocity curves measured are sometimes oscillatory.2 This phenomenon is sometimes seen at the post-stenotic portions of the SMA of the
patients suffering from chronic intestinal ischemia,2 or at the narrowed renal artery of the patients with renovascular hyper-tension.15 The reasons for these oscillations or fluctuations have never been explained reasonably. We presume this was created by the jet flow through the senotic channel and subsequent vortex and/or helical flow in the dilated post-stenotic portion.
4D Flow datasets with an aid of streamline analysis visu-ally indicated that the vortex and/or helical flow were domi-nant at the curved mid section during systole, which were not at the distal straight section where the stream lines were mostly laminar with partial helical flow. During diastole, helical or disturbed flow were observed in all three sections; however, they were more prominent at the curved mid sec-tion. Besides the complex non-laminar disturbed flow in the curved mid section, slightly turbulent flow pattern that was not parallel to the vessel was also delineated at the proximal section of the SMA. This was probably due to the sharp rise of the branching angle of the SMA from the abdominal aorta that might have generated in and out flow caused by contig-uous high velocity flow of the abdominal aorta striking the branching orifice of the SMA. Abnormal flow patterns at the proximal section was also depicted in the SMA of the volun-teer with rRHA. In the SMA with rRHA, moderately vortex and/or helical flow was observed at the proximal and the curved mid section during systole. In the previously pub-lished textbook for quantification of blood flow, SMA orifice has been recommended for the measurement plane, because the plane was supposed to be less affected by respiratory motion of the SMA.1 However, the results of our hemody-namic analysis implicate that distal straight section is more appropriate than proximal section for correct velocimetry.
Extending the results of our study, not limited to SMA, as a general rule, avoidance of disturbed flow is required for the accurate measurement of the blood flow velocity of the visceral arteries. Recruiting 43 children with aortic
Fig. 6 The graphs show the average grades (0: laminar flow, 1: mild vortex and/or helical flow and 2: severe vortex and/or helical flow) of the abnormal flow dynamics rated by two observers at each section. Note highest frequencies of the appearances of the abnormal flow dynamics were at the curved mid section both before and after the meal challenge irrespective of cardiac phases. CFD, computational fluid dynamics.

373Vol. 19, No. 4
Optimal Plane for PC Velocimetry in SMA
regurgitation, Iwamoto et al. found that the large variations in PC measurement for the systolic forward, diastolic retro-grade and net forward flow volumes at different levels of the aortic valve and ascending aorta. They therefore concluded that the PC measurement for aortic regurgitation volume and fraction is inaccurate and should be abandoned.16 We pre-sume that streamline analysis using 4D Flow data before measurement plane selection may be a beneficial solution for more accurate flowmetry in the complexed flow.
It might sound weird to separately see streamline on 4D Flow and measure flow velocities with 2D cine PC; however, the latter is currently more precise in velocimetry, because of its robustness in measuring accelerated flow velocities, and in better cardiac phase resolutions. We deem the difference is based on the lengthy three directional velocity encoding in 4D Flow vs. brief one velocity encoding perpendicular to the plane for 2D cine PC MRI. In near future; however, visual flow delin-eations and velocimetry can be checked together only with 4D Flow when the precision of its velocimetry is further improved.
In this study, CFD was used for a validation of the flow patterns measured within the SMA. CFD reproduced dis-turbed flow most frequently in the curved mid section. There-fore, our hypothesis that there are optimal measurement planes in the SMA has also been supported in silico. Obviously, curved mid section should be avoided for the measurement.
We have dealt with flow velocity instead of flow volume, because we wished to eliminate the uncertainty of the varia-tions between areas of the measurement planes. However, as long as average velocities were measured, the average flow velocities and flow volumes are equally affected by the vari-ations of the areas of the measurement sections. To get rid of as much uncertainty as possible of the varying areas mainly due to the pulsation of the SMA, we have adjusted the ROIs of each cardiac phase manually.
The limitations of this study are (1) single center study using a relatively small sample size and (2) CFD was per-formed based on the assumption that the vessel wall was rigid; however, in reality, the vessel wall is elastic with a cer-tain level of compliance.
ConclusionIn conclusion, for accurate measurement of blood flow velocity within the SMA, distal straight section should be selected. Curved mid section should be avoided for non- laminar flow. Flow depictions using 4D Flow is helpful in selecting optimal measurement planes for the blood flow velocimetry by depicting streamlines within the SMA.
Conflicts of InterestThe corresponding author Yasuo Takehara is an endowed chair of Nagoya University supported by a private com-pany; however, the status is irrelevant to the contents of the paper.
Coauthors Tetsuya Wakayama, Atsushi Nozaki and Hiroyuki Kabasawa are employees of GE Healthcare.
Other coauthors have nothing to disclose related to the current study.
References 1. Debatin JF. Quantification of blood flow, In: Arlart IP,
Bongartz GM, Marchal G, eds. Magnetic Resonance Angiography. 2nd ed. New York: Springer, 2002.
2. Li KC, Whitney WS, McDonnell CH, et al. Chronic mesenteric ischemia: evaluation with phase-contrast cine MR imaging. Radiology 1994; 190:175–179.
3. Masui T, Isoda H, Mochizuki T, et al. Effects of meal intake on the flow velocity in the superior mesenteric artery: evaluation with 2D phase mapping MRI. J Comput Assist Tomogr 1994; 18:590–595.
4. Naganawa S, Cooper TG, Jenner G, Potchen EJ, Ishigaki T. Flow velocity and volume measurement of superior and inferior mesenteric artery with cine phase contrast magnetic resonance imaging. Radiat Med 1994; 12:213–220.
5. Frydrychowicz A, Landgraf BR, Niespodzany E, et al. Four-dimensional velocity mapping of the hepatic and splanchnic vasculature with radial sampling at 3 tesla: a feasibility study in portal hypertension. J Magn Reson Imaging 2011; 34:577–584.
6. Frydrychowicz A, Markl M, Harloff A, et al. [Flow-sensitive in-vivo 4D MR imaging at 3T for the analysis of aortic hemodynamics and derived vessel wall parameters]. Rofo 2007; 179:463–472. (in German)
7. Jiang J, Strother C, Johnson K, et al. Comparison of blood velocity measurements between ultrasound Doppler and accelerated phase-contrast MR angiography in small arteries with disturbed flow. Phys Med Biol 2011; 56:1755–1773.
8. Motoyama D, Ishii Y, Takehara Y, et al. Four-dimensional phase-contrast vastly undersampled isotropic projection reconstruction (4D PC-VIPR) MR evaluation of the renal arteries in transplant recipients: preliminary results. J Magn Reson Imaging 2017; 46:595–603.
9. Moftakhar R, Aagaard-Kienitz B, Johnson K, et al. Noninvasive measurement of intra-aneurysmal pressure and flow pattern using phase contrast with vastly undersampled isotropic projection imaging. AJNR Am J Neuroradiol 2007; 28:1710–1714.
10. Roldán-Alzate A, Frydrychowicz A, Said A, et al. Impaired regulation of portal venous flow in response to a meal challenge as quantified by 4D flow MRI. J Magn Reson Imaging 2015; 42:1009–1017.
11. Liu Z, Moorhead RJ, Groner J. An advanced evenly-spaced streamline placement algorithm. IEEE Trans Vis Comput Graph 2006; 12:965–972.
12. Streamline Curvature and System Rotation. ANSYS CFX-Solver Theory Guide (Release 140). ANSYS, Inc., 2011, pp. 120–121.
13. O’Brien KR, Cowan BR, Jain M, Stewart RA, Kerr AJ, Young AA. MRI phase contrast velocity and flow errors in turbulent stenotic jets. J Magn Reson Imaging 2008; 28:210–218.

374 Magnetic Resonance in Medical Sciences
M. Sugiyama et al.
14. Someya N, Endo MY, Fukuba Y, Hayashi N. Blood flow responses in celiac and superior mesenteric arteries in the initial phase of digestion. Am J Physiol Regul Integr Comp Physiol 2008; 294:R1790–R1796.
15. Ishikawa T, Takehara Y, Yamashita S, et al. Hemodynamic assessment in a child with renovascular hypertension
using time-resolved three-dimensional cine phase-contrast MRI. J Magn Reson Imaging 2015; 41:165–168.
16. Iwamoto Y, Inage A, Tomlinson G, et al. Direct measurement of aortic regurgitation with phase-contrast magnetic resonance is inaccurate: proposal of an alternative method of quantification. Pediatr Radiol 2014; 44:1358–1369.