Embed Size (px)
Citation preview

International Journal of Scientific Engineering and Research (IJSER) www.ijser.in
ISSN (Online): 2347-3878 Volume 2 Issue 9, September 2014
Licensed Under Creative Commons Attribution CC BY
Optimal Placement of Capacitor and Sizing in a Radial Distribution Network to Reduce Real Power
Losses
Sathya Siva Chandan. G1
1B.E in Electrical and Electronics Engineering from Anna University, Chennai-600025, India
Abstract: Electricity distribution constitutes the concluding stage in the delivery of electricity to the consumers. This distribution network transports electricity from the transmission system and delivers it to the consumers. The distribution network includes medium-voltage power lines, substations and pole-mounted distribution transformers, open and close switches, low-voltage distribution wiring and measuring meters. Distribution circuits are fed from a transformer located in an electrical substation, where the voltage is reduced from the high values used for power transmission. A radial distribution network leaves the station and passes through the network area with no normal connection to any other supply. In this paper, identification of the ideal spots to place the capacitors in the radial distribution network and the kVAr rating (Size) of those capacitors is done. This is done to reduce the Annual cost incurred due to I2R loss in the system and for installing capacitor bank. This project aims to achieve the same by gaining the advantage of applying one of the Artificial Intelligence techniques called genetic algorithm based on real coding and binary coding. The effectiveness of this proposed method was tested on an IEEE 34-bus test utility system and the results were compared with the available literatures. Keywords: 34 Bus RDS, Genetic Algorithm, Binary and Real Encoding, Radial Distribution System (RDS), Reactive Power, Real Power Losses, Voltage Magnitude Nomenclature V� = Voltage magnitude of the jth bus P� = Real power injection at the jth bus Q� = Reactive power injection at the jth bus δ� = Phase angle at the jth bus P��� = Real power accumulated Q��� = Reactive power accumulated P��(����) = Real power loss in the line connecting ith and jth bus NVB = Number of buses that violate the recommended voltage limits V� = Upper limit of the ith load bus V� = Voltage magnitude of bus i V��� = Minimum Voltage Limit V��� = Maximum Voltage Limit P� = Real power load demand in the bus i Q� = Reactive power load demand in the bus i R�� = Resistance in the line connecting the ith and jth bus VDI = Voltage Deviation Index
1. Introduction Until recently many researchers have shown interest in reducing the losses in radial distribution system by optimal capacitor placement and sizing. They tried several different load flow methods and A.I techniques over the years. Their findings and suggestions are reviewed here: [1]Sneha Sultana, Provas Kumar Roy presented a teaching learning based optimization (TLBO) approach to minimize power loss and energy cost by optimal placement of capacitors in radial distribution systems. Teaching learning based optimization (TLBO) is a new variant of meta-heuristic optimization technique inspired by the natural phenomenon of teaching and learning process. In this optimization technique, a group of students in a class is considered as a population
and the solution vector of the objective is analogous to the grade point of different subjects offered to the students. The result of a student is analogous to fitness function in other population-based techniques, to represent the quality of each solution set. TLBO is based on the concept of teaching–learning process in a class.To check the feasibility, the proposed method was applied on standard 22, 69, 85 and 141 bus radial distribution systems. The authors compared the performance of their proposed TLBO technique with other methods like GA, PSO, Fuzzy GA and DSA. The comparison results confirmed the effectiveness and the superiority of their proposed TLBO approach over the other A.I techniques.[4]S.P. Singh, A.R. Rao presented a particle swarm optimization (PSO) approach for finding the optimal size and location of capacitors .Their proposed technique found optimal locations for shunt capacitors from the daily load curve. In addition, it determined the suitable values of fixed and switched capacitors. Particle swarm optimization (PSO) is an evolutionary technique developed from researches on swarm such as fish schooling and bird flocking. This method is capable of handling continuous state variables easily and search a solution space effectively. A dynamic sensitivity analysis method was used to select the candidate installation locations of the capacitors to reduce the search space of this problem. A simple iterative method is used to compute the power flow. To check the feasibility, the proposed method was applied on 70-bus and 135-bus systems. The authors then compared with their solutions with those obtained by Tabu Search (TS), Hybrid and Genetic Algorithms. The results obtained after comparison demonstrated that their proposed PSO approach offered the global optimal solution with greater saving.[11]R. Srinivasas Rao, S.V.L. Narasimham, M. Ramalingaraju presented a new and efficient approach for capacitor placement in radial distribution systems that determine the optimal locations and size of capacitor with an objective of improving the voltage
Paper ID: J2013368 17 of 23

International Journal of Scientific Engineering and Research (IJSER) www.ijser.in
ISSN (Online): 2347-3878 Volume 2 Issue 9, September 2014
Licensed Under Creative Commons Attribution CC BY
profile and reduction of the power losses. The Plant Growth Simulation Algorithm is based on the plant growth process, where a plant grows a trunk from its root; some branches will grow from the nodes on the trunk; and then some new branches will grow from the nodes on the branches. Such process is repeated, until a plant is formed. Based on an analogy with the plant growth process, an algorithm can be specified where the system to be optimized first ‘‘grows’’ beginning at the root of a plant and then ‘‘grows’’ branches continually until the optimal solution is found. To check the feasibility, the proposed method was applied on 10, 34, and 85-bus radial distribution systems. The solutions obtained by the proposed method were compared with other heuristic and PSO methods. The comparison proved that the proposed method placed capacitors at less number of locations with optimum size and offered much net annual saving in initial investment.[15]D. Das presented a genetic algorithm (GA) based fuzzy multi-objective approach for determining the optimum values of fixed and switched shunt capacitors to improve the voltage profile and maximize the net savings in a radial distribution system. The two objectives, i.e. maximization of net savings and minimization of the nodes voltage deviation were first fuzzified and, then, dealt with by integrating them into a fuzzy satisfaction objective function through appropriate weighting factors. The optimization technique of the Fuzzy GA was then adopted to solve the fuzzy multi-objective problem for obtaining the optimum values of shunt capacitors. The simulation on a medium size distribution network has proved the feasibility of the proposed approach and the obtained results are quite good and they encourage the implementation of the proposed strategy on a large size distribution network. 2. Load Flow To meet the present emerging domestic, industrial and commercial load day by day, effective forecasting of the RDS is essential. To ensure the effective planning with load transferring, the load flow study of RDS becomes utmost significant. Load flow analysis is concerned with describing the operating state of an entire power system. Newton Raphson and Fast decoupled load flow solution techniques are used to solve well- behaved power system. However these are in general unsuitable for solving load flow for RDS because of their low X/R ratios of branches. A section of RDS has a sending end bus (ith bus) and receiving end bus (jth bus). The line in connection with these two sections has impedance (Z = r + jx). The power flow through this line can be in both directions. The power flow at the sending end bus(S� = P� + jQ�)is different from the power flow at the receiving end bus�S� = P� + jQ��. A load flow algorithm [13] solves the power balance equations at all buses and finds the corresponding voltage solution. At load buses, the load flow algorithm will solve for the bus voltage magnitude and phase angle. The known parameters at a load bus are the received real and reactive powers. Hence a load flow must solve for the bus voltage magnitude in (1) and phase angle, (2).
V�� = − �rP� + xQ� − ��
�
�� + ��rP� + xQ� − ��
�
��
�− [r� + x�]�P�
� + Q��� (1)
δ� = δ� − sin�� ��������
�����(2)
If the voltage magnitude and phase angle values are to be computed for the receiving end bus, the only variables needed are the receiving end bus real and reactive power values, the sending end bus voltage magnitude and phase angle value, and the value of the line impedance connecting the two buses. All the values needed for the load bus calculations are easily attainable in practice. 2.1 Load Flow Algorithmic steps Step 1 : Read System data structure.Q�,���� = ∑ Q��(����)
����
Step 2 : Goto Slack bus. Step 3 : Initialize P��� = 0 and Q��� = 0 Step 4 : Calculate P and Q for all buses Step 5 : CalculateV� and δ�for all buses using equations (1)
and (2) Step 6 : DetermineP���� and Q����for all lines Step 7 : Update P��� and Q���using the formula
P��� = P���� + P� ; Q��� = Q���� + Q� Step 8 : Goto Next bus and reprise the step from 4 to 8 up
until Last bus is reached. Step 9 : Check for convergence, (3) and print the result, else
goto step 2. 2.1.1 Convergence Criteria In this Load Flow, it is checked whether the sum of powers flowing out of the lines connected to each bus equals (or equals within a tolerable limit) the net power injected into that bus. Mathematically, convergence criteria for the presented load flow is given in (3)
(PG� − PD�) − �� �V�V�Y��cos�δ� − δ� − θ�����
� ≤ ε
(QG� − QD�) − �∑ �V�V�Y��sin�δ� − δ� − θ����� � ≤ ε (3) 3. Mathematical Problem Statement 3.1 Total Real and Reactive power loss The real & reactive power loss in the line connecting ith and jth bus is given by,
p��(����) =[��]��[��]�
[��]� ∗ R�� (4)
Q��(����) =[��]��[��]�
[��]� ∗ X�� (5)
The Total real& reactive power loss of RDS having ‘n’ buses and ‘n-1’ branches is given by, P�,���� = ∑ P��(����)
����
(6) Q�,���� = ∑ Q��(����)
���� (7)
Paper ID: J2013368 18 of 23

International Journal of Scientific Engineering and Research (IJSER) www.ijser.in
ISSN (Online): 2347-3878 Volume 2 Issue 9, September 2014
Licensed Under Creative Commons Attribution CC BY
3.2 Voltage Deviation Index (VDI) The Voltage Deviation Index is calculated using the formula,
VDI = �∑ (������)�������
� (8)
To enumerate the degree of violation of limits imposed on voltages at buses in a RDS, VDI is well-defined where NVB is the number of buses that violate the recommended voltage limits and VL is the upper limit of the ith load bus. In the course of reconfiguration, if the state of the system has voltage limit violations, the anticipated solution must try and lessen the index VDI. When a branch is switched on and another is switched out in a loop, the solution space is no longer continuous. The variable that defines the status of a branch as to whether it is switched in/out adopts discrete states of zero or one. Owing to the discontinuous and discrete nature of the problem, classical techniques are rendered inappropriate and the practice of global search techniques is essential. 3.3Objective function for network reconfiguration in RDS The objective is to minimize the I2R losses in RDS and thereby the voltage profile of the system is enhanced. This is attained by finding out the best set of branches to be switched out such that the subsequent RDS experiences least I2R loss and has the best voltage profile. The mathematical model of the problem can be expressed by the following expression.
Minimize f =∑ P��(����)���� + �∑ (������)����
����
(9) Subject to,
V��� ≤ |V�| ≤ V��� The first term in the (9) represents the total I2R loss in the system and the second term denotes voltage deviation index (VDI). 4. Genetic Algorithm 4.1 Introduction Genetic algorithms are a part of evolutionary computing, which is a rapidly growing area of artificial intelligence. 1.1.1 Chromosome All living organisms consist of cells. In each cell there is the same set of chromosomes. Chromosomes are strings of DNA and serves as a model for the whole organism. A chromosome consists of genes, blocks of DNA. Complete set of genetic material (all chromosomes) is called genome. Particular set of genes in genome is called genotype. The genotype is with later development after birth base for the organism's phenotype, its physical and mental characteristics, such as eye colour, intelligence etc.
4.1.2 Reproduction During reproduction, first occurs recombination (or crossover). Genes from parents form in some way the whole new chromosome. The new created offspring can then be mutated. Mutation means, that the elements of DNA are a bit changed. This changes are mainly caused by errors in copying genes from parents. The fitnessof an organism is measured by success of the organism in its life. 4.1.3 Search Space The space of all feasible solutions is called search space (also state space). Each point in the search space represents one feasible solution. Each feasible solution can be "marked" by its value or fitness for the problem. 4.2 Outline of Steps Involved In GA 1. [Start] Generate random population of n chromosomes
(suitable solutions for the problem) 2. [Fitness] Evaluate the fitness f(x) of each chromosome x
in the population 3. [New population] Create a new population by repeating
following steps until the new population is complete 1. [Selection] Select two parent chromosomes from a
population according to their fitness (the better fitness, the bigger chance to be selected)
2. [Crossover] With a crossover probability cross over the parents to form a new offspring (children). If no crossover was performed, offspring is an exact copy of parents.
3. [Mutation] With a mutation probability mutate new offspring at each locus (position in chromosome).
4. [Accepting] Place new offspring in a new population 4. [Replace] Use new generated population for a further run
of algorithm 5. [Test] If the end condition is satisfied, stop, and return
the best solution in current population 6. [Loop] Go to step 2 4.3 Selection 4.3.1 Roulette Wheel Selection Parents are selected according to their fitness. The better the chromosomes are, the more chances to be selected they have. Imagine a roulette wheel where are placed all chromosomes in the population, everything has its place big accordingly to its fitness function, like on the following picture. 4.3.2 Rank Selection The previous selection will have problems when the fitness differs very much. For example, if the best chromosome fitness is 90% of all the roulette wheel then the other chromosomes will have very few chances to be selected. Rank selection first ranks the population and then every chromosome receives fitness from this ranking. The worst will have fitness 1, second worst 2 etc. and the best will have fitness N (number of chromosomes in population). After this all the chromosomes have a chance to be selected. But this
Paper ID: J2013368 19 of 23

International Journal of Scientific Engineering and Research (IJSER) www.ijser.in
ISSN (Online): 2347-3878 Volume 2 Issue 9, September 2014
Licensed Under Creative Commons Attribution CC BY
method can lead to slower convergence, because the best chromosomes do not differ so much from other ones. 4.4 Encoding 4.4.1 Binary Encoding Binary encoding is the most common, mainly because first works about GA used this type of encoding. In binary encoding every chromosome is a string of bits, 0 or 1.
Chromosome A 101100101100101011100101 Chromosome B 111111100000110000011111
4.4.2 Real Encoding Direct value encoding can be used in problems, where some complicated values, such as real numbers, are used. Use of binary encoding for this type of problems would be very difficult. In real encoding, every chromosome is a string of some values. Values can be anything connected to problem, form numbers, real numbers or chars to some complicated objects.
Chromosome A 1.2324 5.3243 0.4556 2.3293 2.4545 Chromosome B ABDJEIFJDHDIERJFDLDFLFEGT
4.5 Crossover and Mutation 4.5.1 Binary Encoding 4.5.1.1 Crossover Single point crossover - one crossover point is selected, binary string from beginning of chromosome to the crossover point is copied from one parent, and the rest is copied from the second parent 11001011+11011111 = 11001111 Two point crossover - two crossover point are selected, binary string from beginning of chromosome to the first crossover point is copied from one parent, the part from the first to the second crossover point is copied from the second parent and the rest is copied from the first parent 11001011 + 11011111 = 11011111 Uniform crossover - bits are randomly copied from the first or from the second parent 11001011 + 11011101 = 11011111 Arithmetic crossover - some arithmetic operation is performed to make a new offspring 11001011 + 11011111 = 11001001 (AND) 4.5.1.2 Mutation Bit inversion - selected bits are inverted 11001001 => 10001001
4.5.2 Real Encoding 4.5.2.1 Crossover All crossovers from binary encoding can be used 4.5.2.2 Mutation Adding a small number (for real value encoding) - to selected values is added (or subtracted) a small number (1.29 5.68 2.864.11 5.55) => (1.29 5.68 2.734.22 5.55) 5. Test System 5.1. 34 Bus Test System The test system consists of 34 Bus, 33 Lines as shown in Fig 1. The first bus is considered as the substation bus. Loads are connected to all buses except the first bus which is the substation bus. The total real power load and reactive power load of this test system are 5051.5 kW and 3055kVAr respectively. The substation voltage is 12.66 kV.
Figure 1: Line diagram of 34 bus RDS
6. Result Analysis Before Capacitor Placement The base case load flow was implemented on a 34 bus radial distribution system. The bus system has a substation which acts as the slack bus and 33 load buses. The main feeder consists of 12 buses starting from bus 1 till bus 12. The total connected real power load is 5051.5 kW and the total connected reactive power load is 3055 kVAr. The total connected real power load to the main feeder is 1871.5 kW and the total connected reactive power load to the main feeder is 1120.5 kVAr. The total connected real power load to the laterals is 3180 kW and that of the reactive power load is
Paper ID: J2013368 20 of 23
International Journal
Licensed Under Creative Commons Attribution CC BY
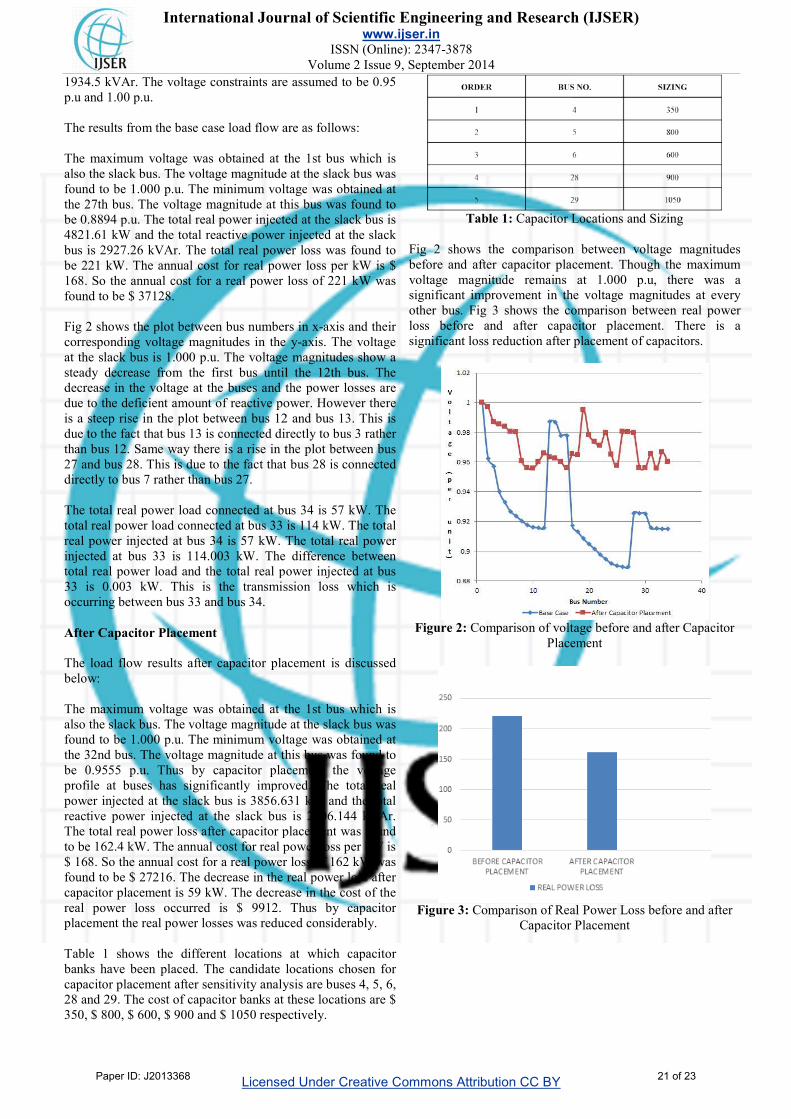
1934.5 kVAr. The voltage constraints arep.u and 1.00 p.u. The results from the base case load flow are The maximum voltage was obtained at thealso the slack bus. The voltage magnitudefound to be 1.000 p.u. The minimum voltagethe 27th bus. The voltage magnitude at thisbe 0.8894 p.u. The total real power injected4821.61 kW and the total reactive power bus is 2927.26 kVAr. The total real powerbe 221 kW. The annual cost for real power168. So the annual cost for a real power found to be $ 37128. Fig 2 shows the plot between bus numberscorresponding voltage magnitudes in the at the slack bus is 1.000 p.u. The voltagesteady decrease from the first bus untildecrease in the voltage at the buses and thedue to the deficient amount of reactive power.is a steep rise in the plot between bus 12due to the fact that bus 13 is connected directlythan bus 12. Same way there is a rise in the27 and bus 28. This is due to the fact thatdirectly to bus 7 rather than bus 27. The total real power load connected at bustotal real power load connected at bus 33 real power injected at bus 34 is 57 kW. Theinjected at bus 33 is 114.003 kW. The total real power load and the total real power33 is 0.003 kW. This is the transmissionoccurring between bus 33 and bus 34. After Capacitor Placement The load flow results after capacitor placementbelow: The maximum voltage was obtained at thealso the slack bus. The voltage magnitudefound to be 1.000 p.u. The minimum voltagethe 32nd bus. The voltage magnitude at thisbe 0.9555 p.u. Thus by capacitor placementprofile at buses has significantly improved.power injected at the slack bus is 3856.631reactive power injected at the slack busThe total real power loss after capacitor placementto be 162.4 kW. The annual cost for real power$ 168. So the annual cost for a real powerfound to be $ 27216. The decrease in the capacitor placement is 59 kW. The decreasereal power loss occurred is $ 9912. placement the real power losses was reduced Table 1 shows the different locations banks have been placed. The candidate locationscapacitor placement after sensitivity analysis28 and 29. The cost of capacitor banks at 350, $ 800, $ 600, $ 900 and $ 1050 respectively.
Journal of Scientific Engineering and Researchwww.ijser.in
ISSN (Online): 2347-3878 Volume 2 Issue 9, September 2014
Licensed Under Creative Commons Attribution CC BY
are assumed to be 0.95
are as follows:
the 1st bus which is magnitude at the slack bus was
voltage was obtained at this bus was found to
injected at the slack bus is injected at the slack
power loss was found to power loss per kW is $
loss of 221 kW was
numbers in x-axis and their y-axis. The voltage
voltage magnitudes show a until the 12th bus. The
the power losses are power. However there 12 and bus 13. This is directly to bus 3 rather
the plot between bus that bus 28 is connected
bus 34 is 57 kW. The is 114 kW. The total The total real power difference between
power injected at bus transmission loss which is
placement is discussed
the 1st bus which is magnitude at the slack bus was
voltage was obtained at this bus was found to
placement the voltage improved. The total real
3856.631 kW and the total bus is 2406.144 kVAr.
placement was found power loss per kW is
power loss of 162 kW was real power loss after
decrease in the cost of the Thus by capacitor
reduced considerably.
at which capacitor locations chosen for
analysis are buses 4, 5, 6, these locations are $
respectively.
Table 1: Capacitor Locations Fig 2 shows the comparisonbefore and after capacitor placement.voltage magnitude remains significant improvement in theother bus. Fig 3 shows the comparisonloss before and after capacitorsignificant loss reduction after
Figure 2: Comparison of voltagePlacement
Figure 3: Comparison of RealCapacitor
Research (IJSER)
Locations and Sizing
comparison between voltage magnitudes placement. Though the maximum
at 1.000 p.u, there was a the voltage magnitudes at every comparison between real power
capacitor placement. There is a placement of capacitors.
voltage before and after Capacitor
Placement
Real Power Loss before and after
Placement
Paper ID: J2013368 21 of 23

International Journal of Scientific Engineering and Research (IJSER) www.ijser.in
ISSN (Online): 2347-3878 Volume 2 Issue 9, September 2014
Licensed Under Creative Commons Attribution CC BY
Table 2: Comparison with other methods
Items Un-
Compensated
Compensated
Su CT, Tsal CCA
“fuzzy reasonin
g approach” IEE
Proceedings 1996
Prakash, Sydulu
m, “PSO Approach” IEEE Proceedings 2007
R.Srinivasa Rao “PSGA method” ELSEIVER 2011
Proposed
Total Losses(kW
) 221 168.47 168.8 161.7 162
Loss Reduction - 23.999 24.85 27, 377 26.696
Total kVAr = ∑A
2700 2063 2039 3700
Total Annual Cost($)
37128 33182 29936 28484 28095
Net Savings($/y
ear) = Annual
Cost
- 4089 7306 8756 9912
% Savings - 10.89 19.61 23.51 26.61
7. Conclusion Overall kVA demand was reduced at each bus due to capacitor placement. The overall real power loss was reduced by optimal placement of capacitor and sizing in the 34 bus radial distribution network using Genetic Algorithm with Binary and Real Encoding. The effectiveness and superiority of our method was compared with methods used by other authors. Compared to the Fuzzy GA method [26] or PSO method [16] the losses occurred in our method is very less and almost the same as that to PGSA method [11]. The annual cost per year is the least compared to the other methods and the net savings is the highest compared to other methods. The comparison results confirmed the effectiveness and the superiority of our proposed method over other techniques. Thus our objective was achieved in this project. References [1] Sneha Sultana, Provas Kumar Roy “Optimal capacitor
placement in radial distribution systems using teaching learning based optimization”. Science Direct Elseiver Control Engineering Practice Volume 54, January 2014.
[2] José Federico Vizcaino González, Christiano Lyra, "A pseudo-polynomial algorithm for optimal capacitor placement on electric power distribution networks" Science Direct Elseiver Electrical Power and Energy Systems Volume 222, Issue 1, 1 October 2012.
[3] Zilaila Zakaria, Siti Mariam MohdShokri "A Direct Approach Used for Solving the Distribution System and Harmonic Load Flow Solutions" Science Direct Elseiver Electrical Power and Energy Systems 43 (2012) 1267-1275 dated 20 June 2012.
[4] S.P. Singh, A.R. Rao, “Optimal allocation of capacitors in distribution systems using PSO method”. Science Direct
Elseiver Electrical Power and Energy Systems 43 (2012) 1267-1275 dated 20 July 2012.
[5] PooyaRezaei, Mehdi Vakilian, "Discussion of ‘‘Optimal reconfiguration and capacitor allocation in radial distribution systems for energy losses minimization’’ Science Direct Elseiver Control Engineering Practice 13 (2005) 1545–1552 dated 20th June 2012.
[6] G. Carpinelli, C. Noce, D. Proto, A. Russoc,, P. Varilone, "Single-objective probabilistic optimal allocation of capacitors in unbalanced distribution systems" IEEE Transactions on Power Systems dated 18th February 2012.
[7] Rao RV, Savsani VJ, Vakharia DP, " Teaching–learning-based optimization: an optimization method for continuous non-linear large scale problems". Inform Sci 2012;183(1):1–15.
[8] Gary Chang, Shou-Yung Chua, "An efficient power flow algorithm for weakly meshed distribution systems" Science Direct ELSEVIER, dated June 2011.
[9] S.M. Kannan, P. Renuga, S. Kalyani, E.Muthukumaran, “Optimal capacitor placement and sizing using Fuzzy-DE and Fuzzy-MAPSO methods” Science Direct ELSEVIER, dated 30 May 2011.
[10] H. Mohkami, R. Hooshmand, A. Khodabakhshian "Fuzzy optimal placement of capacitors in the presence of nonlinear loads in unbalanced distribution networks using BF-PSO algorithm" Science Direct Elseiver Control Engineering Practice dated 4th March 2011.
[11] R. Srinivasas Rao, S.V.L. Narasimham, M. Ramalingaraju “Optimal capacitor placement in a radial distribution system using Plant Growth Simulation Algorithm”. Science Direct Elseiver Electrical Power and Energy Systems 33 (2011) 1133–1139 dates 2nd March 2011.
[12] S.K. Bhattacharya, S.K. Goswami, "New fuzzy based solution of the capacitor placement problem in radial distribution system" Science Direct Elseiver Electrical Power and Energy Systems dated March 2009
[13] Silvio Segura, Rubén Romero, Marcos J. Rider, "Efficient heuristic algorithm used for optimal capacitor placement in distribution systems" Science Direct Elseiver Electrical Power and Energy Systems volume 32,7th June 2009.
[14] Huang TL, Hsiao YT, Chang CH, Jiang JA, "Optimal placement of capacitors in distribution systems using an immune multi-objective algorithm". Int J Elect Power Energy Syst 2008; 30(3):184–92.
[15] D. Das, “Optimal placement of capacitors in radial distribution systems using Fuzzy-GA method”. Science Direct Elseiver Electrical Power and Energy Systems 30 (2008) 361–367 dated 27 August 2007.
[16] Prakash K, Sydulu M. "Particle swarm optimization based capacitor placement on radial distribution systems" IEEE power engineering society general meeting; 2007. p. 1–5.
[17] B.M. Zhang, W.C. Wu, “A loop-flow-based method for capacitor optimization in distribution systems”. Science Direct Elseiver Electrical Power and Energy Systems April 2005.
[18] Shyh-Jier Huang, Member, IEEE, “An Immune-Based Optimization Method to Capacitor Placement in a Radial Distribution System”. IEEE Transactions on Power Delivery, Vol. 15, No. 2, April 2000.
[19] E.Bompard, E.Carpaneto, “Convergence of the backward/forward sweep method for the load-flow analysis of radial distribution systems” Science Direct Elseiver Electrical Power and Energy Systems dated April 2000
[20] G. W. Chang "A Simplified Forward and Backward Sweep Approach for Distribution System Load Flow Analysis" International Conference on Power System Technology
[21] Yann-Chang Huang Hong-Tzer Yang, Ching-Lien Huang, “Solving the Capacitor Placement Problem in a Radial Distribution System Using Tabu Search Approach" IEEE Transactions on Power Systems dated 1st August 1996.
Paper ID: J2013368 22 of 23
International Journal of Scientific Engineering and Research (IJSER) www.ijser.in
ISSN (Online): 2347-3878 Volume 2 Issue 9, September 2014
Licensed Under Creative Commons Attribution CC BY
[22] Sundhararajan S, Pahwa A, "Optimal selection of capacitors for radial distribution systems using a genetic algorithm" IEEE Transactions on Power Systems dated May 1994.
[23] Mesut E. Baran, Felix F. Wu, "Optimal Capacitor Placement on Radial Distribution Systems" IEEE Transactions on Power Delivery, Vol. 4, No. 1, January 1989.
[24] M.H. Haque, "Capacitor placement in radial distribution systems for loss reduction" IEE Proceedings online no. 19990495 dated 23rd April 1999.
[25] Chis M, Salama MMA, Jayaram S. "Capacitor placement in distribution system using heuristic search strategies" IEEProc-Gener Transm Distrib 1997 144(3):225–30.
[26] Su CT, Tsai CC. "A new fuzzy reasoning approach to optimum capacitor allocation for primary distribution systems". In Proceeding of the IEEE on industrial technology conference; 1996.
[27] M.P.Selvan, K.S.Swarup, “Distribution System Load Flow using Object-Oriented Methodology” International Conference on Power System Technology dated 1994
[28] Shiv Kumar Mishra “A Simple Algorithm for Unbalanced Radial Distribution System Load Flow” In Proceeding of the IEEE on industrial technology conference;1994
[29] A. Augugliaro, L. Dusonchet, S. Favuzza "Backward solution of PV nodes in radial distribution networks” IEE Proc-GenerTransmDistrib 1994
Author Profile
Sathya Siva Chandan. G received his B.E. degree in Electrical and Electronics Engineering from Anna University, Chennai.His interests include Transmission and Distribution, Protection and Switchgear and Power Systems Engineering.
Paper ID: J2013368 23 of 23


![Research Article Optimal Location, Sizing, and …downloads.hindawi.com/journals/jre/2015/832917.pdfJournal of Renewable Energy a radial distribution network in [] . e objective function](https://img.dokumen.tips/doc/110x75/5ab4fdac7f8b9ab47e8c68aa/research-article-optimal-location-sizing-and-of-renewable-energy-a-radial.jpg)