Embed Size (px)
Citation preview

Optimal Model Complexity in Geological Carbon Sequestration: A Design of Experiment (DoE) &
Response Surface (RS) Uncertainty Analysis
Project Number: DE-FE-0009238
Mingkan Zhang1, Ye Zhang1, Peter Lichtner2
1.Dept. of Geology & Geophysics, University of Wyoming, Laramie, Wyoming2.OFM Research, Inc., Santa Fe, New Mexico
U.S. Department of EnergyNational Energy Technology Laboratory
Carbon Storage R&D Project Review MeetingDeveloping the Technologies and
Infrastructure for CCSAugust 12-14, 2014

Presentation Outline• Project goals and benefits;
• Detailed project objectives & success criteria;
• Accomplishments to date;
• Summary of results;
• Appendix (organization chart; Gantt chart; supplemental results).
2

Benefit to the Program Major goals:Support industry’s ability to predict CO2 storage capacity in geologic formations to within ±30% accuracy;
Develop and validate technologies to ensure 99% storage permanence.
Project benefits:Facilitate the development and implementation of efficient workflows for modeling field-scale GCS in a variety of geochemically reactive environments, where formations exhibit multiple scales of permeability (k) heterogeneity.
3
Project Overview: Goals and Objectives
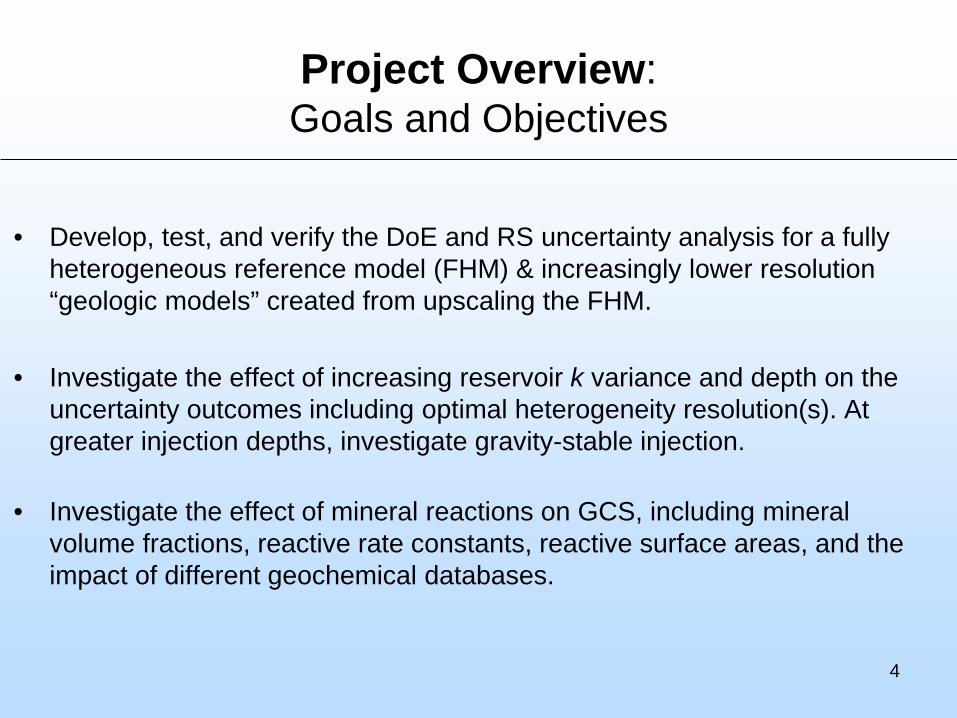
• Develop, test, and verify the DoE and RS uncertainty analysis for a fully heterogeneous reference model (FHM) & increasingly lower resolution “geologic models” created from upscaling the FHM.
• Investigate the effect of increasing reservoir k variance and depth on the uncertainty outcomes including optimal heterogeneity resolution(s). At greater injection depths, investigate gravity-stable injection.
• Investigate the effect of mineral reactions on GCS, including mineral volume fractions, reactive rate constants, reactive surface areas, and the impact of different geochemical databases.
4

Project Overview: Success Criteria
• At increasing depth, for both weakly and strongly heterogeneous systems, the geologic models can capture the FHM CO2 behaviors within the full parameter space; Reduced characterization cost;
• RS analytical models are successfully verified against full-physics reservoir simulations via HPC, thus prediction uncertainty of any outcome at any time can be assessed using the low-resolution model(s) running the efficient RS models. Enhanced computation efficiency;
• Mineral storage analysis: seeking the most efficient composition for reactive storage Enhanced storage;
• Greater injection depth: within the uncertainty analysis framework, identify the combination(s) of favorable parameters & reservoir condition that give rise to gravity-stable flow. Enhanced storage security.
5

Accomplishments to Date• High-resolution reservoir k heterogeneity (3.2 M grid cells)
& geologic models of decreasing k resolutions;
• Permeability upscaling & single-phase flow verification;
• CO2 modeling with PFLOTRAN & performance scaling on the petascale Yellowstone supercomputer at NWSC;
• Model comparison & DoE/RS analysis;
• CO2 modeling considering mineral reactions.6

Sediment Experiment at SAFL
http://www.safl.umn.edu/Project Leader: Prof. Chris PaolaFounding: NSF & oil industry consortium 7

Reservoir Heterogeneity Vs Geologic Models
FHM 8-unit facies model 3-unit facies model
A 1-unit homogeneous “formation” model is also created (not shown);
8

Upscaling Verification
9
Carbon Sequestration Modeling with Reactions
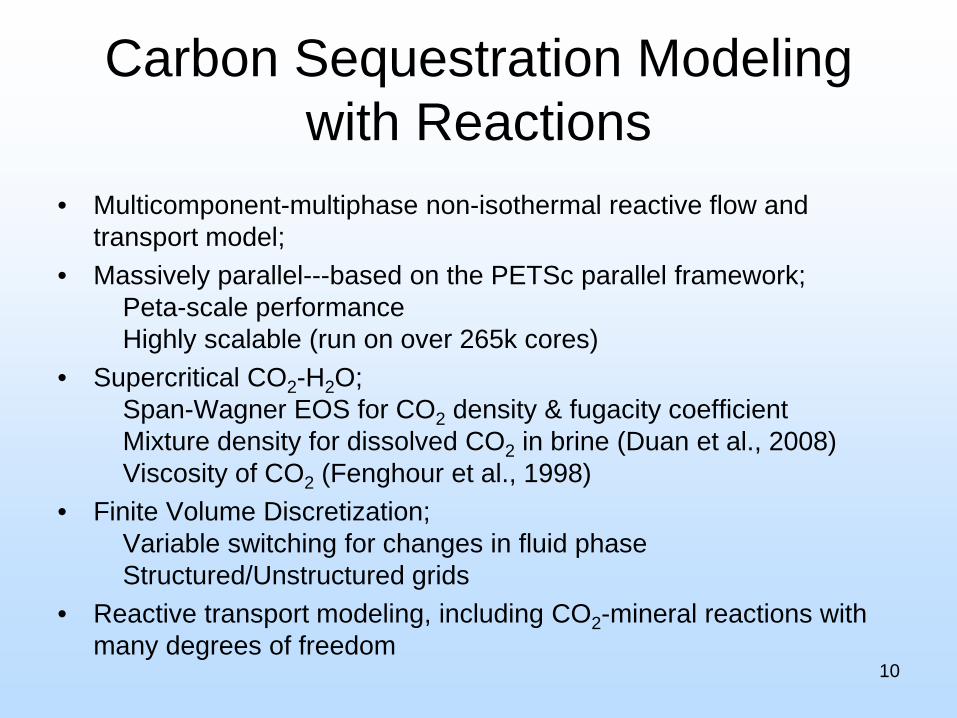
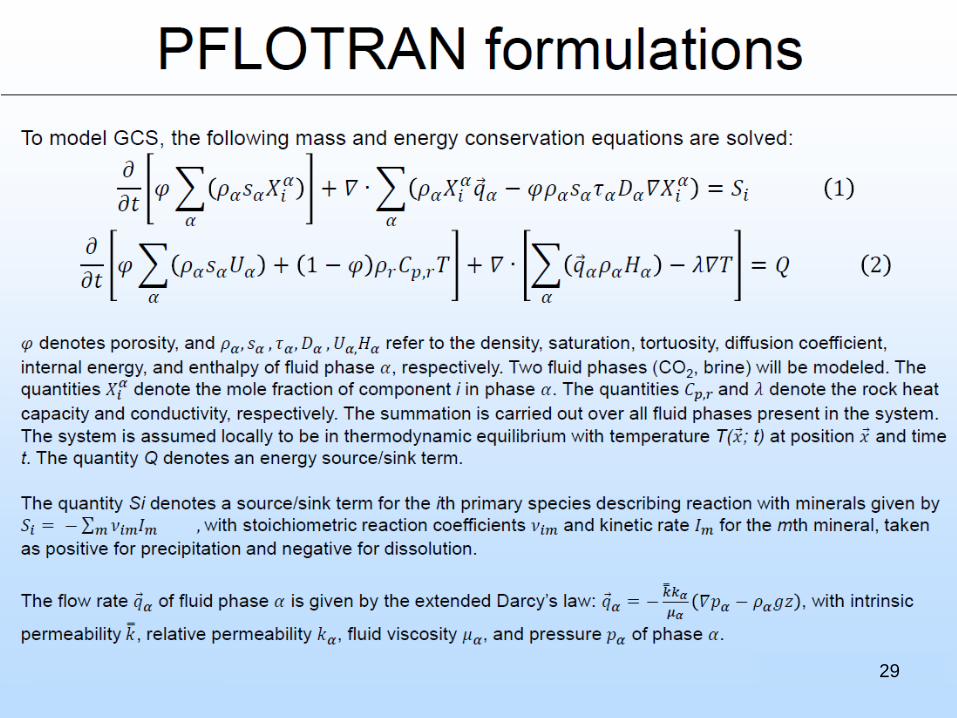
• Multicomponent-multiphase non-isothermal reactive flow and transport model;
• Massively parallel---based on the PETSc parallel framework;Peta-scale performanceHighly scalable (run on over 265k cores)
• Supercritical CO2-H2O;Span-Wagner EOS for CO2 density & fugacity coefficientMixture density for dissolved CO2 in brine (Duan et al., 2008)Viscosity of CO2 (Fenghour et al., 1998)
• Finite Volume Discretization;Variable switching for changes in fluid phaseStructured/Unstructured grids
• Reactive transport modeling, including CO2-mineral reactions with many degrees of freedom
10

PFLOTRAN Scaling on Yellowstone Yellowstone is a 1.5-petaflops supercomputer with 72,288 processor cores & 144.6 TB of memory. http://www2.cisl.ucar.edu/resources/yellowstone
1-unit model (3.2M):* 20 yr CO2 injection + 2000 yr monitoring* 2048 cores: 9 hours
1-unit model (25 M): CO2 injection w/ reactive chemistry
11

Dissolved CO2
• Under both low and high variance conditions, the 1-unit model can reasonably capture the plume footprint of the FHM.
• Base on results of the upscaling study, the 8-unit and 3-unit models (simulations are ongoing) should yield more accurate dissolved CO2 predictions than the 1-unit model.
Time = 2K years (inj rate= 1kg/s; injection time = 20 years):
12
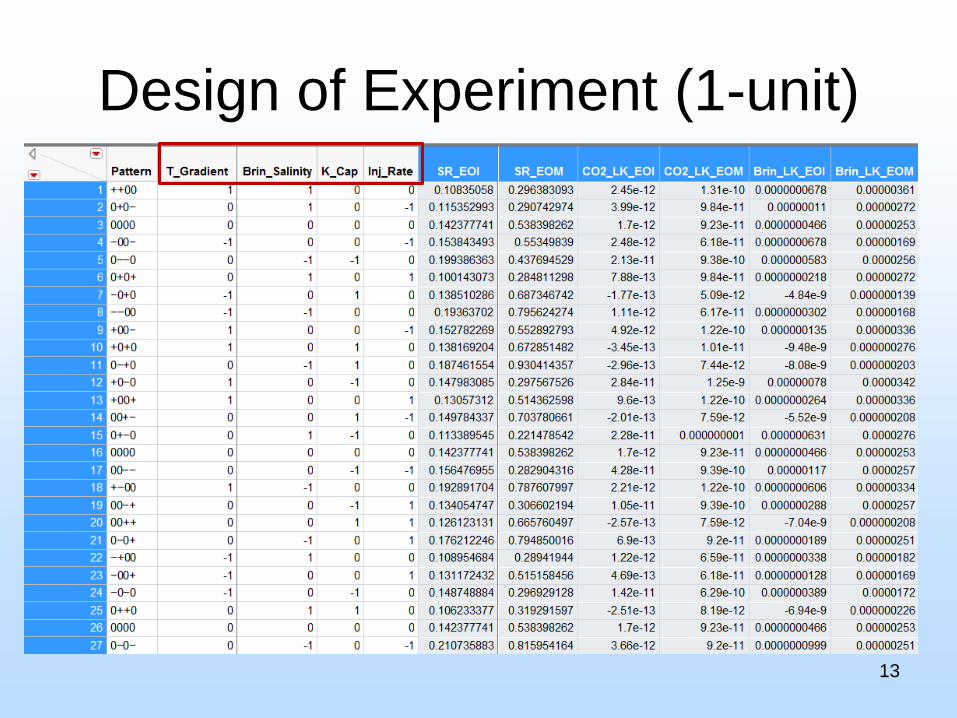
Design of Experiment (1-unit)
13

Parameter Ranking (1-unit) Outcome: dissolved CO2 at End of Monitoring
14

Mineral ListMineral Formula Init VF (%)Quartz SiO2 43.04213Calcite CaCO3 4.21872K-Feldspar KAlSi3O8 15.77216Kaolinite Al2Si2O5(OH)4 0Albite NaAlSi3O8 0Plagioclase (Na0.75,Ca0.25)(Al1.25,Si2.75)O8 4.06691Illite K0.6(Mg0.25, Al1.8)(Al0.5, Si3.5)O10(OH)2 4.01098Hematite Fe2O3 1.598Dawsonite NaAlCO3(OH)2 0Chlorite (Mg2.5, Fe2.5, Al)(Al, Si3)O10(OH)8 7.191Siderite FeCO3 0Ankerite Ca(Mg1.3, Fe0.7)(CO3)2 0Magnesite MgCO3 0Na-Smectite Na0.290(Mg0.26, Al1.74)(Al0.03, Si3.97)O10(OH)2 0Ca-Smectite Ca0.145(Mg0.26, Al1.74)(Al0.03, Si3.97)O10(OH)2 0Dolomite (CaMg)(CO3)2 0
15
CO2 Simulation: Mineral Trapping• Chlorite can provide cations such as Mg2+ and Fe2+,
which are essential chemical components for forming carbonate precipitates.
• The reactions between cations and CO2 forms carbonate minerals (e.g., siderite, magnesite and ankerite) to trap CO2 as precipitates.
16
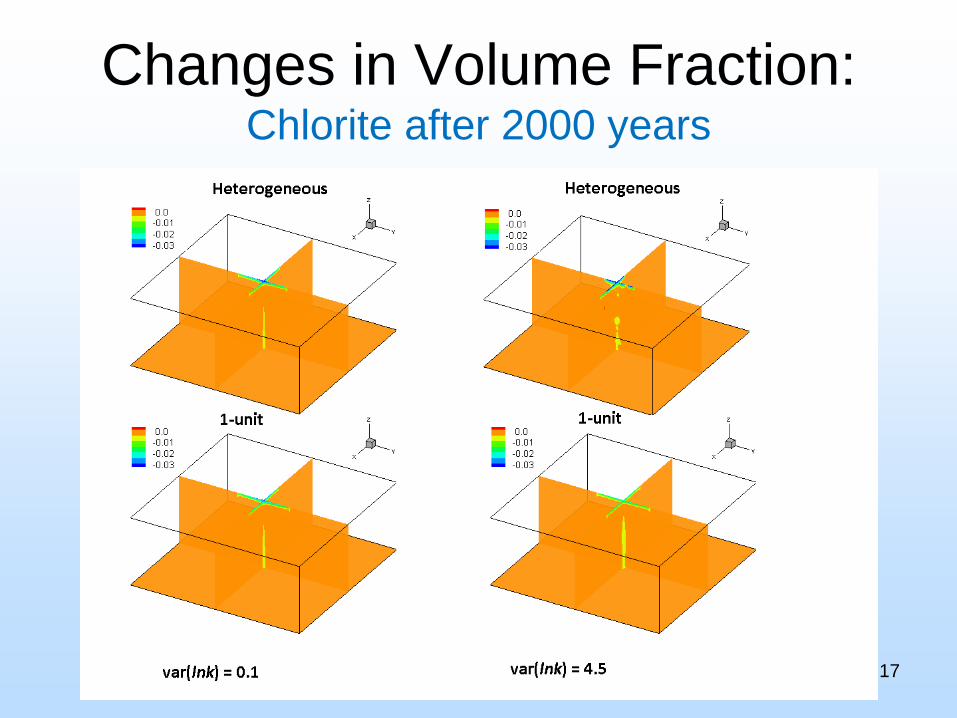
Changes in Volume Fraction: Chlorite after 2000 years
17
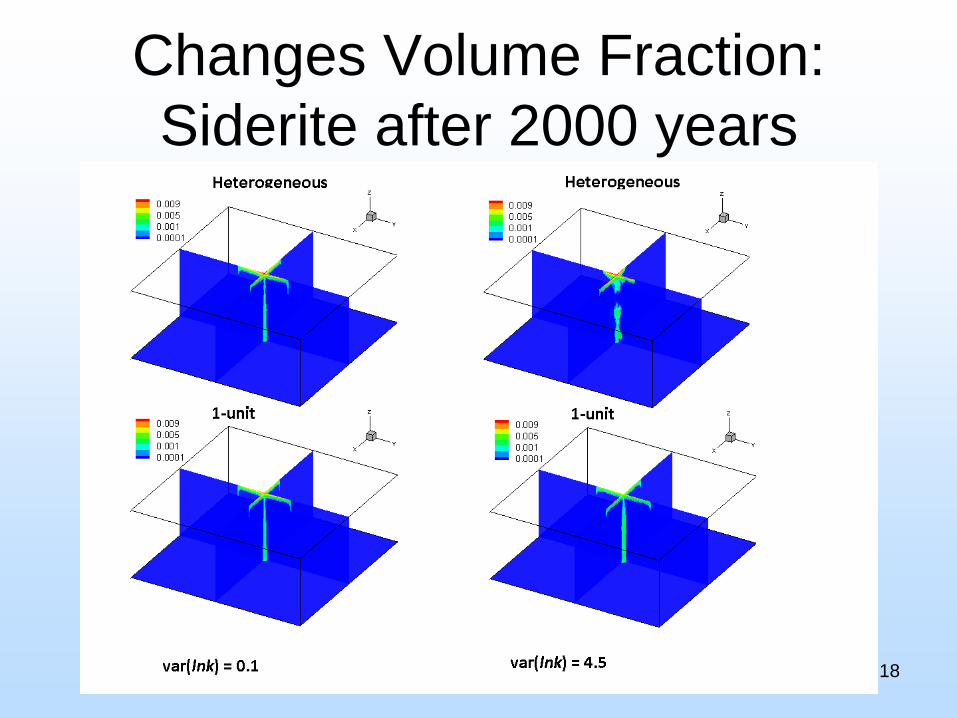
Changes Volume Fraction: Siderite after 2000 years
18
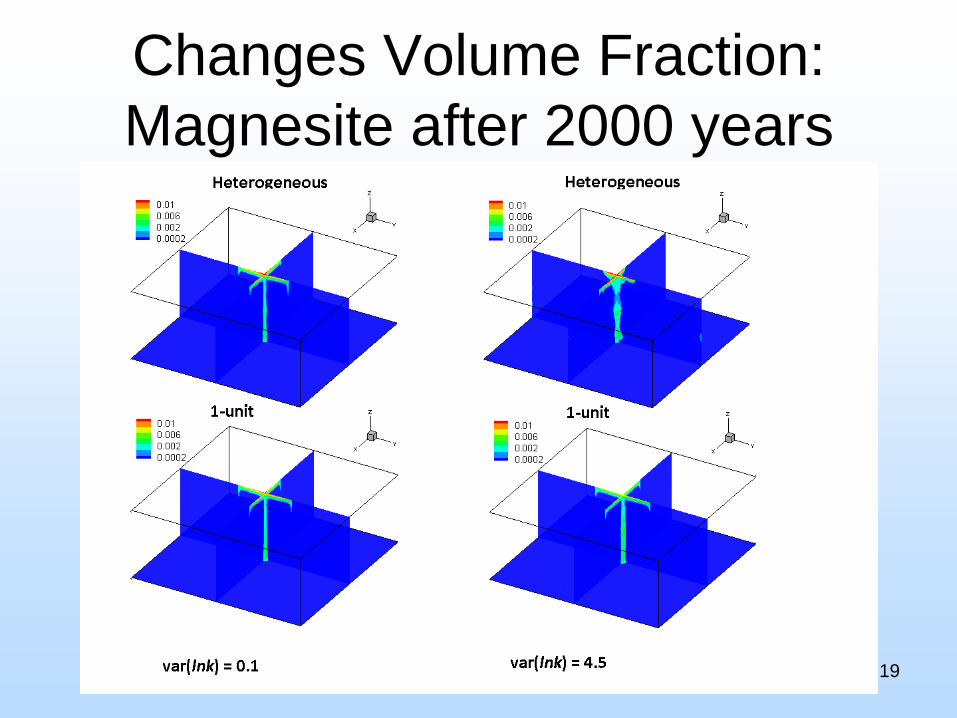
Changes Volume Fraction: Magnesite after 2000 years
19

Changes Volume Fraction: without Chlorite after 2000 years
20

Summary• Global upscaling computes equivalent ks for the geologic models with decreasing k
resolution; for increasing reservoir ln(k) variances (0.1, 1.0, 4.5), FHM pressure and flow rate are captured well by the geologic models, but errors increase with variance.
• When the variance of ln(k) is low, the 1-unit model yields similar dissolution fingering as the FHM. When the variance of ln(k) is high, the 1-unit predicts more dissolution fingering per unit time (more optimistic dissolution storage estimate).
• Experimental design analysis suggests that brine salinity is the single most influential factor impacting CO2 dissolution storage.
• Reactions between cations and CO2 forms carbonate mineral precipitates (i.e., Siderite and Magnesite), leading to mineral storage. But, high degree of uncertainty exists in its prediction.
• Next step: For low and high variance systems, complete the DoE and RS analysis for all models with reactions to compare their parameter sensitivity & prediction uncertainty.
21

Appendix– These slides will not be discussed during the
presentation, but are mandatory
22

Organization Chart
US DOE:ProgramManager
Project Coordinator:
Ye Zhang
WRPC Director:Davona
Douglass
Authorized UW Representative: Dorothy Yates
Sedimentary Model Interprestation: Mingkan Zhang
PFLOTRAN & Reactive Transport
Modeling: Peter Lichtner
GCS Uncertainty Analysis: Mingkan
Zhang
23

Gantt Chart
24

FHM v. 1-Unit Model: σ2lnk=0.1
t (year)
p(×
107
Pa)
100 101 102 1032.187
2.188
2.189
2.19
2.191
1unitFHM
[2510, 2510, 205]
t (year)
p(×
107
Pa)
100 101 102 1031.954
1.96
1.966
1.972
1unitFHM
Dept. of Geology & Geophysics, University of Wyoming
[2510, 2510, 445]
t (year)
p(×
107
Pa)
100 101 102 1032.0918
2.0919
2.092
2.0921
2.09221unitFHM
[2510, 2510, 305]
t (year)
p(×
107
Pa)
100 101 102 1032.004
2.008
2.012
2.016
1unitFHM
[2510, 2510, 395]
relative error = 0.2%
25

An example 1-Unit model run for CO2 storage modeling simulated on the Yellowstone supercomputer. The problem domain is 7000 m x 7000 m x 250 m. Shown at 100 years for an isosurface of 0.0125 (mole fraction) of dissolved CO2. CO2 is injected at a depth of 50 m below the top at the center of the xy-domain for 20 years. The grid is 160 x 160 x 25 =0.64 million cells.
26

FHM v. 1-Unit Model: σ2lnk=4.5
t (year)
p(×
107
Pa)
100 101 102 1032.188
2.189
2.19
1unitFHM
t (year)
p(×
107
Pa)
100 101 102 1032.004
2.008
2.012
2.016
1unitFHM
relative error =0.5%
t (year)
p(×
1 07
Pa)
100 101 102 1032.0918
2.0919
2.092
2.0921
2.09221unitFHM
t (year)
p(×
107
Pa)
100 101 102 1031.954
1.96
1.966
1.972
1.978 1unitFHM
[2510, 2510, 205]
[2510, 2510, 445]
[2510, 2510, 305]
[2510, 2510, 395]
Dept. of Geology & Geophysics, University of Wyoming
27

PFLOTRAN Scaling on Yellowstone
28
29