Embed Size (px)
Citation preview

Calhoun: The NPS Institutional Archive
Theses and Dissertations Thesis Collection
2002-06
Optimal deadrise hull analysis and design space
study of naval special warfare high speed planing boats
Whalen, Todd E.
Monterey, California. Naval Postgraduate School
http://hdl.handle.net/10945/3105

... I
Optimal Deadrise Hull Analysis and Design Space Study of Naval Special Warfare High Speed Planing Boats
by
Todd E. Whalen
B.S. Mechanical Engineering, University of Virginia, 1995
Submitted to the Departments of Ocean Engineering and Civil and Environmental Engineering in partial fulfillment of the requirements for the degrees of
Master of Science in Naval Architecture and Marine Engineering and
Master of Science in Civil and Environmental Engineering
at the Massachusetts Institute of Technology
June 2002 W3T4!BUT!ON STATEMENTA Approved for Public Release 0 2002 Todd E. Whalen
All rights reserved Distribution Unlimited
The author hereby grants MIT permission to reproduce and to distribute publicly paper and electronic copies of this
..................... Author .............
Certified by ..................................................................................... J. Kim Vandiver
Professor of Ocean Engineering
Certified by ................................ .........................
Accepted by ................................
Graduate Studies
Accepted by ............................... .................................. Henrik Schmidt
or of Ocean Engineering ttee on Graduate Studies
20020822 008

Optimal Deadrise Hull Analysis and Design Space Study of
Naval Special Warfare High Speed Planing Boats
by Todd E. Whalen
Submitted to the Departments of Ocean Engineering and
Civil and Environmental Engineering
on May 10,2002, in partial fulfillment of the
requirements for the degrees of
Master of Science in Naval Architecture and Marine Engineering
and
Master of Science in Civil and Environmental Engineering
Abstract
United States Navy SEALS (Sea, Air, Land) frequently employ high speed planing boats (HSPBs) in the performance of their missions. Operation of these vessels in normal and adverse conditions exposes personnel to severe mechanical shock. Anecdotal evidence and recent medical studies conducted by the Naval Health Research Center show a correlation between HSPB operation and chronic and acute personnel injury. Most current research focuses on short-term solutions that reduce shock at the hull-deck and deck-seat interfaces (deck padding and suspension seats, for example). The object of this thesis is to develop an Optimal Deadrise Hull (ODH) that reduces mechanical shock where it first enters the boat, at the hull-sea interface. Planing boat hydrodynamics were reviewed and the mechanical shock environment was evaluated. The ODH analysis is performed on the MkV Special Operations Craft in order to determine the effects of hull deadrise on vertical acceleration. Finally, the results of the ODH analysis are used to perform a design space study of planing hulls in order to optimize the overall design for vertical acceleration based on hull deadrise, cruise speed, and payload weight.
Thesis Supervisor: J. Kim Vandiver Title: Professor of Ocean Engineering
Thesis Reader: E. Kausel Title: Professor of Civil and Environmental Engineering
2

Acknowledgements
First and foremost, I would like to thank my wife, Isabel, and son, Edward, for
keeping me sane during these two years and putting up with my monopoly of the home
computer. I love you both and I am lost without you. As Edward would say, I am “all
fin!”
This thesis would not have been possible without the help of Mr. Richard Akers
of Ship Motion Associates. His company donated a copy of its software for use on my
project and he took time out of his busy schedule to visit MIT for a much needed
information session. To his credit, he never screened his answering machine during any
of my repeated calls for help. Professors Kim Vandiver and Eduardo Kausel provided
invaluable guidance in the realm of mechanical shock and allowed me to concentrate on
my areas of interest. Dr. Cliff Whitcomb coordinated the barrage of email during my
topic search and patiently answered all of my questions regarding Response Surface
Methods.
3

Contents
................................................................................................................................ Abstract 2 Acknowledgements .............................................................................................................. 3 Contents ............................................................................................................................... 4 List of Figures ...................................................................................................................... 5
1 Introduction ....................................................................................................................... 7 1 1 Motivation .................................................................................................................. 7 1.2 Background ................................................................................................................ 8
2 The Mechanical Shock Environment .............................................................................. 14 2.1 Hydrodynamics of the Hull-Sea Interface ................................................................ 14
2.1 . 1 Planing Hull Resistance Summary ..................................................................... 14 2.1.2 Wave Slamming ................................................................................................. 17 2.1.3 Vertical Hull Water Entry .................................................................................. 17
2.2 Effects of Mechanical Shock .................................................................................... 18 2.3 Shock Mitigation Concepts ...................................................................................... 22
2.3.1 Hull-Sea Interface .............................................................................................. 23 2.3.2 Deck-Hull Interface ............................................................................................ 26 2.3.3 Seat-Deck Interface ............................................................................................ 27
3 Optimal Deadrise Hull Analysis ..................................................................................... 28 3.1 Design Tool Description .......................................................................................... 28 3.2 Design Methodology ................................................................................................ 30 3.3 Design Results .......................................................................................................... 33
4 Design Space Study ........................................................................................................ 36 4.1 Response Surface Methods ...................................................................................... 36 4.2 Design Space Creation ............................................................................................. 40 4.3 Design Space Analysis ............................................................................................. 42
List of Tables ....................................................................................................................... 6
.
4.3.1 Average Heave Acceleration Response Model .................................................. 42 4.3.2 1/3 Highest Heave Acceleration Response ........................................................ 45 4.3.3 Design Space Case Studies ................................................................................ 47
5 Conclusions ..................................................................................................................... 52 5.1 Optimal Deadrise Hull Analysis ............................................................................... 52 5.2 Design Space Study .................................................................................................. 53 5.3 Recommendations for Future Work ......................................................................... 53
Appendix A ........................................................................................................................ 55 Appendix B ........................................................................................................................ 60 References .......................................................................................................................... 64
4

List of Figures
Figure 1 . MkV Special Operations Craft ............................................................................. 9
Figure 4 . Ship Motion Coordinate Reference [5] .............................................................. 14 Figure 5 . Lift Fraction vs . Froude Number [ 1 13 ................................................................ 15 Figure 6 . Free Body Diagram of a Planing Hull [16] ........................................................ 16
Figure 8 . Effect of Fatigue on Bone and Cartilage Failure [ 191 ........................................ 20
Figure 11 . High Speed Hull Forms [l 11 ............................................................................ 23
Figure 2 . Injuries vs . Time in SBUs [ 141 ........................................................................... 12 Figure 3 . Hospitalization Rates [ 141 .................................................................................. 12
Figure 7 . Typical HSPB Shock Event [13] ........................................................................ 18
Figur.e 9 . Injury and Discomfort Limits for Repeated Shocks [ 191 ................................... 21 Figure 10 . Design Methods for Shock Mitigation [ 131 ..................................................... 22
Figure 12 . Very Slender Vessel [4] ................................................................................... 24 Figure 13 . H-STEP [13] ..................................................................................................... 25 Figure 14 . LocalFlex [14] .................................................................................................. 26 Figure 15 . Impacting Wedges [ 13 ..................................................................................... 28 Figure 16 . MkV SOC Design Model ................................................................................. 30
Figure 18 . Box-Behnken Design ....................................................................................... 39 Figure 19 . Central Composite Design ............................................................................... 40 Figure 20 . Average Heave Acceleration Response Model Leverage Plot ......................... 43 Figure 2 1 . 1/3 Highest Heave Acceleration Response Model Leverage Plot .................... 46 Figure 22 . Case 1 Heave Acceleration vs . Cruise Speed and Payload .............................. 48 Figure 23 . Case 1 Heave Acceleration Contour Profile .................................................... 49 Figure 24 . Case 2 Contour Profile (15 klbs Payload) ........................................................ 50 Figure 25 . Case 2 Contour Profile (30 klbs Payload) ........................................................ 51
Figure 17 . Percent Change From Baseline ........................................................................ 34
5

List of Tables
Table 1 . MkV SOC Principal Characteristics ...................................................................... 9
Table 3 . NHRC Survey Injury Locations [ 141 ................................................................... 11
Table 5 . MkV SOC Model Principal Characteristics ........................................................ 30 Table 6 . Input for Rough Water Simulation ...................................................................... 31 Table 7 . Resistance and Coxswain Heave Acceleration Results ...................................... 33 Table 8 . Vertical Acceleration Factor Levels .................................................................... 41 Table 9 . Central Composite Design Summary .................................................................. 42 Table 10 . Average Heave Acceleration Response Model Analysis of Variance ............... 44 Table 1 1 . Average Heave Acceleration Response Model Coefficients ............................. 45 Table 12 . 1/3 Highest Heave Acceleration Response Model Analysis of Variance .......... 46 Table 13 . 1 /3 Highest Heave Acceleration Response Model Coefficients ........................ 46
Table 2 . NHRC Survey Participant Characteristics [ 141 ................................................... 1 0
Table 4 . Summary of Short-Duration Acceleration Loads [ 191 ........................................ 19
6

Chapter I
Introduction
I .I Motivation
United States Special Forces are comprised of elite combat units from all
branches of the US military. In particular, the Naval Special Warfare (NSW) community
plays a significant role in projecting national presence and maintaining security around
the globe. Navy SEALs (Sea, Air, Land) are tasked with special operations supporting
the US Navy and US Special Operations Command (USSOCOM). They provide a broad
capacity for special warfare in many environments, ranging from the blue oceans to
shores and rivers throughout the world. Typical missions include direct action, special
reconnaissance, combating terrorism, counter-drug operations, personnel recovery, and
hydrographic reconnaissance [2]. Their mission effectiveness is the result of arduous
mental and physical training and depends upon the health of every SEAL and the proper
operation of their equipment.
Unlike other military forces, SEALs are maritime Special Forces; they strike from
and return to the sea. Special Boat Units (SBUs), one of the major components of the
NS W community, are tasked with patrolling the littoral environment and inserting,
supporting, and extracting SEALs [2]. High speed planing boats (HSPBs) are routinely
used in the performance of these missions, which can occur in both calm water and rough
sea states. Operation of these boats subjects both crew and passengers to repeated
mechanical shock events due to wave slamming and vertical hull water entry, leading to
personnel injury and equipment degradation. The consequences of this shock
environment are a reduction in mission effectiveness and the potential for injury to
personnel.
7

Currently, there is no system for shock mitigation on NSW boats. Although the
problem has been researched for many years, only minor solutions, such as deck padding,
have been incorporated into the boats. Research and development is ongoing in this area,
but the focus has shifted to short-term solutions in order to accommodate current
operating platforms. However, the most effective shock mitigation system will likely
result from a combination of various shock reduction technologies. Improvements in
performance by both personnel and equipment will not be realized unless shock reduction
methods are developed and implemented effectively. This project investigates a hull
geometry solution by determining the effects of hull deadrise on vertical acceleration.
Furthermore, a design space is developed in order to evaluate vertical acceleration with
respect to other design parameters and examine the combined affects of these factors on
shock.
1.2 Background
NSW forces employ many different types of small boats in the performance of
their missions. The boat most frequently used by the SBUs is the MkV Special
Operations Craft (MkV SOC). Other watercraft, such as the NS W Rigid-Hull Inflatable
Boat, River Patrol Boat, Combat Rubber Raiding Craft, and Light Patrol Boat are used by
the SBUs but were not evaluated for the purposes of this study. The newer MkV SOC
represents the latest in HSPB design and technology; the performance of this craft will
determine future designs.
The MkV SOC, shown in Figure 1, is used to carry SEALS into and out of low- to
medium-threat coastal environments, support coastal patrol, and interrupt enemy
activities. A MkV SOC detachment, which consists of two boats, ten crew, eight
maintenance crew, and all associated equipment, can be deployed anywhere in the world
within forty-eight hours via C-5 Galaxy cargo aircraft. The MkV SOC is the result of a
streamlined acquisition effort managed by USSOCOM that produced the first boat only
eighteen months after awarding the contract. The first boat was delivered in 1995, and a
total of twenty are currently operational [4].
8
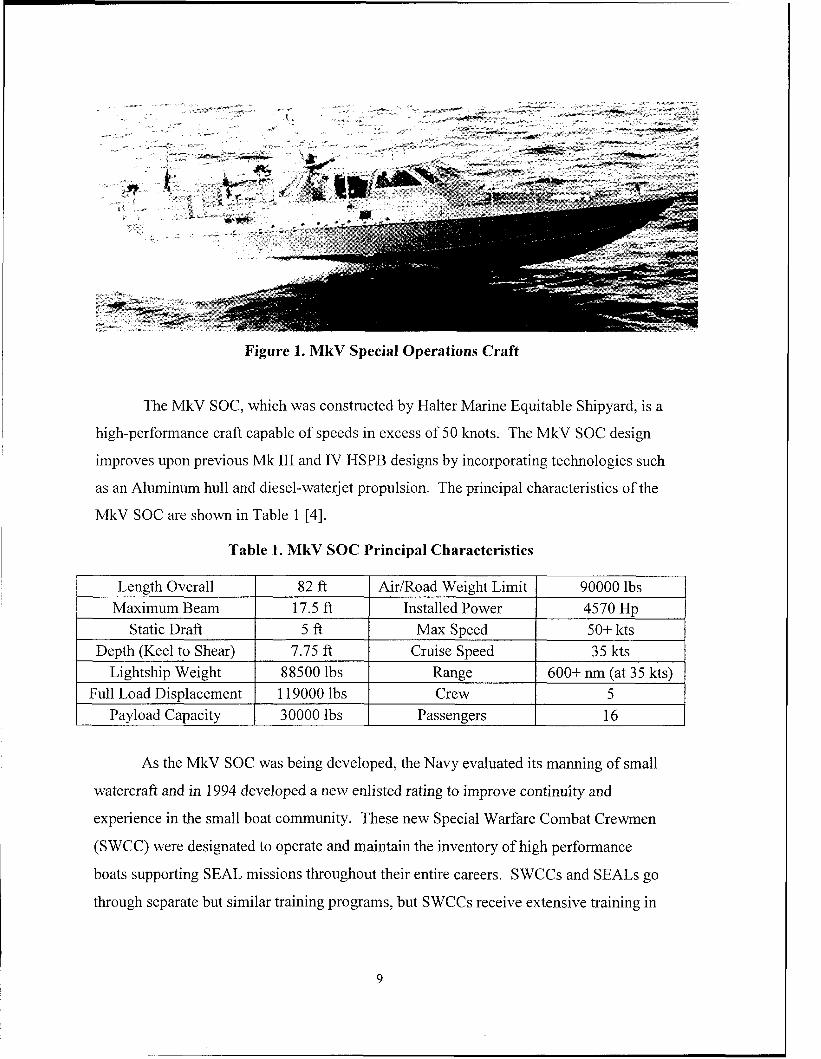
Figure 1. MkV Special Operations Craft
Length Overall Maximum Beam
The MkV SOC, which was constructed by Halter Marine Equitable Shipyard, is a
high-performance craft capable of speeds in excess of 50 knots. The MkV SOC design
improves upon previous Mk I11 and IV HSPB designs by incorporating technologies such
as an Aluminum hull and diesel-waterj et propulsion. The principal characteristics of the
MkV SOC are shown in Table 1 [4].
Table 1. MkV SOC Principal Characteristics
82 ft Air/Road Weight Limit 90000 lbs 17.5 ft Installed Power 4570 HD
Static Draft Depth (Keel to Shear)
Lightship Weight
Payload Capacity Full Load Displacement
5f t Max Speed 50+ kts 7.75 ft Cruise Speed 35 kts
88500 lbs Range 600+ nm (at 35 kts) 1 19000 lbs Crew 5 30000 lbs Passengers 16
As the MkV SOC was being developed, the Navy evaluated its manning of small
watercraft and in 1994 developed a new enlisted rating to improve continuity and
experience in the small boat community. These new Special Warfare Combat Crewmen
(SWCC) were designated to operate and maintain the inventory of high performance
boats supporting SEAL missions throughout their entire careers. SWCCs and SEALS go
through separate but similar training programs, but S WCCs receive extensive training in
9

craft and weapons tactics, techniques, and procedures. The SWCCs and the boats they
operate provide dedicated, rapid mobility in shallow areas where larger ships cannot
operate [2].
Unfortunately, the creation of the SWCC rating only exacerbated existing
problem of mechanical shock exposure within the small boat community. Commercial
and governmental groups were well aware of the potential for injury while operating
HSPBs in calm and rough water conditions, but such injuries were viewed as isolated
incidents and not part of a larger problem. Earlier efforts to mitigate injuries due to boat
operations were addressed by adjusting operational doctrine and training personnel.
Various research efforts studying the causes and possible solutions to mechanical shock
on HSPBs were being performed in the early 1990s, but an immediate need for shock
mitigating technology was not yet realized.
During the late 1990s, injury of personnel on HSPBs became a more significant
problem. Eventually, the Naval Health Research Center (NHRC) performed a study in
order to evaluate the severity of the problem. In 1998-99, NHRC personnel administered
surveys to 154 personnel from SBU-12, SBU-20, and SBU-22 to determine the
prevalence of injuries associated with HSPB operations. Mission logs were reviewed to
document new injuries resulting from specific boat operations, and all SWCCs were
asked to report circumstances, timing, and nature of past injuries [ 141. Table 2
summarizes the participant characteristics of the S WCCs surveyed.
Table 2. NHRC Survey Participant Characteristics [14]
Parameter Respondents
Age Stature (in) Weight (lb)
SBU 12 SBU 20 SBU 22 Total 83 43 28 154
32.2 k 6.1 33.3 f 4.7 29.5 k 6.02 32.0 f 5.9 70.6 f 2.8 70.5 f 2.8 71.4 f 2.4 70.7 f 2.7
186.1 k21.8 186.3 k 23.7 195.1 f22 .8 187.8 f 22.7 BMI (kg.m-’)
Years in Military 26.3 k 2.5 26.4 f 2.5 27.0 f 2.8 26.4 f 2.5 11.7 f 5.7 13.8 k 4.7 10.0 f 5.13 12.0f 5.5
10
YearsinSBU I 4.5 f 3.2 5.1 k2.7 4.7 f 2.9 4.7 f 3.0

The 154 respondents had 722 cumulative years of SBU exposure, and 100
respondents reported at least one injury. Most of the injuries were strains or sprains of
muscles and joints, but fractures, dislocations, arthritis, and chronic pain were also
reported [ 141. Of particular note are the locations of the injuries, which are summarized
in Table 3.
Table 3. NHRC Survey Injury Locations [14]
Thigh Knee
Injury Location: Head 3
Neck/Umer Back 9
# of Injuries at Location:
2 32
Shoulder 21 Elbow 2 Wrist 1
Leg Ankle
Hand 1 Trunk 2
7 10
Lower Back 50 Hip/Buttocks 6
Foot Total
3 149
The majority of injuries occur in four locations: necklshoulder, lower back, knee, and
ankle regions. This data comes as no surprise, as these joints are particularly susceptible
to normal shock events. The effects of shock on the human body will be discussed in
Chapter 2.
Perhaps the most telling result of the survey is the correlation between injury and
time spent in SBUs, which is shown in Figure 2.
11

Reported Injury:
Figure 2. Injuries vs. Time in SBUs (141
As seen in Figure 2, the rate of injury among SWCCs is directly proportional to time
served in SBUs. In fact, by year ten, one hundred percent of SWCCs had an injury to
report. In order to validate the survey results, a comparison of hospitalization rates of
SWCCs to the Navy average was performed; Figure 3 summarizes the comparison.
2500
2000
1500
1000
500 n v
Navy SWCC by SWCC by Average yr in SBUs yr in svc.
Figure 3. Hospitalization Rates [14]
12

When compared to the Navy as a whole, the hospitalization rates for SWCCs is
significantly higher. Likewise, a SWCC attached to an SBU is more likely to be
hospitalized than a SWCC not in an SBU. The study concluded that SBU personnel are
at a greater than average risk for injury associated with SBU training and operations and
that the closed-loop career path (i.e. SWCC rating) dictates rapid intervention [14].
Naval research and development efforts in the shock mitigation field accelerated
as a result of the NHRC report. Rapid insertion of commercial technology is currently
taking place in the form of deck padding and suspension seat mechanisms, but long-term
solutions are required to maximize shock reduction potential. The Coastal Systems
Station (CSS) of the Naval Surface Warfare Center (NSWC) coordinates shock
mitigation research for the Office of Naval Research (ONR). This thesis project
addresses a long-term hull geometry solution desired by CSS and is part of a total ship
systems integration approach. By determining the effects of hull deadrise, cruise speed,
and payload weight on vertical acceleration, future designers can more effectively design
planing boats to meet NS W requirements and maximize mission effectiveness.
Chapter 2
The Mechanical Shock Environment
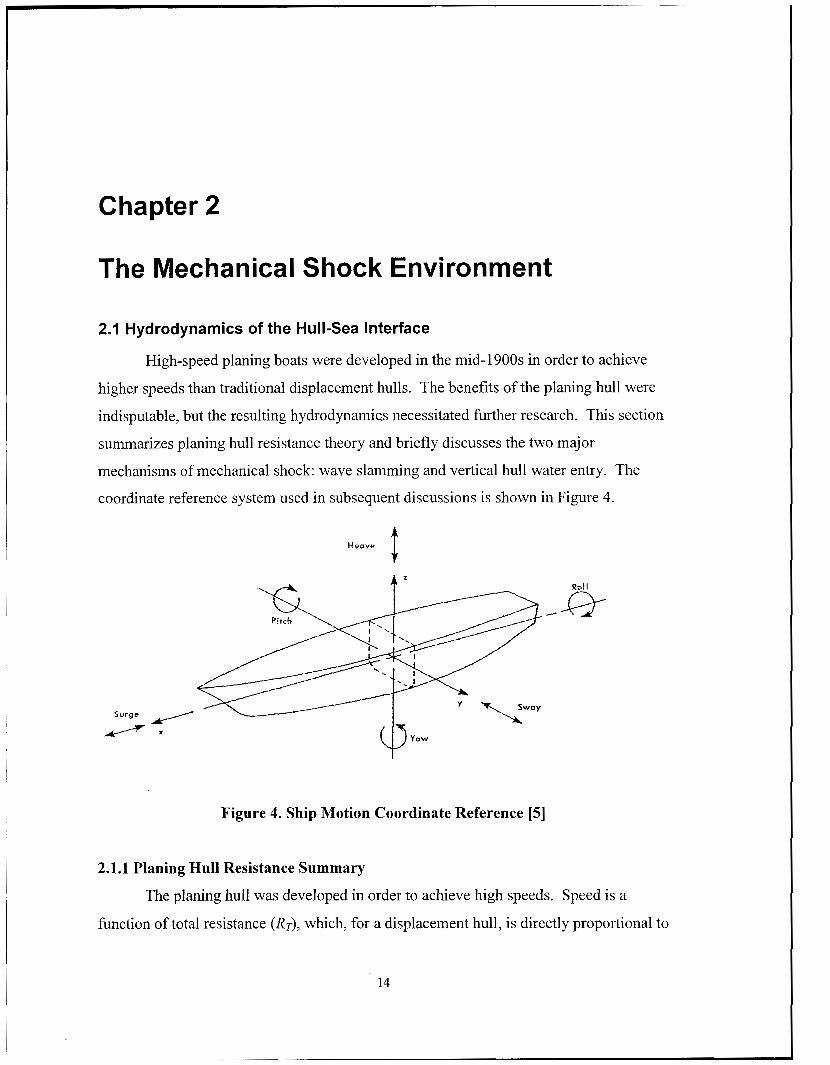
2.1 Hydrodynamics of the Hull-Sea Interface
High-speed planing boats were developed in the mid-1900s in order to achieve
higher speeds than traditional displacement hulls. The benefits of the planing hull were
indisputable, but the resulting hydrodynamics necessitated further research. This section
summarizes planing hull resistance theory and briefly discusses the two major
mechanisms of mechanical shock: wave slamming and vertical hull water entry. The
coordinate reference system used in subsequent discussions is shown in Figure 4.
# Heave
Surge
/
Pitch \-,
---- yl X
Figure 4. Ship Motion Coordinate Reference [5]
2.1.1 Planing Hull Resistance Summary
The planing hull was developed in order to achieve high speeds. Speed is a
function of total resistance ( R T ) , which, for a displacement hull, is directly proportional to
14

the total resistance coefficient (CT), water density @), wetted surface area (8, and the
square of velocity (0, as seen in Equation (1) [5].
1 R, =;C,pSV2
I ‘5
The only means by which a displacement hull can overcome large resistances to achieve
high speeds is to increase shaft horsepower. By significantly reducing wetted surface
area, the planing hull is able to achieve higher speeds than a monohull of comparable
size. The development of lighter, more powerful engines in the 1930s facilitated the
development of the planing hull [ 1 I].
While displacement hulls have longitudinal and transverse curvature, the planing
hull has a transverse deadrise section and straight buttock lines to induce early flow
separation. When a traditional displacement hull operates at high speeds, the negative
dynamic pressure induced on the convex hull surfaces causes a large trim by the stern,
increasing resistance. The planing hull is designed to develop positive dynamic pressure,
so the displacement decreases with increasing speed [l 11. Figure 5 shows the
relationship between lift fraction and speed for a typical planing hull.
l-----T-- - - - - - - p ~ TOTAL LIFT
HYDROSTATIC LIFT COMPONENT
__.
HYDRODYNAMIC LIFT COMPONENT
20 -
0.2 0.4 0.6 0.8 1 .o I .2 1.4 1.6 1 . 3
FROUDE NUMBER
Figure 5. Lift Fraction vs. Froude Number [ 111
The nondimensional Froude number, Fn, is given by Equation (2), where g is the
acceleration due to gravity and L is the length of the vessel.
15

V Fn =- a
The hydrodynamics of the planing hull result in a reduction of wetted surface area of up
to 60% and therefore enable much higher speeds [l 11.
[ 161 and [ 171 summarize the development of the planing hull and develop
formulas for lift and drag forces on a planing hull. [7] used [ 161 to develop a method to
predict the resistance of a planing hull. The free body diagram of a planing hull is shown
in Figure 6 [ 161. In this diagram, Wis the weight of the boat, T is the propeller thrust, Of
is the frictional drag, N is the component of resistance normal to the bottom, and z is the
trim angle of planing area.
.--
Figure 6. Free Body Diagram of a Planing Hull [16]
The total resistance, RT, of the planing hull can be predicted by Equation (3).
1 -pV2ilb2CFo 2 R, = W t a n z +
cos z cos p ( 3 )
In Equation (3), ,I is the mean wetted-length to beam ratio, b is the beam of planing area,
CFO is the ITTC friction coefficient, and p is the mid-chine deadrise [ 1 13. The goal of
this study is to vary p and analyze the subsequent vertical acceleration and craft
resistance. As will be seen in Chapter 3, a change i n p will cause the vessel to operate at
a new z, both of which affect resistance and vertical acceleration.
i I
I I
16
2.1.2 Wave Slamming
Wave slamming is a term used to describe the emergence of the bow of the ship
and subsequent impact of the ship's bottom on the surface of a wave. Slamming can
cause structural damage and induce transient vibratory stresses throughout the hull. For
planing craft operating at high speeds, slamming forces are due to the combined effects
of the vertical relative motion between the ship and the sea and the forward motion of the
boat through the waves [ 1 11. Historically, slamming forces have been modeled primarily
to determine ship structural requirements and not effects on personnel. The object of this
thesis is to create a hull to minimize heave accelerations due to slamming in order to
reduce the magnitude of the shock pulse entering the hull.
Slamming causes high impact pressures under the bow of the ship. Prediction of
these impact pressures is complex and inexact, but some theories have been proven
accurate by various drop-tests. [20], for example, developed expanding plate theory in
1929 in order to predict slamming behavior for seaplanes. Determination of slamming
forces on vessels is primarily an empirical endeavor. Qualitatively speaking, the
following factors influence slamming: relative vertical velocity at the bow entry point,
sectional shape, angle between the keel and wave slope at entry, area of impact, and
duration of impact [ l 11.
2.1.3 Vertical Hull Water Entry
Vertical water hull entry occurs when a HSPB fully leaves the surface of the
water and then re-enters the water at some angle relative to the sea. The dynamics of this
hull-sea interaction are not well known. The theory of vertical hull water entry is more
complex than wave slamming due to the unknown height the boat reaches and subsequent
re-entry angle. These two parameters largely determine the magnitude and duration of
the shock pulse that enters the hull. [22] analyzed vertical hull water entry and
empirically validated their prediction models. [ 121 developed the Water Entry Dynamics
and Injury Model (WEDIM) to model hull entry in order to predict shock forces on NSW
HSPBs. Research on the forces due to vertical hull water entry is ongoing. Chapter 3
will show how changes in hull deadrise affect the forces induced by vertical hull water
entry and slamming.
17

2.2 Effects of Mechanical Shock
Mechanical vibration has been studied for hundreds of years, normally for the
purposes of structural design. Mechanical vibration concerns oscillatory motion over a
period of time, and is normally described by frequency and amplitude. Vibration can be
free or forced, deterministic or random, and is normally periodic. Shock is generally
defined as an aspect of vibration where the excitation is nonperiodic and occurs suddenly
[19]. A typical shock event for a HSPB is shown in Figure 7.
a .o
5.0
AcceI'n
g's
0 .o
-1.0
Typical Rigid Hull y and Seat Wave Impact Time History - -
Time
Figure 7. Typical HSPB Shock Event [13]
The waveform shown in Figure 7 displays the peak acceleration, which is the greatest
positive or negative sample point that encountered for the shock event. Generally, the
duration of the shock event is 30-75 msec, depending on boat speed, sea state, etc. To
put these values into perspective, Table 4 shows the approximate duration and magnitude
of some common short-term acceleration loads.
18

Table 4. Summary of Short-Duration Acceleration Loads [19]
Type of Operation I Acceleration (g) I Duration (sec) Elevator
Average (fast service) 0.1-0.2 1-5 Emergency Deceleration 2.5 -
Automobile Comfortable Stop 0.25 5-8 Max. Obtainable 0.7 3
Crash 20-1 00 <o. 1 Aircraft
Ordinary Take-off 0.5 > l o
Crash Landing 20-1 00 - Catapult Take-off 2.5-6 1.5
Seat Ejection 10-15 0.25 Human (head)
Adult falling from 6 ft onto hard surface 250 0.007 Voluntarily tolerated impact with head protection 18-23 0.02
The study of the effects of vibration on humans is a relatively new field that has
developed largely as a result of numerous advances in human transportation. [ 191
presents a thorough description of research into the effects of shock and vibration on
humans. Only a short description of the effects of shock on humans will be discussed in
this section.
As the establishment of limits for human tolerance to mechanical vibration
requires potentially hazardous experimentation, humans are not used as test subjects.
Animals, dummies, or cadavers are frequently used to determine suitable vibration limits
for humans [ 191. The physiological differences in these test subjects must be accounted
for during the testing. Though such testing is clearly not exact, it is perhaps the most
accurate simulation currently possible. Significant data has been collected on human
body response testing over the years. Figure 8, for example, shows the effect of fatigue
on bone and cartilage failure.
19'

I I I I I 1 I . I
CYCLES TO FAlLURE (N} 1 10 102 103 104 105 108 107
Figure 8. Effect of Fatigue on Bone and Cartilage Failure [19]
The straight lines in Figure 8 represent the function
where the value of the index x is indicated in the figure. As the body is subjected to an
increasing number of stress events, the stress required for failure is reduced for both bone
and cartilage [ 191. This relationship is true for in vitro samples and does not account for
the regenerative effects of living bone tissue with regard to stress.
The concept of the Dynamic Response Index (DRI) was created in the 1970s to
quantify the potential for spinal injury due to large vertical accelerations. This DRI
research was further developed by the Air Standardization Coordinating Committee in
order to evaluate exposure to repeated shocks to the body. Figure 9 shows the
relationship between shock magnitude and number of shock events.
20

a- 18 - 1 U- % I - 12-
10-
%-
c- f4
4-
a-
1-
Figure 9. Injury and Discomfort Limits for Repeated Shocks 1191
In this case, DR is the maximum static acceleration (above normal gravity). The circles
represent exposures to which the risk of injury has been documented [19].
shock. Although limits for human exposure to shock have been developed, there is much
controversy surrounding the accuracy of these limits and the methodology used to
determine such limits. Numerous government and civilian organizations continue to
research these concepts in order to develop reliable human injury models. With regard to
boat design, the designer must find some way to produce a design that does not result in
excessive shock. Until specific limitations are developed for HSPB operators, designers
will adhere to the theory that the smaller the magnitude and duration of the shock pulse,
the better. While this may indeed be a true statement, it does not allow the designer
much flexibility. The next section briefly summarizes the concepts being explored
pertaining to shock mitigation of HSPBs.
In summary, there are documented risks associated with exposure to mechanical
I I I
.
I
21

2.3 Shock Mitigation Concepts
There has been much study in the field of mechanical shock reduction. The
automotive industry, for example, has nearly perfected the suspension system, which
used to create a smooth ride for passengers. Although a comparison of automotive and
HSPB operations seems obtuse, there are some interesting similarities between the two
systems. An automotive engineer must consider operating environment, vehicle size,
operator control, and cost, among other things, when designing a system to minimize
shock transmitted to passengers. Creating a successful system for a HSPB operating in
rough seas is a similar process. The causes of shock are known, but there are numerous
different mitigation systems with varying performance characteristics. The methods of
mitigating shock are generally classified as design or operational concepts. Operational
concepts, such as training and physical conditioning, are well known and currently in use.
This section summarizes the various design methods used to mitigate shock, which fall
into the three categories shown in Figure 10.
Seat-Dec k Interface: - Suspensionseats
- Cockpitlsolabbn -Restraint Systems - Coc!p# Sole Foam
Hull-Sea Interface: - Advance Hull Fomis - Optimrzed Deadrise Hull - Wariasle DeadriseHull Seaway -#-STEP -LocalFlex
Isolation f Components
Disturbance
Figure 10. Design Methods for Shock Mitigation [ 131
22

2.3.1 Hull-Sea Interface
The logical way to reduce the effects of mechanical shock on a boat and its
occupants is to reduce the magnitude and duration of the shock event. The effects of
weaker shock events may then be further reduced during transmission by using deck-hull
or seat-deck mitigation systems. Therefore, some form of hull-sea mitigation is required
to maximize reduction in shock. However, this is by far the most difficult, time-
consuming, and expensive solution. Previous research has demonstrated the reduction in
wave slamming forces realized in using a v-shaped hull. Current research in the hull-sea
interface area focuses on modification of existing hulls and development of new hull
geometries. The goal of this research is to reduce the vertical acceleration of the boat
upon impact with the sea, which reduces the shock force transmitted to the hull.
Hull Geometry Solutions
Research and development of advanced hull forms is a continuous process,
though not necessarily for the purposes of shock mitigation. Only recently have
alternative hull forms been considered for NSW boat designs. Due to the high speed
requirements of NSW watercraft, displacement hulls are poor candidates, as hull
resistance is much too high. Figure 11 shows the broad range of high-speed hull forms.
I HIGH SPEED CRAFT AND ADVANCED MARiNE VEHICLES f
ri I lA fR SUPPORTED CRAFT I
# t + t
RovM)-BoTsoM SMALL WATER PLANE AREA SUBMERGED c AIR- CVSHlON SURFACE EFFECTS VEHICLE
l A C V l
HULL 1 TWIN HULL FOILS (SWATH)
HARD-CHINE SURFACE- PIERCING (SESJ PLAtJfNG FOILS
Figure 11. High Speed Hull Forms [ll]
23

Hydrofoils and air cushion vessels (the PHM-1 Pegasus class ships and Landing Craft,
Air Cushion transporters, for example) have been used successfully in the past to achieve
high speeds and moderately smooth rides. However, current designs are range- and
payload-limited, making them inadequate platforms for SEALS. Multi-hull craft such as
S WATHs and catamarans may prove useful but require further development to meet
NSW requirements. The most promising hull form currently under consideration is the
Very Slender Vessel (VSV), which is shown in Figure 12.
Figure 12. Very Slender Vessel [4]
The VSV, which was developed in conjunction with Defense Advanced Research
Projects Agency (DAWA) and the Office of the Secretary of Defense (OSD) Technical
Support Working Group (TSWG), was designed as a wave-piercing hull [4]. As a result,
the wave slamming effects are reduced, and the vertical hull water entry effects are
entirely eliminated, since the boat remains in the water. Hull forms such as the VSV,
which is currently being tested, may prove to be viable platforms in the future.
Though advanced hull form research is promising, planing hulls are still the
platform of choice for high-speed craft. CSS directs several research efforts in
coordination with government and institutional organizations. In the late 1990s, CSS
collaborated with the University of Michigan to create the ODH concept. The existing
24
ZARN software code used for planing boats was modified to handle non-constant
longitudinal deadrise, later culminating in the creation of the POWERSEA software code.
A family of four simple deadrise variations was developed in order to predict the
corresponding resistance and accelerations of the variants. The study concluded that
slight changes in deadrise can significantly reduce bow and center of gravity (CG)
accelerations with no increase in hull resistance; a three degree increase in forebody
deadrise decreased vertical acceleration by twelve percent [ 131. This pilot study is the
extent of ODH research to date. In 1999, at-sea testing validated the POWERSEA
predictions. The goal of this thesis was to investigate the ODH concept further with the
use of POWERSEA.
Hull Modification Solutions
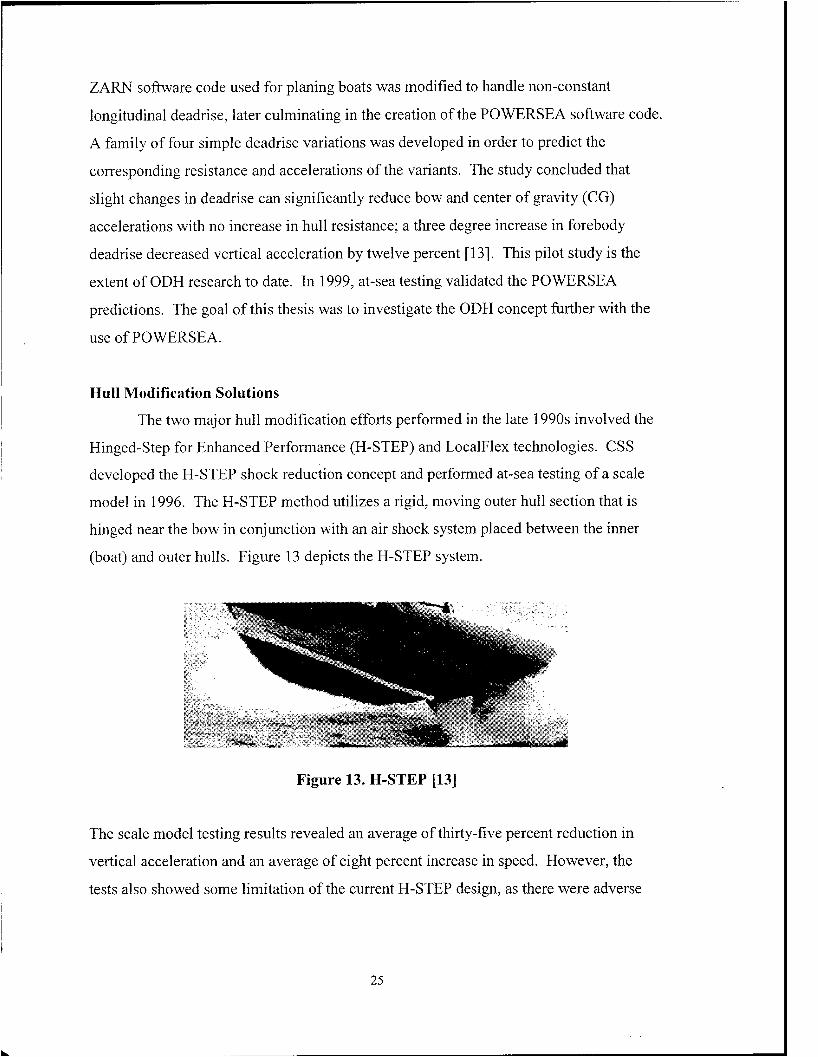
The two major hull modification efforts performed in the late 1990s involved the
Hinged-Step for Enhanced Performance (H-STEP) and LocalFlex technologies. CSS
developed the H-STEP shock reduction concept and performed at-sea testing of a scale
model in 1996. The H-STEP method utilizes a rigid, moving outer hull section that is
hinged near the bow in conjunction with an air shock system placed between the inner
(boat) and outer hulls. Figure 13 depicts the H-STEP system.
Figure 13. H-STEP [13]
The scale model testing results revealed an average of thirty-five percent reduction in
vertical acceleration and an average of eight percent increase in speed. However, the
tests also showed some limitation of the current H-STEP design, as there were adverse
25

effects on weight and maneuvering [ 131. Although no additional research was
performed, H-STEP is a promising technology.
LocalFlex is a system created by Vorus at the University of New Orleans. Like
H-STEP, it is an external hull attachment that can be configured for existing hull shapes.
LocalFlex, shown in Figure 14, consists of aluminum plates hinged at the keel, supported
by air bags at the chines.
hinged #e flt keel
Figure 14. LocalFlex [14]
A prototype of this system was developed and tested in 2000. Testing revealed that
LocalFlex is an effective shock reduction mechanism, but it lacks the ability to recover its
shape between shock events [14].
2.3.2 Deck-Hull Interface
The deck-hull interface offers some of the easiest and most inexpensive methods
of shock reduction. The most common item used to mitigate shock at this location is
rubber or foam padding, which can be used as a simple deck covering. As expected, the
ability of these components to significantly reduce shock is limited, since their
effectiveness is limited by the amount of displacement available. Due to the limited
available space on HSPBs, such padding offers little benefit. Advancements in
cushioning technologies have produced higher quality foam, which is generally used to
absorb engine and propeller vibrations. Although padding offers small benefit, it does
provide some absorption and can be combined with other systems to increase overall
effectiveness.
The most promising method of reducing shock at the deck-hull interface is
cockpit isolation. In this case, the cockpit of the vessel is suspended, so it is physically
26

isolated from the deck. For many boats, the space between the deck and the hull offers
the most available displacement room. [ 101 used the single degree of freedom model in
[9] to evaluate a passive shock isolation system having approximately twelve inches of
available displacement. Preliminary results showed a sixty percent reduction in shock
pulse magnitude for a 50-msec pulse and thirty-five percent reduction for a 1 00-msec
pulse [lo]. Cockpit isolation is a long-term solution that could be incorporated in a
combined shock mitigation system on future HSPBs.
2.3.3 Seat-Deck Interface
Perhaps the most feasible short-term solution to the shock mitigation problem is
located at the seat-deck interface. Commercially developed suspension seats are
currently being evaluated and tested to determine their effectiveness. The MkV SOC has
a STIDD 800v4 seat, which has no suspension system. In January 2002, a maritime
operational test and evaluation of three candidate suspension seats was conducted by [3].
The most effective suspension seat proved to be the STIDD 8 0 0 ~ 5 , which is an existing
MkV SOC seat with a load adjusting spring and a shock absorber base with a dampening
speed control mechanism. This seat requires few modifications to the existing boats and
represents the best bolt-on solution currently available [3].
Other shock mitigation systems found at the seat-deck interface include restraint
systems and padding. Current MkV SOC seats include padding and restraints, but these
systems were designed for comfort and safety, not necessarily to mitigate shock. CSS
continues to investigate new padding and restraint systems.
27

Chapter 3
Optimal Deadrise Hull Analysis
3.1 Design Tool Description
The POWERSEA Time-Domain Planing Hull Simulation software was used to
create an ODH. POWERSEA was created by Ship Motion Associates and is largely
based on theory developed by Zarnick in 1978. The material in this section is discussed
in great detail in [ 11. Zarnick developed a low-aspect ratio strip theory to predict vertical-
plane motions of planing craft. Zarnick assumed that wavelengths are large with respect
to craft length and that wave slopes are small. He modeled planing craft as a series of
two-dimensional impacting wedges, as shown in Figure 15.
Figure 15. Impacting Wedges (11
Zarnick derived the normal hydrodynamic force per unit length,h as the sum of a
Newtonian force term and a cross-flow force term, respectively:
28

D d d5 where -(m,V) = ma V+ ma V --(m,V)-. Dt at dt
In Equation (5 ) , m, is the sectional added mass, V is the velocity of the boat in the vertical
direction (refer to Figure 4), CD, , is a cross-flow drag coefficient, p is water density, and b
is the sectional half-beam. In Equation (6), is the longitudinal boat coordinate
measured from the boat's longitudinal center of gravity. Sectional added mass is modeled
as if it were an impacting wedge:
x 2
2 ma = k , - p b
ma = k,xpbb
?T2 P k, =-{1-0.4-(1 -KAR)} 4 90 (9)
where k, is an added mass coefficient that' is deadrise-dependent,
prismatic hull, and KAR is an added mass correction factor [l].
is the deadrise of the
A summary of the forces acting on the planing boat is:
(10)
(11)
FN = f {ma V+ ma V - U- am, + C,,,pVb2}d5 85
F, = -FN cos6- fpgC,,ad<
In Equations (1 0) through (1 3) , FN is the force normal to the boat hull, Fz is the vertical
force, Fx is the horizontal force, Fe is the moment in the pitch direction, U is the velocity
of the boat in the x-direction, CBM is the buoyancy moment coefficient, CBF is the
buoyancy force coefficient, a is the sectional area, and 8 is the pitch angle [l]. ' The resulting equations of motion are:
Mx,, =T, -FNsin6-FDcosB
M z , =T, -F,cosB-F,+F,sinB+W
I e = T X , + ~~x~ - F,X, - F,X,.
29

In Equations (1 4) through (1 6), M is the mass of the boat, XCG is the x-direction center of
gravity, ZCG is the z-direction center of gravity, T is thrust force, Fo is total drag force in
the x-direction, FB is the buoyancy force, W is the weight of the boat, I is the pitch
moment of inertia, xp is the distance from CG to the thrust vector, xc is the distance from
CG to the center of the normal force, XB is the distance from CG to the center of
buoyancy, and XD is the distance from CG to the center of action of the drag force. The
POWERSEA algorithms numerically solve the equations of motion for specified
geometry and initial conditions [ 13.
3.2 Design Methodology
A design model of the MkV SOC was created using known dimensions of the
boat. Unfortunately, the specific boat geometry was unavailable for this thesis due to
proprietary reasons. As a result, the model was developed based on available data and
dimensions were scaled appropriately by visual inspection. Table 5 summarizes the
prinicpal characteristics of the MkV SOC model, and Figure 16 shows the midship
section of the model.
Table 5. MkV SOC Model Principal Characteristics
I Length Overall I 82 ft I Forebody Deadrise 1 35" I Maximum Beam 17.5 ft Mid-chine Deadrise 29"
Depth (Keel to Shear) 7.75 ft LCG 30 ft aft FP Maximum Chine Depth 4.75 fi VCG 2.5 ft ABL
Disdacement 1 19000 Ibs Radius of Gvration 20 ft
Figure 16. MkV SOC Design Model
30

The overall dimensions of the MkV SOC are limited by transportation requirements. A
MkV SOC detachment, which includes two boats, fits inside a US Air Force C-5 Galaxy
cargo aircraft. Therefore, all models created for this analysis have the same overall
length, beam, and depth as the MkV SOC in order to ensure space limits are not
exceeded. Despite these fixed parameters, the deadrise can be varied by changing the
vertical location of the chine. A family of twenty-six hulls with deadrise values ranging
from fifteen to forty degrees was created and analyzed to determine the effects of
deadrise on heave acceleration. In general, the afterbody deadrise, henceforth referred to
as mid-chine deadrise, is nearly constant from amidships to the stem, and the forebody
deadrise is slightly higher. The maximum deadrise of forty degrees is illogical, as the
chine and shear lines are identical, resulting in a simple v-shape that lacks interior
volume for arrangements. However, in order to generate data for a larger range of
geometries, such high values of deadrise were used in the analysis.
Parameter Boat Speed
Wave Conditions Significant Wave Height
Peak Period Water Depth
Wave Direction Location
~
Both calm water and rough water sea conditions were applied to each model. The
calm water simulation provided a running trim angle and other hydrodynamic parameters
required for the rough water simulation. Additionally, the calm water analysis predicted
resistance and required power for a given speed. A rough water simulation was then
performed to determine heave acceleration. Table 6 summarizes the inputs provided for
the rough water simulation.
Value 35 kts
ITTC Peak Frequency Spectrum 3.1 fi
5.5 sec Deep Water Head Seas Coxswain
The ITTC Peak Frequency Spectrum was chosen to simulate random seas. The boat
speed, significant wave height, peak period, water depth, and wave direction were chosen
to duplicate sea conditions that existed for at-sea testing of the Mk V SOC.
31

The MkV SOC was tested on multiple occasions by the Naval Surface Warfare
Center Combat Craft Division in the late 1990s. Acceleration data was recorded at four
different boat locations and under various sea conditions. In order to validate the
POWERSEA predictions, rough water simulations were performed in the sea conditions
that existed during the at-sea testing. The craft was tested at a nominal displacement that
represented the typical half-load condition existing on the return leg of a mission. The
sea state was 2-3, with a significant wave height (H''3) of 3.1 ft. The specific test used
for comparison is the case in which acclerations were measured at the Coxswain location
for operation at 35 kts in head seas. The actual test results [S] are restricted and therefore
not printable in this report.
The at-sea testing measured heave, surge, and sway peak and RMS accelerations
and the duration of each pulse. POWERSEA does not calculate sway acceleration, and
for a constant surge velocity, surge acceleration is zero. Therefore, the only
POWERSEA calculation of interest is heave acceleration, which is due to the heaving
and pitching motions of the boat. In both at-sea and simulation scenarios, heave
acceleration dominates craft motion and therefore controls the mechanical shock event.
The simulations proved to be relatively accurate when compared to the at-sea
testing values. However, there are several reasons for the small discrepancies between
the simulated and actual values:
The actual offsets of the MK V SOC were unavailable due to proprietary
reasons, so the simulation model has slight differences in geometry.
The simulation used a random sea generation based on an ITTC spectrum
with of 3.1 ft and peak frequency of 5.5 sec, which matches but does
not duplicate the sea conditions during the tests.
The at-sea testing accelerometers had threshold settings in order to trigger
the device and avoid recording negligible acceleration values.
Based on these simulations, the software is relatively accurate in its predictions of
accelerations and is therefore a valid analysis tool.
32

3.3 Design Results
In order to determine the effects of deadrise on vertical acceleration, all twenty-
six hulls were simulated in the same sea conditions described in Table 6. Calm water
simulations were performed to evaluate the resistance of the hull, and rough water
simulations were performed to determine heave acceleration at the coxswain location.
All POWERSEA data collected during the ODH simulations is included in Appendix A.
Table 7 summarizes the resistance and heave accelerations at the coxswain location for
each model, and Figure 17 displays the percent change of resistance and heave
accelerations from baseline.
Table 7. Resistance and Coxswain Heave Acceleration Results
33

- 4 0 1 -15 -10 -5 0 5 1 0
Mid-chine Deadrise Variation (degl
... c.- Resistance -+-Coxswain Ava Heave +Coxswain 1/3 Heave ,
Figure 17. Percent Change From Baseline
The 1/3 highest heave acceleration represents the average of the 1/3 highest values of the
heave acceleration at the coxswain location. Although there is some data scatter due to
the random seas generated by the ITTC wave energy spectrum, the relationship between
deadrise and heave acceleration is clear. The trends in Figure 17 show that higher values
of deadrise can significantly reduce vertical acceleration of the boat while maintaining
current speed capabilities. As a result of these lower accelerations, the mechanical shock
transmitted to the crew and passengers would be greatly diminished.
The results of this Optimal Deadrise Hull analysis show similar trends to the
results obtained in the relatively limited computations performed at University of
Michigan (UM) using the modified ZARN coding. As POWERSEA was later developed
from this code and refined to match the results of planing boat model testing, it is
noteworthy that the analyses provide similar results. In order to establish a broader trend,
twenty-six hulls were analyzed, whereas the previous analysis at UM only considered
four hulls. The general results from both analyses show that as deadrise is increased,
resistance gradually increases but vertical acceleration decreases at a faster rate. The
ODH analysis shows asymptotic behavior, as both resistance and vertical acceleration
level out at higher values of deadrise.
34
Realistically, the maximum deadrise values are undesirable for the current MkV
SOC geometry. The most feasible solution for the specific boat geometry is to increase
deadrise by about six degrees, which provides a twenty percent reduction in average
heave acceleration and twenty-three percent reduction in 1 /3 highest heave acceleration.
For this case, resistance improved by approximately three percent so no loss in speed was
realized. In order to fully realize the possibilities, different boat geometries must be
tested over a range of displacements. The geometry and displacement of the MkV SOC
were fixed for the purposes of this project in order to ensure the boat remained
transportable via current methods.
35

Chapter 4
Design Space Study
4.1 Response Surface Methods
During any design process, many factors must be considered. For the MkV SOC,
transportation was a major factor; the ability to fit two boats into a USAF C-5 Galaxy
aircraft was a strict geometrical limitation. Other factors, such as payload capacity,
number of passengers, and speed were important but perhaps to a lesser degree. For
future designs, mechanical shock will undoubtedly be a design factor. Its importance
relative to other design criteria may or may not be determined before design work begins.
This section demonstrates a top-level design process called Response Surface Methods
(RSM), which creates a design space using a design of experiments (DOE), allowing
designers to compare feasible designs as part of a multiple criteria decision making
process.
This section outlines the basic concepts of RSM required to understand the design
space studies presented in this report. There are several references available for a more
detailed understanding of RSM. [6] provides an overview and application of RSM to
submarine concept design and [ 18 J is an excellent text on the underlying concepts behind
RSM . The following terminology is used in the RSM discussion:
Factors: The input variables or design parameters, represented by xi.
Levels: The different settings for each factor. For a two-level factor,
the low-level is represented by (-1) and the high-level as (t-1). For a
three-level factor, the intermediate level is represented by (0).
Response: The output of interest, represented by the letter y.
36

0 Interactions(s): Refer to dependencies between a factor's effect on the
response and levels of another factor. The interaction of x1 and x2 is
represented as ~ 1 x 2 [6].
RSM is a statistical technique used to study the significance of the shift in mean
value of a response due to a shift in factor levels over a desired range. The goal of RSM
is to produce an n-dimensional surface using a group of techniques in the empirical study
of relationships between one or more measured responses and a number of factors. The
selection of factors is facilitated by using a method called Design of Experiments (DOE).
DOE specifies the factors in orthogonal arrangements to ensure a good spanning of the
design space with minimal design input. For example, if a three factor design using three
levels for each factor were used, a full factorial DOE requires twenty-seven ship designs
to be used as input. Since ship synthesis requires much user interaction and may be
difficult to achieve, DOE reduction methods from the full factorial can be used. Two
frequently used methods are the Box-Behnken and Central Composite designs.
Regardless of the DOE method used to specify factor assignment, the RSM performs a
quadratic fit between k design factors and a response, y , using the following second
degree polynomial approximation: k k k k
~ = b , + C b , x , + C b i i ~ i 2 +x x b i J X i X j + E . i=l i=l i= l j=i+l
The coefficients bo, bi, bii, and by in Equation (1 7) can be obtained from a multivariate
regression software package; the error term, E, represents lack of fit. If the quadratic
surface does not accurately fit the data, the design space must be reduced by reducing the
range for each factor [6]. The quadratic surface defines a metamodel which can be used
in lieu of the ship synthesis model to represent all feasible concept designs.
Current concept exploration methodology is performed by varying design input
variables to study effects on output criteria. This ad hoe process can take a siginificant
amount of time to complete even a single design, let alone a large number of designs.
The goal of RSM is to minimize the number of point designs and ultimately evaluate a
design space containing all possible variants within the ranges of the specified input
factors. The application of RSM to a design process includes the following three steps:
37

0 Engineering Model: Create a mathematical model of the design and identify
the potential factors for each response of interest.
Screening Experiment: Determine the critical factors that have a statistical
impact on the response.
Response Surface Modeling: Within the design space, create a quadratic
surface for the response as a function of the critical factors [6].
0
0
In order to create the design space, an engineering model must be available to
develop the required number of design variants. There are no readily available synthesis
tools for the development of planing boats. There are, however, a few excellent software
tools that evaluate planing boat performance. POWERSEA, which was used in Chapter 3
to determine the effects of hull deadrise on vertical acceleration, is an excellent craft
motion and resistance predictor. The NAVCAD software package is also a good
predictor of resistance, but it is harder to develop hulls with variable deadrise in
NAVCAD due to input limitations (only mid-chine deadrise is input). More importantly,
NAVCAD is not capable of calculating craft motions. The goal of this project is to
analyze the effects of various performance parameters on vertical acceleration in order to
minimize shock. Therefore, PO WERSEA, which can perform resistance and craft
motion predictions, was used as the engineering model for this exercise.
After creating the design space, a screening experiment is typically performed to
determine the critical design factors, i.e. those factors which affect the response. A
screening experiment that uses DOE is a common method of identifying these factors.
The DOE formalizes and systematizes the design process by creating a design space of
consistently defined variants. The designer can use statistical analysis to estimate the
effect of each factor and their interactions on the response [6]. For the purposes of this
project, the critical design factors were designated from the beginning, so a DOE
screening experiment was unnecessary. Specifically, hull deadrise was the design factor
analyzed in Chapter 3. From previous research, it was determined that hull deadrise
might have a significant impact on vertical acceleration. Therefore, hull deadrise was the
primary design parameter; the other two design factors considered for this analysis were
payload weight and cruise speed. These parameters were adjusted in POWERSEA in
order to create the point designs used for the design space.
.
38

Once the critical factors are determined and the design space is defined, the
response surfaces can be developed. The most common DOE reduction methods are the
Box-Behnken and Central Composite designs. The response surface represents all
feasible designs within the design space defined by the critical factors. With this
response surface, the designer can now examine any point design within the design space
without having to create a new design [6].
The Box-Behnken design, which is a three-level, nearly-orthogonal design, is
shown in Figure 18 for a three dimensional case.
Figure 18. Box-Behnken Design
The design space is created from thirteen point designs: one point design is the center
point, and the remaining point designs are mid-segment points on the cube. This method
estimates main effects, quadratic effects, and simple interactions, but it cannot estimate
quadratic interactions. Also, since there are no corner points in this design, there is a
higher level of uncertainty near the corner regions. However, the Box-Behnken design is
very effective for situations in which the corner points are infeasible [ 181.
The Central Composite or Box-Wilson design is a three- or five-level design that
includes the corner, center, and axial points of the design. The three-factor Central
Composite design (CCD) is shown in Figure 19.
39

Figure 19. Central Composite Design
The three factor design space is developed from 15 point designs: a center point design,
eight corner point designs, and 6 axial point designs. This model more accurately
represents the response surface since the corner points are included. This model is also
useful when screening designs are used, since the screening design inputs can be re-used
to help create the Central Composite design space. However, attempting to reach these
corner point designs may strain the engineering model [IS].
4.2 Design Space Creation
The major focus of this research considered the effects of hull deadrise on vertical
acceleration. Therefore, the purpose of the design space study is to analyze the combined
effects of hull deadrise and other perfonnance parameters on vertical acceleration. Two
major design parameters that affect the vertical motion of a planing boat are payload and
speed. Based on the discussion in Chapter 2, the hydrodynamic lift is a determining
factor in a planing boat’s performance. The speed of the boat determines the lift fraction,
and ultimately the displacement. Payload directly affects both speed and displacement.
Therefore, a design space encompassing heave acceleration response surfaces based on
hull deadrise, cruise speed, and payload will provide all feasible solutions within the
specified range of the input parameters.
There are numerous design factors for any given planing boat design. When
conducting a preliminary design study, trade-offs are made at every level. The benefit of
40

using RSM is that the process can identify which design factors affect the various
response surfaces, allowing the designer to make adjustments during the early phases of
design.
is useful in understanding RSM methodology and is demonstrated in the following
sections.
A case study that analyzes how different parameters affect a particular response
As the engineering model for this analysis is relatively user-friendly, the Central
Composite design method was chosen to create the design space. The corner point
designs will not stress the model, and these points produce more accurate response
surfaces. Table 8 summarizes the design factors used to determine the response surface
for vertical acceleration. The -1, 0, and +1 levels represent the low, medium, and high
values of each parameter, respectively.
Table 8. Vertical Acceleration Factor Levels
Factor (Xi) -1 0 +1 Mid-chine Deadrise (deg) 24 29 34
Payload Weight (klbs) 0 15 30 Cruise Speed (knots) 30 35 40
JMP, a statistical software package produce by the SAS Institue, was used to
create the design space. The JMP DOE specified the fifteen point designs required to
create the Central Composite design model. The fifteen variants were created using
POWERSEA. Then, calm and rough water simulations were performed to determine
vertical acceleration at the Coxswain location. For the rough water simulations, all input
conditions with the exception of speed are identical to those described in Table 6 in
Chapter 3. All data collected during the simulations that was required to develop the
design space is included in Appendix B. Table 9 summarizes the results of the Central
Composite design space.
41

Table 9. Central Composite Design Summary
--- -+-
Pattern Deadrise Payload Cruise Coxswain Coxswain (deg) Weight Speed Average Heave 1/3 Highest Heave
(klbs) (kts) Acceleration (g) Acceleration (g) ++- 34 30 30 0.18 0.74 --+ 24 0 40 0.35 1.7 OOa 29 15 30 0.23 0.98
24 0 30 0.28 1.31 24 30 30 0.24 1.04
+-+ 34 0 40 0.32 1.34 OAO 29 30 35 0.26 1.01
] 000 I 29 15 I 35 I 0.27 1.27
The pattern defines the coding of the design factors; “+” is high, “-“ is low, “0” is mid-
range, “a” is low axial, and “A” is high axial. For example, “+++” represents the corner
point design having the highest deadrise (34”), highest payload weight (30 klbs), and
highest cruise speed (40 kts).
4.3 Design Space Analysis
The average heave acceleration and 1 /3 highest heave acceleration responses were
modeled using JMP. The following section discusses some of the pertinent statistical
parameters of the responses, evaluates the effects of the design factors on the two
responses, and demonstrates the capabilities of JMP with regard to preliminary design of
planing boats.
4.3.1 Average Heave Acceleration Response Model
The data in Table 9 was used to model the average heave acceleration response.
Each of the fifteen variants was entered in JMP; standard least squares model fitting was
used to obtain a quadratic response surface as a function of the three input factors. This
section briefly discusses some of the statistical information determined by JMP; [ 151
42

provides a more detailed understanding of these terms. The leverage plot, which is
shown in Figure 20, can be used to examine model fit.
0.35
- m
f! 6 0.3
B - a,
a, > 3 0.25
4 I 131
a .2
r,
I I I I
.20 .25 .30 .35
Avg Heave Acceleration Predicted P=0.17015 RSq=0.98 RMSE=O.U'l27
Figure 20. Average Heave Acceleration Response Model Leverage Plot
This plot shows the model predicted values (solid line), confidence intervals (dashed
lines), and sample mean (horizontal dashed line). The confidence interval graphically
shows the 95% confidence region for the line of fit and indicates whether the F Test (to
be discussed) is signibcant at the five percent level. If the confidence curves cross the
sampIe mean, the model is significant; otherwise, the model is not significant at the five
percent level. The leverage plot for average heave acceleration clearly illustrates that the
model is significant.
The RSq term in the leverage plot estimates the proportion of the variation in
average heave acceleration response around the mean that can be attributed to terms in
the model rather than to random error. An RSq of 1 describes a perfect fit, an RSq of 0
means the model fit predicts the response no better than the overall response mean. The
Root Mean Square Error (RMSE) term estimates the standard deviation of the random
error. For the average heave acceleration response, RSq is 0.96, so the model is an
excellent fit.
43

Table 10, the Analysis of Variance, summarizes the quality of the model fit to the
actual average heave acceleration response.
Table 10. Average Heave Acceleration Response Model Analysis of Variance
Source DF Sum of Squares Mean Square F Ratio Model !3 0.03312222 0.0C!3680 22.6865 Error 5 u .OU0&1 1 1 I 0.0001 62 Prob s F C. Total 14 0.03393333 0 .OD1 5
The three Sources of variation are Model, Error, and Total. The degrees of freedom (DF)
term records an associated DF for each source of variation. The Sum of Squares (SS)
terms account for the variability measured in the response. The SS is the sum of squares
of the differences between the fitted response and the actual response. The Total Sum of
Squares (SS) is the sum of the squared distances from the average heave acceleration
response sample mean. The Error 9s is the sum of squared differences between the fitted
values and the actual values, which corresponds to the unexplained residual Error after
fitting the regression model. If the Model SS, the difference between the Total SS and
Error SS, is much larger than the Error SS, then the factors accurately model the
response. The Mean Square term, which is simply SS divided by DF, converts the SS to
an average, and the F Ratio is the model mean square divided by the error mean square.
The accuracy of the response is also reflected in the F Ratio, which is used to test the
possibility that all coefficients in Equation (1 7) are zero; the larger the F Ratio, the better
the model fit. The “Prob > F” term represents the probability of obtaining a greater F
Ratio by chance alone if the model fits no better than the mean of the response.
Probabilities of 0.05 or less are normally considered evidence that there is at least one
significant regression factor in the model. Since this probability is 0.001 5, the model is
an excellent predictor of average heave acceleration.
The average heave acceleration coefficients for Equation (1 7) are shown in Table
11.

Table 11. Average Heave Acceleration Response Model Coefficients Term Intercept Deadrise (degj(24,34)8RS Payload (klbs)(0,30)8RS Cruise Speed (kts)(30,40)8RS Deadrise [deg)(24,34)fPayload [klbs)(0,30) Deadrise (deg)(24,34)*Cruise Speed (Ms)(30,40) Payload (klbs)(0,30)*Cruise Speed (Ms)(30,40) Deadrise (deg)(24,34)*Deadrise (deg)(24,34) Payload (klbs)(0,30)*Payload (klbs)(O,30) Cruise Speed (kts)(30,40)*Cruise Speed (Ms)(30,40)
Scaled Estimate - 0.2788a89
-0.025 -0.01 9 0.047
4.441 e-I 6 0.0075
-0.0025 -0.01 61 11 0.0038889 0.0038889 -
Std Error t Rdio 0 006846 40 74
-6 21 0 004028 0 004028 -4 72 0 004028 11 67 0 004503 u 00 0 004503 1 67 0 (104503 -0 56 0 007943 -2 03 0 007943 0 49 0 007943 0 49
Prob>it] <.0001 0.001 6 0.0053 <.0001 1 .oooo 0 .I 567 0.6027 0.0983 0.6451 0.6451
The standard error is an estimate of the standard deviation for each coefficient. The t
Ratio and “Prob > Itl” terms reflect the possibility that each coefficient is zero, similar to
the F Ratio. A very large t Ratio indicates that the true coefficient is likely nonzero; the
“Prob >It/” is the probability of generating an even greater t Ratio given that the
coefficient is zero. As with the F Ratio, probabilities less than 0.05 typically indicate that
the coefficient is nonzero. Table 11 shows that deadrise, payload, and cruise speed are all
statistically significant with regard to the average heave acceleration response. As all of
the second order effects have “Prob > Jtl” greater than 0.05, they are statistically
insignificant.
Based on the above discussion, the following conclusions are evident:
The quadratic model is statistically significant.
The model can accurately predict average heave acceleration as a function
of the three factors with an estimated standard deviation of 0.0127g.
Cruise speed influences average heave acceleration the most, followed by
deadrise and displacement, respectively.
0
4.3.2 1/3 Highest Heave Acceleration Response
The 1/3 highest heave acceleration response model was created based on the data
in Table 9. Figure 21 shows the leverage plot, Table 12 shows the Analysis of Variance,
and Table 13 shows the Model Coefficients for the 1/3 highest heave acceleration
response model.
45

I I I I I .8 1 .o 1.2 1.4 1.6 3
1 f3 Heave Acceleration Predicted P=U.0244 RSq=0.92 RMSE=O.I 166
Figure 21.1/3 Highest Heave Acceleration Response Model Leverage Plot
Table 12.1/3 Highest Heave Acceleration Response Model Analysis of Variance
Source DF Sum af Squares Mean Square F Ratio Model 9 0.82699306 0.091 888 6.7558 Errur 5 0.06800694 0.01 3601 Prob 3 F C. Tdal 14 0 .89500DDD 0.0244
Table 13.1/3 Highest Heave Acceleration Response Model Coefficients
Term Scaled Estimate Intercept Deadrise (deg)(24,34)8RS Payload (klbs)(0,30)8RS Cruise Speed (Ms)(30,40)&RS Deadrise (deg)(24,34)*Payload (klbs)(0,30) Deadrise [deg)(24,34)*Cruise Speed [Ms)[30,4U) Payloed (klbs)(O,3O)*Cruise Speed (Ms)(30,40) Deadrise (deg)(24,34)*Deadrise (deg](24,34) Payload (klbs)(0,30)*Payload (klbsJ(0 ,30) Cruise Speed (Ms)(30,40)*Cruise Speed (Ms)(30,40)
1 14777T8 -0.1 45 -0.082 0.1 99
0.09625 0.03375
-0.00875 -0.087222 -0.062222 0.1 5277T8
With an RSq value of 0.92 and a Prob > F of 0.0244, this model
Std Error 0.062684 0.03688 0.03688 0.03688
0.041 233 0.041 233 0.041 233 0.072728 0.072728 0.072728
t Ratio 18.31 -3.93 -2.22 5.40 2.33 0.82
-0.21 -1 .20 -0.86 2.1 0
Prob>CI e.0001 0.0111 0.0768 0.0030 0.0669 0.4503 0.8403 0.2341 0.431 3 0.0897
s also an excellent fit.
The Prob > It1 for deadrise and cruise speed is less than 0.05, so each of these parameters
is statistically significant with regard to the 1/3 highest heave acceleration response.
46

However, the payload has a Prob > It1 of 0.0768, so payload does not statistically
influence the 1 /3 highest heave acceleration response.
The following conclusions can be drawn from the 1/3 highest heave acceleration
response analysis:
0 The quadratic model is statistically significant.
The model can accurately predict 1/3 highest heave acceleration as a
function of the three factors with an estimated standard deviation of
0.1 166g.
Cruise speed influences 1/3 highest heave acceleration the most, deadrise
has a significant but lesser affect, and payload does not statistically affect
the response.
0
4.3.3 Design Space Case Studies
The capabilities of JMP have only been touched upon thus far. The tool is most
useful in a visual demonstration, as decisions made by a designer can be analyzed,
changed, and re-analyzed with a few keystrokes. That is the power of RSM: trade-offs
can be made instantaneously without having to perform lengthy design syntheses. Some
of the pertinent JMP graphics will be presented in the following section to best capture
this dynamic process. The purpose of this section is to demonstrate the applicability of
RSM to preliminary, top-level planing boat design. Two case studies are performed to
analyze planing boats when vertical acceleration is a design factor. Case 1 will concern
setting operational limits for an existing boat design, and Case 2 will consider
preliminary design of a new planing boat.
While the MkV SOC has excellent performance characteristics with regard to
speed, range, and payload, it has been shown to be an uncomfortable ride due to the
numerous mechanical shock events encountered during normal operations. Research on
shock mitigation is dominated by short-term, bolt-on solutions that can be implemented
as soon as possible. The following analysis shows how changes in cruise speed and
payload affect vertical accelerations.
The design space created in the preceding section varied deadrise, payload, and
cruise speed. For this example, deadrise will remain fixed at the baseline level of 29",
47
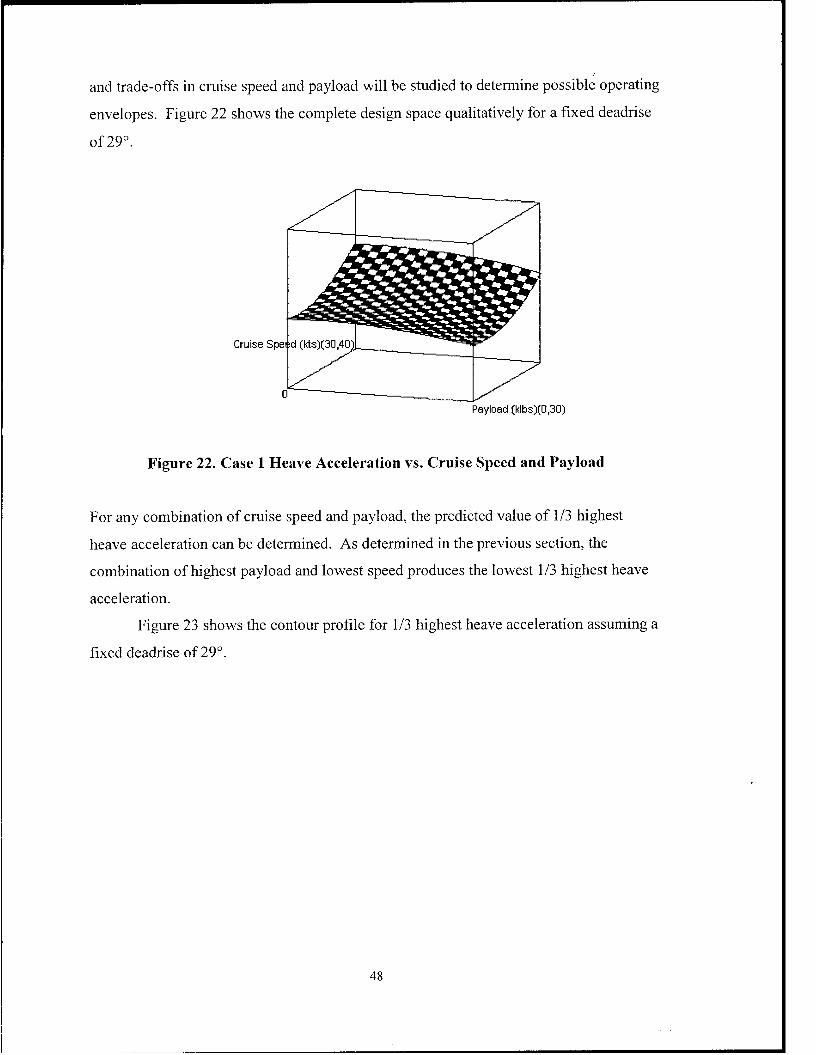
and trade-offs in cruise speed and payload will be studied to determine possible operating
envelopes. Figure 22 shows the complete design space qualitatively for a fixed deadrise
of 29".
~
Payload (klbs](D,30)
Figure 22. Case 1 Heave Acceleration vs. Cruise Speed and Payload
For any combination of cruise speed and payload, the predicted value of 1/3 highest
heave acceleration can be determined. As determined in the previous section, the
combination of highest payload and lowest speed produces the lowest 1 /3 highest heave
acceleration.
Figure 23 shows the contour profile for 1/3 highest heave acceleration assuming a
fixed deadrise of 29".
48

0 Payload [klbs)[O,3D) 30-
Figure 23. Case 1 Heave Acceleration Contour Profile
Each contour line represents a constant value of 1/3 highest heave acceleration. This plot
can be used to determine the operating conditions required to ensure vertical
accelerations below a specified level. For example, if the upper limit on vertical
acceleration (for the specified sea conditions) was 1 g, the only possible combinations of
speed and payload are those in the unshaded region of the plot, below and to the right of
the 1 g contour. Any combination of cruise speed and payload can be specified to
determine the corresponding 1/3 highest heave acceleration, or a 1/3 highest heave
acceleration can be specified to determine the possible ranges of cruise speed and
payload. Again, it must be emphasized that no additional design work is required to
make these determinations; once the work of creating the point designs is finished, trade-
off comparisons can be made instantly.
Perhaps the most beneficial use of RSM is during the early phases of preliminary
design. Case 2 assumes that the ranges for deadrise, payload, and cruise speed have been
narrowed to the ranges specified in Table 8. Assuming that vertical acceleration is a
49

design criterion, the JMP analysis performed in the previous section can be used to
evaluate all feasible designs in this design space. Of course, vertical acceleration is only
one of many responses that the designer will need, but for the purpose of this exercise, it
is assumed that it is the only response being considered.
The two factors that affect the 1/3 highest heave acceleration the most are cruise
speed and hull deadrise. Figure 24 shows the contour profile for a fixed payload of
fifteen thousand pounds and variable speed and deadrise.
24 Deadrise (deg)(24,34) 34 -
Figure 24. Case 2 Contour Profile (15 klbs Payload)
The contours show the combinations of deadrise and cruise speed required to produced
the specified vertical acceleration. For an upper limit of 1 g, only combinations of high
deadrise and low cruise speed produce a satisfactory response (unshaded region).
Figure 25 shows the same contours but for a fixed payload of thirty thousand
pounds and assumed heave acceleration limit of 1 g..
50
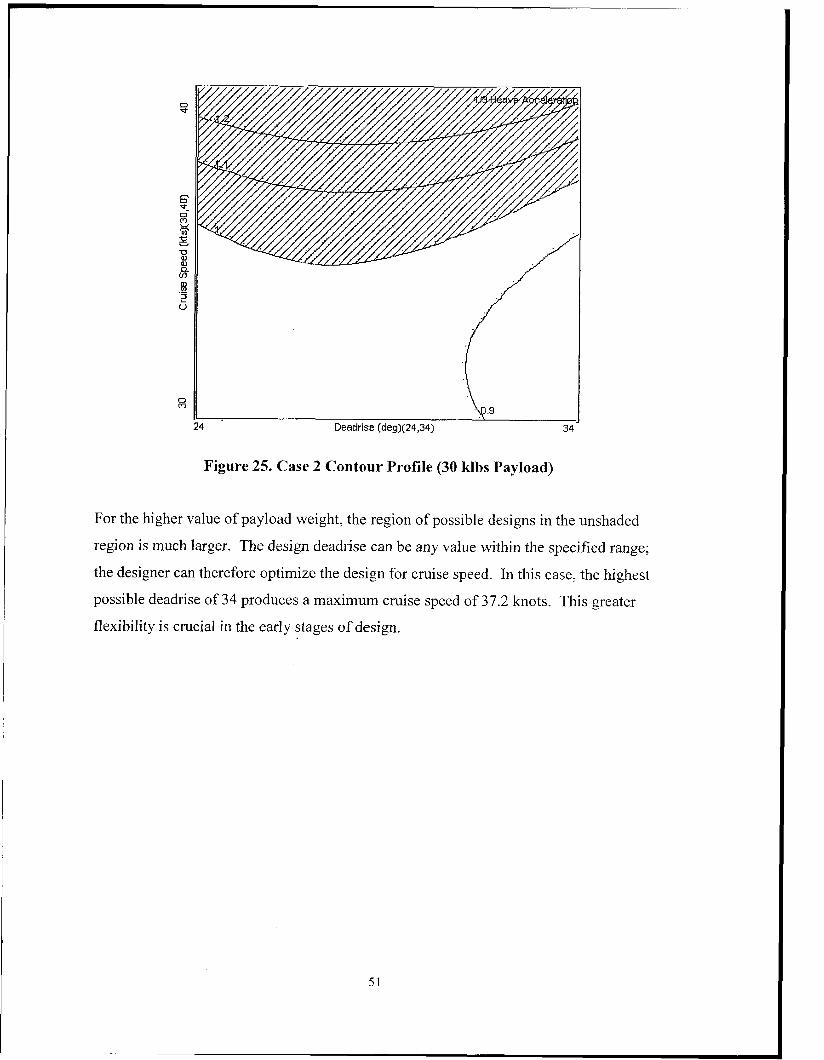
34 Deadrise [deg)(24,34)
Figure 25. Case 2 Contour Profile (30 Mbs Payload)
For the higher value of payload weight, the region of possible designs in the unshaded
region is much larger. The design deadrise can be any value within the specified range;
the designer can therefore optimize the design for cruise speed. In this case: the highest
possible deadrise of 34 produces a maximum cruise speed of 37.2 knots. This greater
flexibility is crucial in the early stages of design.
51

Chapter 5
Conclusions The correlation between Naval Special Warfare high speed planing boat operation
and injury is well documented. Current solutions focus on bolt-on solutions that can be
implemented on existing boats, i.e. placing new suspension seats on the MkV SOC. This
thesis examines a long-term shock mitigation solution by determining the relationship
between hull deadrise and a planing boat’s vertical acceleration. Hull deadrise does
indeed influence these accelerations and should be analyzed in more detail during next-
generation planing boat design. Furthermore, two case studies show how future designs
can incorporate Response Surface Methods in preliminary design to optimize a planing
boat design for shock mitigation purposes.
5.1 Optimal Deadrise Hull Analysis
The POWERSEA Time-Domain Planing Hull Simulation software was used to
study the effects of hull deadrise on vertical acceleration. A baseline MkV SOC hull was
created and compared to at-sea craft motion tests. Twenty-five additional hulls having
the same overall length and beam of the MkV SOC were created; deadrise was varied
from fifteen degrees below to ten degrees above the baseline deadrise. Calm and rough
water simulations were performed to determine the resistance and heave acceleration of
each hull: The ODH results show that an increase in hull deadrise of only six percent can
reduce a boat’s average heave acceleration by twenty percent and 1/3 highest heave
acceleration by twenty-three percent with no loss in performance. An increase in hull
deadrise in a future design, combined with some type of suspension seating and cockpit
isolation, will likely produce the most effective shock mitigation system.
52

5.2 Design Space Study
RSM was used to develop a Central Composite design space using fifteen design
variants. Each variant has a different combination of three design factors: deadrise,
cruise speed, and payload weight. The design space, which was created with the aid of
the JMP Statistical Discovery Software package, allows the designer to examine all
feasible designs within the space as part of a multiple criteria decision making process.
An analysis of the design space showed that both average and 1/3 highest heave
acceleration responses can be modeled accurately and that these models are most
influenced by cruise speed, hull deadrise, and payload weight, in that order.
Two case studies were performed to demonstrate the applicability of RSM to
planing boat design. Case 1 showed that operational limits can be determined for an
existing planing boat design by examining the combined effects of cruise speed and
payload on vertical acceleration. Case 2 argued that RSM can reduce planing boat heave
accelerations and subsequently reduce mechanical shock when implemented early in the
design process. By analyzing the complete design space, the designer can examine all
feasible concept designs within the design space, without having to perform lengthy
design syntheses. In summary, RSM can accomplish the following: .
For the selected response, the designer can examine an infinite number of
combinations of the design factors to determine the combined effect on the
response. The response surface can help the designer determine which factors
have a significant impact on the response and ultimately enables the designer
to focus on these critical factors.
The designer can perform a trade-off study to determine how selection of one
or more factors limits the selection of the remaining factors.
By setting limits on the response, the designer can reduce the feasible design
space and determine whether a solution is possible for the specified response.
5.3 Recommendations for Future Work
This thesis examines the impact of hull deadrise on planing boat vertical
acceleration and creates a design space to determine the combined affects of deadrise,
53

cruise speed, and payload weight on these accelerations. To improve upon this work,
future research is required in several areas.
First and foremost, the deadrise analysis must be performed with the specific boat
geometry. Due to proprietary reasons, the hull and station offsets of the MkV SOC were
unavailable for use during the course of this research. The overall length and maximum
beam of the vessel were known, however, so a relatively accurate model of the boat was
developed for simulation purposes. In any case, the results of this thesis unmistakably
show that there is a relationship between a boat’s vertical acceleration and its deadrise.
Although POWERSEA is an excellent analysis tool, a synthesis tool should be
used in the future to more accurately represent the various parameters derived from a
planing boat’s geometry. Specifically, changes in hull deadrise result in changes in a
vessel’s displacement and radius of gyration. These two parameters were held constant
for all analyses performed in Chapter 3. The radius of gyration is not significantly
affected by changes in deadrise, as the length and beam of the boat were held constant,
and the changes in displacement are negligible for small changes in deadrise. Regardless,
a complete synthesis of each hull form will eliminate any uncertainty in the results.
For next-generation boat design, some measurable limit must be developed for
human exposure to shock in order to develop an optimal hull form for vertical
acceleration. While smaller magnitude and shorter pulse shock events are certainly
better, an effective design can only be as good as the criteria it is measured against.
Additionally, boat geometry limits must be delineated in order to evaluate all feasible
hulls. Should the MBV SOC transportation requirements remain in affect, the general
dimensions are limited, as discussed in Chapter 3.
Finally, all factors influencing planing boat vertical acceleration must be
identified. A design of experiments can be used to determine the critical factors that
statistically affect the response, and response surface methods can be used to model the
complete design space. In order to optimize the overall design, responses other than
vertical acceleration should be determined. Ideally, an Overall Measure of Effectiveness
Model can be developed to prioritize the various responses based on NSW community
input. Ultimately, a trade-off study can be performed to determine the global effects of
changes in the critical design factors.
54

Appendix A
POWERSEA ODH Data
55

Forebodv Mid-chine Resistance Heave LOC Pitch CG Heave Coxswain Deadrisi Deadrise at 35 kts (feet) (deg) Accel
(deg) (deg) (HP) (9)
19.5
20.8
21.7
22.2
23.1
24.3
26
15
16
17
18
19
20
21
1307.3
1332.1
1355.9
1390
1410.6
1439.5
1453.2
Min Mean Max
Std Dev Max Ht H(1/3)
Min Mean Max
Std Dev Max Ht H(1/3)
Min Mean Max
Std Dev Max Ht H(1/3)
Min Mean Max
Std Dev Max Ht H(1/3)
Min Mean Max
Std Dev Max Ht H( 113)
Min Mean Max
Std Dev Max Ht H(1/3)
Min Mean Max
Std Dev Max Ht H(1/3)
-0.1884 0.7795 1.7620 0.41 85 1.8868 1.5894
-0.3515 0.6897 1.5446 0.4080 1.7568 1.4998
-0.331 8 0.5961 1.531 9 0.3796 1.7520 1.4457
-0.3597 0.4626 1.5789 0.371 1 1.8342 1.5633
-0.5179 0.3987 1.9201 0.3971 2.4380 1.6908
-0.7512 0.3147 1.431 2 0.3996 1.9372 1.6824
-0.9589 0.1776 1.2166 0.3862 2.1756 1.5992
-0.1005 2.1997 5.1120 1.0852 5.1270 4.6376
-0.2162 2.1581 4.9385 1.1261 5.0140 4.5590
-0.3246 2.1781 4.8944 1.0207 4.7321 3.7770
-0.0434 2.01 50 5.41 20 1.0656 5.3530 4.9012
-0.5258 2.0350 6.61 30 1.1378 7.1390 4.4233
-0.7212 2.0344 5.4800 1.1922 6.201 0 5.2210
-0.8495 1.9549 5.41 70 1.1463 6.2300 4.7882
-0.5056 -0.0003 2.1048 0.3053 2.4992 2.4556
-0.4685 -0.0024 1.3200 0.2736 1.7885 1.9649
-0.5060 -0.0005 2.8049 0.2935 3.31 09 2.2044
-0.5404 -0.0037 1.3426 0.2504 1.8391 1.9388
-0.51 13 -0.0000 1.4944 0.2756 1.9623 2.0335
-0.503 1 -0.0039 1.8619 0.2742 2.3651 1.9610
-0.4997 -0.0004 1.4629 0.2525 1.9166 1.6546
Heave Accel (9)
0.0033 0.3325 3.2804 0.3289 3.1966 2.3531
0.0041 0.31 97 2.2076 0.281 3 2.1984 1.831 8
0.0009 0.3279 4.3484 0.3207 4.2902 2.0973
0.0021 0.281 8 2.2240 0.2848 2.0481 2.0208
0.0039 0.3259 2.3853 0.301 9 2.3814 2.0302
0.0021 0.3145 3.0260 0.31 04 2.9671 2.2598
0.001 0 0.3014 2.4316 0.271 1 2.41 86 1.7706
56

CG Heave Coxswain
-
Forebody Mid-chine Resistance Heave LOC Pitch Deadrise Deadrise at 35 kts (feet) (deg)
(deg) (deg) (Hp)
28.4
28.8
31.1
33.1
33.5
33.9
34.1
22
23
24
25
26
27
28
1450.5
1485.9
151 3.8
1522.8
1560.7
1594.3
1632.1
Min Mean Max
Std Dev Max Ht H(1/3)
Min Mean Max
Std Dev Max Ht H(1/3)
Min Mean Max
Std Dev Max Ht H(1/3)
Min Mean Max
Std Dev Max Ht H(1/3)
Min Mean Max
Std Dev Max Ht H(1/3)
Min Mean Max
Std Dev Max Ht H(1/3)
Min Mean Max
Std Dev Max Ht H(1/3)
-0.9790 0.0670 1.2796 0.3956 2.0454 1.591 0
-1.1619 -0.0138 1.4941 0.4004 2.5626 1.5577
-1.1863 -0.1633 1.0663 0.3805 1.9776 1.3982
-1.1307 -0.2798 0.762 1 0.3846 1.8620 1.5721
-1.2559 -0.3794 0.6823 0.3732 1.7845 1.6357
-1.381 8 -0.491 0 0.4935 0.3823 1.8629 1.5483
-1.6622 -0.5812 0.7460 0.3743 2.1999 1.8270
-1.1002 1.9730 5.0520 1.1787 5.751 0 4.731 5
-1.4538 1.9412 6.7300 1.2094 7.5540 5.01 10
-0.7981 1.8259 4.9079 1.1284 5.3850 4.4506
-0.6424 1.8379 5.1050 1.1336 5.7030 4.4878
-1.2331 1.7496 4.9084 1.1462 5.8130 4.7621
-0.6937 1.6650 5.1 390 1.1879 5.8330 5.0360
-1.0235 1.5570 5.791 0 1.1547 6.61 00 5.1940
Accel Heave Accel u -0.5184 0.0013 1.3634 0.2372 1.8254 1.5027
-0.496 3 -0.0005 1.1240 0.2425 1.6203 1.4157
-0.5304 -0,0019 1.3056 0.2222 1.8360 1.3034
-0.5071 0.001 9 1.4744 0.2208 1.8380 1.271 0
-0.5228 -0.001 3 0.8795 0.2125 1 ,3644 1.1367
-0.5776 0.0010 0.9162 0.2073 1.3078 0.9893
-0.5640 -0.0002 0.7174 0.2068 1.2770 1.0564
0.0009 0.2861 2.1038 0.2503 2.0718 1.5387
0.0004 0.2986 2.1215 0.2658 2.0991 1.5737
0.001 3 0.2826 2.0528 0.2208 2.0336 1.2583
0.0008 0.2743 2.3314 0.2281 2.2668 1.2804
0.0009 0.271 5 1.4884 0.21 95 1.3985 1.1479
0.0020 0.2800 1.4881 0.1993 1.4485 0.9702
0.0015 0.2688 1.3833 0.21 80 1.3172 1.1550
57

Forebody Mid-chine Resistance Heave LOC Pitch CG Heave Coxswain Deadrise Deadrise at 35 kts (feet) (deg) Accel Heave Accel
(deg) (deg) (Hp)
34.5
34.8
35.2
35.6
37.5
38
39
29
30
31
32
33
34
35
1661.3
1689.6
1714.3
1646.3
1601.3
1616.8
1614.1
Min Mean Max
Std Dev Max Ht H( 1 /3)
Min Mean Max
Std Dev Max Ht H(1/3)
Min Mean Max
Std Dev Max Ht H( 113)
Min Mean Max
Std Dev Max Ht H(1/3)
Min Mean Max
Std Dev Max Ht H(1/3)
Min Mean Max
Std Dev Max Ht H(1/3)
Min Mean Max
Std Dev Max Ht H(1/3)
-1.8824 -0.6899 0.7765 0.3803 2.6589 1.6043
-1.6345 -0.7822 0.668 1 0.391 1 2.3027 1.6712
-1.8989 -0.8850 0.2459 0.4 180 2.1246 1.7163
-1.8789 -0.9751 0.2317 0.3995 2.1106 1.6033
-2.0008 -1.1412 -0.2681 0.3527 1.6543 1.4112
-2.1696 -1.2584 -0.1755 0.3565 1.9941 1.4359
-2.281 0 -1.3907 -0.3734 0.3399 1.8519 1.3778
-1.6729 1.451 9 6.1860 1.2642 7.8590 5.2430
-1.3517 1.5745 4.9346 1.0432 5.6950 3.8970
-0.9800 1.5045 3.9300 1.0247 4.7595 3.9832
-1.0205 1.4666 4.5090 1.0507 5.1950 4.0988
-1.4034 1.3036 4.1315 1.1657 5.5350 4.7585
-2.2475 1.2681 4.7589 1.1755 7.0060 5.1800
-2.1591 1.2036 4.7873 1.1456 6.9460 5.1970
-0.6599 -0.001 9 0.9606 0.2002 1.6204 0.9433
-0.5866 0.0005 0.671 9 0.1888 1.2299 0.8669
-0.4572 0.0018 0.6039 0.1804 0.9285 0.8234
-0.4350 -0.0017 0.5630 0.1731 0.9379 0.7871
-0.5183 -0.001 3 0.6196 0.1735 1.0387 0.8674
-0.4546 0.0041 0.9945 0.1820 1.3420 0.8583
-0.4926 -0.0008 0.4365 0.1554 0.91 18 0.6588
0.001 1 0.2646 1.6087 0.201 1 1.5891 1.0098
0.0004 0.241 3 1.2206 0.1776 1.1737 0.8889
0.0034 0.2233 1.0058 0.1621 0.9512 0.81 17
0.001 5 0.21 88 1.0226 0.1637 0.9814 0.8257
0.0032 0.2374 1.1289 0.1773 1.0865 0.9206
0.0037 0.2314 1.3879 0.2054 1.2604 0.9203
0.0037 0.2083 0.8175 0.1612 0.7686 0.7756
58

Forebody Mid-chine Resistance Heave LOC Pitch CG Heave Coxswain Deadrise Deadrise at 35 kts (feet) (deg) Accel Heave Accel
(deg) (deg) (Hp) (9) (9)
Min Mean
40 36 1618.8 Max Std Dev Max Ht H(1/3)
Min Mean
41 37 1620.4 Max Std Dev Max Ht H(1/3)
Min Mean
42 38 1610 Max Std Dev Max Ht H(1/3)
Min Mean
43 39 1599.9 Max Std Dev Max Ht H( 1/3)
Min Mean
44 40 1597.5 Max Std Dev Max Ht H(1/3)
-2.4537 -1.5028 -0.6454 0.3641 1.6816 1.4112
-2.5470 -1.6492 -0.6998 0.3597 1.8072 1.4766
-2.5705 -1.8062 -0.7204 0.3297 1.7308 1.4966
-2.9636 -1.9388 -1.0669 0.3767 1.8195 1.4454
-3.0434 -2.0393 -0.7484 0.4096 2.1478 1.9828
-1.3665 1.1438 4.5102 1.1505 5.8770 4.7739
-1.2582 1.0416 4.2170 1.1434 5.4750 4.9096
-2.0026 0.9405 4.21 06 1.1043 6.21 30 4.5708
-1.8103 0.8596 4.1287 1.2189 5.8630 5.1790
-2.4658 0.7738 4.4909 1.1978 6.671 0 5.5530
-0.4471 -0.0006 0.6340 0.1576 1.0685 0.731 3
-0.3757 -0.0025 0.5366 0.1 537 0.8944 0.6768
-0.5885 0.0008 0.5169 0.1462 1.1054 0.5797
-0.41 32 -0.001 1 0.5891 0.1503 0.9467 0.6835
-0.4542 -0.0001 0.3742 0.1498 0.7959 0.5439
0.001 9 0.2100 1.21 34 0.1589 1.1603 0.8267
0.001 5 0.2072 0.9276 0.1498 0.8740 0.7166
0.0029 0.1983 1.1275 0.1514 1.0145 0.7102
0.001 3 0.1980 1.0232 0.1549 0.9869 0.8021
0.0024 0.1827 0.7242 0.1489 0.6526 0.7176
59

Appendix B
POWERSEA Design Space Data
60

Row Pattern Heave LOC Pitch Heave Coxswain (feet) (deg) Accel Heave Accel
(9) (9)
++-
--+
OOa
+-+
OAO
OaO
Min Mean Max
Std Dev Max Ht H(1/3)
Min Mean Max
Std Dev Max Ht H(1/3)
Min Mean Max
Std Dev Max Ht H(1/3)
Min Mean Max
Std Dev Max Ht H(1/3)
Min Mean Max
Std Dev Max Ht H(1/3)
Min Mean Max
Std Dev Max Ht H(1/3)
-2.4550 -1.5178 -0.4126 0.3983 2.0424 1.7459
-0.5448 0.3702 1.6787 0.4067 2.0983 1.7577
-1.6792 -0.7275 0.4733 0.3708 2.1525 1.5255
-1.4157 -0.5379 0.5460 0.331 9 1.961 7 1.4324
-1.8824 -0.6899 0.7765 0.3803 2.6589 1.6043
-1.1314 -0.2798 0.9320 0.3655 1.991 0 1.5475
-1.6852 0.9805 4.3064 1.1698 5.9920 4.5831
-1.6043 1.3474 5.6270 1.2667 6.8160 5.3100
-1.7638 1.0018 5.421 0 1.2863 6.9090 5.491 0
-2.2417 1.01 22 5.0660 1.2538 7.2840 5.301 0
-1.6729 1.451 9 6.1860 1.2642 7.8590 5.2430
-1.8642 0.8789 4.5050 1.31 54 5.9450 5.4750
-0.4475 -0.0018 0.6781 0.1478 1.1256 0.6856
-0.6736 0.0007 1.6350 0.2779 2.2281 1.7101
-0.4891 -0.0008 0.6206 0.1687 1.0754 0.8764
-0.671 8 -0.001 1 0.7772 0.2091 1.3754 1.0173
-0.6599 -0.001 9 0.9606 0.2002 1.6204 0.9433
-0.5991 0.0079 0.9418 0.2295 1.4573 1.1153
0.0019 0.1910 1.1617 0.1474 1.081 7 0.7567
0.0015 0.3528 2.5149 0.2854 2.4589 1.7000
0.001 1 0.2264 1.0591 0.1744 1.0144 0.9815
0.0009 0.2904 1.5160 0.2260 1.4646 1.1741
0.001 1 0.2646 1.6087 0.201 1 1.5891 1.0098
0.0024 0.3134 1.5436 0.2275 1.51 04 1.0950
61

Row Pattern Heave Loc Pitch Heave Coxswain (feet) (deg) Accel Heave Accel
7
8
9
10
11
12
+--
OOA
+++
-++
A00
a00
Min Mean Max
Std Dev Max Ht H( 113)
Min Mean Max
Std Dev Max Ht H( 113)
Min Mean Max
Std Dev Max Ht H(1/3)
Min Mean Max
Std Dev Max Ht H(113)
Min Mean Max
Std Dev Max Ht H( 1 /3)
Min Mean Max
Std Dev Max Ht H(1/3)
-1.7639 -0.9707 0.0096 0.3468 1.71 59 1.6367
-1.2273 -0.2576 1.01 98 0.4014 2.2060 1.7840
-1.7809 -0.9767 0.1035 0.3413 1.8844 1.6328
-0.8 580 0.0601 1.2426 0.3744 1.9753 1.5697
-1.8452 -1.0138 0.1729 0.3364 1.7892 1.3403
-0.7921 0.0039 1.2714 0.3889 2.0635 1.6042
-3.0394 0.3375 5.0090 1.3669 8.0490 5.6660
-1.7337 1.451 3 5.961 0 1.3380 7.6950 5.7730
-0.8034 1.5540 4.7937 1.0779 5.5820 4.6901
-0.9422 1.8908 4.9989 1.0820 5.6820 4.4721
-1.6790 0.9773 5.2750 1.2696 6.7500 5.2330
-1.8750 1.5386 5.3250 1.2274 6.9220 5.3190
-0.5682 -0.0016 0.4170 0.1428 0.9757 0.6424
-0.6628 -0.0020 1.1861 0.2538 1.6981 1.3246
-0.6201 0.0002 1.3305 0.2066 1.9140 1.0883
-0.5583 0.0004 0.9589 0.2471 1.3717 1.2351
-0.5503 -0.0001 0.7547 0.1759 1.2140 0.81 12
-0.5988 0.0010 1.2333 0.2232 1.6777 1.1359
0.0009 0.2031 0.8195 0.1616 0.7871 0.8224
0.0009 0.3407 1.961 7 0.2682 1.9446 1.5649
0.0024 0.2657 2.2472 0.2341 2.171 1 1.2498
0.0021 0.31 95 1.6342 0.2363 1.5529 1.21 76
0.0007 0.2455 1.3681 0.1921 1.3538 0.9387
0.0005 0.2846 1.9762 0.2285 1.9020 1.1211
62

Row Pattern Heave LOC Pitch Heave Coxswain (feet) tdeg) Accel Heave Accel
(9) (9)
Min -1.2293 -2.8636 -0.4894 0.0023 Mean -0.0024 0.9515 0.0146 0.2780
13 --- Max 1.3124 5.2810 0.9069 1.5899 Std Dev 0.3889 1.2963 0.2184 0.2338 Max Ht 2.5416 8.1440 1.3667 1.4866 H(1/3) 1.5962 5.3560 1.2024 1.31 38
Min -1.2340 -0.6970 -0.4943 0.0016 Mean -0.4161 1.7409 0.0018 0.2357
14 -+- Max 0.721 3 5.4240 0.8127 1.3286 Std Dev 0.3530 1.0802 0.1883 0.1961 Max Ht 1.9450 4.5275 1.2437 1.2878 H(1/3) 1.4538 3.7787 0.9731 1.0368
Min -1.4557 -1.7271 -0.6845 0.0033 Mean -0.4947 1.271 7 -0.0033 0.2736
15 000 Max 0.9864 5.4230 0.8756 1.4501 Std Dev 0.3786 1.2857 0.2085 0.2225 Max Ht 2.4064 6.4830 1.5300 1.431 9 H(1/3) 1.6166 5.3400 1.1007 1.2659
63
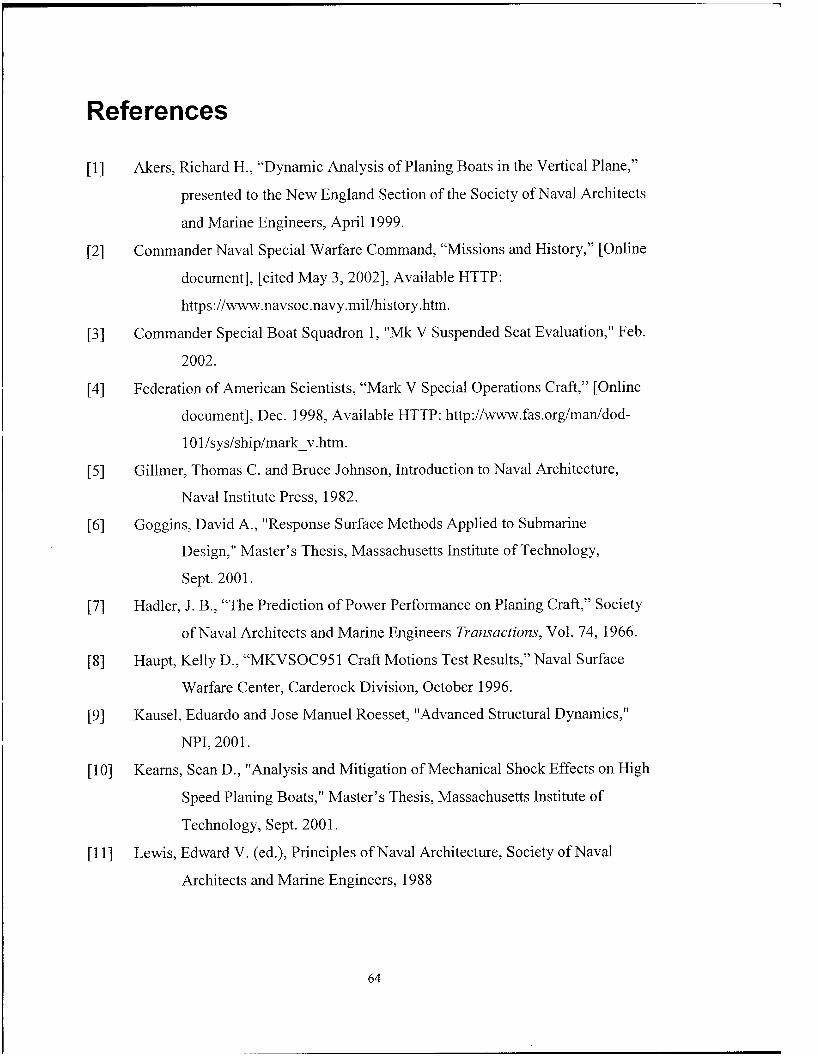
References
Akers, Richard H., “Dynamic Analysis of Planing Boats in the Vertical Plane,”
presented to the New England Section of the Society of Naval Architects
and Marine Engineers, April 1999.
Commander Naval Special Warfare Command, “Missions and History,” [Online
document], [cited May 3,20021, Available HTTP:
https://www.navsoc.navy.mil/history.htm.
Commander Special Boat Squadron 1 , “Mk V Suspended Seat Evaluation,” Feb.
2002.
Federation of American Scientists, “Mark V Special Operations Craft,” [Online
document], Dec. 1998, Available HTTP: http://www.fas.org/man/dod-
10 1 /sys/ship/mark-v.htm.
Gillmer, Thomas C. and Bruce Johnson, Introduction to Naval Architecture,
Naval Institute Press, 1982.
Goggins, David A., “Response Surface Methods Applied to Submarine
Design,” Master’s Thesis, Massachusetts Institute of Technology,
Sept. 2001.
Hadler, J. B., “The Prediction of Power Performance on Planing Craft,” Society
of Naval Architects and Marine Engineers Transactions, Vol. 74, 1966.
Haupt, Kelly D., “MKVSOC95 1 Craft Motions Test Results,” Naval Surface
Warfare Center, Carderock Division, October 1996.
Kausel, Eduardo and Jose Manuel Roesset, “Advanced Structural Dynamics,”
NPI, 2001.
Kearns, Sean D., “Analysis and Mitigation of Mechanical Shock Effects on High
Speed Planing Boats,” Master’s Thesis, Massachusetts Institute of
Technology, Sept. 200 1.
Lewis, Edward V. (ed.), Principles of Naval Architecture, Society of Naval
Architects and Marine Engineers, 1988
64

Peterson, Ronald, David Wyman and Carolyn Frank, “Drop Tests to Support
Water Impact and Planing Boat Dynamics Theory,” CSS/TR-97/25,
Coastal Systems Station, Dahlgren Division Naval Surface Warfare
Center, Panama City, FL, Sept. 1997.
Peterson, Ronald and R. Gollwitzer, “Shock Mitigation for HSPBs,“ Coastal
Systems Station, Dahlgren Division, Naval Surface Warfare Center,
Panama City, FL, Dec. 2000.
Prusaczyk, Keith W., “Biomedical Aspects of NS W Special Boat Operations,”
Office of Naval Research, 2000.
SAS Institute, JMP Statistical Discovery Software User’s Manuals, 2000.
Savitsky, Daniel, “Hydrodynamic Design of Planing Hulls,” Marine Technology,
Vol. 1 , No. 1 , Society of Naval Architects and Marine Engineers, 1964.
Savitsky, Daniel and P. Ward Brown, “Procedures for Hydrodynamic Evaluation
of Planing Hulls in Smooth and Rough Water,” Marine Technology, Vol.
13, No. 4, Society of Naval Architects and Marine Engineers, 1976.
Schmidt, Stephen R. and Robert G. Launsby, Understanding Industrial
Experiments, Air Academy Press and Associates, 4‘h edition, 1988.
von Gierke, Henning E. and Anthony J. Brammer, Shock and Vibration
Handbook, Fourth Edition, ed. Cyril M. Harris, McGraw-Hill, New
York, 1999.
von Kannan, Theodore, “The Impact of Seaplane Floats during Landing,” NACA
Technical Note 321 , 1929.
Vorus, William S. and Richard Royce, “Wave Impact Reduction of Planing
Boats,”University of New Orleans, 1999.
Zhao, R., 0. Faltinsen and J. Aarsnes, “Water Entry of Arbitrary Two-
Dimensional Section With and Without Flow Separation,” 2 1 St
Symposium on Naval Hydrodynamics, Trondheim, Norway, 1996.
65