Embed Size (px)
Citation preview

Available online at www.sciencedirect.com
ARTICLE IN PRESS
www.elsevier.com/locate/asr
Advances in Space Research xxx (2010) xxx–xxx
Optimal combination of InSAR and GPS for measuringinterseismic crustal deformation
Meng Wei a,*, David Sandwell a, Bridget Smith-Konter b
a Scripps Institution of Oceanography, University of California San Diego, 9500 Gilman Dr., La Jolla, CA 92093-0225, USAb Department of Geological Science, University of Texas at El Paso, EL Paso, TX 79912, USA
Received 18 November 2009; received in revised form 9 March 2010; accepted 10 March 2010
Abstract
High spatial resolution measurements of interseismic deformation along major faults are critical for understanding the earthquakecycle and for assessing earthquake hazard. We propose a new remove/filter/restore technique to optimally combine GPS and InSARdata to measure interseismic crustal deformation, considering the spacing of GPS stations in California and the characteristics of interse-ismic signal and noise using InSAR. To constrain the longer wavelengths (>40 km) we use GPS measurements, combined with a dislo-cation model, and for the shorter wavelength information we rely on InSAR measurements. Expanding the standard techniques, whichuse a planar ramp to remove long wavelength error, we use a Gaussian filter technique. Our method has the advantage of increasing thesignal-to-noise ratio, controlling the variance of atmosphere error, and being isotropic. Our theoretical analysis indicates this techniquecan improve the signal-to-noise ratio by up to 20%. We test this method along three segments of the San Andreas Fault (Southern sectionnear Salton Sea, Creeping section near Parkfield and Mojave/Big Bend section near Los Angeles), and find improvements of 26%, 11%and 8% in these areas, respectively. Our data shows a zone of uplift to the west of the Creeping section of the San Andreas Fault and anarea of subsidence near the city of Lancaster. This work suggests that after only 5 years of data collection, ALOS interferograms willprovide a major improvement in measuring details of interseismic deformation.� 2010 COSPAR. Published by Elsevier Ltd. All rights reserved.
Keywords: GPS; InSAR; Crustal deformation; PBO; Interseismic deformation; ALOS; ERS
1. Introduction
Recent studies (Smith-Konter and Sandwell, 2009) pro-pose that near-fault strain rate (an indirect measure of stressrate) is inversely proportional to the earthquake recurrenceinterval, thus it is important to measure the variations instrain rate along all active faults. Strain rate is the spatialderivative of the velocity field (Jin and Park, 2006; Payneet al., 2008); so to be useful, geodetic measurements musthave both high precision (�1 mm/yr) and high spatial reso-lution (�0.5 km) (Smith-Konter et al., 2008). In addition,strain rate maps must span the full length of a fault system(�2000 km). A comparison of strain rate maps of the San
0273-1177/$36.00 � 2010 COSPAR. Published by Elsevier Ltd. All rights rese
doi:10.1016/j.asr.2010.03.013
* Corresponding author. Tel.: +1 858 822 4347.E-mail address: [email protected] (M. Wei).
Please cite this article in press as: Wei, M., et al. Optimal combination of InSpace Res. (2010), doi:10.1016/j.asr.2010.03.013
Andreas Fault (SAF), produced by 10 different researchgroups, using basically the same GPS velocity measure-ments, reveals that modeled strain rate can differ by factorsof 5–8 times, with the largest differences occurring alongthe most active parts of the SAF (Sandwell et al., 2009).These large differences in estimated strain rate are not relatedto errors in vector GPS measurements but are due to the dif-ferences in methods used to construct a high resolutionmodel using sparse GPS data sampling (�10 km). To achievea 0.5-km spatial sampling of deformation measurementsrequires either a dramatic densification of the GPS velocitymeasurements, which is costly and therefore unlikely to takeplace, or the use of a higher resolution technique, such asinterferometric synthetic aperture radar (InSAR).
GPS and InSAR are highly complementary methods formeasuring surface deformation. GPS data provides high
rved.
SAR and GPS for measuring interseismic crustal deformation. J. Adv.

2 M. Wei et al. / Advances in Space Research xxx (2010) xxx–xxx
ARTICLE IN PRESS
precision (mm/yr) vector displacements at high temporalsampling rates and a moderate spatial sampling(�10 km). Because of its high precision and availabilityin our study region along the San Andreas Fault, GPS datahave been used to study large-scale interseismic surfacedeformation, as well as to improve our understanding offault zone deformation process (Feigl et al., 1993; Bennettet al., 1996; Segall and Davis, 1997; Smith and Sandwell,2003; Meade and Hager, 2005; Jin et al., 2007; Wdowinskiet al., 2007). The main weakness of using only GPS arraydata is that the spacing of, for example, the continuousGPS stations (CGPS) of the EarthScope Plate BoundaryObservatory (PBO) project, is not adequate for resolvinghigh velocity gradients (i.e., areas of high strain rate) whichusually occur near active faults. Alternatively, InSAR datahas sub-cm precision, a moderate temporal sampling rate(�10–50 days) and a high spatial sampling (�100 m), sotheoretically it could provide the short spatial scale infor-mation currently lacking in CGPS data.
There have been many investigations that combine GPSand InSAR to optimally measure coseismic deformation(Massonnet et al., 1993, 1994; Peltzer et al., 1994; Zebkeret al., 1994; Sandwell et al., 2000; Agnew et al., 2002;Jonsson et al., 2002; Simons et al., 2002; Fialko, 2004b;Johanson et al., 2006; Tong et al., 2010), post-seismicdeformation (Massonnet et al., 1994, 1996; Peltzer et al.,1996; Pollitz et al., 2001; Fialko, 2004a; Johanson et al.,2006), interseismic deformation (Fialko, 2006), landslides(Rotta and Naglerb, 2006), seismic damage in urban area(Sugaa et al., 2001), and volcano deformation (Tomiyamaet al., 2004; Sandwell et al., 2008). Methods for processingand stacking the InSAR data are described in many previ-ous studies (Goldstein and Werner, 1998; Massonnet andFeigl, 1998; Sandwell and Price, 1998; Burgmann et al.,2000; Rosen et al., 2000; Ferretti et al., 2001; Hanssen,2001).
The standard method for combining GPS and InSARdata involves removal of a reference model from each inter-ferogram (usually based on GPS). Then a planar ramp isremoved to minimize the orbit and other long wavelengtherrors. Next, the residual phase of the interferograms isaveraged (stacking). Finally, the reference model is addedback to the normalized stack.
This paper is a minor variant on this basic approachwhere we use a high-pass filter rather than removing aramp to reduce the long wavelength errors in the InSAR
Fig. 1. Flow chart for combining InSAR and G
Please cite this article in press as: Wei, M., et al. Optimal combination of InSpace Res. (2010), doi:10.1016/j.asr.2010.03.013
data (Fig. 1). We call this process remove/filter/restore.There are several advantages of our technique. First, the fil-ter not only removes the long wavelength error, but alsoreduces the intermediate wavelength atmospheric error.Second, the filtering method gives us more control overthe variance of atmospheric noise. Moreover, the filteringhas the benefit of being isotropic. It is independent of thenumber of frames used in the analysis, whereas in the rampmethod the length scale of the polynomial depends on thesize and shape of the area.
2. Technique design and theoretic performance
We develop and test our proposed technique, with afocus on measuring interseismic deformation along theSAF. First, we determine the optimal wavelength of the fil-ter by analyzing the characteristic spacing of the GPS sta-tions. Second, we estimate the effect of filtering on bothatmospheric noise and interseismic signal, to bracket theeffects of signal-to-noise ratio. Finally, in order to test ifour method is an improvement over the standard tech-niques, we use both methods to combine GPS and InSARdata and compare the results in three areas: the Salton Seaarea in Southern California, Parkfield in Central Californiaand the Mojave/Big Bend section of the SAF in SouthernCalifornia. Our overall objective is to determine howhigh-pass filtering of the InSAR data improves the sig-nal-to-noise ratio and to estimate how many interfero-grams are required for a signal-to-noise ratio to exceed 1along a particular fault segment.
2.1. Optimal wavelength
Our first step is to determine the minimum deformationwavelength that can be resolved by GPS stations in Califor-nia. Using a nearest-neighbor analysis of the distancebetween the GPS stations (Fig. 2b), we find mean and med-ian distances of 8.8 and 6.5 km, respectively. In addition,we calculate the distance from all of the GPS stations tothe nearest location on the SAF and compile histogramsof the spatial distribution of the GPS stations (Fig. 2cand d). We normalize the cumulative histogram to findthe characteristic distance from GPS stations to the pri-mary SAF (Fig. 2c and d). We use a 5-km bin size forthe histograms and subdivide the SAF into �200 segmentsalong its entire 1000 km length. Thus, we divide the num-
PS using the remove/filter/restore method.
SAR and GPS for measuring interseismic crustal deformation. J. Adv.

Fig. 2. GPS spacing in California, including EarthScope PBO and campaign GPS. (a) GPS distribution in California and the San Andreas Fault projectedinto pole of rotation (PoR) coordinates (Wdowinski et al., 2007). The dashed line is the main trace of the SAF and the dots are GPS stations used in thisstudy. (b) Histogram of relative distance between GPS stations. The bin size is 5 km. (c1) Histogram of distance from GPS stations to the SAF with 5 kmbins. The cumulative histogram (c2) is normalized in a way that divides the number of stations within a given distance from the fault by the number ofsegments (200) the SAF (c3 and c4 (zoomed view)). (d) Normalized cumulative histograms for four groups: (d1) Northern California (marked in (a) with y-axis ranging from 950 to 1300 km); (d2) Central California near Parkfield (850–950 km); (d3) Carrizo and Big Bend (700–850 km); (d4) SouthernCalifornia (400–700 km). On average, the distance of one GPS station to the SAF, available in area d2, is 0–5 km and other three areas are 5–10 km.
M. Wei et al. / Advances in Space Research xxx (2010) xxx–xxx 3
ARTICLE IN PRESS
ber of GPS stations within a 5-km region by 200 and getthe average number of GPS stations within 5 km segments.Based on these analyses, the characteristic spacing of GPSstations in California is 5–10 km. We ask, given this char-acteristic spacing of the current GPS array what is the min-imum spatial wavelength we can measure? Assuming auniform spacing, the minimum resolvable wavelength istwice of the sample spacing. With non-uniform spacing,which is a more accurate representation of the GPS sta-tions in California, the minimum resolvable wavelengthshould be 3–4 times of the mean sample spacing. Therefore,the average minimum wavelength of the signal that theGPS array can resolve is about 15–40 km. We chose thehigher end, 40 km, as the wavelength of the filter we usein the following sections in this study.
Fig. 3. The variance of the filtered atmospheric noise for filters withdifferent wavelength. The inset figure is a zoomed in view at 0–100 kmalong the x-axis, where the grey box indicates the 40 km wavelengthvariance cutoff.
2.2. Effect of filtering on noise
The main sources of noise for InSAR measurements areorbital, atmospheric, ionospheric, topographic, unwrap-ping and decorrelation errors (Hanssen, 2001). Ionosphereerrors in California and orbital errors are typically globalin scale (> �100 km), so they produce a ramp across a sin-gle 100 km � 100 km interferogram and the ramp is com-monly removed/adjusted to the far-field velocity fromGPS or tectonic models. The dominant error at scales less
Please cite this article in press as: Wei, M., et al. Optimal combination of InSpace Res. (2010), doi:10.1016/j.asr.2010.03.013
than or equal to the swath width of an interferogram(< �100 km) is the atmospheric delay, which is mostlyrelated to spatial variations in atmospheric water vapor.Previous researchers have used various techniques to esti-mate or reduce the errors from the atmospheric delay,including statistical analysis (Goldstein, 1995; Emardsonet al., 2003; Lohman and Simons, 2005), stacking indepen-
SAR and GPS for measuring interseismic crustal deformation. J. Adv.

4 M. Wei et al. / Advances in Space Research xxx (2010) xxx–xxx
ARTICLE IN PRESS
dent data (Schmidt et al., 2005), applying a weighted powerspectral density filter (Ferretti et al., 2000; Schmidt andBurgmann, 2003), and correction using empirical methods(Elliott et al., 2008) or models derived from external data(Li et al., 2006; Doin et al., 2009). The limitation of usingatmospheric delay models is that their resolution is usuallytoo coarse. For example, the resolution is 1.125� forERA40 (Uppala et al., 2005) and 32 km for the NorthAmerican Regional Reanalysis (Mesinger et al., 2006).Here, we propose to use a Gaussian filter to reduce theatmospheric noise in InSAR data.
We determine the effect of spatial filtering on the atmo-spheric noise based on published noise models (Hanssen,2001; Emardson et al., 2003) and mathematic derivations.A detailed process of this method is described in Appendix
Fig. 4. (a–c) East, north and vertical velocities from combined dislocationTopography shaded map of the research area. Grey boxes show the locationsMF, Maacama fault; SHF, Superstition Hills fault; IF, Imperial fault. (e aninterferometry at 23� look angle and (g and h) ALOS interferometry at a 34.3�stations. Black boxes in ERS descending and ALOS ascending are the InSAR
Please cite this article in press as: Wei, M., et al. Optimal combination of InSpace Res. (2010), doi:10.1016/j.asr.2010.03.013
A and the result is shown in Fig. 3. Although the varianceof atmospheric noise varies between different interfero-grams, based on GPS data Emardson et al. (2003) founda typical value of 2500 mm2. The variance of the filteredatmospheric noise decreases after being high-pass filtered.Based on our calculation, the variance decreases from100 mm2 with a Gaussian filter with a 0.5 gain wavelengthof 100 km to 36 mm2 with a Gaussian filter of 40 km.Later, we use this noise model to estimate how signal-to-noise ratio change with filter wavelength.
2.3. Effect of filtering on interseismic signal
The interseismic signal of the SAF can be estimatedfrom dislocation models partly constrained by GPS data
model and spline fit. White soild lines represent the major faults. (d)of InSAR data used in this study. Fault names are abbreviated as follows:d f) Line-of-sight velocity for ascending and descending passes of ERS
look angle. Modeled faults are shown in white. Black triangles are the GPSused in this study, same as grey boxes in (d).
SAR and GPS for measuring interseismic crustal deformation. J. Adv.

M. Wei et al. / Advances in Space Research xxx (2010) xxx–xxx 5
ARTICLE IN PRESS
(Fig. 4; Appendix B). Our models suggest the horizontalvelocity components have 40 km and larger scale variationsin associated with a spline fit superimposed on the large-scale pattern generated by dislocation motion at depth.Our vertical velocity models only include the large-scaledislocation pattern, and show mostly small velocitiesexcept along the compressional bends of the SAF northof Los Angeles, as well as the small extensional bends southof the Salton Sea and in the Cierro Prieto geothermal area,where subsidence can exceed 3 mm/yr. We believe that ourdislocation model, or any dislocation model having varia-tions in locking depth, provides a reasonable estimate ofthe spatial variations in the true velocity field. To deter-mine the expected base model for InSAR data, the 3Dvelocity model is projected into the InSAR line-of-sight(LOS) direction for both ERS and ALOS, most commonlyused InSAR satellite so far (Fig. 4). Our results show thatbecause of the fault geometry, descending tracks are moresensitive to fault. High-pass filtering of the LOS models at40 km wavelength reveals a signal that is outside the bandrecoverable by GPS point measurements (Fig. 5b2). Ourhigh-pass filtered velocity has the largest variations nearthe SAF. The amplitude of the filtered LOS velocitydecreases as the wavelength of the high-pass filter isdecreased. The 40 km optimal wavelength, as determinedfrom the characteristic spacing of GPS stations in Califor-nia, results in high-pass filtered residual rates of <5 mm/yr.Based on this analysis, the stacked interferograms need to
Fig. 5. Filter effect on interseismic signal observed by ALOS ascending intedeformation model constrained by GPS data. A constant look angle (34.5�) is unumber on the top right corner (20, 40, 60, 80 km) is the 0.5 gain wavelength ofsee Fig. 3a) respond to different filter wavelengths. (c1) Maximum signal as a fuwavelength. As the data shows, filtering can increase the signal-to-noise ratio
Please cite this article in press as: Wei, M., et al. Optimal combination of InSpace Res. (2010), doi:10.1016/j.asr.2010.03.013
have a precision better than 5 mm/yr in order to providenew information on the interseismic velocity field.
2.4. Effect of filtering on signal-to-noise ratio
Our next step is to estimate how filtering affects the sig-nal-to-noise ratio of InSAR data measuring the interseis-mic deformation. In general, filtering will tend todecrease the amplitude for both signal and noise, but canincrease the signal-to-noise ratio (Fig. 5c). We use the dis-location model described in Appendix B as the expectedsignal and the noise model described in Appendix A asthe expected noise. The amplitude and wavelength of thesignal is different along different faults in California. Weselected four regions to quantify the effect of the filteringon signal-to-noise ratio: the Maccaama fault in NorthernCalifornia, the Creeping section of the SAF in Central Cal-ifornia, the Mojave/Big Bend in Southern California andthe Imperial fault in Southern California (Fig. 5c). Themaximum positive signal with these four areas is plottedversus the wavelength of the filter. We find that in all fourareas the signal-to-noise ratio increases as the wavelengthdecreases, however the change in the signal-to-noise ratiois greatest along Creeping section because of the step-likesignal due to fault creep, showing an increase of 20% usinga 40-km wavelength filter. The importance of the SNRcurve (Fig. 5c) is the trend but not the absolute value.The SNR is computed from a single interferogram with a
rferograms. (a) A synthetic ALOS ascending interferogram based on ased here. (b1–4) Filtered interferograms with different Gaussian filters. Thethe Gaussian filter. (c1–2) Relationship of how the four different areas (1–4,nction of filter wavelength. (c2) Signal-to-noise ratio as a function of filterby as much as 20% compared to no filtering.
SAR and GPS for measuring interseismic crustal deformation. J. Adv.

6 M. Wei et al. / Advances in Space Research xxx (2010) xxx–xxx
ARTICLE IN PRESS
1-year interval, and therefore the SNR value is typicallyless than 1. However, we can increase the SNR by stackingmultiple interferograms from more than 1-year intervals.
2.5. Test the new technique in three areas
We next test this method with real data, by processing14 ERS-1/2 descending interferograms near the SaltonSea spanning 1992–2008 (Fig. 6a), 6 ALOS ascending inter-ferograms near the Creeping section of SAF spanning2006–2009 (Fig. 6b), and 12 ALOS ascending interfero-grams near the Mojave/Big Bend section of the SAF span-ning 2006–2009 (Fig. 6c). We selected these three areasbecause of the observed active faults and crustal motion,thus providing an adequate setting for testing our tech-nique. ERS data covers more than 10 years near the SaltonSea and is provided by the European Space Agencythrough the WINSAR archive. For the ERS data at theSalton Sea area, we processed two frames, 2925 and2943, to better estimate the long wavelength error. Thereare 14 ERS descending interferograms with average timeintervals of 3–5 years available. ALOS data are providedby JAXA and obtained through the Alaska Satellite Facil-
Fig. 6. InSAR data used in this study for the Salton Sea region in Southern CMajave/Big Bend fault region in Southern California. (a) ERS descending daLanders and Hector Mine earthquakes, and the 2006 creep event on the Supetime intervals of 3–5 years are available for use. (b) ALOS ascending data (Traascending interferograms with average time intervals about 1.5–2 years are aMajave/Big Bend fault region. Twelve interferograms with average time interv
Please cite this article in press as: Wei, M., et al. Optimal combination of InSpace Res. (2010), doi:10.1016/j.asr.2010.03.013
ity, as well as the ALOS User Interface Gateway (AUIG).Since ALOS only has limited acquisition in California andthe baseline has been drifting by more than 6 km followingthe launch in February 2006 through early 2008, we onlyidentified 6 interferograms near the Creeping section ofSAF suitable for this study, but 12 interferograms wereavailable in the Mojave/Big Bend fault region. One of themajor advantages of using the longer wavelength L-banddata with respect to the C-band data is that for small defor-mations, a plane can be removed from the residual interfer-ograms to remove any possible phase wrap. Thereforephase unwrapping is not needed, allowing the entire areaof interferogram be used in the stack. The InSAR datawas processed using SIOSAR software (Wei et al., 2009),and SRTM data were used to remove the effects oftopography.
We processed these data with two methods: filtering theresidual and removing a ramp. A Gaussian filter with a halfgain at 40 km was used in the first method. For the remov-ing a ramp method, both quadratic (Wright et al., 2004)and linear plane (Gourmelen et al., 2007) have been used,depending on how many frames were processed. Here, weused a 6-parameter quadratic plane to fit the ramp.
alifornia, the Creeping section of the SAF in Central California and theta (Track 356 Frame 2943/2925). The dashed lines label the times of therstition Hills fault. Fourteen ERS descending interferograms with averageck 220 Frame 700/710) along the Creeping section of the SAF. Six ALOS
vailable for use. (c) ALOS ascending data (Track 216 Frame 680) in theal of 2 years are available for use.
SAR and GPS for measuring interseismic crustal deformation. J. Adv.

Fig. 7. Interferograms using the filtering method in the three areas: the Salton Sea, the Creeping section of the SAF and the Mojave/Big Bend fault region.(a, d and g) Base model constrained by the GPS data. (b, e and h) Stacked residual interferograms after applying the filtering method. (c, f and i) The finalinterferogram is the sum of base model and the residual interferogram. Black solid line shows the main fault trace of the San Andreas Fault andSuperstition Hills Fault. Black dots show the other secondary faults. Grey solid lines show the locations of the profiles in Fig. 8. White arrow indicates thesatellite look direction. Black boxes in (b, e and h) highlight the area with short wavelength signals. Two insets in (b) show creep of the SAF and the SHF,with a different color scale.
M. Wei et al. / Advances in Space Research xxx (2010) xxx–xxx 7
ARTICLE IN PRESS
The InSAR contribution to the measurement of a shortwavelength signal is shown for three focus areas (Fig. 7).Far from the fault, the velocity largely matches the GPS-based model whereas the interferograms sometimes pro-
Please cite this article in press as: Wei, M., et al. Optimal combination of InSpace Res. (2010), doi:10.1016/j.asr.2010.03.013
vide new details near the fault (for example, fault slip nearthe Superstition Hills fault in Fig. 7b, fault creep and localuplift in Fig. 7e, and local subsidence due to ground waterextraction in Fig. 7b and h). Another way to show the con-
SAR and GPS for measuring interseismic crustal deformation. J. Adv.

Fig. 8. Profiles across main faults in three study areas. Arrows identify short wavelength signals that are absent in GPS data. All InSAR data is one-dimensional low pass filtered with a Gaussian filter of 500 m wavelength. This 1D filter is different from the filter we used as the filter versus ramptreatment of the data.
8 M. Wei et al. / Advances in Space Research xxx (2010) xxx–xxx
ARTICLE IN PRESS
tribution of InSAR is to look at the profiles of the interfer-ograms in our three study areas (Fig. 8). The profile acrossthe Superstition Hills Fault (SHF) in the Salton Trough isabout 1 km wide (fault parallel direction) and 30 km long,whereas other profiles are �1 km wide and 80 km long. Forillustrative purposes, to compare the InSAR data of theCreeping and Mojave/Big Bend areas (which are rathernoisy) with base model profiles, the InSAR data profilesare robustly filtered with a Gaussian filter with 500 m(i.e., where we replace outliers with a median value duringfiltering). The profiles for the Salton Sea region have veryhigh signal-to-noise ratio and this additional filtering stepis not necessary. In the Salton Sea area, as the profilesshow, step-like signal near the SAF and the SHF exist,which have been previously studied (Lyons and Sandwell,2003; Fialko, 2006; Wei et al., 2009). In the Creeping sec-tion of the SAF, a possible uplift with amplitude of about1 cm/yr is observed, although it could be an anomalycaused by two strands of the fault trace. In the Mojave/Big Bend area, we find subsidence of 1 cm/yr, which isprobably due to ground water extraction (Peltzer et al.,
Please cite this article in press as: Wei, M., et al. Optimal combination of InSpace Res. (2010), doi:10.1016/j.asr.2010.03.013
2001). As shown in Figs. 7 and 8, InSAR can reveal shortwavelength signals that GPS data miss.
We compare the results of residual filtering and rampremoval using ERS and ALOS data, as well as the GPSdata (Fig. 9 and Table 1). For the GPS data comparison,only PBO sites are used because they have both horizontaland vertical measurements. Three components of the PBOGPS measurements are projected into the LOS. In the Sal-ton Sea area (Fig. 9c), the difference between the ramp andfilter method is mainly caused by long wavelength coseis-mic deformation from the 1992 Landers and 1999 HectorMine earthquakes, both of which are not accuratelyincluded in our base model. For the Creeping section(Fig. 9f), the difference between the two methods is a roundshape anomaly with a diameter of 50 km and amplitude of3–4 mm/yr. Significant differences between the GPS andinterferogram velocities are mainly located in the lowerpart of the image, with a maximum of 10 mm/yr. However,the difference in the filtered interferogram is smaller for sev-eral stations in the middle of the image. For the data nearthe Mojave/Big Bend fault region (Fig. 9i), two areas of
SAR and GPS for measuring interseismic crustal deformation. J. Adv.
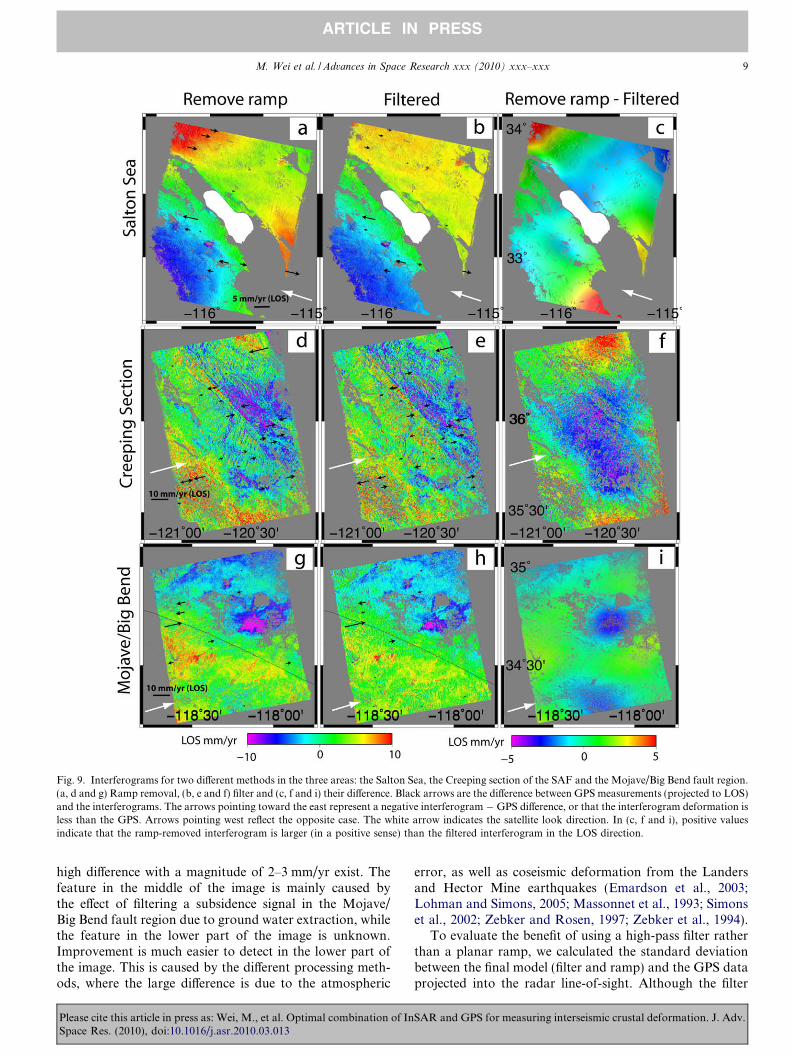
Fig. 9. Interferograms for two different methods in the three areas: the Salton Sea, the Creeping section of the SAF and the Mojave/Big Bend fault region.(a, d and g) Ramp removal, (b, e and f) filter and (c, f and i) their difference. Black arrows are the difference between GPS measurements (projected to LOS)and the interferograms. The arrows pointing toward the east represent a negative interferogram � GPS difference, or that the interferogram deformation isless than the GPS. Arrows pointing west reflect the opposite case. The white arrow indicates the satellite look direction. In (c, f and i), positive valuesindicate that the ramp-removed interferogram is larger (in a positive sense) than the filtered interferogram in the LOS direction.
M. Wei et al. / Advances in Space Research xxx (2010) xxx–xxx 9
ARTICLE IN PRESS
high difference with a magnitude of 2–3 mm/yr exist. Thefeature in the middle of the image is mainly caused bythe effect of filtering a subsidence signal in the Mojave/Big Bend fault region due to ground water extraction, whilethe feature in the lower part of the image is unknown.Improvement is much easier to detect in the lower part ofthe image. This is caused by the different processing meth-ods, where the large difference is due to the atmospheric
Please cite this article in press as: Wei, M., et al. Optimal combination of InSpace Res. (2010), doi:10.1016/j.asr.2010.03.013
error, as well as coseismic deformation from the Landersand Hector Mine earthquakes (Emardson et al., 2003;Lohman and Simons, 2005; Massonnet et al., 1993; Simonset al., 2002; Zebker and Rosen, 1997; Zebker et al., 1994).
To evaluate the benefit of using a high-pass filter ratherthan a planar ramp, we calculated the standard deviationbetween the final model (filter and ramp) and the GPS dataprojected into the radar line-of-sight. Although the filter
SAR and GPS for measuring interseismic crustal deformation. J. Adv.

Table 1Misfit between base model, filtered InSAR, ramp removed InSAR and PBO GPS stations. Three components of GPS velocity are projected to the satelliteline-of-sight direction.
Number ofinterferograms
Number of PBOGPS stations
Misfit to GPS (LOS mm/yr)
Base model InSAR filter InSAR ramp Improvement(filter versus ramp) (%)
Salton Sea 14 18 2.5 2.6 3.5 26Creeping section 6 35 2.7 3.4 3.8 11Mojave/Big Bend 12 13 3.7 4.0 4.3 8
10 M. Wei et al. / Advances in Space Research xxx (2010) xxx–xxx
ARTICLE IN PRESS
method produced a smaller misfit, the difference is not sta-tistically significant (Table 1). The greatest difference is inthe Salton Sea area (18 GPS, 2.6 mm/yr filter, 3.5 mm/yrramp), which is mostly due to fact that the ramp methodcannot effectively remove the coseismic deformation ofthe Landers and Hector Mine earthquakes in this dataset.A coseismic model is required to improve the misfit ifone wants to use the ramp method. Based on this analysis,it is not conclusive which technique is better or more accu-rate. However, the filtering method gives us more controlover the variance of atmospheric noise. Also the filteringis independent of the number of frames used in the analy-sis, while the ramp depends on the size and shape of thearea. In other words, the ramp will not be isotropic if thearea is not square, but filtering will always be isotropic.
Note that these standard deviations of both filtering andramp method are larger than the misfit between the modeland GPS data. This is expected because the combined solu-tion has many more degrees of freedom as represented byshorter wavelengths. We expect that the combined solutionwill provide a more accurate representation of the strainfield than using GPS alone.
3. Discussion
The spatial covariance parameter re in the model weadopted from Emardson et al. (2003) has variability, whichis reflected as different atmospheric noise level in interfero-grams. The range of the variability is not provided inEmardson et al. (2003). As shown in Eq. (A17), the vari-ability of re will affect the number of interferogramsrequired to resolve small interseismic signals. However, itwill not affect the advantage of the filtering technique aslong as the spatial characteristics of atmosphere are thesame.
The technique we outline in this work can be used toimprove our estimation and understanding of interseismicdeformation, especially along the section of the SAF northof Los Angeles in the next few years. In the arid areas ofSouthern California, previous C-band InSAR satellites,ERS1/2 and ENVISAT, have acquired numerous datasetsnow that are available for analysis. However, temporaldecorrelation due to vegetation has severely limited thistype of analysis along the northern section of the SAF.The improved temporal decorrelation from the JapaneseL-band satellite ALOS will allow us to apply InSAR in
Please cite this article in press as: Wei, M., et al. Optimal combination of InSpace Res. (2010), doi:10.1016/j.asr.2010.03.013
Northern California (Wei and Sandwell, 2010). However,the acquisition of ALOS in California is infrequent, at�2–4 images per year. At the time of this manuscript prep-aration (March, 2010), the ALOS dataset is not largeenough to provide better constraints on the interseismicdeformation. Based on our present calculations of thedeformation signal and noise of ALOS data, we estimatethat 5-years of ALOS data will be needed to improve theinterseismic models using InSAR. The greatest improve-ments will be in Northern California where GPS measure-ments are sparse. All processing and model codes utilizedhere are publicly available (http://topex.ucsd.edu).
4. Conclusions
We have developed a remove/filter/restore technique tocombine GPS and InSAR data optimally. This technique isbased on the analysis of the spacing of EarthScope PBOand campaign GPS, and the characteristics of the signaland noise in InSAR data. We estimate the improvementsof signal-to-noise ratio in InSAR data for measuring interse-ismic deformation in California. Because the residualinterseismic signal and noise have different scale dependen-cies, filtering an interferogram can increase the signal-to-noise ratio by as much as 20%. Applying this procedure toa large stack of ERS1/2 interferograms in the Salton Sea,Southern California and ALOS interferograms near Park-field, Central California and Mojave Desert/Big Bend,Southern California, we find improvements in all three areasusing the new technique. Our analysis shows that ALOS datawill be able to make major contributions toward measuringinterseismic deformation after collecting data for 5 years inorbit.
Appendix A. The effect of high-pass filtering on atmospheric
error
Assume the phase of the interferogram pðx*Þ has twoparts:
pðx*Þ ¼ sðx*Þ þ nðx*Þ ðA1Þ
where x*
is two-dimensional spatial vector, sðx*Þ is the defor-mation signal and nðx*Þ is the atmospheric noise. Here wefocus on the atmospheric noise, which is assumed station-ary, random, and isotropic with zero mean.
SAR and GPS for measuring interseismic crustal deformation. J. Adv.

M. Wei et al. / Advances in Space Research xxx (2010) xxx–xxx 11
ARTICLE IN PRESS
The autocovariance of the noise is
Cðx*Þ ¼Z Z
nðx*oÞnðx*�x
*oÞd2 x
*o ðA2Þ
where the integrals are performed over the area A of theinterferogram.
By definition, the variance of the noise is
d2 ¼ Cð0; 0Þ ¼Z Z
n2ðx*Þd2 x* ðA3Þ
and the standard deviation of the noise is
rnoise ¼ffiffiffiffiffiffiffiffiffiffid2=A
qðA4Þ
Now suppose that we filter the noise using an isotropicfilter. What is the new filtered autocovariance functionand variance? The filtered noise is
nðx*Þ ¼Z Z
f ðj x*�x*
ojÞnðx*
oÞd2 x*
o ðA5Þ
where f ðj x* jÞ is a real-valued isotropic filter. Note that theFourier transform of the autocovariance function is thepower spectrum and is given by
Cðk*
Þ ¼ Nðk*
ÞN �ðk*
Þ ðA6Þ
where Nðk*
Þ ¼R R
nðx*Þe�2pið k*� x*Þd2 x
*.
Now we want to compute the autocovariance functionand the variance of the filtered noise. The power spectrumof the filtered autocovariance is
Cðk*
Þ ¼ Nðk*
ÞN �ðk*
Þ ¼ ðNðk*
ÞF ðj k*
jÞÞðNðk*
ÞF ðj k*
jÞÞ�
¼ F 2ðj k*
jÞNðk*
ÞN �ðk*
Þ ðA7Þ
where F ðj k*
jÞ is the Fourier transform of the filter which isreal-valued and isotropic.
Using the convolution theorem, we can rewrite this as
Cðx*Þ ¼Z Z
Agðj x*�x
*ojÞCðx
*oÞd2 x
*o ðA8Þ
where gðj x* jÞ ¼ I�12 ðF 2ðj k
*
jÞÞ, and I2ðÞ and I�12 ðÞ are the
two-dimensional forward and inverse Fourier Transform.Then we assume that Cðx*oÞ is an isotropic function, sothe integration can be partly completed in cylindrical coor-dinates, where d2 x
* ¼ rdrdh. The integration becomes
CðrÞ ¼ 2pZ 1
0
gðjr � rojÞCðroÞrodro ðA9Þ
Next we use an autocovariance function of atmosphericnoise based on signal delays in the GPS data from South-ern California (Emardson et al., 2003). Their one-way noisevariance model is
r ¼ cLa þ kH ðA10Þ
where r is the square root of variance in mm, L is the dis-tance between two points in km and H is the height differ-ence in km. c, a and k are constants with value of 2.5, 0.5and 4.8, respectively, derived from the neutral atmospheric
Please cite this article in press as: Wei, M., et al. Optimal combination of InSpace Res. (2010), doi:10.1016/j.asr.2010.03.013
delays in GPS data in Southern California. This model isvalid over a range of 10–800 km for L and 0–3 km for H.While a is basically site-independent, c depends on the loca-tion on the Earth.
If e1 and e2 are the observation errors corresponding tothe observations d1 and d2, which are any two pixels withina given interferogram, the autocovariance between thesetwo errors are
Covðe1; e2Þ ¼1
2Varðe1Þ þ
1
2Varðe1Þ �
1
2Varðe1 � e2Þ
¼ r2e �
1
2r2 ðA11Þ
where r2e is defined as VarðeÞ ¼ 1
2Varðe1Þ þ 1
2Varðe1Þ. Based
on the GPS data, Emardson et al. (2003) find re is about50 mm and r is described as in Eq. (A10). Usually, thedependence of height difference can be dropped becauseit is much smaller than the distance dependence. Thenthe autocovariance function is
Covðe1; e2Þ ¼ r2e �
c2
2L2a ðA12Þ
Next, we use this function to calculate the covariance ofthe noise in a high-pass filtered interferogram. The Gauss-ian filter we use is
f ðj x* jÞ ¼ 1
2pg2e�j x
* j2
2g2 ¼ 1
2pg2e�x2þy2
2g2 ðA13Þ
where g is the standard deviation of the Gaussian distribu-tion and a characteristic wavelength. The Fourier trans-form of the Gaussian filter is
I2½f ðx*Þ� ¼
Z Z1
2pg2e�x2þy2
2g2 e�2pið k*� x*Þd2 x
*
¼ e�2p2g2ðk2xþk2
y Þ ðA14Þ
The inverse Fourier Transform of the squared FourierTransform of the Gaussian filter is
I�12 ½I
22½f ðx
*Þ�� ¼Z Z
ðe�2p2g2ðk2xþk2
y ÞÞ2e2pið k*� x*Þd2 k
*
¼ 1
4pg2e
x2þy2
4g2 ðA15Þ
We substitute Eqs. (A15) and (A12) into (A9). Then thefiltered autovariance function is
CðrÞ ¼ 2pZ Lmax
0
� 1
4pg2e�jr�ro j2
4g2 r2e �
c2
2ðr � roÞ2a
� �rodro ðA16Þ
where Lmax is the maximum distance that Eq. (A10) is valid,which equals 800 km in Southern California (Emardsonet al., 2003). We are most interested in the variance, whichis Eq. (A16) at r = 0. Since a ¼ 0:5 based on GPS data, theintegration is simplified to
SAR and GPS for measuring interseismic crustal deformation. J. Adv.

12 M. Wei et al. / Advances in Space Research xxx (2010) xxx–xxx
ARTICLE IN PRESS
Cð0Þ ¼ 2pZ Lmax
0
1
4pg2e� r2
o4g2 r2
e �c2
2ro
� �rodro
¼ r2e �
c2gffiffiffipp
2erf
Lmax
2g
� �ðA17Þ
This is the result of the low-pass filter. To get the high-passresult, we need to subtract Eq. (A17) from the originalvariance,
r2f ¼ r2
e � Cð0Þ ¼ c2gffiffiffipp
2erf
Lmax
2g
� �ðA18Þ
We substitute parameters in Eq. (A17) with values,re ¼ 50; Lmax ¼ 800; c ¼ 2:5, then the standard deviationof the noise in the high-pass filtered data is
rf ¼
ffiffiffiffiffiffiffiffiffiffiffiffiffiffiffiffiffiffiffiffiffiffiffiffiffiffiffiffiffiffiffiffiffiffiffiffiffiffiffiffiffi3:125g
ffiffiffipp
erf800
2g
� �s: ðA19Þ
Appendix B. Dislocation model
The vector velocity field cannot be completely resolvedwith point GPS measurements, so we use a dislocationmodel (1 km resolution), constrained by GPS velocities,to provide a complete vector field. We expect the modelto be accurate at large scales especially away from thefaults, but less accurate at smaller scales. We model theNorth American-Pacific plate boundary as a series of verti-cal connected fault dislocations imbedded in an elastic plateoverlying a viscoelastic half-space (Smith and Sandwell,2006). The dislocation model simulates interseismic strainaccumulation, coseismic displacement and post-seismic vis-cous relaxation of the mantle. However, when consideringthe recent average EarthScope PBO velocity field (2004–2009), the interseismic part of the model dominates. Threetypes of data are used to estimate the parameters of themodel: (1) long-term slip rates (i.e., over many earthquakecycles) are initially constrained by geologic estimates (Field,2007) and then adjusted to ensure that the sum of the slipacross the plate boundary is equal to the far-field estimateof 45 mm/yr. Slip rates are further adjusted to match con-temporary geodetic estimates of far-field slip (e.g., Bennettet al., 1996; Freymeuller et al., 1999; Becker et al., 2005;Meade and Hager, 2005; Fay and Humphreys, 2005; Fia-lko, 2006). (2) Rupture history on each fault segment isbased on historical accounts and paleoseismic recurrenceintervals (e.g., Field, 2007; Grant and Lettis, 2003; Weldonet al., 2004, 2005). We assume that the amount of coseismicslip for each event is equal to the accumulated slip deficit onthat segment. (3) Present-day crustal velocities are derivedfrom 1709 GPS estimates from EarthScope PBO, as wellas campaign GPS compiled by Corne Kreemer (Kreemeret al., 2009). An iterative least squares approach is usedto adjust the locking depth along each segment. For thismodel, we included interseismic slip on 41 fault segmentsover variable locking depths (ranging from 1 to 23 km),and assume the following model parameters: shear modu-
Please cite this article in press as: Wei, M., et al. Optimal combination of InSpace Res. (2010), doi:10.1016/j.asr.2010.03.013
lus (30 GPa), mantle viscosity (1e19 Pa s) and elastic platethickness (60 km). Best-fit models have an RMS residualvelocity misfit of 2.02 mm/yr in the E–W direction,2.69 mm/yr in the N–S direction and 2.73 mm/yr in the ver-tical direction.
Since the dislocation model with over 45 parameterscannot capture all of the tectonic and non-tectonicmotions, especially in areas away from model fault seg-ments, we fit the horizontal GPS residuals (using a 40 kmblock median) to a biharmonic spline using a tension factorof 0.45 (Wessel and Bercovici, 1998) weighted by the uncer-tainty in each GPS data point. The spline represents un-modeled fault motion at scales greater than 40 kmwavelength. After fitting the residual GPS velocities, thehorizontal data-model misfits are 1.47 mm/yr in the E–Wdirection and 1.56 mm/yr in the N–S direction.
References
Agnew, D.C., Owen, S., Shen, Z.K., Anderson, G., Svarc, J., Johnson, H.,Austin, K.E., Reilinger, R. Coseismic displacements from the HectorMine, California, earthquake: results from survey-mode GPS mea-surements. Bull. Seismol. Soc. Am. 92, 1355–1364, 2002.
Becker, T.W., Hardebeck, J.L., Anderson, G. Constraints on fault sliprates of the southern California plate boundary from GPS velocity andstress inversions. Geophys. J. Int. 160, 634–650, 2005.
Bennett, R.A., Rodi, W., Reilinger, R.E. Global Positioning Systemconstraints on fault slip rates in southern California and northernBaja, Mexico. J. Geophys. Res. 101, 21943–21960, 1996.
Burgmann, R., Rosen, P.A., Fielding, E.J. Synthetic aperture radarinterferometry to measure Earth’s surface topography and its defor-mation. Annu. Rev. Earth Planet. Sci. 28, 169–209, 2000.
Doin, M.P., Lasserre, C., Peltzer, G., Cavalie, O., Doubre, C. Correctionsof stratified tropospheric delays in SAR interferometry: validation withglobal atmospheric models. J. Appl. Geophys. 69, 35–50, 2009.
Elliott, J.R., Biggs, J., Parsons, B., Wright, T.J. InSAR slip ratedetermination on the Altyn Tagh Fault, northern Tibet, in thepresence of topographically correlated atmospheric delays. Geophys.Res. Lett 35, L12309, 2008.
Emardson, T.R., Simons, M., Webb, F.H. Neutral atmospheric delay ininterferometric synthetic aperture radar applications: statisticaldescription and mitigation. J. Geophys. Res 108, 2231, 2003.
Fay, N.P., Humphreys, E.D. Fault slip rates, effects of elasticheterogeneity on geodetic data, and the strength of the lower crustin the Salton Trough region, southern California. J. Geophys. Res9, 110, 2005.
Feigl, K.L., Agnew, D.C., Bock, Y., Dong, D., Donnellan, A., Hager,B.H., Herring, T.A., Jackson, D.D., Jordan, T.H., King, R.W. Spacegeodetic measurement of crustal deformation in central and southernCalifornia, 1984–1992. J. Geophys. Res. 98, 21677–21712, 1993.
Ferretti, A., Prati, C., Rocca, F. Nonlinear subsidence rate estimationusing permanent scatterers in differential SAR interferometry. IEEETrans. Geosci. Remote Sensing 38, 2202–2212, 2000.
Ferretti, A., Prati, C., Rocca, F. Permanent scatterers in SAR interfer-ometry. IEEE Trans. Geosci. Remote Sensing 39, 8–20, 2001.
Fialko, Y. Evidence of fluid-filled upper crust from observations ofpostseismic deformation due to the 1992 Mw7. 3 Landers earthquake.J. Geophys. Res. 109, B08401, 2004a.
Fialko, Y. Probing the mechanical properties of seismically active crustwith space geodesy: study of the coseismic deformation due to the 1992Mw 7.3 Landers (southern California) earthquake. J. Geophys. Res.109, B03307, 2004b.
Fialko, Y. Interseismic strain accumulation and the earthquake potentialon the southern San Andreas fault system. Nature 441, 968–971, 2006.
SAR and GPS for measuring interseismic crustal deformation. J. Adv.

M. Wei et al. / Advances in Space Research xxx (2010) xxx–xxx 13
ARTICLE IN PRESS
Field, E.H. A summary of previous working-groups on Californiaearthquake probabilities. B. Seismol. Soc. Am. 97 (4), 1033–1053,doi:10.1785/0120060048, 2007.
Freymueller, J.T., Murray, M.H., Segall, P., Castillo, D. Kinematics of thePacific North America plate boundary zone, northern California, J.Geophys. Res. 104, 7419–7441, 1999.
Goldstein, R. Atmospheric limitations to repeat-track radar interfero-metry. Geophys. Res. Lett. 22 (18), 2517–2520, 1995.
Goldstein, R.M., Werner, C.L. Radar interferogram filtering for geo-physical applications. Geophys. Res. Lett. 25, 4035–4038, 1998.
Gourmelen, N., Amelung, F., Casu, F., et al. Mining-related grounddeformation in Crescent Valley, Nevada: implications for sparse GPSnetworks. Geophys. Res. Lett. 34, L09309, doi:10.1029/2007GL029427,2007.
Hanssen, R.F. Radar Interferometry: Data Interpretation and ErrorAnalysis. Kluwer Academic Publishers, Dordrecht, 2001.
Jin, S.G., Park, P.H. Strain accumulation in South Korea inferred fromGPS measurements. Earth Planets Space 58 (5), 529–534, 2006.
Jin, S.G., Park, P.H., Zhu, W. Micro-plate tectonics and kinematics inNortheast Asia inferred from a dense set of GPS observations. EarthPlanet. Sci. Lett. 257, 486–496, doi:10.1016/j.epsl.2007.03.0112007,2007.
Johanson, I.A., Fielding, E.J., Rolandone, F., Burgmann, R. Coseismicand postseismic slip of the 2004 Parkfield earthquake from space-geodetic data. Bull. Seismol. Soc. Am. 96, 269–282, 2006.
Jonsson, S., Zebker, H., Segall, P., Amelung, F. Fault slip distribution ofthe 1999 Mw 7.1 Hector Mine, California, earthquake, estimated fromsatellite radar and GPS measurements. Bull. Seismol. Soc. Am. 92,1377–1389, 2002.
Kreemer, C., Blewitt, G., Hammond, W.C., Plag, H.A. High-resolutionstrain rate tensor model for the Western U.S., Presentation at theEarthScope Annual Meeting, Boise, Idaho, 2009.
Li, Z., Fielding, E.J., Cross, P., Muller, J.P. Interferometric syntheticaperture radar atmospheric correction: medium resolution imagingspectrometer and advanced synthetic aperture radar integration.Geophys. Res. Lett. 33, doi:10.1029/2005GL025299, 2006.
Lohman, R.B., Simons, M. Some thoughts on the use of InSAR datato constrain models of surface deformation: noise structure anddata downsampling. Geochem. Geophys. Geosyst. 6, Q01007,2005.
Lyons, S., Sandwell, D. Fault creep along the southern San Andreas frominterferometric synthetic aperture radar, permanent scatterers, andstacking. J. Geophys. Res. 108 (B1), 2047, doi:10.1029/2002JB001831,2003.
Massonnet, D., Feigl, K., Rossi, M., Adragna, F. Radar interferometricmapping of deformation in the year after the Landers earthquake.Nature 369, 227–230, 1994.
Massonnet, D., Feigl, K.L. Radar interferometry and its applicationto changes in the Earth’s surface. Rev. Geophys. 36, 441–500,1998.
Massonnet, D., Rossi, M., Carmona, C., Adragna, F., Peltzer, G., Feigl,K., Rabaute, T. The displacement field of the Landers earthquakemapped by radar interferometry. Nature 364, 138–142, 1993.
Massonnet, D., Thatcher, W., Vadon, H. Detection of postseismic fault-zone collapse following the Landers earthquake. Nature 382, 612–616,1996.
Meade, B.J., Hager, B.H. Block models of crustal motion in southernCalifornia constrained by GPS measurements. J. Geophys. Res. 110,B03403, 2005.
Mesinger, F., DiMego, G., Kalnay, K., et al. North American regionalreanalysis. Bull. Am. Meteorol. Soc. 87, 343–360, 2006.
Payne, S.J., McCaffrey, R., King, R.W. Strain rates and contemporarydeformation in the Snake River Plain and surrounding Basin andRange from GPS and seismicity. Geology 36, 647–650, 2008.
Peltzer, G., Crampe, F., Hensley, S., Rosen, P. Transient strain accumu-lation and fault interaction in the eastern California shear zone. Geol.Soc. Am. 29, 975–978, doi:10.1130/0091-7613(2001)029<0975:TSA-AFI>2.0.CO;2, 2001.
Please cite this article in press as: Wei, M., et al. Optimal combination of InSpace Res. (2010), doi:10.1016/j.asr.2010.03.013
Peltzer, G., Hudnut, K.W., Feigl, K.L. Analysis of coseismic surfacedisplacement gradients using radar interferometry: new insights intothe Landers earthquake. J. Geophys. Res. 99, 21971–21981, 1994.
Peltzer, G., Rosen, P., Rogez, F., Hudnut, K. Postseismic rebound in faultstep-overs caused by pore fluid flow. Science 273, 1202, 1996.
Pollitz, F.F., Wicks, C., Thatcher, W. Mantle flow beneath a continentalstrike-slip fault: postseismic deformation after the 1999 Hector Mineearthquake. Science 293 (5536), 1814–1818, 2001.
Rosen, P.A., Hensley, S., Joughin, I.R., Li, F.K., Madsen, S.N.,Rodriguez, E., Goldstein, R.M. Synthetic aperture radar interferom-etry. Proc. IEEE 88, 333–382, 2000.
Rotta, H., Naglerb, T. The contribution of radar interferometry to theassessment of landslide hazards. Adv. Space Sci. 37, 710–719, 2006.
Sandwell, D.T., Bird, P., Freed, A., et al. Comparison of strain-rate mapsof western North America, Presentation at the EarthScope AnnualMeeting, Boise, Idaho, 2009.
Sandwell, D.T., Myer, D., Mellors, R., Shimada, M. Accuracy andresolution of ALOS interferometry: vector deformation maps of thefather’s day intrusion at Kilauea. IEEE Trans. Geosci. RemoteSensing 46, 3524–3534, 2008.
Sandwell, D.T., Price, E.J. Phase gradient approach to stacking interfer-ograms. J. Geophys. Res. 103, 30183–30204, 1998.
Sandwell, D.T., Sichoix, L., Agnew, D., Bock, Y., Minster, J.B. Near real-time radar interferometry of the Mw 7.1 Hector Mine Earthquake.Geophys. Res. Lett. 27, 3101–3104, 2000.
Schmidt, D.A., Burgmann, R. Time-dependent land uplift and subsidencein the Santa Clara valley, California, from a large interferometricsynthetic aperture radar data set. J. Geophys. Res. 108, 2416, 2003.
Schmidt, D.A., Burgmann, R., Nadeau, R.M. Distribution of aseismic sliprate on the Hayward fault inferred from seismic and geodetic data. J.Geophys. Res 110, B08406, 2005.
Segall, P., Davis, J.L. GPS applications for geodynamics and earthquakestudies. Annu. Rev. Earth Planet. Sci. 25, 301–336, 1997.
Simons, M., Fialko, Y., Rivera, L. Coseismic deformation from the 1999Mw 7.1 Hector Mine, California, earthquake as inferred from InSARand GPS observations. Bull. Seismol. Soc. Am. 92, 1390–1402, 2002.
Smith, B., Sandwell, D. Coulomb stress accumulation along the SanAndreas Fault system. J. Geophys. Res. 108, 2296, 2003.
Smith, B.R., Sandwell, D.T. A model of the earthquake cycle along theSan Andreas Fault System for the past 1000 years. J. Geophys. Res.111, B01405, 2006.
Smith-Konter, B., Sandwell, D.T. Stress evolution of the San AndreasFault system: recurrence interval vs. locking depth. Geophys. Res.Lett. 36, doi:10.1029/2009GL037235, 2009.
Smith-Konter, B., Solis, T., Sandwell, D.T. Data-derived stress uncer-tainties of the San Andreas Fault System. EOS Trans. AGU 89 (53),Fall Meet. Suppl., U51B-0029, 2008.
Sugaa, Y., Takeuchia, S., Oguroa, Y., et al. Application of ERS-2/SARdata for the 1999 Taiwan earthquake. Adv. Space Sci. 28, 155–163,2001.
Tomiyama, N., Koike, K., Omura, M. Detection of topographic changesassociated with volcanic activities of Mt. Hossho using D-InSAR.Adv. Space Sci. 33, 279–283, 2004.
Tong, X., Sandwell, D.T., Fialko, Y. Coseismic slip model of the 2008Wenchuan earthquake derived from joint inversion of interferometricsynthetic aperture radar, GPS, and field data. J. Geophys. Res.,doi:10.1029/2009JB006625, 2010.
Uppala, S., Kallberg, P., Simmons, A., Andrae, U. The ERA-40 re-analysis. Q. J. R. Meteorol. Soc 131, 2961–3012, 2005.
Wdowinski, S., Smith-Konter, B., Bock, Y., Sandwell, D.T. Spatialcharacterization of the interseismic velocity field in southern Califor-nia. Geology 35, 311–314, 2007.
Wei, M., Sandwell, D. Decorrelation of L-band and C-band interferom-etry over vegetated areas in California. IEEE Trans. Geosci. RemoteSensing, in press, 2010.
Wei, M., Sandwell, D., Fialko, Y. A silent Mw 4.7 slip event of October2006 on the Superstition Hills fault, southern California. J. Geophys.Res. 114, B07402, 2009.
SAR and GPS for measuring interseismic crustal deformation. J. Adv.

14 M. Wei et al. / Advances in Space Research xxx (2010) xxx–xxx
ARTICLE IN PRESS
Wessel, P., Bercovici, D. Interpolation with splines in tension: a green’sfunction approach. Math. Geol. 30 (1), 77–93, 1998.
Wright, T.J., Parsons, B., England, P.C., Fielding, E.J. InSAR observa-tions of low slip rates on the major faults of Western Tibet. Science305, 236–239, 2004.
Zebker, H.A., Rosen, P. Atmospheric artifacts in interferometric SARsurface deformation and topographic maps. J. Geophys. Res. 102,7547–7563, 1997.
Please cite this article in press as: Wei, M., et al. Optimal combination of InSpace Res. (2010), doi:10.1016/j.asr.2010.03.013
Zebker, H.A., Rosen, P., Goldstein, R., Gabriel, A., Werner, C.L. On thederivation of coseismic displacement fields using differential radarinterferometry: the Landers earthquake, in: Geoscience and RemoteSensing Symposium, 1994. IGARSS’94. Surface and AtmosphericRemote Sensing: Technologies, Data Analysis and Interpretation,International, 1, 1994.
SAR and GPS for measuring interseismic crustal deformation. J. Adv.