Embed Size (px)
Citation preview
OPTIMAL CHELANT/COPPER RATIOS FOR MAXIMIZING COPPER SOLUBILITY IN NATURAL WATER USING CITRIC ACID AND TRIETHANOLAMINE
ILENR/RE-EH-86 09
Illinois Department of Energy and Natural Resources
James R Thompson, Governor Don Etchison, Director
Printed by the Authority of the State of Illinois

ILENR/RE-EH-86/09 September 1986 Contract EH 22; EH 22 Project 85/6005; 86/6005
OPTIMAL CHELANT/COPPER RATIOS FOR MAXIMIZING COPPER SOLUBILITY IN NATURAL WATER
USING CITRIC ACID AND TRIETHANOLAMINE
Prepared by Illinois State Water Survey
Water Quality Section Foot of MacArthur Hwy
P.O. Box 697 Peoria, IL 61652
Principal Investigators Raman K. Raman Billy K. Cook
Prepared for Illinois Department of
Energy and Natural Resources Energy and Environmental Affairs Division
325 W. Adams Springfield, IL 62704-1892
James R. Thompson, Governor Don Etchison, Director State of Illinois Illinois Department of
Energy and Natural Resources

NOTE
This report has been reviewed by the Illinois Department of Energy and Natural Resources (ENR) and approved for publication.
Printed by the Authority of the State of Illinois.
Date Printed: September 1986
Quantity Printed: 120
Referenced Printing Order: IS 36
One of a series of research publications published since 1975. This series includes the following categories and are color coded as follows:
Energy Resources - RE-ER - Red
Water Resources - RE-WR - Blue
Air Quality - RE-AQ - Green
Environmental Health - RE-EH - Grey
Economic Analysis - RE-EA - Brown
Information Services - RE-IS - Yellow
Insect Pests - RE-IP - Purple
Illinois Department of Energy and Natural Resources Energy and Environmental Affairs Division
325 W. Adams Springfield, Illinois 62704-1892
217/785-2800
i

CONTENTS
Page Introduction 1
Acknowledgments 7
Objectives and Scope 8
Materials and Methods 9
Results and Discussion 12 Optimal copper/chelant ratio 12 Particulate adsorption 15 Cutrinestudy 16 Regression analysis 17
Summary 18
Tables and Figures 20
References 40
Appendix 43
ii
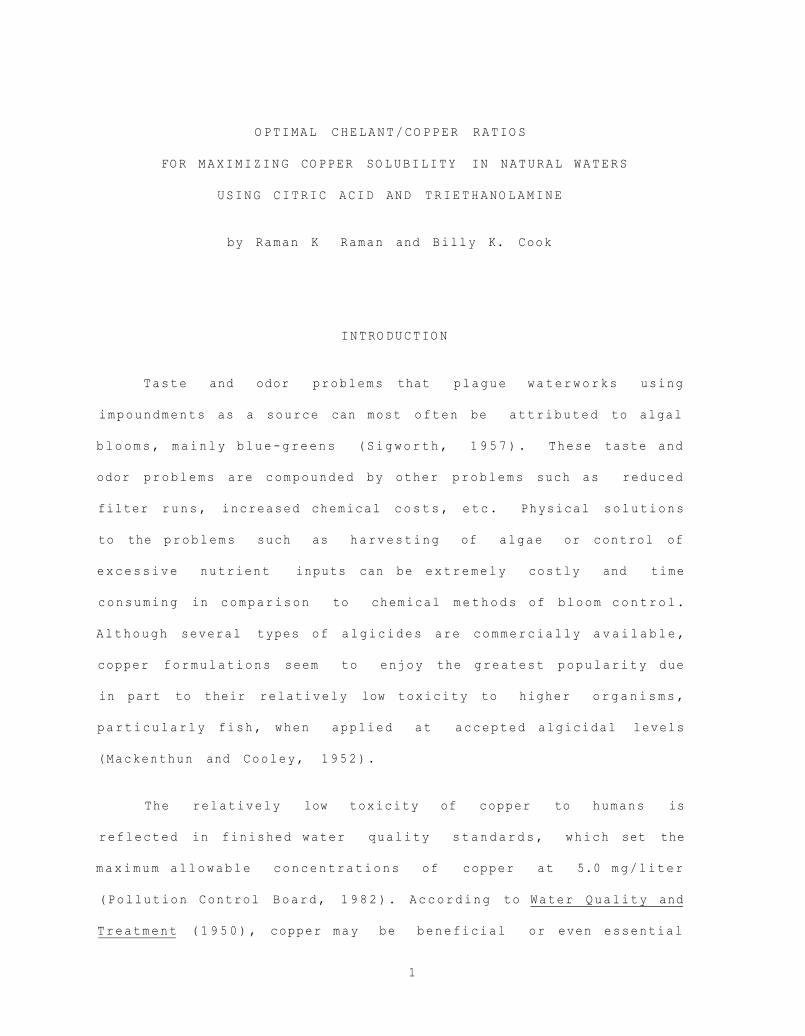
OPTIMAL CHELANT/COPPER RATIOS
FOR MAXIMIZING COPPER SOLUBILITY IN NATURAL WATERS
USING CITRIC ACID AND T R I E T H A N O L A M I N E
by Raman K Raman and Billy K. Cook
INTRODUCTION
Taste and odor problems that plague waterworks using
impoundments as a source can most often be attributed to algal
b l o o m s , mainly blue-greens (Sigworth, 1 9 5 7 ) . These taste and
odor problems are compounded by other problems such as reduced
filter runs, increased chemical c o s t s , etc. Physical solutions
to the problems such as harvesting of algae or control of
excessive nutrient inputs can be extremely costly and time
consuming in comparison to chemical m e t h o d s of bloom c o n t r o l .
Although several types of algicides are commercially a v a i l a b l e ,
copper formulations seem to enjoy the greatest popularity due
in part to their relatively low toxicity to higher o r g a n i s m s ,
particularly fish, when applied at accepted algicidal levels
(Mackenthun and Cooley, 1 9 5 2 ) .
The relatively low toxicity of copper to humans is
reflected in finished water quality s t a n d a r d s , which set the
m a x i m u m allowable concentrations of copper at 5.0 mg/liter
(Pollution Control Board, 1 9 8 2 ) . According to Water Quality and
Treatment ( 1 9 5 0 ) , copper may be beneficial or even essential
1

for the growth of living organisms-. The USEPA has proposed an
RMCL (i.e., Recommended M a x i m u m Contaminant L e v e l ) for copper
of 1.3 mg/L in drinking w a t e r . The average daily human intake
of copper from water and foodstuffs is generally about 2-5 m g .
Richey and Roseboom (1978) have also demonstrated that the
14-day TL-50 (.i.e., the concentration at which a 5 0 % m o r t a l i t y
occurs within 14 days in an acute toxicity flow-through test)
for bluegill and channel c a t f i s h , native to Illinois, is an
order of m a g n i t u d e higher than accepted a lgici dal levels.
The toxicity of copper to nuisance phytop lankton
p o p u l a t i o n s in recreational and water supply lakes has been an
accepted fact since the turn of the century (Moore and
K e l l e r m a n , 1 9 0 4 ) . Copper sulfate pentahydrate has been the most
w i d e l y used algicide in the United S t a t e s , w i t h yearly
a p p l i c a t i o n s approaching 2 0 million pounds ( F i t z g e r a l d , 1 9 7 1 ) .
H o w e v e r , a l k a l i n e , hard w a t e r s , such as those found in central
and northern Illinois lakes, are known to require greater
copper sulfate "loading" for effective algicidal action
( M a c k e n t h u n , 1969; F i t z g e r a l d , 1971) due to rapid c o n v e r s i o n of
copper to possibly non-toxic forms by h y d r o l y s i s , c o m p l e x a t i o n ,
a d s o r p t i o n , and precipitation reactions with inorganic species
common to fresh w a t e r s ( S y l v a , 1 9 7 6 ) . This is p a r t i c u l a r l y true
in central Illinois where alkalinity and hardness are h i g h ,
w i t h pH's in the range of 7.5 to 8.5 (Stiff, 1 9 7 1 a ) .
Figure 1 (from S y l v a , 1976) shows the speciation of copper
in typical fresh waters as a function of pH. The most rapid
changes in copper chemistry occur in the pH range 6.5 - 8 such
2

that less than 1 0 % of the copper p r e s e n t at pH 8 is in the form
o f c u p r i c t o n s . H y d r o l y s i s and p r e c i p i t a t i o n p r o d u c t s d o m i n a t e
the c h e m i s t r y of copper at this p H .
S t a b l e c o m p l e x e s of c o p p e r w i t h o r g a n i c s typical of fresh
w a t e r s , such as humic and fulvic a c i d s p r o d u c e d by d e c a y i n g
v e g e t a t i o n , a l s o tend to reduce the c o n c e n t r a t i o n of a v a i l a b l e
copper CShuman and W o o d w a r d , 1 9 7 7 ; M c K n i g h t , 1 9 8 1 ; S y l v a ,
1 9 7 6 ) . L i k e w i s e , G a c h t e r and o t h e r s ( 1 9 7 8 ) point to the
p o s s i b i l i t y that c o m p l e x a t i o n by m a c r o m o l e c u l a r o r g a n i c
m a t e r i a l in lake w a t e r may be e c o l o g i c a l l y s i g n i f i c a n t in
r e g u l a t i n g the a v a i l a b i l i t y of copper to a q u a t i c o r g a n i s m s .
A d s o r p t i o n of c o p p e r o n t o s u s p e n d e d s o l i d s is c o n s i d e r a b l e
a b o v e pH 6.5 CJames and H e a l y , 1 9 7 2 ) and p l a y s a s i g n i f i c a n t
role in the r e d u c t i o n of total d i s s o l v e d c o p p e r ( T D C u ) . S t u d i e s
by W a g e m a n n and B a r i c a ( 1 9 7 9 ) indicated that the rate of
d i s a p p e a r a n c e of copper w a s a l w a y s slower in f i l t e r e d than in
u n f i l t e r e d s a m p l e s . R e s u l t s by Stiff ( 1 9 7 1 b ) a l s o point to the
p r e s e n c e of s u s p e n d e d s o l i d s h a v i n g a p r o f o u n d e f f e c t on the
p h y s i c a l state of copper in a q u a t i c e n v i r o n m e n t s .
T h e s e m e c h a n i s m s of c o p p e r " l o s s " m a k e it d i f f i c u l t at
best to m a i n t a i n a 0.1 to 0.3 m g / L c o n c e n t r a t i o n of d i s s o l v e d
copper n e c e s s a r y for a l g i c i d a l a c t i o n ( M a c k e n t h u n , 1 9 6 9 ;
M u c h m o r e , 1 9 7 8 ) . But in order to do s o , a p p l i c a t o r s have s i m p l y
increased f r e q u e n c y and d o s a g e s in order to " o v e r p o w e r " the
e f f e c t s of p r e c i p i t a t i o n , c o m p l e x a t i o n , and a d s o r p t i o n .
C u r r e n t l y , no s p e c i f i c g u i d e l i n e s exist for the a m o u n t or
3

frequency of chemical application to water supply
impoundments. For waters with alkalinity greater than 40 m g / L ,
Mackenthun C1969) advocates the application of copper sulfate at a rate of 1 mg/L as CuSO 4 5H2O (0.25 mg/L as C u + 2 ) for the
upper 2 feet of water regardless of the actual depth of
impoundments. On an acreage basis, this concentration amounts
to 5.4 lbs/surface acre. For waters with alkalinities less
than 40 m g / L , Mackenthun recommends application rates of 0.3
mg/L as copper sulfate pentahydrate. Fair et a l . (1971)
recommend raising copper sulfate dosages by as much as 5% for
each 10 mg/L of alkalinity as C a C O 3 . In a d d i t i o n , even larger
dosages may be indicated as algae shift to more resistant
species (Hanson and S t e f a n , 1 9 8 4 ) .
This increase in application rates not only increases the
cost of maintaining water quality in an impoundment; but also
intensifies long-term effects associated with elevated copper
dosages, such as in the Fairmont L a k e s , Minnesota (Hanson and
Stefan, 1 9 8 4 ) . These effects may include a) copper accumulation
in s e d i m e n t s , b) tolerance adjustments of certain species of
algae, c) shift of species from green to blue-green algae and
from game fish to rough fish, d) disappearance of m a c r o p h y t e s ,
and e) reduction in benthic m a c r o i n v e r t e b r a t e s (Gibson, 1972;
Iskander and Keeney, 1 9 7 4 ) . These cumulative side effects point
to the need to reduce dosage requirements by enhancing the
solubility of copper in a natural system.
Although the use of chelating a g e n t s , such as citric acid
monohydrate (Kothandaraman et a l . , 1980; Stern et a l . , 1978)
4

and t r i e t h a n o l a m i n e , or TEA (Applied B i o c h e m i s t s , Inc., 1976)
has been demonstrated to enhance copper solubility in surface
water impoundments (Illinois Natural History S u r v e y , 1975;
G e l f a n d , 1 9 4 6 ) , copper sulfate c o n t i n u e s to be used alone in
most c a s e s . This is puzzling in light of the fact that when
algal blooms form, the pH is typically about 8.0, in which case
the p r e c i p i t a t i o n and c o m p l e x a t i o n of the copper is imminent.
The continued use of copper sulfate alone is due partly to
the lack of published research o u t l i n i n g desirable c h e l a n t s and
o p t i m u m copper/chelant r a t i o s , but mainly to the n o n - u n i f o r m
s p e c i a t i o n in U . S . surface w a t e r s . The latter has m a d e it
e x t r e m e l y difficult to e m p i r i c a l l y d e t e r m i n e the o p t i m a l , i.e.,
most cost e f f e c t i v e , c o p p e r / c h e l a n t ratios to m a i n t a i n an
algicidal copper c o n c e n t r a t i o n . Given the a d v a n t a g e of
p r e m i x i n g and elevated levels of c h e l a n t s , commercial copper
f o r m u l a t i o n s , e.g., C u t r i n e , A V - 7 0 , e t c . , can ensure initially
high c o n c e n t r a t i o n s of the c o m p l e x , w h i c h may or m a y not be
stable in the treated lake as outlined in d i s c l a i m e r s w h i c h
a c c o m p a n y these a l g i c i d e s . N o n - u n i f o r m speciation m a k e s some
p r o d u c t s m o r e effective than others in different regions of the
country depending on the stability of the complex v s .
c o m p e t i t i o n for the c o p p e r .
Sylva (1976) indicates that at pH 8 a p r o s p e c t i v e ligand 5 would need an effective formation constant on the order of 105
to e f f e c t i v e l y bind free copper ions in a natural system. This
is by no m e a n s a hard-and-fast rule, as competition effects for
free copper ions can vary greatly from system to system, but it
5

does place some doubt on the efficacy of citric acid
m o n o h y d r a t e and t r i e t h a n o l a m i n e as chelating agents c o n s i d e r i n g
their relatively small stability constants CSillen and M a r t e l l ,
1964) .
Another important aspect of copper chelation is the issue
of whether chelated forms of copper or soluble copper salts
retain their algicidal e f f e c t . M c K n i g h t (1981) m a i n t a i n s that
the toxicity of copper is determined by cupric ion activity and
not by the total copper c o n c e n t r a t i o n . W a g e m a n n and Barica
(1979) introduced their "total toxic c o p p e r " c o n c e p t , w h i c h , in
the a b s e n c e of chelating a g e n t s , included Cu + 2 , C u ( O H ) 2 , and
CuOH . From Elder and H o m e ( 1 9 7 8 ) :
C o m p l e x a t i o n of copper is g e n e r a l l y assumed to reduce the a v a i l a b i l i t y of the metal for biological u p t a k e , although not necessarily by removing it from solution (Horne and G o l d m a n , 1 9 7 4 ) . On the other hand, Gachter and others (1974) and Sylva (1976) correctly pointed out that this a s s u m p t i o n has not been e x p e r i m e n t a l l y verified and it is entirely possible that some or all natural copper complexes are a c t u a l l y a v a i l a b l e .
Some studies have indicated that p r e c i p i t a t e d copper salts
and c o p p e r - c i t r i c acid complexes are no less effective as toxic
agents even when tested with different algae in which required
c o n c e n t r a t i o n s for toxicity varied from 0.5 to 1.0 mg copper
sulfate/L ( F i t z g e r a l d , 1 9 6 3 ) . It should be noted that the study
conducted by Fitzgerald (1963) indicated that the toxicity of
copper to b l u n t n o s e m i n n o w and several sunfishes was reduced in
6

the p r e s e n c e of citric acid w i t h o u t its a l g i c i d a l p r o p e r t i e s
b e i n g a f f e c t e d . Stern and o t h e r s ( 1 9 7 8 ) , a l o n g w i t h Guy and
Kean ( 1 9 7 9 ) , have s i m i l a r l y v e r i f i e d that c i t r i c acid has no
a d v e r s e e f f e c t s on the a l g i c i d a l p r o p e r t i e s of copper s u l f a t e .
On the other h a n d , strong c h e l a n t s such as NTA or EDTA are
known to p a r t i a l l y or c o m p l e t e l y c o u n t e r a c t copper t o x i c i t y -
( H o m e and G o l d m a n , 1 9 7 4 ; G a c h t e r , 1978) This w o u l d indicate
that a d e l i c a t e b a l a n c e must be sought b e t w e e n the a b i l i t y of
an a d d e d ligand to inhibit p r e c i p i t a t i o n and its i n t e r f e r e n c e
in b i o l o g i c a l u p t a k e . C i t r i c acid a p p e a r s to lie on the
r a z o r ' s e d g e .
V i r t u a l l y no i n f o r m a t i o n is a v a i l a b l e on the t o x i c i t y of
c o p p e r - t r i e t h a n o l a m i n e c o m p l e x e s to b l u e - g r e e n a l g a e even
though several f o r m u l a t i o n s are c u r r e n t l y on the m a r k e t . In
light of its s u c c e s s in the field one w o u l d a s s u m e its e f f i c a c y
as an a l g i c i d e . H o w e v e r , the I l l i n o i s P o l l u t i o n C o n t r o l B o a r d
( E n v i r o n m e n t a l R e g i s t e r , N o v e m b e r 7, 1 9 8 5 ) found that
c o p p e r / t r i e t h a n o l a m i n e c o m p l e x e s w e r e not s u i t a b l e a s p u b l i c
water supply a l g i c i d e s b e c a u s e of the p o s s i b i l i t y of a d v e r s e
h e a l t h e f f e c t s r e l a t i n g to m u t a g e n i c i t y and c a r c i n o g e n i c i t y .
C i t r i c a c i d , on the other h a n d , p r e s e n t s no such p r o b l e m w i t h
human c o n s u m p t i o n as o u t l i n e d in the Federal Food and Drug
A d m i n i s t r a t i o n ' s Food C h e m i c a l C o d e x .
A c k n o w l e d g m e n t s
T h i s i n v e s t i g a t i o n w a s s p o n s o r e d and f i n a n c i a l l y s u p p o r t e d
7

by the Illinois D e p a r t m e n t of Energy and Natural R e s o u r c e s . The
study was conducted under the general g u i d a n c e and s u p e r v i s i o n
of Richard J. S c h i c h t , A c t i n g Chief of the Illinois State Water
S u r v e y .
Our a p p r e c i a t i o n also goes to Tom H o l m of the A q u a t i c
C h e m i s t r y Section of the Illinois State W a t e r Survey for his
c o n s u l t a t i o n on the p r o j e c t . Other W a t e r Survey personnel who
c o n t r i b u t e d to this investigation include Gail T a y l o r , who
edited the m a n u s c r i p t , and Linda J o h n s o n , our t y p i s t . A
special thanks is due Illinois Central C o l l e g e , East P e o r i a ,
I l l i n o i s , for p r o v i d i n g the computer plotter for the g r a p h i c s
in this r e p o r t .
O B J E C T I V E S AND S C O P E
This study is c o n c e r n e d p r i m a r i l y w i t h e n h a n c e m e n t of
total dissolved copper ( T D C u ) by chelation rather than with the
algicidal e f f e c t i v e n e s s of the v a r i o u s forms of c o p p e r . If
p r e c i p i t a t i o n of the copper by inorganic a n i o n s can be
inhibited by the p r e s e n c e of a c h e l a t i n g agent such as citric
acid m o n o h y d r a t e or t r i e t h a n o l a m i n e , it follows that d o s a g e s
necessary to m a i n t a i n algicidal action can be m i n i m i z e d . This
w o u l d not only reduce the ecological impact of long-term copper
sulfate a p p l i c a t i o n s but w o u l d also result in an e n o r m o u s
reduction in water treatment costs incurred by m u n i c i p a l i t i e s
using surface impoundments as drinking water s o u r c e s .
The work itself involved the c o r r e l a t i o n of percent copper
8

loss with hardness, alkalinity, pH, and suspended solids along
with the determination of minimum cheI ant/copper ratios
necessary to maximize copper solubility. Included in this
report is a comparison of the relative stability of
copper-citric acid vs. copper-triethanol amine complexes.
Thus, guidelines were established for the relative
concentrations of chelant and copper necessary for maximum
copper solubility under given water quality conditions.
MATERIALS AND METHODS
For the laboratory evaluation it was necessary to choose
lakes with typically high alkalinity and hardness in order to
accurately simulate real lake conditions. Lake Canton C230
acres) and Lake Eureka (37 acres) both exhibit alkalinities in
the range of 160 to 230 mg/L as CaCO 3 with a pH range of 7.4 to
8.4, providing ample precipitation and complexation reactions
for the purposes of this experiment. To provide comparison,
Rend Lake (Benson, Illinois, 18,900 acres) with alkalinities of
40-75 mg/L as CaCO3. was chosen as a relatively soft, low
alkalinity lake.
Both Lake Eureka and Lake Canton have had occasion to
treat algal blooms with copper sulfate in the past. However,
with the installation in recent years of
destratification/aeration systems in both lakes, these
treatments have been minimized.
Bulk samples (approximately 60 liters) were obtained from
9

the top 2 feet of the lakes at their deepest points (figure 2 ) .
Table 1 contains the background analysis of each bulk lake
sample including total and soluble m e t a l s , h a r d n e s s ,
a l k a l i n i t y , pH, suspended s o l i d s , chloride, sulfate, and
conductivity. All analysesr were performed as per Standard
Methods (APHA, 1 9 8 0 ) .
Bulk samples from each lake were divided into 250-mL
subsamples which were initially dosed with sufficient copper
sulfate to provide a theoretical copper concentration of 0.1
mg/L as Cu + 2 .A chelating agent (for e x a m p l e , citric acid
m o n o h y d r a t e ) was premixed with the copper sulfate spikes in
incremental amounts providing w e i g h t / w e i g h t ratios of copper
sulfate pentahydrate/chelant from 1:0 to 1:9. These premixed
spikes were allowed to stand 15 m i n u t e s . In a d d i t i o n , a
distilled water blank was also dosed with copper to provide a
recovery comparison. Following addition of the copper/chelant
p r e m i x , samples were well mixed and allowed to equilibrate for
2 h o u r s . N e x t , SO-ml portions of each subsample were filtered
(0.45 µm), acidified (1 ml 1+1 H N O 3 ) , and analyzed for soluble
copper by flame atomic absorption as per Standard M e t h o d s
(APHA, 1 9 8 0 ) . The subsamples were agitated by m e a n s of an
Eberbach shaker table for 24 hours to inhibit settling, and the
analysis was repeated.
Each and every copper/chelant ratio experiment was run in
triplicate to ensure accuracy and p r e c i s i o n . These tests were
repeated with copper sulfate pentahydrate dosages sufficient to
provide theoretical copper concentrations of 0.2 and 0.3 mg/L
10

as Cu + 2 All of the above p r o c e d u r e s w e r e repeated with
t r i e t h a n o l a m i n e (TEA) as the chelating a g e n t .
Spring bulk samples were collected from Lake C a n t o n , Lake
E u r e k a , and Rend Lake on April 1 2 , May 3, and June 7, 1985,
r e s p e c t i v e l y . A i s o , summer samples were collected from these*
three lakes on June 2 8 , September 10, and August 14, 1985,
respectively
A follow-up study involving the use of C u t r i n e , a
c o m m e r c i a l l y a v a i l a b l e c o p p e r / t r i e t h a n o l a m i n e a l g i c i d e ,
required an additional sampling of Lake Eureka on December 13.
The pH, a l k a l i n i t y , and hardness of this sampling w e r e 8.02,
181 m g / L , and 228 m g / L , r e s p e c t i v e l y , and these values are not
included in the water quality data table for bulk s a m p l e s . In
this study, 250-ml s u b s a m p l e s from Lake Eureka w e r e spiked with
sufficient Cutrine to p r o v i d e theoretical copper c o n c e n t r a t i o n s
of 0.2, 0.5, and 0.8 m g / L as Cu + 2 Cdosage r e q u i r e m e n t s listed
by Applied B i o c h e m i s t s , the m a n u f a c t u r e r , range from 0.4 m g / L
to 1.0 mg/L as Cu + 2 ). Identical volumes of d i s t i l l e d w a t e r ,
spiked at the same c o n c e n t r a t i o n s , served as the c o n t r o l .
As in p r e v i o u s e x p e r i m e n t s , each copper c o n c e n t r a t i o n was
run in triplicate to ensure p r e c i s i o n . C u t r i n e - s p i k e d
s u b s a m p l e s were then well mixed and allowed to e q u i l i b r a t e for
2 h o u r s . N e x t , 50-ml a l i q u o t s of each subsample w e r e filtered
(0.45 urn), acidified (1 ml 1 + 1 H N O 3 ) and analyzed for copper
by flame atomic a b s o r p t i o n as per Standard M e t h o d s (APHA,
1 9 8 0 ) . This a n a l y s i s was repeated at 2 4 , 4 8 , and 96 hours to
11
provide a look at the viability of the c o p p e r / t r i e t h a n o l a m i n e
complex w h e n extended e q u i l i b r a t i o n time for the complex is
allowed.
In order to monitor copper loss over an extended p e r i o d ,
an experiment involving one Lake Eureka sample (collected on
March 18) containing a 0.25-mg/L Cu + 2 spike and another
containing the copper with sufficient citric acid m o n o h y d r a t e
to provide a 1:1.25 (w/w) ratio (as C u S O 4 5H 2O/C 6H 8O 7H 2O) w a s
extended to include 48-hour and 96-hour TDCu a n a l y s e s . In
a d d i t i o n , this sample w a s s p l i t , with a portion filtered prior
to spiking in order to look at the role played by suspended
solids in the loss of soluble c o p p e r .
A v e r a g e results of each copper a n a l y s i s can be seen in the
append i x.
R E S U L T S AND D I S C U S S I O N
Optimal C o p p e r / C h e l a n t Ratio
B a c k g r o u n d water quality data for Lake E u r e k a , Lake
C a n t o n , and Rend Lake including p H , a l k a l i n i t y , h a r d n e s s ,
c h l o r i d e , suspended s o l i d s , c o n d u c t i v i t y , and total and soluble
m e t a l s can be seen in table 1. F i g u r e s 3a-3f indicate the
dissolved copper c o n c e n t r a t i o n in the a f o r e m e n t i o n e d lake
subsamples w i t h c o p p e r / c h e l a n t ratios of 1:0 to 1:9 for both
citric acid and t r i e t h a n o l a m i n e for three different initial
12

copper c o n c e n t r a t i o n s and two different contact p e r i o d s . Each
plot indicates dissolved copper c o n c e n t r a t i o n s after a 2-hour
e q u i l i b r a t i o n period and again after 24 hours of constant
m i x i n g . Spring and summer runs for each of the lakes are
illustrated separately.
Individually, these e x p e r i m e n t s do not reveal a clear
" p l a t e a u " w h e r e additional chelant has no added enhancement
e f f e c t . H o w e v e r , if the data from all the lake e x p e r i m e n t s are
combined in terms of percent copper remaining in solution v s .
c o p p e r / c h e l a n t ratio, a plateau does emerge for the higher
copper c o n c e n t r a t i o n s . Figures 4a-4d indicate the a v e r a g e
percent copper remaining in solution for all the lakes versus
the c o p p e r / c h e l a n t ratio ( w / w ) when spiked at the 0.3-mg Cu/L
c o n c e n t r a t i o n . These plots indicate that enhancement of the
copper solubility begins to level off near a 1:5 ( w / w ) ratio of
C u S O 4 5 H 2 O : c h e l a n t . This appears to be the case for both citric
acid and t r i e t h a n o l a m i n e .
A close e x a m i n a t i o n of these plots indicates that a l t h o u g h
citric acid has an initial tenacity, m a i n t a i n i n g higher levels
of soluble copper than did the TEA for the first 2 h o u r s , the
rate of copper loss over 24 hours is less for the TEA s a m p l e s ,
resulting in c o m p a r a b l e copper c o n c e n t r a t i o n s for both chelants
after 24 h o u r s . Since stability constants for these two
chelating agents are relatively s i m i l a r , this could be due to
the fact that citric acid is not stable in aqueous solution at
very low c o n c e n t r a t i o n s and begins to d e g r a d e (Merck Index of
C h e m i c a l s and D r u g s ) . T r i e t h a n o l a m i n e , on the other hand, is
13

m o r e stable over extended periods and low c o n c e n t r a t i o n s .
It is clear from figures 5a-5d and 6a-6d that this
enhancement effect d e c r e a s e s as expected when initial copper
c o n c e n t r a t i o n s are d e c r e a s e d . F i g u r e s 6a-6d show that at
copper c o n c e n t r a t i o n s on the order of 0.1 mg C u / L , no clear
plateau e x i s t s , indicating that at or near these c o n c e n t r a t i o n s
of copper and chelating a g e n t , there is little or no
c o n t r i b u t i o n to the total dissolved copper by these c o m p l e x e s
Even though a p p l i c a t i o n rates and frequency may vary from
lake to lake, dissolved copper c o n c e n t r a t i o n s in treated lakes
should remain in the range of 0.1 to 0.3 m g / L as b i o l o g i c a l l y
a v a i l a b l e copper for required algicidal e f f e c t s . Figures 7a-7d
indicate the average percent copper remaining in solution for
all three copper spike c o n c e n t r a t i o n s . These a v e r a g e s include
all three lakes and both the spring and summer runs. The
resulting plots show a definite enhancement effect for both the
citric acid m o n o h y d r a t e and t r i e t h a n o l a m i n e , but the plateau is
not nearly as well defined as in those representing higher
c o n c e n t r a t i o n s . S t i l l , it can be seen that for the first few
h o u r s , a copper sulfate p e n t a h y d r a t e to chelant ratio
( w e i g h t / w e i g h t ) of at least 1:5 provides the m a x i m u m effect for
the higher c o n c e n t r a t i o n s , with the necessary ratio increasing
as initial copper c o n c e n t r a t i o n d e c r e a s e s .
It should be noted here that Stern et a l . ( 1 9 7 8 ) , in
their study of the algicidal effects of copper sulfate alone
and m i x t u r e s of copper s u l f a t e - c i t r i c acid, used a
14

w e i g h t / w e i g h t ratio of 1:8 at a copper s u l f a t e c o n c e n t r a t i o n
e q u i v a l e n t to 0.5 m g / L as Cu + 2 Their study indicated that the
a d d i t i o n of c i t r i c acid increased the t o x i c i t y of copper to
M i c r o c y s t i s , w i t h no d e t e c t a b l e a d v e r s e e f f e c t s of the c i t r i c
acid on the e f f i c a c y of copper s u l f a t e .
In a d d i t i o n , field a p p l i c a t i o n s t u d i e s using copper
sulfate p e n t a h y d r a t e - c i t r i c acid m o n o h y d r a t e f o r m u l a t i o n s of a
1:0.5 ratio and copper sulfate p e n t a h y d r a t e a l o n e w e r e
p e r f o r m e d in Lake C a t h e r i n e ( A n t i o c h , I l l i n o i s ) . T h e s e s t u d i e s
indicated i n h i b i t i o n of p r e c i p i t a t i o n in the p r e s e n c e of c i t r i c
acid over a 24-hour p e r i o d ( K o t h a n d a r a m a n and E v a n s , 1 9 8 0 ) .
Par t i c u l a t e A d s o r o t i o n
G a c h t e r et a l . C 1 9 7 8 ) and W a g e m a n n and B a r i c a ( 1 9 7 8 ) have
p o i n t e d out that a d s o r p t i o n of copper by s o l i d s can have a
s i g n i f i c a n t effect on the d i s s o l v e d copper c o n c e n t r a t i o n .
F i g u r e 8 shows a clear c o m p a r i s o n of p e r c e n t copper r e m a i n i n g
for a Lake E u r e k a s a m p l e a n a l y z e d over a p e r i o d of 96 h o u r s for
both filtered and u n f i l t e r e d s u b s a m p l e s , w i t h and w i t h o u t a
c h e l a n t . T h e s e r e s u l t s indicate a s i g n i f i c a n t e f f e c t of
s e d i m e n t s and s e s t o n on d i s s o l v e d copper c o n c e n t r a t i o n s . In
both the p r e s e n c e and a b s e n c e of s u s p e n d e d s e d i m e n t s , the
a d d i t i o n of c i t r i c acid e n h a n c e d the o v e r a l l s o l u b i l i t y of the
c o p p e r , but a s i g n i f i c a n t l y higher c o n c e n t r a t i o n w a s m a i n t a i n e d
in the a b s e n c e of s o l i d s . COn the order of 5 0 % m o r e of the
initial copper r e m a i n s in s o l u t i o n w i t h no s o l i d s . )
15

These plots also indicate a levelling off of TDCu after
about 48 h o u r s . This may also be an indication of the
stability of these two copper c o m p l e x e s , as W a g e m a n n and Barica
C1978) reported that copper c o n c e n t r a t i o n s in their spiked lake
samples continued to follow a nearly first-order decay with
s t e a d y - s t a t e concentrations attained after 10 d a y s .
The 5 0% decrease in dissolved copper c o n c e n t r a t i o n s in the
p r e s e n c e of suspended solids implies that adsorption plays a
significant role in the loss of copper in natural w a t e r s .
C u t r i n e Study
A close examination of c o m m e r c i a l l y available copper
c o m p l e x e s reveals an elevated c o n c e n t r a t i o n of the chelating
agent in most c a s e s . This ensures high initial c o n c e n t r a t i o n s
of the c o m p l e x , allowing an a d v a n t a g e for the chelating agent
in terms of competition for the copper once introduced into a
natural system. Our e x a m i n a t i o n of C u t r i n e , a
c o p p e r / t r i e t h a n o l a m i n e f o r m u l a t i o n , shows a 1:10 ratio of
elemental copper to chelating agent in the c o n c e n t r a t e .
A l t h o u g h this represents a ratio of only 1:2.5 as copper
sulfate p e n t a h y d r a t e to TEA, the indeterminate e q u i l i b r a t i o n
time a f f o r d e d the formation of the complex ensures high initial
c o n c e n t r a t i o n s . Since "tank m i x i n g " is not allowed in
I l l i n o i s , this p r e - e q u i l i b r a t i o n period is not a v a i l a b l e to
water treatment operators unless costly commercial f o r m u l a t i o n s
are used. Dosage requirements listed by Applied B i o c h e m i s t s ,
the m a n u f a c t u r e r , as indicated e a r l i e r , range from 0.4 mg/L to
16

1.0 m g / L as Cu+2
The laboratory C u t r i n e experiment involved spiking
s u b s a m p l e s of the December 13 Lake E u r e k a sample with
sufficient Cutrine to p r o v i d e copper c o n c e n t r a t i o n s of 0.2,
0.5, and 0.8 mg/L as Cu + 2. These samples w e r e a n a l y z e d for
dissolved copper over a period of 96 h o u r s ; the results are
shown in figure 9 T h e s e results also indicate a "levelling
o f f " of the soluble copper c o n c e n t r a t i o n after about 48 h o u r s .
H o w e v e r , there is a clear benefit to using an initially high
c o n c e n t r a t i o n of the C u - T E A c o m p l e x , as copper c o n c e n t r a t i o n s
leveled off at much higher levels than in p r e v i o u s studies
w h e r e p r e - e q u i l i b r a t i o n time was s h o r t . A l t h o u g h this e n h a n c e s
the solubility of the copper to a greater e x t e n t , the cost per
treatment using C u t r i n e to control algal blooms is m u c h higher
than that of other current copper sulfate t r e a t m e n t s .
R e g r e s s i o n Analvsi s
The results of this study bear out a strong c o r r e l a t i o n
between copper toss and pH, a l k a l i n i t y , h a r d n e s s , c o n d u c t i v i t y ,
and suspended s o l i d s . R e s u l t s of a s t e p w i s e m u l t i p l e
regression analysis a p p l y i n g the above p a r a m e t e r s to copper
loss are shown in table 2. Only data from the 0.3-mg Cu/L
spikes for all three l a k e s , both spring and summer r u n s , w e r e
used in this a n a l y s i s . Column 1 of the table lists the
dependent v a r i a b l e s , including percent copper loss at 2 h o u r s ,
percent copper loss at 24 h o u r s , and rate of copper loss in
p e r c e n t / d a y . The second and third columns show the regression
17

e q u a t i o n s for each d e p e n d e n t v a r i a b l e and the m u l t i p l e
c o r r e l a t i o n c o e f f i c i e n t s .
The regression e q u a t i o n for percent copper loss at 24
hours shows a high d e g r e e of m u l t i p l e c o r r e l a t i o n (r = 0 . 9 7 4 ) ,
w i t h p H , c o n d u c t i v i t y , h a r d n e s s , s u s p e n d e d s o l i d s , and
a l k a l i n i t y r e p r e s e n t i n g the order of d e c r e a s i n g s i g n i f i c a n c e of
the independent v a r i a b l e s . It should be noted that these
e q u a t i o n s w e r e d e v e l o p e d w i t h o u t r e f e r e n c e to c a u s a l ,
b i o l o g i c a l , and physical r e l a t i o n s h i p s , and it is e n t i r e l y
p o s s i b l e for statistical d e p e n d e n c e to exist w i t h o u t causal
d e p e n d e n c e .
S U M M A R Y
It is e v i d e n t from the results of this study that the
f o r m a t i o n of copper c o m p l e x e s such as c o p p e r - c i t r i c a c i d and
c o p p e r - T E A does slightly inhibit the p r e c i p i t a t i o n of copper
from natural w a t e r s . H o w e v e r , it is still a m a t t e r of d e b a t e
as to the toxicity of these c o m p l e x e s in their role as
a l g i c i d e s . R e g a r d l e s s of this i s s u e , g u i d e l i n e s for the proper
p r o p o r t i o n s of c h e l a t e d copper f o r m u l a t i o n s are a n e c e s s i t y in
water treatment o p e r a t i o n s involving " o n - s i t e " p r e p a r a t i o n s .
This study indicates that any greater than a 1:5 ( w / w ) ratio of
either copper s u l f a t e p e n t a h y d r a t e : c i t r i c acid m o n o h y d r a t e or
copper sulfate p e n t a h y d r a t e : t r i e t h a n o l a m i n e results in little
or no additional inhibition of copper p r e c i p i t a t i o n .
R e g a r d i n g the relative stability of these two f o r m u l a t i o n s
18

in n a t u r a l w a t e r s , t h e . r e s u l t s i n d i c a t e an initial t e n a c i t y of
the c i t r i c a c i d c o m p l e x but little s t a y i n g power in c o m p a r i s o n
to the TEA f o r m u l a t i o n . R e s u l t s a l s o i n d i c a t e that the
e n h a n c e m e n t o f copper s o l u b i l i t y b y c h e l a t i o n w i t h c i t r i c a c i d
or TEA is not c l e a r l y e v i d e n t until d i s s o l v e d c o p p e r
c o n c e n t r a t i o n s reach a p p r o x i m a t e l y 0 . 2 m g / L as Cu + 2 B o t h
c o m p l e x e s r e a c h e d c o m p a r a b l e c o n c e n t r a t i o n s o f d i s s o l v e d c o p p e r
after 24 h o u r s , and these c o n c e n t r a t i o n s w e r e h i g h e r than in
those s a m p l e s w h e r e c h e l a t i n g a g e n t s w e r e a b s e n t . H o w e v e r , the
a d v e r s e h e a l t h e f f e c t s now a s s o c i a t e d w i t h t r i e t h a n o l a m i n e s e e m
to point to c i t r i c acid as the c h e l a n t of c h o i c e .
S u s p e n d e d s o l i d s a p p e a r to p l a y a very s i g n i f i c a n t role in
the loss of c o p p e r , as f i l t e r e d s a m p l e s r e t a i n e d n e a r l y t w i c e
a s m u c h d i s s o l v e d copper a s c o r r e s p o n d i n g u n f i l t e r e d s a m p l e s .
T o p i c s for f u r t h e r i n v e s t i g a t i o n m i g h t i n c l u d e the v i a b i l i t y of
p r e m i x i n g c o p p e r s u l f a t e w i t h c h e l a t i n g a g e n t s rather than
m a k i n g s e p a r a t e a d d i t i o n s as is the case at p r e s e n t . Of
p r i m a r y i m p o r t a n c e is the d e b a t e as to the t o x i c i t y of c h e l a t e d
c o p p e r c o m p l e x e s to h i g h e r o r g a n i s m s and their e f f e c t i v e n e s s as
a l g i c i d e s . T h i s is o b v i o u s l y f u n d a m e n t a l to f u r t h e r r e s e a r c h
in this f i e l d .
T h i s study p o i n t s to the need to c a r r y out field s c a l e
i n v e s t i g a t i o n s to d e t e r m i n e the e f f i c a c y of u s i n g c i t r i c a c i d
as a c h e l a n t w i t h i n an e c o n o m i c a l l y and e c o l o g i c a l l y r e a s o n a b l e
range ( 1 : 0 . 5 to 1:3) of copper s u l f a t e p e n t a h y d r a t e to c h e l a n t
r a t i o s .
19
TABLES AND FIGURES
20

Table 1. Water Quality Characteristics of Bulk Samples
Lake Canton Lake Eureka Rend Lake First Run Second Run First Run Second Run First Run Second Run
pH 7.95 8.38 7.99 8.12 7.78 7.70 Alkalinity (mg/L CaCO3) 130 141 158 255 53.0 48.0 Hardness (mg/L CaCO3) 190 199 240 245 87.0 92.0 Chloride (mg/L) 10.0 12.8 20.6 25.0 6.0 21.0 Sulfate (mg/L) 51.0 53.0 40.0 2.50 50.0 51.0 Suspended solids (mg/L) 28.0 11.0 23.0 42.0 19.0 17.0 Conductivity (µmho/cm) 314 413 387 562 212 286 NH3-N (mg/L) - 0.03 - 0.44 - 0.02 PO4-P (mg/L) - 0.02 - 0.22 - 0.01
Total Metal Concentrations (mg/L)
Pb <0.05 <0.05 <0.05 <0.05 <0.05 <0.05 Cd <0.01 <0.0l <0.01 <0.01 <0.01 <0.01 Zn 0.04 0.04 0.04 0.05 0.05 0.04 Cu 0.02 0.01 0.02 <0.01 0.01 <0.01 Ca 47.0 43.0 55.0 46.0 20.0 22.0 Mg 19.0 18.0 24.0 22.0 5.6 6.0 Mn 0.08 0.07 0.07 0.14 0.21 0.37 Fe 1.70 0.38 1.00 0.13 0.33 0.24
Soluble Metal Concentrations (mg/L)
Pb <0.05 <0.05 <0.05 <0.05 <0.05 <0.05 Cd <0.01 <0.01 <0.01 <0.01 <0.01 <0.01 Zn 0.03 0.04 0.03 0.09 0.05 0.04 Cu 0.01 0.01 0.02 <0.01 0.01 <0.01 Ca 44.0 42.0 55.0 44.0 19.0 22.0 Mg 18.0 17.0 23.0 21.0 5.4 5.8 Mn 0.01 <0.01 0.01 0.04 <0.01 <0.01 Fe 0.11 0.10 0.10 0.17 0.02 0.01

Table 2. Regression Analysis of Copper Loss with Respect to Water Quality Parameters
Multiple Dependent Variable Regression Equations Corr. Coef.
Percent TDCu Loss at T=2 hr 41.43 X1 + 2.542 X4 - 74.78 X2 + 0.2331 X3 + 0.1074 X5 - 349.3 0.890
Percent TDCu Loss at T=24 hr 23.29 X1 + 0.1822 X5 + 0.0871 X3 + 2.221 X4 - 69.75 X2 - 190.7 0.974
ATDCu/At (%/day) -0.1452 X3 + 0.0696 X5 - 22.66 X1 - 0.3906 X4 + 74.28 X2 - 194.9 0.906
X1 = pH (unitless) X2 = Alkalinity (mg/L as CaCO3) X3 = Hardness (mg/L as CaCO3 ) X4 = Suspended solids (mg/L) X5 = Conductivity (µmho/cm) ATDCu/At = Rate of soluble copper loss

PH Figure 1. Speciation of copper (II)
(total concentration 2 ppm) and carbonate as a function of pH (from Sylva, 1976)
23

Figure 2. Sampling locations on Lake Canton, Lake Eureka, and Rend Lake
24

Figure 3a. Lake Canton TDCu analysis of April 12, 1985 sampling
25
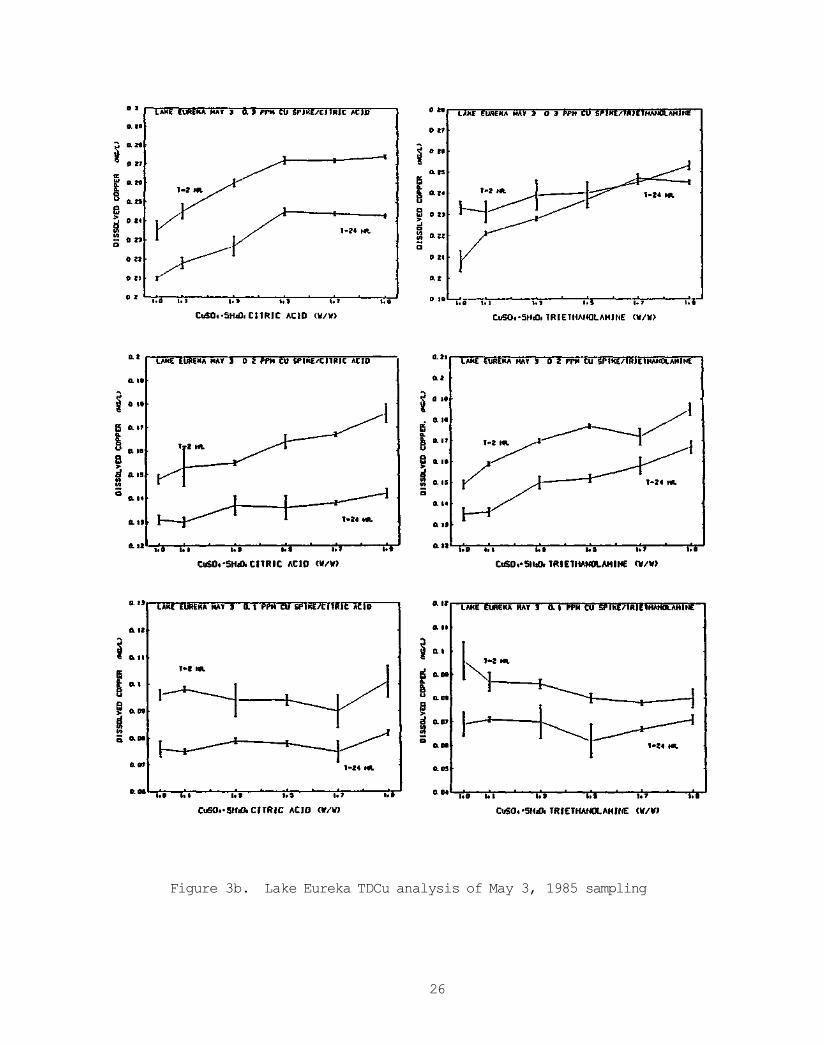
Figure 3b. Lake Eureka TDCu analysis of May 3, 1985 sampling
26

Figure 3c. Rend Lake TDCu analysis of June 7, 1985 sampling
27
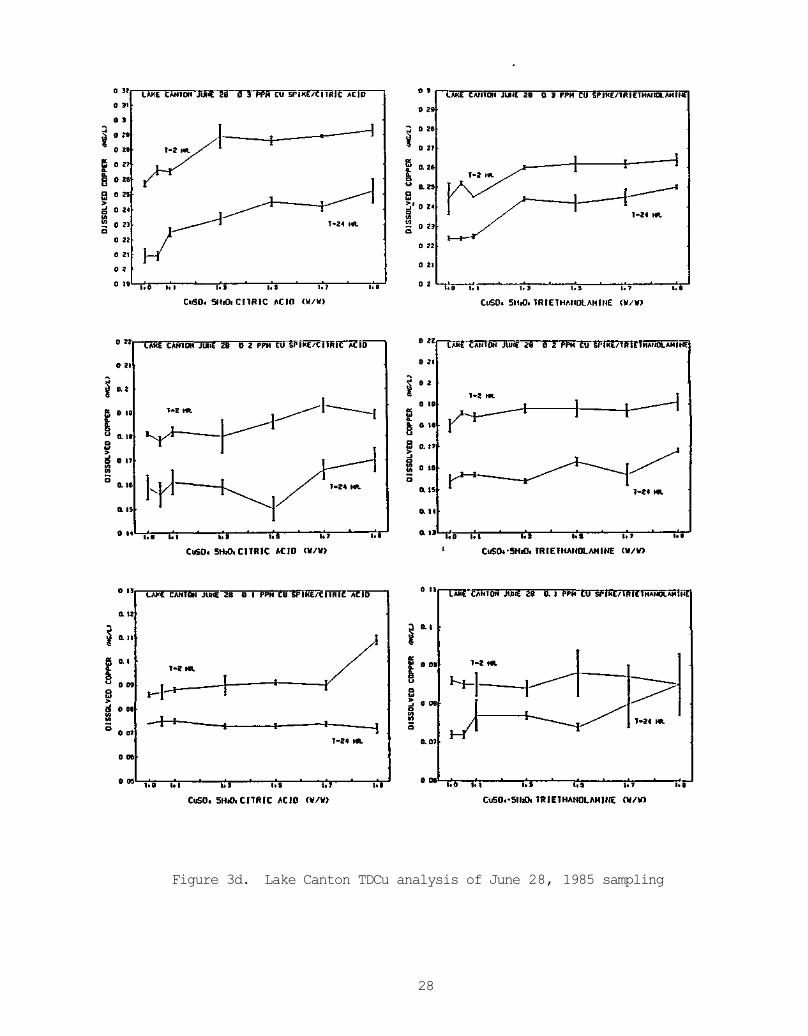
Figure 3d. Lake Canton TDCu analysis of June 28, 1985 sampling
28

Figure 3e. Lake Eureka TDCu analysis of September 10, 1985 sampling
29

Figure 3f. Rend Lake TDCu analysis of August 14, 1985 sampling
30

Figure 4. Average percent copper remaining in solution vs. CUSO4•5H20/chelant ratio (w/w) for all lakes, both runs and 0.3 mg Cu/L spike
31

Figure 4. Concluded
32

Figure 5. Average percent copper remaining in solution vs. CuS04•5H2O/chelant ratio (w/w) for all lakes, both runs and 0.2 mg Cu/L spike
33

Figure 5. Concluded
34

Figure 6. Average percent copper remaining in solution vs. CuS04●5H2O/chelant ratio (w/w) for all lakes, both runs and 0.1 mg Cu/L spike
35

Figure 6. Concluded
36

Figure 7. Average percent copper remaining in solution vs. CUSO4•5H20/chelant ratio (w/w) for all lakes, both runs and all spike concentrations
37

Figure 7. Concluded
38

Figure 9. Percent copper remaining in solution vs. time for Cutrine dosages of 0.2, 0.5, and 0.8 mg Cu/L
39

REFERENCES
American Public Health A s s o c i a t i o n . 1980. Standard methods for the examination of water and w a s t e w a t e r . 15th ed. W a s h i n g t o n D.C., 1134 p.
Appflied B i o c h e m i s t s , Inc., 1976. How to identify and control water weeds and algae. 5300 West County Line Road, Mequon , Wl , 64 p.
Elder, J F., and A.J. H o m e . 1978. Copper cycles and CuSO 4 algicidal capacity in two California lakes. Environ. M a n a g e . 2:1 7-30.
Fair, M . G . , C.J. G e y e r , and D.A. Okun. 1971. Elements of water supply and wastewater disposal, 2nd ed. John Wiley & S o n s , Inc., New York.
F i t z g e r a l d , 6.P. 1963. Factors affecting the toxicity of copper to algae and fish. Presented at A . C . S . National Meeting in New York, Sept. 8-13, 1963.
Fitzgerald, G.P. 1971. A l g i c i d e s . University of Wisconsin Water Resources Research Center, E u t r o p h i c a t i o n Information Program, Literature No. 2, M a d i s o n , W i s c o n s i n , 50 p.
G a c h t e r , R., J.S. O a v i e s , and A. M a r e s . 1978. Regulation of copper availability to phytoplankton by m a c r o m o l e c u l e s in lake w a t e r . E n v i r o n . S c i . T e c h n o l . 1 2 : 1 4 1 6 - 1 4 2 2 .
G a c h t e r . R.K., Lum-Shue-Chan, and Y.K. Chau. 1974. Complexing capacity of the nutrient m e d i u m and its relation to inhibition of algal photosynthesis by copper. Schwaizerische Zeitschrift fur Hydrologie 3 5 : 2 5 2 - 2 6 1 .
G e l f a n d , M. 1946. Algae control in water s u p p l i e s . Power Plant E n g i n e e r . 5 0 : 6 5 - 6 5 .
G i b s o n , C.E. 1972. The algicidal effect of copper on a green and a blue-green alga and some ecological implications. J. Appl. Ecol. 9:513-518.
Guy, R . D . , and A.R. Kean. 1979. Algae as a speciation monitor -A comparison of algal growth and computer calculated speciation. Water Research 14:891-89.
Hanson, M.J., and H.G. Stefan. 1984. Side effects of 58 years of copper sulfate treatment of the Fairmont Lakes, M i n n e s o t a . Water R e s . B u l l . 2 0 ( 6 ) : 8 8 9 - 9 0 0 .
H o r n e , A.J., and C.R. Goldman. 1974. Suppression of nitrogen fixation by blue-green algae in a eutrophic lake with trace additions of copper. Science 1 8 3 : 4 0 9 - 4 1 1 .
40

Illinois Natural H i s t o r y S u r v e y . 1 9 7 5 . C h e m i c a l s used to control fish and a q u a t i c plants in I l l i n o i s . IIEQ D o c . N o . 7 5 - 1 3 . Illinois Institute for E n v i r o n m e n t a l Q u a l i t y , C h i c a g o .
Iskandar, I.K., and D.R. K e e n e y . 1 9 7 4 . C o n c e n t r a t i o n of heavy m e t a l s in sediment cores from selected W i s c o n s i n lakes. E n v i r o n . Sci T e c h n o l . 8 : 1 6 5 - 1 7 0 .
J a m e s , R.O., and T.W. H e a l y . 1972. A d s o r p t i o n of h y d r o l y z e a b l e metal ions at the o x i d e - w a t e r i n t e r f a c e . J C o l l o i d Interface S c i . 4 0 : 4 2 .
K o t h a n d a r a m a n , V., D. R o s e b o o m , and R.L. E v a n s . 1979. Pilot lake r e s t o r a t i o n i n v e s t i g a t i o n s - - a e r a t i o n and d e s t r a t i f i c a t i o n in Lake C a t h e r i n e . Illinois State W a t e r Survey C o n t r a c t Report 2 1 2 , 54 p.
K o t h a n d a r a m a n , V., and R.L. E v a n s . 1 9 8 0 . Pilot lake r e s t o r a t i o n invest i g a t i o n s - - a e r a t i o n and d e s t r a t i f i c a t i o n in Lake C a t h e r i n e : Second year o p e r a t i o n . Illinois State W a t e r Survey Contract Report 2 2 8 .
K o t h a n d a r a m a n , V., and R . L . E v a n s . 1 9 8 2 . A e r a t i o n - d e s t r a t i f i c a t i o n of Lake Eureka using a low energy d e s t r a t i f l e r . SWS C o n t r a c t Report 2 9 4 , 32 p.
M a c k e n t h u n , K.M., and H.L. C o o l e y . 1 9 5 2 . The b i o l o g i c a l effect of copper s u l f a t e treatment upon lake e c o l o g y . T r a n s . W i s . A c a d . S c i . Arts L e t t . 4 1 : 1 7 7 - 1 8 7 .
M a c k e n t h u n , K.M. 1969. The p r a c t i c e of water p o l l u t i o n b i o l o g y . Federal Water P o l l u t i o n Control A d m i n i s t r a t i o n , 281 p .
M c K n i g h t , D.M. 1 9 8 1 . Chemical and biological p r o c e s s e s c o n t r o l l i n g the r e s p o n s e of a fresh water e c o s y s t e m to copper s t r e s s : a field study of the Mill Pond R e s e r v o i r , B u r l i n g t o n , M a s s a c h u s e t t s . L i m n . and O c e a n o g . 2 6 ( 3 ) : 5 1 8 - 5 3 1 .
M o o r e , Q . E . , and K . F . K e l l e r m a n . 1904. A m e t h o d of d e s t r o y i n g or p r e v e n t i n g the g r o w t h of a l g a e and certain p a t h o g e n i c bacteria in water s u p p l i e s . B u l l . B u r . P I . Ind. U . S . O e p . Agri . 64 .
M u c h m o r e , C.B. 1978. A l g a e control in water supply r e s e r v o i r s . J. A m e r . W a t e r W o r k s A s s o c . 7 0 ( 5 ) : 2 7 3 .
P o l l u t i o n Control B o a r d . 1 9 8 2 . State of Illinois rules and r e g u l a t i o n s , T i t l e 3 5 : E n v i r o n m e n t a l p r o t e c t i o n . S u b t i t l e F: Public Water S u p p l i e s , Chapter I, 19 p.
R i c h e y , 0., and 0. R o s e b o o m . 1978. A c u t e toxicity of copper to some fishes in high a l k a l i n i t y w a t e r . Illinois S t a t e
41

Water Survey Circular 131, Urbana, IL, 24 p.
Shuman, M.S., and G.P. Woodward. 1977. Stability constants of copper-organic chelates in aquatic samples. Environ. Sci. Techno I. 11: 809.
Sigworth, E.A. 1957. Control of odor and taste in water supplies. Amer. Water Works Assoc. 49(12):1507.
Sillen, A.G., and A.E. Martell. 1964. Stability constants of metal-ion complexes. Spec. Publ. No. 17, Chemical Society, London, 754 p.
Stern, M.S., D.H. Stern, and L.L. Ray. 1978. Citric acid enhancement of copper sulfate toxicity to blue-green algae and other nuisance organisms. Dept. of Biology, University of Missouri, Kansas City, MO, Project Number A-099-MO, 84 p.
Stiff, M.J. 1971a. Copper/bicarbonate equilibria in solutions of bicarbonate ions at concentrations similar to those found in natural waters. Water Research 5:171-176.
Stiff, M.J. 1971b. The chemfcal states of copper in polluted fresh water and a scheme of analysis to differentiate them. Water Research 5:585-599.
Sylva, R.N. 1976. The environmental chemistry of copper (II) in aquatic systems. Water Research 10:789-792.
Wagemann, R., and J. Barica. 1979. Speciation and rate of loss of copper from lakewater with implications to toxicity. Water Research 13:515-523.
Water quality and treatment, 2nd ed. 1950. American Water Works Association, New York, NY.
42

APPENDIX
43
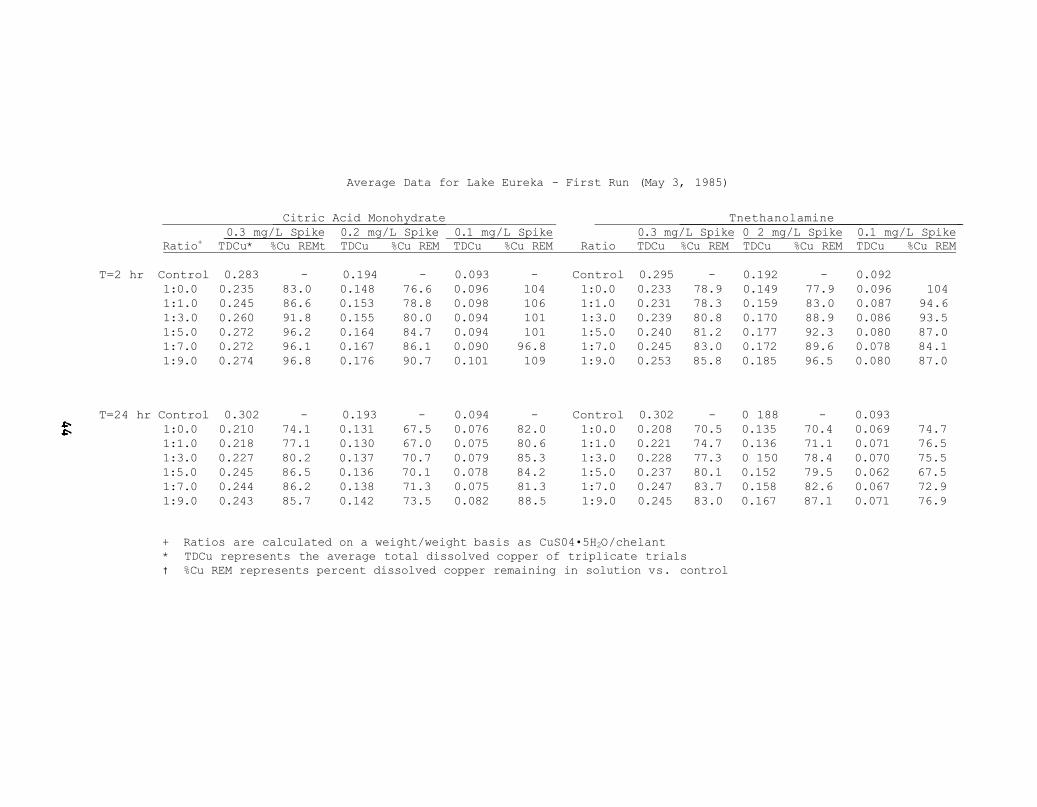
Average Data for Lake Eureka - First Run (May 3, 1985)
Citric Acid Monohydrate Tnethanolamine 0.3 mg/L Spike 0.2 mg/L Spike 0.1 mg/L Spike 0.3 mg/L Spike 0 2 mg/L Spike 0.1 mg/L Spike
Ratio+ TDCu* %Cu REMt TDCu %Cu REM TDCu %Cu REM Ratio TDCu %Cu REM TDCu %Cu REM TDCu %Cu REM
T=2 hr Control 0.283 - 0.194 - 0.093 - Control 0.295 - 0.192 - 0.092 1:0.0 0.235 83.0 0.148 76.6 0.096 104 1:0.0 0.233 78.9 0.149 77.9 0.096 104 1:1.0 0.245 86.6 0.153 78.8 0.098 106 1:1.0 0.231 78.3 0.159 83.0 0.087 94.6 1:3.0 0.260 91.8 0.155 80.0 0.094 101 1:3.0 0.239 80.8 0.170 88.9 0.086 93.5 1:5.0 0.272 96.2 0.164 84.7 0.094 101 1:5.0 0.240 81.2 0.177 92.3 0.080 87.0 1:7.0 0.272 96.1 0.167 86.1 0.090 96.8 1:7.0 0.245 83.0 0.172 89.6 0.078 84.1 1:9.0 0.274 96.8 0.176 90.7 0.101 109 1:9.0 0.253 85.8 0.185 96.5 0.080 87.0
T=24 hr Control 0.302 - 0.193 - 0.094 - Control 0.302 - 0 188 - 0.093 1:0.0 0.210 74.1 0.131 67.5 0.076 82.0 1:0.0 0.208 70.5 0.135 70.4 0.069 74.7 1:1.0 0.218 77.1 0.130 67.0 0.075 80.6 1:1.0 0.221 74.7 0.136 71.1 0.071 76.5 1:3.0 0.227 80.2 0.137 70.7 0.079 85.3 1:3.0 0.228 77.3 0 150 78.4 0.070 75.5 1:5.0 0.245 86.5 0.136 70.1 0.078 84.2 1:5.0 0.237 80.1 0.152 79.5 0.062 67.5 1:7.0 0.244 86.2 0.138 71.3 0.075 81.3 1:7.0 0.247 83.7 0.158 82.6 0.067 72.9 1:9.0 0.243 85.7 0.142 73.5 0.082 88.5 1:9.0 0.245 83.0 0.167 87.1 0.071 76.9
+ Ratios are calculated on a weight/weight basis as CuS04•5H2O/chelant * TDCu represents the average total dissolved copper of triplicate trials † %Cu REM represents percent dissolved copper remaining in solution vs. control

Averaqe Data for Lake Eureka - Second Run (September 10, 1985)
Citric Acid Monohydrate Triethanolamine 0.3 mg/L Spike 0.2 mg/L Spike 0.1 mg/L Spike 0.3 mg/L Spike 0.2 mg/L Spike 0.1 mg/L Spike
RatlO+ TDCu* %Cu REMt TDCu %Cu REM TDCu %Cu REM Ratio TDCu %Cu REM TDCu %Cu REM TDCu %Cu REM T=2 hr Control 0.263 - 0.179 - 0.086 - Control 0.276 - 0.179 - 0.090
1:0.0 0.202 76.7 0.147 82.3 0.088 102 1:0.0 0.227 82.0 0.161 90.1 0.086 95.6 1:0.5 0.204 77.4 0.143 80.1 0.087 101 1:0.5 0.229 82.8 0.163 91.4 0.084 92.4 1:1.0 0.207 78.6 0.145 81.0 0.086 99.6 1:1.0 0.230 83.4 0.165 92.5 0.088 96.9 1:3.0 0.217 82.3 0.146 81.5 0.081 94.0 1:3.0 0.229 82.9 0.159 89.2 0.088 96.9 1:5.0 0.226 85.7 0.147 82.0 0.082 95.2 1:5.0 0.228 82.7 0.165 92.4 0.086 95.0 1:7.0 0.234 88.8 0.147 82.3 0.079 91.3 1:7.0 0.231 83.5 0.162 90.7 0.084 92.6 1:9.0 0.236 89.7 0.148 82.8 0.081 93.8 1:9.0 0.231 83.6 0.170 95.0 0.085 94.1
T=24 hr Control 0.320 - 0.158 - 0.089 - Control 0.268 - 0.182 - 0.087 1 : 0 . 0 0 .159 6 0 . 5 0 .114 6 3 . 6 0 .064 7 3 . 6 1 : 0 . 0 0 .178 64 .3 0 .116 6 5 . 0 0 .059 6 4 . 8 1 : 0 . 5 0 .160 60 .8 0 .116 6 4 . 8 0 .060 6 9 . 1 1 : 0 . 5 0 .179 6 4 . 9 0 .123 6 8 . 8 0 .060 6 6 . 4 1 : 1 . 0 0 .156 5 9 . 4 0 .113 6 3 . 4 0 .061 7 0 . 1 1 : 1 . 0 0 .178 6 4 . 6 0 .115 6 4 . 6 0 .064 70 .3 1 : 3 . 0 0 .162 6 1 . 4 0 .114 6 4 . 0 0 .057 6 6 . 4 1 : 3 . 0 0 .191 69 .2 0 .127 7 0 . 8 0 . 0 6 1 6 7 . 3 1 : 5 . 0 0 .154 58 .4 0 .114 63 .7 0 .059 6 8 . 1 1 : 5 . 0 0 .192 6 9 . 3 0 .126 70 .3 0 .063 7 0 . 1 1 : 7 . 0 0 .153 58 .2 0 .108 6 0 . 6 0 .057 6 6 . 2 1 : 7 . 0 0 .194 7 0 . 1 0 .133 7 4 . 6 0 .064 70 .7 1 : 9 . 0 0 .152 57 .6 0 .115 6 4 . 3 0 .059 6 8 . 0 1 : 9 . 0 0 .202 7 3 . 1 0 .138 7 7 . 1 0 .066 72 .7
+ Ratios are calculated on a weight/weight basis as CuS04●5H2O/chelant * TDCu represents the average total dissolved copper of triplicate trials
† %Cu REM represents percent dissolved copper remaining in solution vs. control

Average Data for Lake Canton - First Run (April 12, 1985)
Citric Acid Monohydrate Triethanolamine 0.3 mg/L Spike 0.2 mg/L Spike 0.1 mg/L Spike 0.3 mg/L Spike 0.2 mg/L Spike 0.1 mg/L Spike
Ratio+ TDCu* %Cu REM† TDCu %Cu REM TDCu %Cu REM Ratio TDCu %Cu REM TDCu %Cu REM TDCu %Cu REM T=2 hr Control 0.295 - 0.171 - 0.093 - Control 0.263 - 0.203 - 0.093
1 : 0 . 0 0 .217 7 3 . 6 0 . 1 3 1 76 .8 0 . 0 8 0 8 6 . 3 1 : 0 . 0 0 .164 6 2 . 3 0 .156 7 7 . 0 0 .068 7 7 . 5 1 : 0 . 5 0 .208 7 0 . 5 - 1 : 0 . 5 _ _ _ _ _ _ 1 : 1 . 0 0 .225 7 6 . 4 0 .139 8 1 . 5 0 .080 8 6 . 0 1 : 1 . 0 0 .183 6 9 . 5 0 .176 8 6 . 7 0 .072 7 7 . 5 1 : 2 . 0 0 .250 8 4 . 7 - 1 . 2 . 0 _ _ _ _ _ _ 1 : 3 . 0 - _ 0 .152 8 8 . 9 0 .075 8 1 . 3 1 : 3 . 0 0 .201 7 6 . 2 0 .186 9 1 . 5 0 .072 7 7 . 5 1 : 3 . 5 0 .242 8 2 . 1 _ - - - 1 : 3 . 5 _ - - - - _ 1 : 5 . 0 0 .265 9 0 . 0 0 .162 9 4 . 9 0 .083 8 9 . 2 1 : 5 . 0 0 .229 8 7 . 1 0 .203 1 0 0 . 0 0 .071 7 6 . 4 1 : 7 . 0 - _ 0 . 1 6 0 9 3 . 8 0 . 0 4 1 9 8 . 2 1 : 7 . 0 0 .225 8 5 . 6 0 .185 9 1 . 0 0 .080 8 5 . 4 1 : 9 . 0 - - 0 .157 9 1 . 6 0 .094 1 0 1 . 4 1 : 9 . 0 0 .234 8 8 . 9 0 .181 8 9 . 3 0 .084 9 0 . 4
T=24 hr Control 0.269 - 0.191 - 0.096 - Control 0.291 - 0.178 - 0.091 1:0.0 0.178 60.3 0.125 72.9 0.072 77.7 1:0.0 0.155 58.7 0.126 61.9 0.058 62.1 1:0.5 0.175 59.5 - 1:0.5 _ _ _ _ _ _ 1:1.0 0.195 66.1 0.121 71.0 0.077 83.1 1:1.0 0.165 62.5 0.140 69.0 0.056 60.0 1:2.0 0.208 70.5 - _ _ _ 1:2.0 _ _ _ _ _ _ 1:3.0 - - 0.120 70.0 0.076 81.7 1:3.0 0.204 77.5 0.139 68.3 0.062 66.8 1:3.5 0.209 70.8 - _ _ _ 1:3.5 _ _ _ _ _ _ 1:5.0 0.232 78.6 0.117 68.6 0.079 85.3 1:5.0 0.223 84.7 0.147 72.6 0.062 66.4 1:7.0 - - 0.113 66.3 0.079 85.6 1:7.0 0.217 82.5 0.144 70.9 0.062 66.8 1:9.0 - - 0.121 70.6 0.085 91.4 1:9.0 0.218 82.9 0.152 74.9 0.075 79.8 + Ratios are calculated on a weight/weight basis as CuS04•5H2O/chelant * TDCu represents the average total dissolved copper of triplicate trials † %Cu REM represents percent dissolved copper remaining in solution vs. control

Averaqe Data for Lake Canton - Second Run (June 28, 1985)
Citric Acid Monohydrate Triethanolamine 0.3 mg/L Spike 0.2 mg/L Spike 0.1 mg/L Spike 0.3 mg/L Spike 0.2 mg/L Spike 0.1 mg/L Spike
Ratio+ TDCu* %Cu REM† TDCu %Cu REM TDCu %Cu REM Ratio TDCu %Cu REM TDCu %Cu REM TDCu %Cu REM T=2 hr Control 0.283 - 0.188 - 0.088 - Control 0.281 - 0.187 - 0.091
1:0.0 0.257 91.0 0.181 96.3 0.086 97.4 1:0.0 0.244 86.7 0.180 96.4 0.086 95.2 1:0.5 0.266 94.1 0.178 94.5 0.087 98.5 1:0.5 0.252 89.6 0.186 99.6 0.085 93.8 1:1.0 0.265 93.9 0.182 96.6 0.088 99.2 1:1.0 0.245 87.2 0.184 98.6 0.085 93.8 1:3.0 0.289 102 0.180 95.7 0.090 101 1:3.0 0.260 92.6 0.188 101 0.084 92.3 1:5.0 0.286 101 0.186 98.9 0.091 103 1:5.0 0.262 93.4 0.188 101 0.088 96.7 1:7.0 0.289 102 0.193 103 0.090 102 1:7.0 0.262 93.4 0.187 100 0.087 96.3 1:9.0 0.293 104 0.189 101 0.109 123 1:9.0 0.264 94.1 0.191 102 0.085 93.8
T=24 hr Control 0.283 - 0.188 - 0.085 - Control 0.283 - 0.179 - 0.090 1:0.0 0.209 73.9 0.159 84.6 0.074 83.8 1:0.0 0.224 79.8 0.154 82.2 0.072 79.8 1:0.5 0.209 73.9 0.156 82.8 0.075 84.5 1:0.5 0.224 79.8 0.157 83.8 0.072 79.4 1:1.0 0.225 79.6 0.161 85.8 0.075 84.9 1:1.0 0.225 8.01 0.157 84.1 0.077 84.6 1:3.0 0.234 82.8 0.159 84.6 0.073 82.3 1:3.0 0.244 86.8 0.154 82.4 0.077 84.6 1:5.0 0.245 86.7 0.150 79.8 0.073 82.3 1:5.0 0.242 86.1 0.163 87.0 0.074 82.0 1:7.0 0.242 85.5 0.166 88.3 0.074 83.8 1:7.0 0.245 87.1 0.157 84.1 0.080 87.9 1:9.0 0.252 89.0 0.170 90.6 0.072 81.1 1:9.0 0.250 89.0 0.168 89.7 0.085 93.8
+ Ratios are calculated on a weight/weight basis as CUSO4•5H2O/chelant , * TDCu represents the average total dissolved copper of triplicate trials
† %Cu REM represents percent dissolved copper remaining in solution vs. control

Average Data for Rend Lake - First Run (June 7, 1985)
Citric Acid Monohydrate Triethanolamine 0.3 mg/L Spike 0.2 mg/L Spike 0.1 mg/L Spike 0.3 mg/L Spike 0.2 mg/L Spike 0.1 mg/L Spike
Ratio+ TDCu* %Cu REMt TDCu %Cu REM TDCu %Cu REM Ratio TDCu %Cu REM TDCu %Cu REM TD6u %Cu REM
T=2 hr Control 0.281 - 0.185 - 0.092 - Control 0.279 - 0.182 - 0.096 1:0.0 0.225 80.1 0.145 78.1 0.077 84.1 1:0.0 0.197 70.4 0.140 77.1 0.078 81.6 1:1.0 0.245 87.2 0.156 83.9 0.079 86.2 1:1.0 0.206 73.7 0.144 79.1 0.073 76.0 1:3.0 0.258 91.9 0.165 89.0 0.082 89.5 1:3.0 0.202 72.4 0.145 79.5 0.080 83.3 1:5.0 0.275 97.8 0.178 95.9 0.084 91.7 1:5.0 0.216 77.2 0.151 82.8 0.076 79.5 1:7.0 0.278 98.8 0.175 94.5 0.088 95.3 1:7.0 0.211 75.4 0.149 81.9 0.072 75.3 1:9.0 0.279 99.5 0.179 96.3 0.087 94.0 1:9.0 0.208 74.6 0.145 79.9 0.077 79.9
T=24 hr Control 0.284 - 0.205 - 0.093 - Control 0.281 - 0.180 - 0.092 1:0.0 0.172 61.3 0.118 63.7 0.062 67.8 1:0.0 0.153 54.8 0.104 57.1 0.061 63.2 1.1.0 0.185 65.9 0.118 63.6 0.064 69.9 1:1.0 0.166 59.5 0.114 62.5 0.058 60.8 1:3.0 0.184 65.4 0.120 64.6 0.066 71.4 1:3.0 0.175 62.5 0.114 62.5 0.063 65.3 1:5.0 0.190 67.5 0.121 65.2 0.067 73.2 1:5.0 0.187 66.8 0.119 65.4 0.060 62.8 1:7.0 0.197 70.2 0.119 63.9 0.064 69.6 1:7.0 0.194 69.5 0.119 65.4 0.059 61.8 1:9.0 0.209 74.5 0.118 63.4 0.068 73.9 1:9.0 0.196 70.2 0.130 71.4 0.062 64.2
+ Ratios are calculated on a weight/weight basis as CuSO4●5H2O/chelant * TDCu represents the average total dissolved copper of triplicate trials
† %Cu REM represents percent dissolved copper remaining in solution vs. control

Average Data for Rend Lake - Second Run (August 14, 1985)
Citric Acid Monohydrate Triethanolamine 0.3 mg/L Spike 0.2 mg/L Spike 0.1 mg/L Spike 0.3 mg/L Spike 0.2 mg/L Spike 0.1 mg/L Spike
Ratio+ TDCu* %Cu REM† TDCu %Cu REM TDCu %Cu REM Ratio TDCu %Cu REM TDCu %Cu REM TDCu %Cu REM T=2 hr Control 0.297 - 0.195 - 0.098 - Control 0.293 - 0.182 - 0.098
1:0.0 0.212 71.4 0.149 76.7 0.082 83.5 1:0.0 0.206 70.2 0.152 83.5 0.084 85.2 1:0.5 0.224 75.5 0.147 75.7 0.083 85.2 1:0.5 0.209 71.3 0.150 82.4 0.083 84.4 1:1.0 0.228 76.7 0.150 77.1 0.077 78.4 1:1.0 0.206 70.3 0.150 82.4 0.079 80.1 1:3.0 0.249 83.8 0.156 80.0 0.076 78.0 1:3.0 0.212 72.3 0.146 80.0 0.080 81.0 1:5.0 0.263 88.4 0.165 84.5 0.084 85.3 1:5.0 0.212 72.1 0.144 79.2 0.077 77.9 1:7.0 0.259 87.2 0.163 83.9 0.082 84.2 1:7.0 0.213 72.5 0 151 82.6 0.077 78.8 1:9.0 0.261 88.0 0.168 86.4 0.087 89.3 1:9.0 0.216 73.7 0.152 83.2 0.078 79.1
T=24 hr Control 0.291 - 0.200 - 0.096 - Control 0.283 - 0 167 - 0.096 1:0.0 0.135 45.3 0.130 52.7 0.058 58.6 1:0.0 0.142 48.6 0.109 59.9 0.059 60.4 1:0.5 0.138 46.3 0.095 48.8 0.056 56.9 1:0.5 0.154 52.6 0.108 59.4 0.058 58.7 1:1.0 0.139 46.8 0.103 53.0 0.056 56.9 1:1.0 0.146 49.7 0.106 58.0 0.055 55.5 1:3.0 0.153 51.5 0.101 51.6 0.056 56.9 1:3.0 0.156 53.1 0 108 59.4 0.060 60.8 1:5.0 0.135 45.3 0.102 52.6 0.053 54.3 1:5.0 0.166 56.7 0.109 60.0 0.054 55.2 1:7.0 0.159 53.4 0.105 53.9 0.053 54.3 1.7.0 0.166 56.7 0.121 66.3 0.060 61.0 1:9.0 0.150 50.4 0.106 54.4 0.057 58.6 1:9.0 0.179 61.2 0 120 65.9 0.058 59.3
+ Ratios are calculated on a weight/weight basis as CuSO4●5H2O/chelant * TDCu represents the average total dissolved copper of triplicate trials † %Cu REM represents percent dissolved copper remaining in solution vs. control
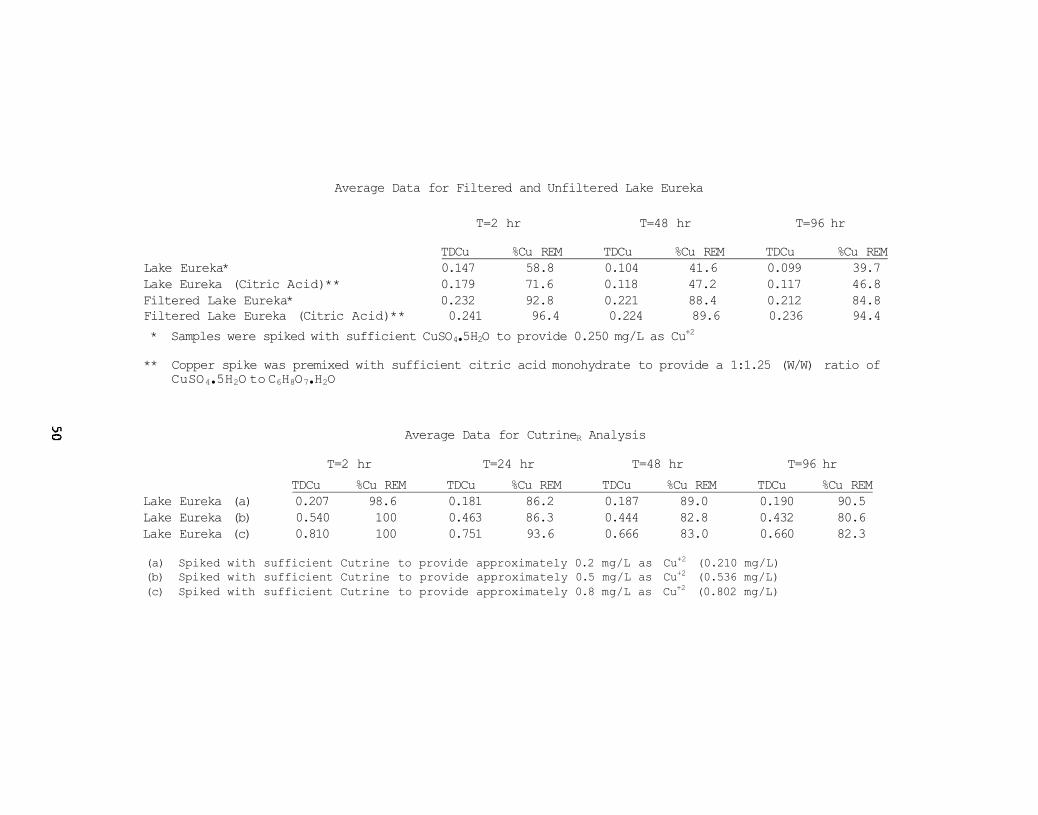
Average Data for Filtered and Unfiltered Lake Eureka
T=2 hr T=48 hr T=96 hr
TDCu %Cu REM TDCu %Cu REM TDCu %Cu REM Lake Eureka* 0.147 58.8 0.104 41.6 0.099 39.7 Lake Eureka (Citric Acid)** 0.179 71.6 0.118 47.2 0.117 46.8 Filtered Lake Eureka* 0.232 92.8 0.221 88.4 0.212 84.8 Filtered Lake Eureka (Citric Acid)** 0.241 96.4 0.224 89.6 0.236 94.4 * Samples were spiked with sufficient CuSO4•5H2O to provide 0.250 mg/L as Cu+2
** Copper spike was premixed with sufficient citric acid monohydrate to provide a 1:1.25 (W/W) ratio of CuSO4•5H2O to C6H8O7•H2O
Average Data for CutrineR Analysis
T=2 hr T=24 hr T=48 hr T=96 hr TDCu %Cu REM TDCu %Cu REM TDCu %Cu REM TDCu %Cu REM
Lake Eureka (a) 0.207 98.6 0.181 86.2 0.187 89.0 0.190 90.5 Lake Eureka (b) 0.540 100 0.463 86.3 0.444 82.8 0.432 80.6 Lake Eureka (c) 0.810 100 0.751 93.6 0.666 83.0 0.660 82.3
(a) Spiked with sufficient Cutrine to provide approximately 0.2 mg/L as Cu+2 (0.210 mg/L) (b) Spiked with sufficient Cutrine to provide approximately 0.5 mg/L as Cu+2 (0.536 mg/L) (c) Spiked with sufficient Cutrine to provide approximately 0.8 mg/L as Cu+2 (0.802 mg/L)

Optimal Chelant/Copper Ratios for Maximizing Copper Solubility in Natural Water Using Cxtric Acid and Triethanolamine
ILENR/RE-EH-86/09
September 1986
Raman K. Raman and Billy K. Cook
Illinois State Water Survey Water Quality Section Foot of MacArthur Hwy P.O. Box 697 Peoria, IL 61652
85/6005 and 86/6005
(C)EH 22 and EH 22 (G)
Illinois Department of Energy and Natural Resources Energy and Environmental Affairs Division 325 W. Adams Springfield, IL 62704-1892
Taste and odor problems that plague waterworks using impoundments as a source can most often be attributed to algal blooms, mainly blue-greens (Sigworth, 1957). These taste and odor problems are compounded by other problems such as reduced filter runs, increased chemical costs, etc. Physical solutions to the problems such as harvesting of algae or control of excessive nutrient inputs can be extremely costly and time consuming in comparison to chemical methods of bloom control. Although several types of algicides are commercially available, copper formulations seem to enjoy the greatest popularity due in part to their relatively low toxicity to higher organisms, particularly fish, when applied at accepted algicidal levels (Mackenthun and Cooley, 1952). It is evident from the results of this study that the formation of copper complexes such as copper-citric acid and copper-TEA does slightly inhibit the precipitation of copper from natural waters. However, it is still a matter of debate as to the toxicity of these complexes in their role as algicides. Regardless of this issue, guidelines for the proper proportions of chelated copper formulations are a necessity in water treatment operations involving "on-site" preparations. This study indicates that any greater than a 1:5 (w/w) ratio of either copper sulfate pentahydrate:citric acid monohydrate or copper sulfate pentahydrate: triethanolamine results in little or no additional inhibition of copper precipitation. This study points to the need to carry out field scale investigations to determine the efficacy of using citric acid as a chelant within an economically and ecologically reasonable range (1:0.5 to 1:3) of copper sulfate pentahydrate.to chelant ratios.
Algal Bloom; Algicides; Lakes; Illinois; Algae
Illinois; Lakes; Lake Canton; Lake Eureka; Triethanolamine; Copper Sulfate Rend Lake; Chelanting Agent; Blue Green Algae
07 B
Available at IL Depository Libraries or from National Technical Information Service, Springfield, VA 22161
No restriction on distribution. Unclassified
Unclassified
50