Embed Size (px)
Citation preview
--------~------------------------------------------~----------------------~-----------------------------,
1961{62, No. 3 89
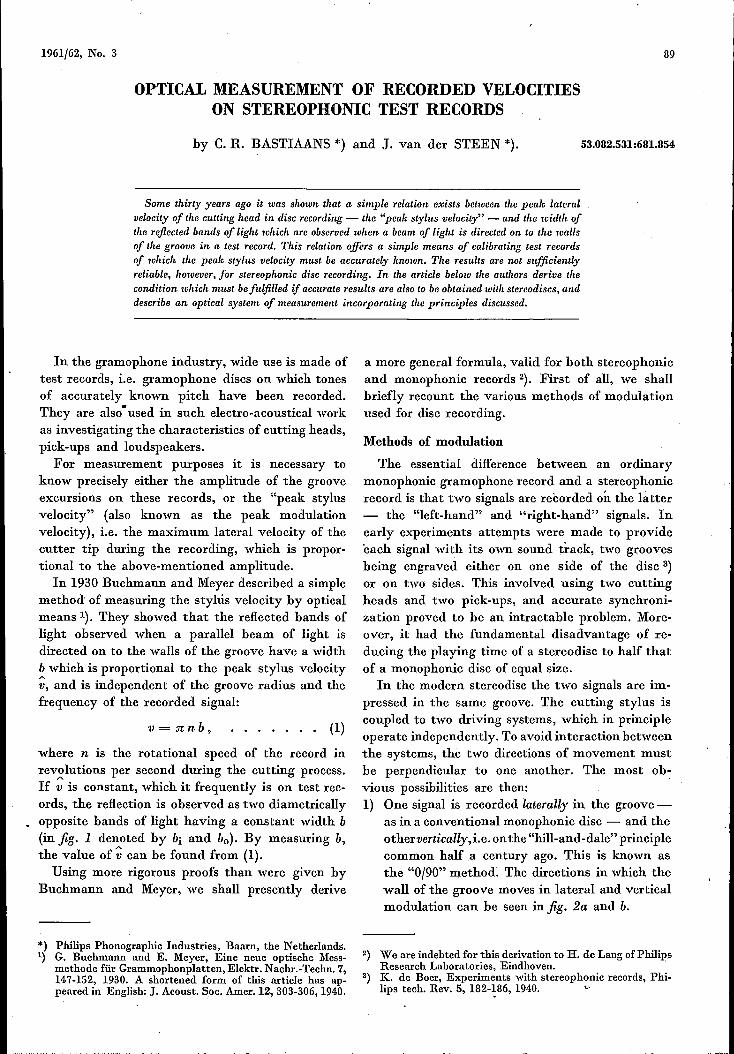
OPTICAL MEASUREMENT OF RECORDED VELOCITIESON STEREOPHONIC TEST RECORDS
hy C. R. BASTIAANS *) and J. van der STEEN *).
Some thirty years ago it was shown that a simple relation exists between the peak lateralvelocity of the cutting head in disc recording - the "peak stylus velocity" - and the width ofthe reflected bands of light which are observed when a beam of light is directed on to the wallsof the groove in a test record. This relation offers a simple means of calibrating test recordsof which the peak stylus velocity must be accurately known. The results are not sufficientlyreliable, however, for stereophonic disc recording. In the article below the authors derive thecondition which must be fulfilled if accurate results are also to be obtained with stereodiscs, anddescribe an optical system of measurement incorporating the principles discussed.
In the gramophone industry, wide use is made oftest records, i.e. gramophone discs on which tonesof accurately known pitch have heen recorded.They are also"used in such electro-acoustical workas investigating the characteristics of cutting heads,pick-ups and loudspeakers.
For measurement purposes it is necessary toknow precisely either the amplitude of the grooveexcursions on these records, or the "peak stylusvelocity" (also known as the peak modulationvelocity), i.e. the maximum lateral velocity of thecutter tip during the recording, which is propor-tional to the ahove-mentioned amplitude.
In 1930 Buchmann and Meyer described a simplemethod of measuring the stylus velocity hy opticalmeans 1). They showed that the reflected hands oflight ohserved when a parallel heam of light isdirected on to the walls of the groove have a widthb which is proportional to the peak stylus velocity;;, and is independent of the groove radius and thefrequency of the recorded signal:
v = n n b ,
where n is the rotational speed of the record inrevolutions per second during the cutting process.If ;;is constant, which it frequently is on test rec-ords, the reflection is observed as two diametrically
_ opposite hands of light having a constant width b(in fig. 1 denoted hy bi and bo). By measuring b,the value of ~ can be found from (1).
Using more rigorous proofs than were given hyBuchmann and Meyer, we shall presently derive
*) Philips Phonographic Industries, Baarn, the Netherlands.1) G. Buehmann and E. Meyer, Eine neue optische Mess-
methode für Grammophonplatten, Elektr. Naehr.-Teehn. 7,147-152, 1930. A shortened form of this article has ap-peared in English: J. Aeoust. Soc. Amer.12, 303-306, 1940.
53.082.531 :681.854
a more general formula, valid for hoth stereophonicand monophonic records 2). First of all, we shallhriefly recount the various methods of modulationused for disc recording.
Methods of modulation
(1)
The essential difference hetween an ordinarymonophonic gramophone record and a stereophonicrecord is that two signals are recorded on the latter- the "left-hand" and "right-hand" signals. Inearly experiments attempts were made to provideeach signal with its own sound track, two groovesheing engraved either on one side of the disc 3)or on two sides. This involved using two cuttingheads and two pick-ups, and accurate synchroni-zation proved to he an intractahle prohlem. More-over, it had the fundamental disadvantage of re-ducing the playing time of a stereodisc to half thatof a monophonic disc of equal size.
In the modern stereodisc the two signals are im-pressed in the same groove. The cutting stylus iscoupled to two driving systems, which in principleoperate independently. To avoid interaction betweenthe systems, the two directions of movement musthe perpendicular to one another. The most oh-vious possibilities are then:1) One signal is recorded laterally in the groove-
as in a conventional monophonic disc -- and theothervertically, i.e. on the "hill-and-dale" principlecommon half a century ago. This is known asthe "0/90" method, The directions in which thewall of the groove moves in lateral and verticalmodulation can he seen in fig. 2a and b.
2) We are indebted for this derivation to H. de Lang of PhilipsResearch Laboratories, Eindhoven. .
3) K. de Boer, Experiments with stereophonic records, Phi-lips tech. Rev. 5, 182-~86, 1940. ,.
90 PHILIPS TECHNICAL REVIEW VOLUME 23
records are produced by the 45(45 method. Sometest records, however, are modulatcd by the 0(90system for the purpose of investigating certaincharacteristics of stereophonic pick-ups for 450
-
modulated discs.In both methods it is possible in principle to keep
the two signal channels entirely distinct. In prac-tice, however, some degree of cross-talk is inevita-ble. Cross-talk causes distortion of the stereophonicsound picture and depends on the geometry of thecutting stylus and pick-up 5). With the light-patternsystem of measurement it is possible to determinenot only the stylus velocity but also, in principleat least, the degree of cross-talk in so far as it isdue to the cutting head and is thus "in the record",and not "in the pick-up".
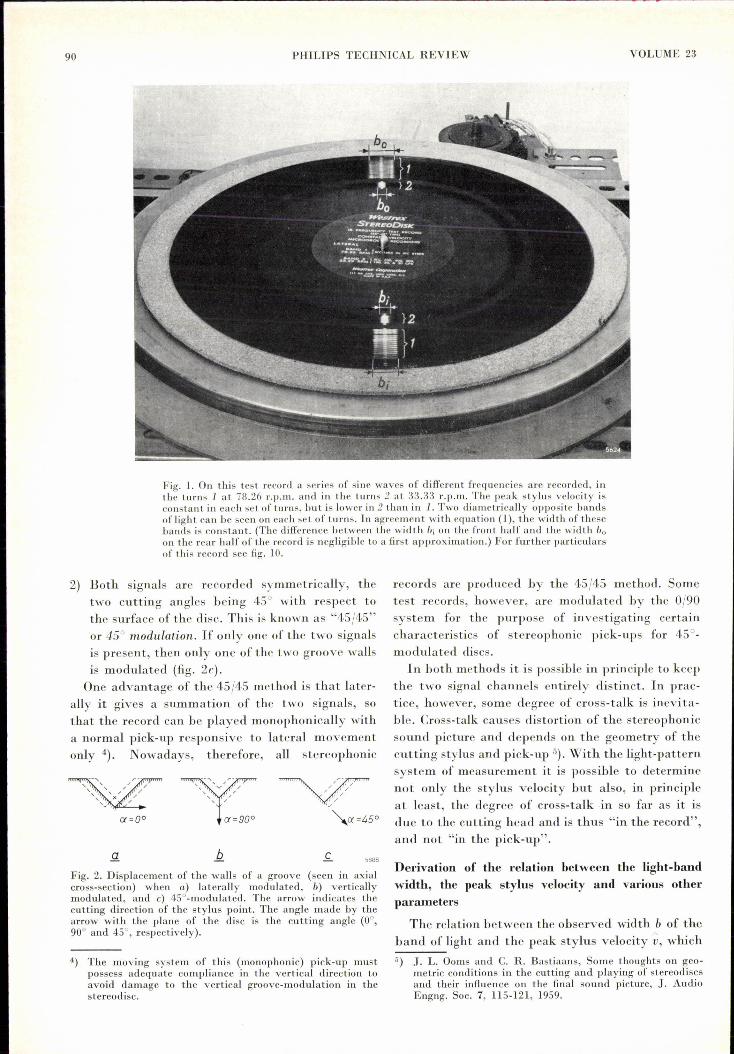
Fig. 1. On this test record a series of sine waves of different frequencies are recorded, inthe turns 1 al 78.26 r.p.m. and in the turns 2 al 33.33 r.p.l11. The peak s tylus velocity isconstant in each set of turns, but is lower in 2 than ill 1. Two diametrically opposite bandsof light can be seen on each set of turns. In agreement with equation (1), the width of thesebands is constant. (The difference between the width b, on the front half and the width boon the rear half of the record is negligible to a first approximation.) For further particularsof this record see fig. 10.
2) Both signals are recorded symmetrically, thetwo cutting angles being 45° with respect tothe surface of thc disc. This is known as "45(45"or 45° modulation, If only one of the two signalsis present, thcn only one of the two groove wallsis modulated (fig. 2e).One advantage of the 4.5(45method is that later-
ally it gives a summation of the two signals, sothat the record can bc played monophonically witha normal pick-up responsive to lateral movementonly 4). Nowadays, therefore, all stereophonic
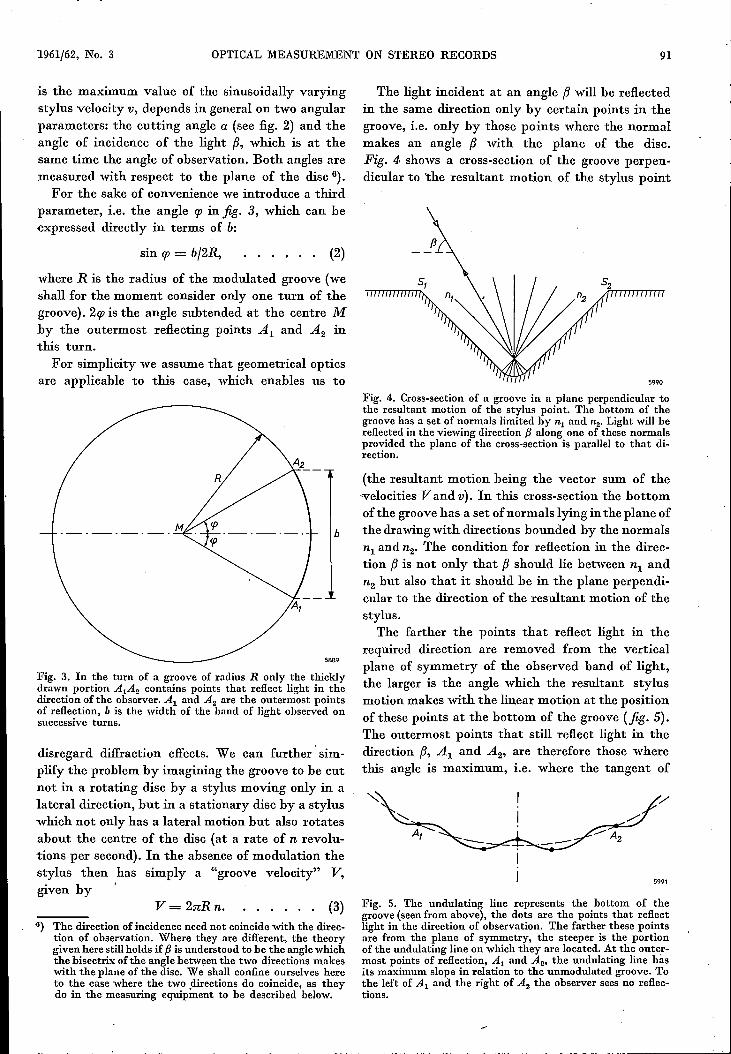
Q
Fig. 2. Displacement of the walls of a groove (seen in axialcross-section) when a) laterally modulated, b) verticallymodulated, and c) 4·5°-modulated. The arrow indicates thecutting direction of the stylus point. The angle made by thearrow with the plane of the disc is the cutting angle (0°,90° and 45°, respectively).
4) The moving system of this (monophonic) pick-up mustpossess adequ ate compliance in the vertical direction toavoid damage to the vertical groove-modulation in thestereodisc.
5888
Del'Ïvation of the relation between the light-bandwidth, the peak stylus velocity and various otherparalneters
The relation between the observed width b of theband of light and the peak stylus velocity ~, which5) J. L. Ooms and C. R. Bastiaans, Some thoughts on geo-
metric conditions in the cutting and playing of stereodiscsand their influence 011 the final sound picture, J. AudioEngng. Soc. 7, 115-121, 1959.
1961/62, No. 3 OPTICAL MEASUREMENT ON STEREO RECORDS 91
is the maximum value of the sinusoidally varyingstylus velocity v, depends in generalon two angularparameters: the cutting angle a (see fig. 2) and theangle of incidence of the light (J, which is at thesame time the angle of observation. Both angles aremeasured with respect to tbe plane of the disc 6).For the sake of convenience we introduce a third
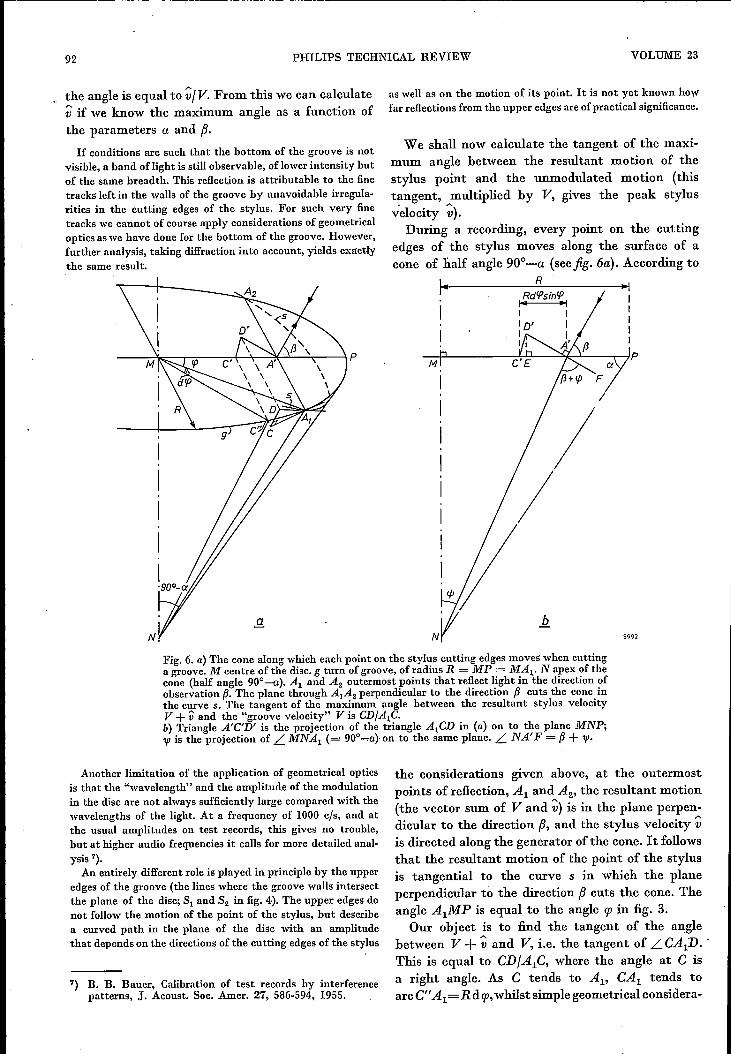
parameter, i.e. the angle qJ in fig. 3, which can beexpressed directly in terms of b:
sin qJ= b/2R,
where R is the radius of the modulated groove (weshall for the moment consider only one turn of thegroove). 2qJ is the angle subtended at the centre Mby the outermost reflecting points Al and A2 inthis turn.
For simplicity we assume that geometrical opticsare applicable to this case, which enables us to
Fig. 3. In the turn of a groove of radius R only the thicklydrawn portion AIA2 contains points that reflect light in thedirection of the observer. Al and A2 are the outermost pointsof reflection, b is the width of the band of light observed onsuccessive turns.
disregard diffraction effects. We can further' sim-plify the problem by imagining the groove to be cutnot in a rotating disc by a stylus moving only in alateral direction, but in a stationary disc by a styluswhich not only has a lateral motion but also rotatesabout the centre of the disc (at a rate of n revolu-tions per second). In the absence of modulation thestylus then has simply a "groove velocity" V,given by ,
V= 2nRn.G) The direction of incidence need not coincide with the direc-
tion of observation. Where they are different, the theorygiven here still holds if f3 is understood to be the anglewhichthe bisectrix of the angle benveen the two directions makeswith the plane of the disc. We shall confine ourselves hereto the case where the two jlirections do coincide, as theydo in the measuring equipment to be described below.
The light incident at an angle {J will be reflected.in the same direction only by certain points in thegroove, i.e. only by those points where the normalmakes an angle {J with the plane of the disc.Fig. 4. shows a cross-section of the groove perpen-dicular to 'the resultant motion of the stylus point
(2)
Fig. 4. Cross-section of a groove in a plane perpendicular tothe resultant motion of the stylus point. The bottom of thegroove has a set of normals limited by nl and n2• Light will bereflected in the viewing direction f3 along one of these normalsprovided the plane of the cross-section is parallel to that di-rection.
5889
(the resultant motion being the vector sum of the'velocities V and v). In this cross-section the bottomof the groove has a set of normals lying in the plane ofthe drawing with directions bounded by the normalsnl and n2• The condition for reflection in the direc-tion {J is not only that {J should lie between nl andn2 but also that it should he in the plane perpendi-cular to the direction of the resultant motion of thestylus.The farther the points that reflect light in the
required direction are removed from the verticalplane of symmetry of the observed band of light,the larger is the angle which the resultant stylusmotion makes with the linear motion at the positionof these points at the bottom of the groove (fig. 5).The outermost points that still reflect light in thedirection {J, Al and A2, are therefore those wherethis angle is maximum, i.e. where the tangent of
5991
(3) Fig. 5. The undulating line represents the bottom of thegroove (seenfrom above), the dots are the points that reflectlight in the direction of observation. The farther these pointsare from the plane of symmetry, the steeper is the portionof the undulating line on which they are located. At the outer-most points of reflection, Al and A2' the undulating line hasits maximum slope in relation to the unmodulated groove. Tothe left of Al and the right of Az the observer sees no reflec-tions.
92 PHILIPS TECHNICAL REVIEW VOLUME 23
the angle is equal to ~/V. From this we can calculate:;;if we know the maximum angle as a function ofthe parameters a and {J.
If conditions are such that the bottom of the groove is notvisible, a band of light is still observable, of lower intensity butof the same breadth. This reflection is attributable to the finetracks left in the walls of the groove by unavoidable irregula-rities in the cutting edges of the stylus. For such very finetracks we cannot of course apply considerations of geometricaloptics aswe have done for the bottom of the groove. However,further analysis, taking diffraction into account, yields exactlythe same result.
as well as on the motion of its point. It is not yet known howfar refleetions from the upper edges are of practical significanee.
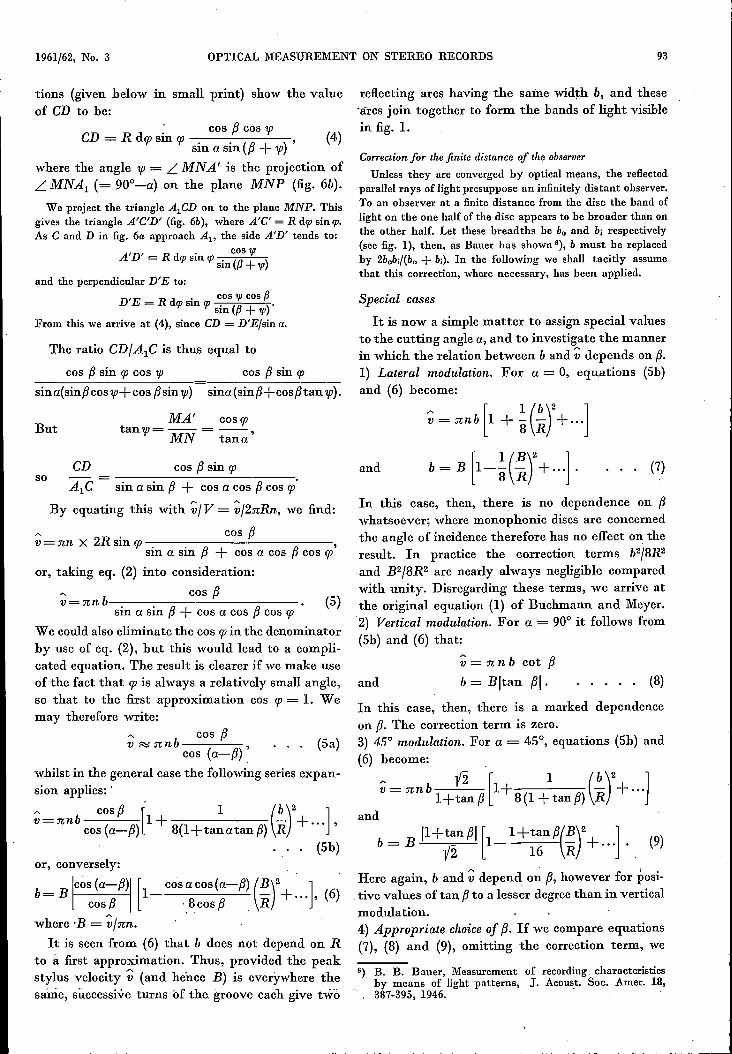
We shall now calculate the tangent of the maxi-mum angle between the resultant motion of thestylus point and the unmodulated motion (thistangent, multiplied by V, gives the peak stylusvelocity ~).
During a recording, every point on the cuttingedges of the stylus moves along the surface of acone of half angle 90o-a (seefig. 6a). According to
R
N
IIIII
~M~--------~~--~~----~P
5902
the considerations given above, at the outermostpoints of reflection, Al and A2, tbe resultant motion(the vector sum of V and ~) is in the plane perpen-dicular to the direction {J, and the stylus velocity:;;is directed along the generator of the con.e.It followsthat the resultant motion of the point of the stylusis tangential to the curve s in which the planeperpendicular to the direction {J cuts the cone. Theangle AIMP is equal to the angle ((J in fig. 3.
Our object is to find the tangent of the anglebetween V +~and V, i.e. the tangent of LCAID.:This is equal to CD/AIC, where the angle at C isa right angle. As C tends to AI' CAI tends toare C"Al =Rd ((J, whilst simple geometrical considera-
Fig. 6. a) The cone along which each point on the stylus cutting edges moves when cuttinga groove.M centre of the disc. g turn of groove, of radius R = MP = MA~. N apex of thecone (half angle 90°-a). Al and A2 outermost points that reflect light in the direction ofobservation p. The plane through A1A2 perpendicular to the direction p cuts the cone inthe curve s. The tangent of the maximum angle between the resultant stylus velocityV + v and the "groove velocity" V is CD/AlC.b) Triangle A'C'D' is the projection of the triangle AlCD in (a) on to the plane MNP;'IJl is the projection of L MNA1 (= 90°-,.a) on to the same plane. L NA' F= P+ 'IJl.
Another limitation of the application of geometrical opticsis that the "wavelength" and the amplitude of the modulationin the disc are not always sufficiently large compared with thewavelengths of the light. At a frequency of 1000 cis, and atthe usual amplitudes on test records, this gives no trouble,but at higher audio frequencies it calls for more detailed anal-ysis 7).An entirely different role is played in principle by the upper
edges of the groove (the lines where the groove walls Interseetthe plane of the disc; 81 and 82 in fig. 4). The upper edges donot follow the motion of the point of the stylus, but describea curved path in the plane of the disc with an amplitudethat depends on the directions of the cutting edges of the stylus
7) B. B. Bauer, Calibration of test records by interferencepatterns, J. Acoust. Soc. Amer. 27, 586-594, 1955.
1961/62, No. 3 OPTICAL MEASUREMENT ON STEREO RECORDS 93
tions (given below III small print) show the valueof CD to be:
cos fJ cos 'IjlCD = R dcpsin cp ,(4)
sin a sin (fJ + 'Ijl)where the angle 'Ijl = L MNA' is the projection ofL MNAI (= 90°-a) on the plane MNP (fig. 6b).We project the triangle AlCD on to the plane MNP. This
gives the triangle A'C'D' (fig. 6b), where A'C' = R dIPsin lp.
As C and D in fig. 6a approach Al' the side A'D' tends to:
A'D' Rd' cos 'Ijl= lp sm lp sin (f3 + 'Ijl)
and the perpendicular D'E to:, . cos 'Ijl cos f3
DE = R dIPsm lp sin (f3 + 'Ijl) •
From this we arrive at (4), since CD = D'Elsu: a.
The ratio CD/AIC is thus equal to
cos fJ sin cp cos 'Ijl cos fJ sin cpsina(sinfJ+cosfJtan 'Ijl).sin a(sin fJcos 'Ijl+ cos fJsin 'Ijl)
ButMA' cos cp
tan'ljl=-- = --'-,MN tana
CD cos fJ sin cpso
Al C sin a sin fJ + cos a cos fJ cos cp'
By equating this with ':V/V = ~/2nRn, we find:
- c~fJv = nn X 2R sin cp ,sin a sin fJ + cos a cos fJ cos cp
or, taking eq. (2) into consideration:
" cos fJv= nn b--------_:_------sin a sin fJ + cos a cos fJ cos cp
We could also eliminate the cos cp in the den.ominatorby use of eq. (2), but this would lead to a compli-cated equation, The result is clearer if we make useof the fact that cp is always a relatively small angle,so that to the first approximation cos cp = 1. Wemay therefore write:
" cos fJv ~ rcnb ,cos (a-fJ) ,
whilst in the general case the following series expan-sion applies: .
_ cosfJ [ 1 (b)2]v=nnb 1+ - + ..• ,cos (a-fJ) 8(I+tanatan fJ) R
(Sb)or, conversely:
cos acos (a- fJ) (B)2 ]8' fJ R +... ,(6). cos
where ·B = ~/nn.It is seen from (6) that b does not depend on R
to à first approximation. Thus, provided the peakstylus velocity :i) (and hence B) is everywhere thesanie, successive turns of the, groove each give tWo
reflecting arcs having the same width b, and these'ärcs join together to form the bands of light visiblein fig. 1.
Correction for the finite distance of the observer
Unless they are converged by optical means, the reflectedparallel rays of light presuppose an infinitely distant observer.To an observer at a finite distance from the disc the band oflight on the one half of the disc appears to be broader than onthe other half. Let these breadths be bo and bi respectively(see fig. 1), then, as Bauer has shown 8), b must be replacedby 2bobi/(bo + bi)' In the following we shall tacitly assumethat this correction, where necessary, has been applied.
Special cases
It is now a simple matter to assign special valuesto the cutting angle a, and to investigate the mannerin which the relation between b and':Vdepends on fJ.1) Lateral modulation. For a = 0, equations (Sb)and (6) become:
~= mnb [1+~(~r+...]b = B [I-~(!r+...].and (7)
(5)
In. this case, then, there is no dependence on fJwhatsoever; where monophonic discs are concernedthe angle of incidence therefore has no effect on theresult. In practice the correction terms b2/8R2and B2/8R2 are nearly always negligible comparedwith unity. Disregarding these terms, we arrive atthe original equation (1) of Buchmann and Meyer.2) Vertical modulation. For a = 90° it follows from(Sb) and (6) that:
~ = n n b cot fJb = Bltan fJl.and (8)
(Sa)
In this case, then, there is a marked dependenceon fJ. The correction term is zero.3) 45° modulation. For a = 45°, equations (Sb) and(6) become:
;;= n n b 1'2 [1+ 1 (!!__)2+...]I+tan fJ 8(1 + tanfJ) R
and
b = B II+tan fJl [1- l+tan fJ(!!_)2+ ... ] •y2 16 R , (9)
Here again, b and ~ depend on. fJ, however for posi-tive values of tan. fJ to a less~r degree than in verticalmodulation.4) Appropriate choice of fJ. If we compare equations(7), (8) and (9), omitting the correction term, we
8) B. B. Bauer, Measurement of recording, characteristicsby means of light patterns, J. Acoust, Soc. Amer. 18,387-395, 1946.
94 PHILIPS TECHNICAL REVIEW VOLUME 23
find that for fJ = 45° the same relation holds for(both vertical and lateral modulation, i.e.:
b = v/nn, •... (1)and that the expression for 45° modulation differsfrom (1) by only a factor y2:
b =~j/2/nn.For this reason the apparatus presently to be de-scribed has been designed for an angle of incidenceand observation of 45 0.
5) Cross-talk. Suppose that we wish to record asinusoidal signal by 45° modulation of only onegroove wall on a test record, leaving the other wallunmodulated. If the cutting angle a is exactly 45°"and assuming fJ = 45°, then (9) yields:
b45 = ~i2/nn(disregarding the correction term). If on the otherhand we make fJ = 135°, then with a = 45° wefind from (9):
bI35 = exactly zero.
However, if the cutting angle a is not exactly 45°but 45°+e, the results are:
:;; r: [1 ( ~ )2b45 =-T2 cos e l--cose(cose-sine) --nn 8 nnR
+ ...]and
v _ [1 ( V )2bI35= -- y21sinel 1+ -sine(cose + sine) --nn 8 ,nnR
+...]A certain amount of cross-talk now exists on thesecond wall, the level of which is
10 log (b135)2 dBb45
(10)
below that of the signalon the first wall. The amounte by which the cutting angle differed from 45° isgiven by:
b13Stan e =-b4s
(assuming that we may neglect the correction terms).
(11)
It is here in partieular that interference may he expectedfrom the reflections from the upper edges of the groove, asmentioned above. These reflections give a light-hand widthwhich does not satisfy the basic formula (6) and whichis super-imposed on b45 and b135• Equations (10) and (11) must thereforehe used with some caution.
Experimental verification of the theory
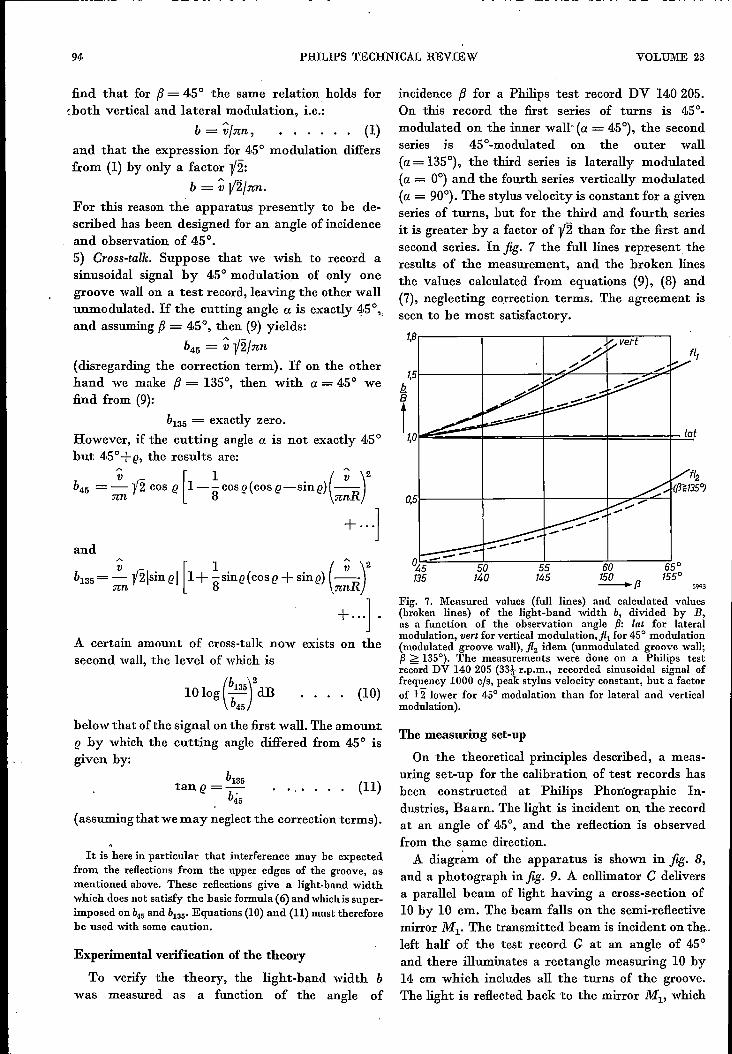
To verify the theory, the light-band width bwas measured as a function of the angle of
incidence fJ for a Philips test record DV 14.0205.On this record the first series of turns is 450-modulated on the inner wall" (a = 45°), the secondseries is 45°-modulated on the outer wall(a= 135°), the third series is laterally modulated(a = 0°) and the fourth series vertically modulated(a = 90°). The stylus velocity is constant for a givenseries of turns, but for the third and fourth seriesit is greater by a factor of y'2 than for the first andsecond series. In fig. 7 the full lines represent theresults of the measurement, and the broken linesthe values calculated from equations (9), (8) and(7), neglecting correction terms. The agreement isseen to be most satisfactory.
~8r-------'-------'-------ï7~~--,fI,
~·~------+-------~~~--;---~~4b
tf.::=====+_ ......===+====I====I=::JE;
55145
60
~f3 59Q3
Fig. 7. Measured values (full lines) and calculated values(broken lines) of the light-band width b, divided by B,as a function of the observation angle f3: lat for lateralmodulation, vert for vertical modulation.jîj for 45° modulation(modulated groove wall), fl2 idem (unmodulated groove wall;f3 ~ 135°). The measurements were done on a Philips testrecord DV 140 205 (33t r.p.m., recorded sinusoidal signaloffrequency 1000 cis, peak stylus velocity constant, but a factorof V2 lower for 45° modulation than for lateral and verticalmodulation).
The measuring set-up
On the theoretical principles described, a meas-uring set-up for the calibration of test records hasbeen constructed at Philips Phonographic In-dustries, Baarn. The light is incident On the recordat an angle of 45°, and the reflection is observedfrom the same direction.A diagr~m of the apparatus is shown in fig. 8,
and a photograph in fig. 9. A collimator C deliversa parallel beam of light having a cross-section of10 by 10 cm. The beam falls on the semi-reflectivemirror MI' The transmitted beam is incident on the,left half of the test record G at an angle of 45°and there illuminates a rectangle measuring 10 by14 cm which includes all the turns of the groove.The light is reflected back to the mirror MI' which
1961/62, No. 3 OPTICAL MEASUREMENT ON STEREO RECORDS
L
G G
o
Q
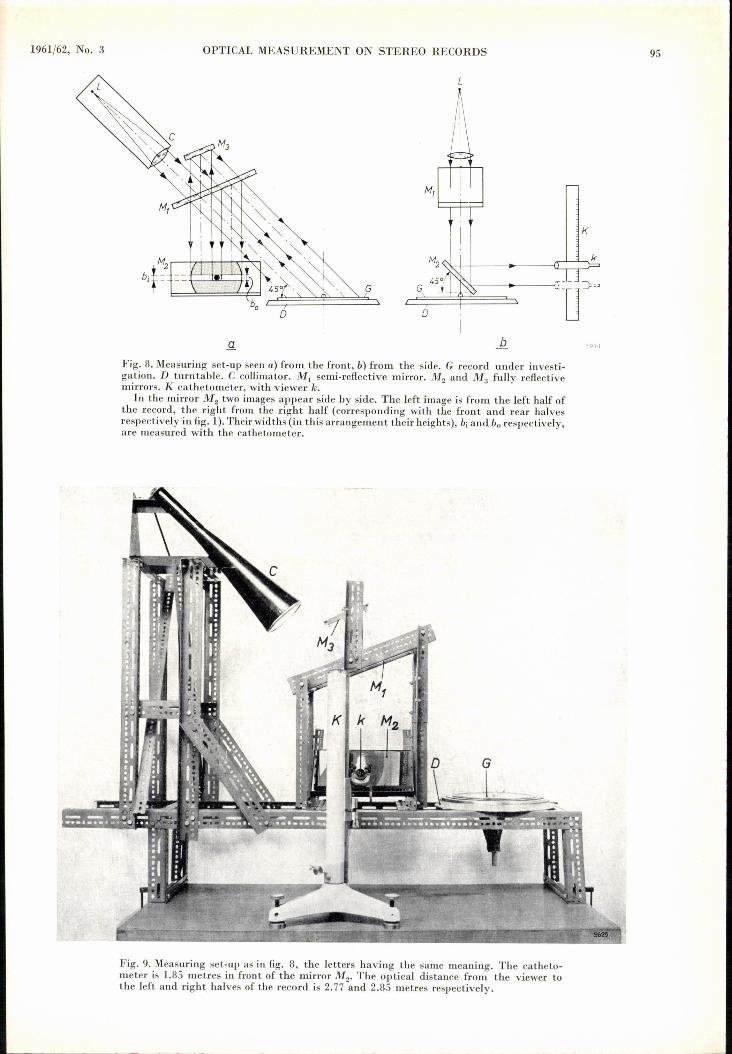
Fig. 8. Measuring set-up seen a) from the front, b) from the side. G record under investi-gation. D turntable. C collimator. MI semi-reflective mirror. M2 and M3 fully reflectivemirrors. K cathetometer, with viewer k.
In the mirror M2 two images appear side by side. The left image is from the left half ofthe record, the right from the right half (corresponding with the front and rear halvesrespectively in fig. I). Their widths (in this arrangement their heights), bi and bo respectively,are measured with the cathetometer.
Fig. 9. Measuring set-up as in fig. 8, the letters having the same meaning. The cathete-meter is 1.85 metres in front of the mirror M2• The optical distance from the viewer tothe left and right halves of the record is 2.77 and 2.85 metres respectively.
95
.------------------------------
96 PlIILIPS TECHNICAL REVIEW VOLUME 23
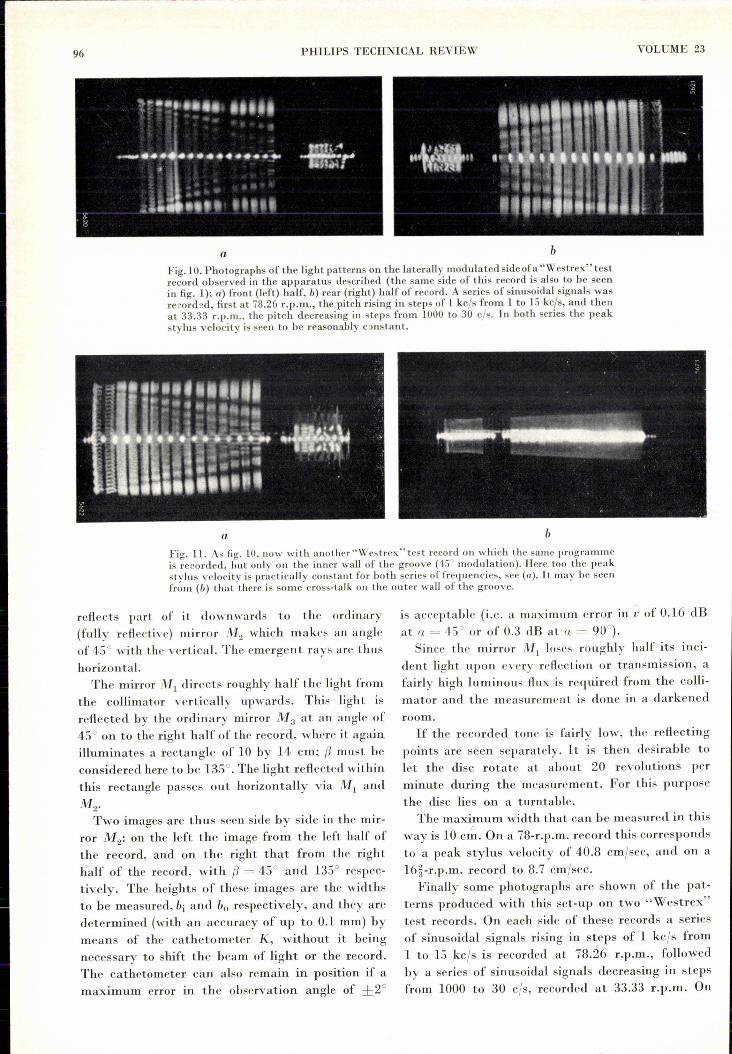
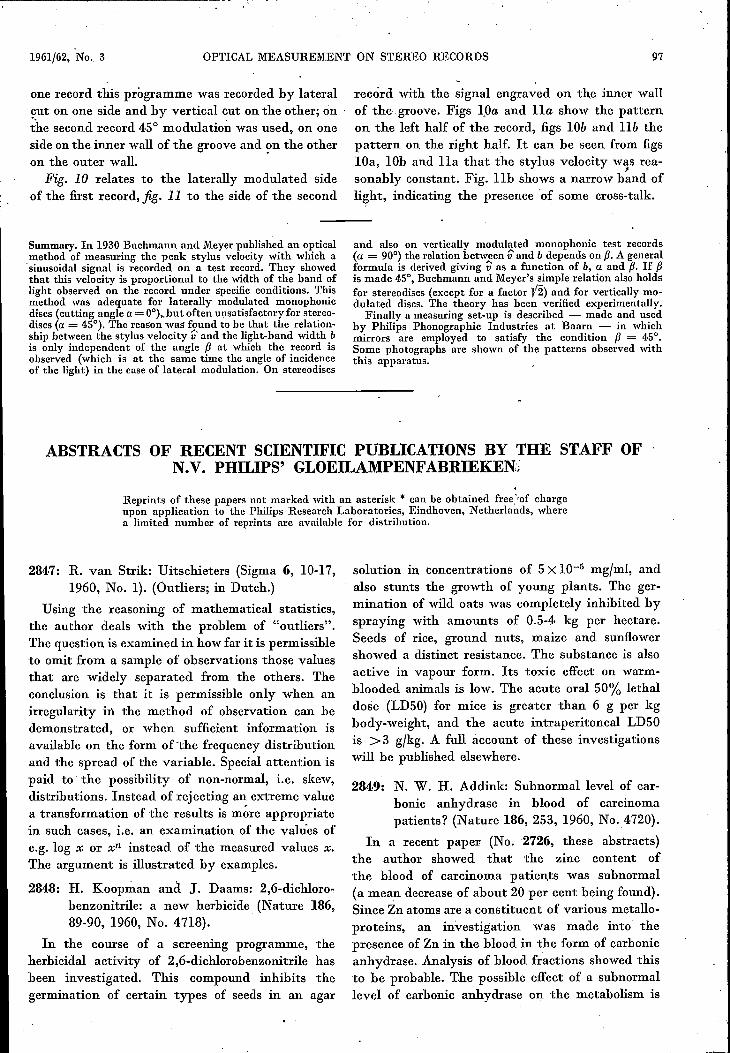
a bFig.ID. Photographs of the light patterns on the laterally modulatedsideofa "Westrex" testrecord observed in the apparatus described (the same side of this record is also to be seenin fig. I); a) front (left) half, b) rear (right) half of record. A series of sinusoidal signals wasrecorded, first at 78.26 r.p.m., the pitch rising in steps of 1 kc/s from 1 to 15 kc/s, and thenat 33.33 r.p.m., the pitch decreasing in steps from 1000 to 30 els, In both series the peakstylus velocity is seen to be reasonably constant.
Fig. 11. As fig. 10, now with another"Westrex" test record on which the same programmeis recorded, but only on the inner wall of the groove (450 modulation). Here too the peakstylus velocity is practically constant for both series of frequencies, see (a.). It may be seenfrom (b) that there is some cross-talk on the outer wall of the groove.
a
reflects part of it downwards to the ordinary(fully reflective) mirror M2 which makes an angleof 4.5°with the vertical. The emergent rays are thushorizontal.
The mirror MI directs roughly half the light fromthe collimator vertically upwards. This light isreflected by the ordinary mirror M3 at an angle of45° on to the right half of the record, where it again.illuminates a rectangle of 10 by 14 cm; f3 must beconsidered here to be 135°. The light reflected withinthis rectangle passes out horizontally via MI and
M2•Two images are thus seen side by side in the mir-
ror M2: on the left the image from the left half ofthe record, and on the right that from the righthalf of the record, with f3 = 45° and 135° respec-tively. The heights of these images are the widthsto be measured, hi and ho respectively, and they aredetermined (with an accuracy of up to 0.1 mm) bymeans of the cathetometer K, without it beingnecessary to shift the beam of light or the record.The cathetometer can also remain in position if amaximum error in the observation angle of ±2°
h
is acceptable (i.e. a maximum error in ~ of 0.16 dBat a = 45° or of 0.3 dB at a = 90°).
Since the mirror MI loses roughly half its inci-dent light upon every reflection or transmission, afairly high luminous flux is required from the colli-mator and the measurement is done in a darkenedroom.If the recorded tone is fairly low, the reflecting
points are seen separately. It is then desirable tolet the disc rotate at about 20 revolutions perminute during the measurement. For this purposethe disc lies on a turntable.
The maximum width that can be measured in thisway is 10 cm. On a 78-r.p.m. record this correspondsto a peak stylus velocity of 40.8 cm/sec, and on a16-i-r.p.m. record to 8.7 cm/sec.
Finally some photographs are shown of the pat-terns produced with this set-up on two" Westrex"test records. On each side of these records a seriesof sinusoidal signals rising in steps of 1 kc/s from1 to 15 kc/s is recorded at 78.26 r.p.m., followedby a series of sinusoidal signals decreasing in stepsfrom 1000 to 30 c/s, recorded at 33.33 r.p.m. On
1961/62, No e . 3 OPTICAL MEASUREMENT ON STEREO RECORDS 97
ABSTRACTS OF RECENT SCIENTIFIC PUBLICATIONS BY THE STAFF OFN.V. PHILIPS' GLOEILAMPENFABRIEKEN;
Reprints of these papers not marked with an asterisk * can be obtained free-of chargeupon application to the Philips Research Laboratories, Eindhoven, Netherlands, wherea limited number of reprints are available for distribution.
one record this programme was recorded by lateral!lut on one side and by vertical cut on the other; onthe second record 45° modulation was used, on oneside on the inner wall of the groove and ~mthe otheron the outer wall.
Fig. 10 relates to the laterally modulated sideof the first record, fig. 11 to the side of the second
Summary. In 1930 Buchmann and Meyer published an opticalmethod of measuring the peak stylus velocity with which a.sinusoidal signal is recorded on a test record. They showedthat this velocity is proportional to the width of the band oflight observed on the record under specific conditions. Thismethod was adequate for laterally modulated monophonicdiscs (cutting angle a= 0°),.but often unsatisfactory for stereo-discs (a = 45°). The reason was found to be that the relation-ship between the stylus velocîty s"and the light-band width bis only independent of the angle p at which the record isobserved (which is at the same time the angle of incidenceof the light) in the case of lateral modulation. On stereodiscs
2847: R. van Strik: Uitschieters (Sigma 6, 10-17,1960, No. I). (Outliers; in Dutch.)
Using the reasoning of mathematical statistics,the author deals with the problem of "outliers".The question is examined in how far it is permissibleto omit from a sample of observations those valuesthat are widely separated from the others. Theconclusion is that it is permissible only when anirregularity in the method of observation can hedemonstrated, or when sufficient information isavailable on the form of 'the frequency distributionand the spread of the variable. Special attention ispaid to the possibility of non-normal, i.e, skew,distributions. Instead of rejecting an extreme valuea transformation of the results is more appropriatein such cases, i.e, an examination of the values ofe.g. log x or xn instead of the measured values x.The argument is illustrated by examples.
2848: H. Koopman and J. Daams: 2,6-dichloro-benzonitrile: a new herbicide (Nature 186,89-90, 1960, No. 4718).
In the course of a screening programme, theherbicidal activity of 2,6-dichlorobenzonitrile hasbeen investigated. This compound inhibits thegermination of certain types of seeds in an agar
record "with the signal engraved on the inner wallof the-groove. Figs l..oa and lla show the patternon the left half of the record, figs lOb and llb thepattern on the right half. It can he seen from figslOa, lOb and lla that the stylus velocity was rea-
Isonably constant. Fig. llb shows a narrow band oflight, indicating the presence of some cross-talk.
and also on vertically modulated monophonic test records(a = 90°) the relation between vand b depends on p. A generalformula is derived giving IJ as a function of b, a and p. If Pis made 4.5°,Buchmann and Meyer's simple relation also holdsfor stereodiscs (except for a factor 112) and for vertically mo-dulated discs. The theory has been verified experimentally.Finally a measuring set-up is described - made and used
by Philips Phonographic Industries at Baarn - in whichmirrors are employed to satisfy the condition p = 4.5°.Some photographs are shown of the patterns observed withthis apparatus.
solution in concentrations of 5 X 10⁻⁵ mgJml, andalso stunts the growth of young plants. The ger-mination of wild oats was completely inhibited byspraying with amounts of 0.5-4 kg per hectare.Seeds of rice, ground nuts, maize and sunflowershowed a distinct resistance. The substance is alsoactive in vapour form. Its toxic cffect on warm-blooded animals is low. The acute oral 50% lethaldose (LD50) for mice is greater than 6 g per kgbody-weight, and the acute intraperitoneal LD50is >3 gJkg. A full account of these investigationswill he published elsewhere.
2849: N. W. H. Addink: Subnormallevel of car-bonic anhydrase in blood of carcinomapatients? (Nature 186, 253, 1960, No. 4.720).
In a recent papel' (No. 2726, these abstracts)the author showed that the zinc content ofthe blood of carcinoma patients was subnormal(a mean decrease of about 20 per cent being found).Since Zn atoms are a constituent of various metallo-proteins, an investigation was made into thepresence of Zn in the blood in the form of carbonicanhydrase. Analysis of blood fractions showed thisto be probable. The possible effect of a subnormallevel of carbonic anhydrase OIl- the metabolism IS
98 PHILIP3 TECHNICAL REVIEW yOLUME 23
mentioned, and the author urges an intensive studyof the anti-carcinogenic activity of this substance.
2850: L. F. Defize and P. C. van der Willigen:Droplet transfer during are welding in variousshielding gases (Brit. Welding J. 7, 297-305,1960, No. 5).
The paper reviews investigations on droplettransfer in the are welding of steel with a consumablebare wire in a shielding gas atmosphere (C02 orargon). Droplet formation is studied with the aid ofhigh-speed cinematography (3000frames per second).In CO2, with the wire connected to the positive pole,the wire melts obliquely and the droplets are-trans-ferred towards the side of the weld be~d. This isáttributed to asymmetrie heating of the wire due toradiation from the pool of molten metal. The markedcontraction of the plasma gives rise to noticeablycoarse droplets unwanted in welding practice. 'Thiscontraction is thought to be connected with the highthermai conductivity of CO2 at arc temperature. Inargon the plasma shows less contraction and no one-sided droplet transfer occurs at high currents. Thefairly large anodic contact surface with argon pro-duces finer droplets, which move axially through theare, When the wire is connected to the negative pole,the droplets are coarse, which is attributed to thesmall diameter of the cathode spot. The addition ofsubstances giving strong thermal electron emissionto the surface of the wire can greatly increase thesize of the cathode spot, and with argon a droplettransfer is obtained which is similar to that at thepositive pole. With CO2 it is not possible in this wayto reduce the coarseness of the droplets.
M. Avinor and G. Meijer: Vanadium-activatedzinc and cadmium sulphide and selenidephosphors (Phys. Chem. Solids 12, 211-215,1960, No. 3/4).
It was known that addition of vanadium (V) killsthe visible fluorescence of ZnS phosphors activatedby Cu or Ag. This killing effect of V is now seen toconsist of translating the emission into the infra-red,in the region of 2.0 fJ-, and not of dissipating theexcitation energy completely into heat. The emissionis also caused by V alone, but in most cases it isenhanced by Cu and Ag. It may be said that mono-valent Cu and Ag behave here as eo-activators ofthetrivalent V. The phosphors investigated were CdS,ZnS, CdSe and ZnSe, activated by V, V + Ag,V + Cu and V + Au. The spectral distributions ofthe emission bands were measured at 300 oK and80 "K, a high-pressure mercury lamp with a waterfilter being used for excitation.
2851:
,
2852: G. Diemer: Power amplifiers using electro-optical effecis (Electronics 33, No. 9, 71-73,1960). -
Short review of 27 power amplifiers that can bedesigned to use various combinations of electric, 'radiative and thermal power (see also Nos. 2784and R 401, these abstracts).
2853: H. Zijlstra: On magnetic annealing of a per-manent magnet alloy (thesis Amsterdam,June 1, 1960).
"Ticonal" G is a magnet steel that derives itshard-magnetic properties from the presence of twofinely dispersed phases, It is known that thesephases occur in the form of elongated particleswhose direction càn be affected by a magnetic fieldduring the heat treatment required for bringing thematerial into a double-phase condition.
The behaviour of this material during isothermalheat treatment in a magnetic field in the tempera-ture range between 700°C and 800 "C is describedin 'this thesis.
From measurements of saturation magnetizationafter isothermal heat treatments it appears that th€ ..decomposition into two phases of the originallyhomogeneous alloy takes place very quickly andmay be considered to be complete after the firstfew minutes.
From measurements of the magnetic anisotropyand of the mean distance between the precipitatedparticles while the heat treatment is going on, itappears that these quantities change their magni-tude during a much longer period of time, so thatthey must be ascribed to changes of the shape andvolume of the precipitated particles, the totalquantity of each phase and its chemical compositionremaining constant. The volume-diffusion processon which these changes are supposed to be based isanalysed thermodynamically and related with thevariations in the free energy of the :fields of themagnetic dipoles about the particles and those in'the free energy in the boundary plane between thephases. The diffusion equation thus obtained isapplied to a model of prolate spheroids. From this,relationships are derived between the time of heattreatment and both the anisotropy and the distancebetween the particles, which appear to be in goodagreement with the experimental results. In orderto investigate the significanee of this model, it .is,compared with a model of oblate spheroids. Thebehaviour of the model is found to have littlesensitivity towards the ·type of the particles.
For comparison, surface diffusion along the

1961/62, No. 3 ABSTRACTS OF RECENT SCIENTIFIC 'PUBLICATIONS 99
boundary planes is investigated theoretically. Thediffusion equations thus obtained are found not tocorrespond to the experimental data, so that it maybe concluded that the latter process has little or noimportance.The good agreement between theory and experi-
ments makes it possible to calculate the interfacial. tension of the boundary between the phases; itappears to be very small (of the order of 1 erg cm-2).The small interfacial tension is found to be of greatimportance for the response of a dispersion-harden-ing magnet steel to heat treatment in a magneticfield. It follows from the theory that the Mishimaalloy, one of this group of magnet steels, which isgenerally believed not to become anisotropic duringannealing in a magnetic field, ought certainly toexhibit this effect during heat treatment extendingover a long period. This is proved by experiment.A description of the measuring methods and
arrangements is given.
2854: J. van der Ster: The production of liquid,nitrogen from atmospheric air using a gasrefrigerating machine (thesis Delft, June 22,1960).
The advent of the gas-refrigerating machine hasmade it possible to produce small amounts of liquidair in an economical way. The present thesis describeshow liquid nitrogen can be produced from atmos-pheric air by combining the refrigerating machinewith an air-rectifying column. The author discussesin .particular the design and construction of aninstallation capable of producing more than 4 litresof liquid nitrogen an hour. The purity of the productis 99.8-99.9%; the power consumption is 1.36 kWh/I.'. The most conspicuous feature compared withother air-fractionating systems is that the air is notcompressed. In consequence of this, the installationand its operation are extremely simple. Watervapour and carbon dioxide are removed from thefeed by cooling the air in such a way that, in spiteof the compact design, the installation can operatecontinuously for a week.A detailed account is given of the automatic
control of the installation, special attention beingpaid to the stability of the reflux. In the' reflux-controlling system a vapour-bubble pump is usedfor returning the liquid nitrogen to the top of thecolumn. An investigation of vapour-bubble pumpsfor liquid nitrogen and liquid oxygen is describedin an appendix. Also included in an appendix' arecalculations and experiments on a hydrometerspecially developed for simply and accuratelymeasuring the purity of the nitrogen product.
The installation is safeguarded against explosion-risks. due to accumulations of hydrocarbons; themeasures adopted to this end are discussed andvarious measurements are described.
2855: G. Meijer and R. van der Veen: Dual effectof nightbreak light (Acta bot. neerl. 9,220-223, 1960, No. 2).
Experiments with Salvia occidentalis, a short-dayplant, showed. that red nightbreak light whichnormally is effective in causing a long-day effect,can under certain condirions antagonize the long-day effect of a supplemental light period, thuscausing a short-day effect. This short-day effect ofnightbreak light disappears when the length of thenightbreak period is increased or when it is followedby an irradiation with far red (= near infra-red).
2856: E. H. Reerink, H. F. L. Schöler, P. Wester-hof, A. Querido, A. A. H. Kassenaar, E.Dicz-falusy and K. C. Tillinger: A new class ofhormonally active steroids (Nature 186,168-169,1960, No. 4719).
Preliminary communication concerning animaand clinical experiments with new synthetic com-pounds. Of these compounds the C-9 hydrogen atomoccupies the {3configuration and the methyl groupat C-I0 the a configuration. Therefore the com-pounds prepared represent the 9{3,lOa analogues ofthe steroids of the natural series. Some of thecompounds investigated showed marked progesta-tional activity after parenteral and oral administra-tion. No side-effects were observed. A full reportwill be published elsewhere.
2857: J. Verweel and B. J. M. Roovers: Magneticproperties and conduction phenomena in pureand substituted yttrium iron garnets (Solidstate physics in electronics and telecommuni-cations, Proc. int. Conf., Brussels, June 1958,edited by M. Désirant and J. L. Michiels,Vol. 3, pp. 475-487, Academic Press, London1960).
In the substance YaFe50w which has a garnetstructure, ionic substitutions of divalent or tetra-valent cations can be carried out which affect theresistivity. Replacement of a small amount c5ofy3+by Ca2+ can cause some of the iron ions to becometetravalent. In the same way replacement of c5Fe3+by c5Ti4+or c5Si4+can cause c5Fe3+to be reduced toc5Fe2+. Samples were prepared and some physicalproperties, such as the resistivity as a function oftemperature and the thermoelectric power, wereinvestigated for different values of c5.The initial(complex) p.ermeability was measured as a function
.---------------:------:-~--------:--:-----------~-~.~
100 PHILIPS TECHNICAL REVIEW VOLUME 23
of frequency and temperature, and the dispersionmeohanisms are discussed.
2858: J. Smit, F. K. Lotgering and U. Enz: Aniso-tropy properties of hexagonal ferrimagneticoxides (J. appl. Phys. 31, suppl. to No. 5,137 S-141 S, 1960).
In hexagonal crystals of the ferroxdure type thec axis is the preferred direction of magnetization.A magnetic field is needed to change the alignmentof the magnetization, and in that case the crystal issubjected to a torque. The torque was measured asa function of the orientation of the crystal in relationto the field applied to polycrystalline materialofcomposition BaCoxTixFe12_2X019'with aligned crys-tallites. It is shown that the anomalies found ill thetorque curves can be explained by the markedanisotropy of the cobalt ions.
2859: M. K.oedam and A. Hoogendoorn: Sputteringof copper single crystals bombarded with A+,Kr+ and Nè+ ions with energies ranging from300-2000 eV (Physica 26, 351-352, 1960,No.5).
Earlier reported investigations into the sputteringof monocrystalline metal surfaces by ionic bombard-ment are being extended to higher ion energies (seealso Nos. 2767 and 2840 of these abstracts).
2860: M. P. Rappoldt: Investigations on sterols,XIV. Studies on vitamin D and relatedcompounds, XII. The photo-isomerizationof lumisterol , (Rec. Trav. chim. Pays-Bas 79,392-400, 1960, No. 5).
Kinetic experiments on the isomerization oflumisterol., under the influence of ultraviolet lightof various wavelengths are reported. The experi-ments indicate that neither tachysterol., nor ergo-sterol are primary reaction products of lumisterolg.Lumisterol, is exclusively converted into pre-ergo-'calciferol. The quantum yield of this reaction is0.41 at 2537 Á.
2861: M. P. Rappoldt and E. Havinga: Studies onvitamin D and related compounds, XI. In-vestigations on sterols, XIII. The photo-isomerization of ergosterol (Rec. Trav. chim.Pays-Bas 79, 369-381, 1960, No.5).
Kinetic experiments on the photoisomerization ofergosterol were carried out using different sources oflight. New methods of analysis for pre-ergo calciferoland tachysterolg had to be developed. The quantumyield of the photoisomerization of ergosterol withUV light of 2537 Á was found to be 0.31 at 20°C.This value was obtained when ether, ethanol and
petroleum ether were used as solvents. 'I'achysterolgis not formed from ergosterol during irradiation, butoriginates exclusively from pre-ergo calciferol. Ex':cited ergosterol falls back to its ground state (69%)or transforms to pre-ergocalciferol (26%) and tounidentified products (5%).
2862: M. Avinor and G. Meijer: Emission of acti-vated cadmium selenide phosphors (J. chem.Phys. 32, 1456-1458, 1960, No. 5).
The fluorescence spectra at 80 oK. and 300 oK ofCdSe activated by Cu, Au and Ag, and eo-activatedby trivalent metals, were investigated. The phos-phors were excited by radiation from a high-pressure mercury lamp passing through a CuS04filter. For comparison, the emission spectra of CdSwith the same activators and coactivators were alsoinvestigated. The emission bands of CdSe are shiftedtowards the infra-red in relation to those of CdS.The silver band of CdSe turned out to be completelyquenched at room temperature. Besidestheactivator
, hands (Ag 0.92 (1-, Cu 1.20 (1-, Au 1.45 (1-, at 80 °Iqa near-edge emission of CdSe was found at 0.72 (1-.
2863: A. A. Aldenkamp, C. P. Marks and H. Zijl-stra: Frictionless recording torque magneto-meter (Rev. sci. Instr. 31, 5440-546, 1960,No.5).
An instrument for measuring magnetic anisotropyby recording magnetic torque curves is described.The special construction of the transducer whichconverts the torque exerted on the sample into anelectrical signal makesit possible to avoid bearings,so that the instrument is essentially free of friction.The instrument is operated with commerciallyavailable electronic apparatus and is suitable forroutine measurements on large numbers of sam-ples. The maximum sensitivity is 1.5X 10⁻⁵ Nm(= 150 dyne cm) per centimetre deflection of therecorder stylus.
2864: F. J. Schijff: Safety and reliability in theinstrumentation of nuclear reactors (RevueHF Tijdschrift 4, 223-229, 1960, No. 10).
The instrumentation of a nuclear reactor involvesthe use of instruments which are relatively unsafeand unreliable. Nevertheless, a reactor is requiredto possess a high degree of safety and great reliabil-ity, the first principally to protect life and property,the second mainly for reasons of economy. Bothsafety and reliability can be improved by means ofcoincidence circuits. Other measures of particular-importance to safety are regular testing of the safetychannels and constant comparison of the signalsfrom identical channels.


![Rayleigh wave phase velocities, small-scale convection ...eps.mq.edu.au/~yingjie/publication/2005_JGR_3D_scalifornia.pdf · [6] In this paper, we use Rayleigh wave data recorded at](https://img.dokumen.tips/doc/110x75/5edab837272674784f04f44a/rayleigh-wave-phase-velocities-small-scale-convection-epsmqeduauyingjiepublication2005jgr3d.jpg)
![Development of A Steerable Stereophonic Parametric Loudspeaker · Development of A Steerable Stereophonic Parametric Loudspeaker Chuang Shi , ... [13]. Therefore, the ... When the](https://img.dokumen.tips/doc/110x75/5aef235b7f8b9aa9168c2768/development-of-a-steerable-stereophonic-parametric-of-a-steerable-stereophonic-parametric.jpg)