Embed Size (px)
Citation preview
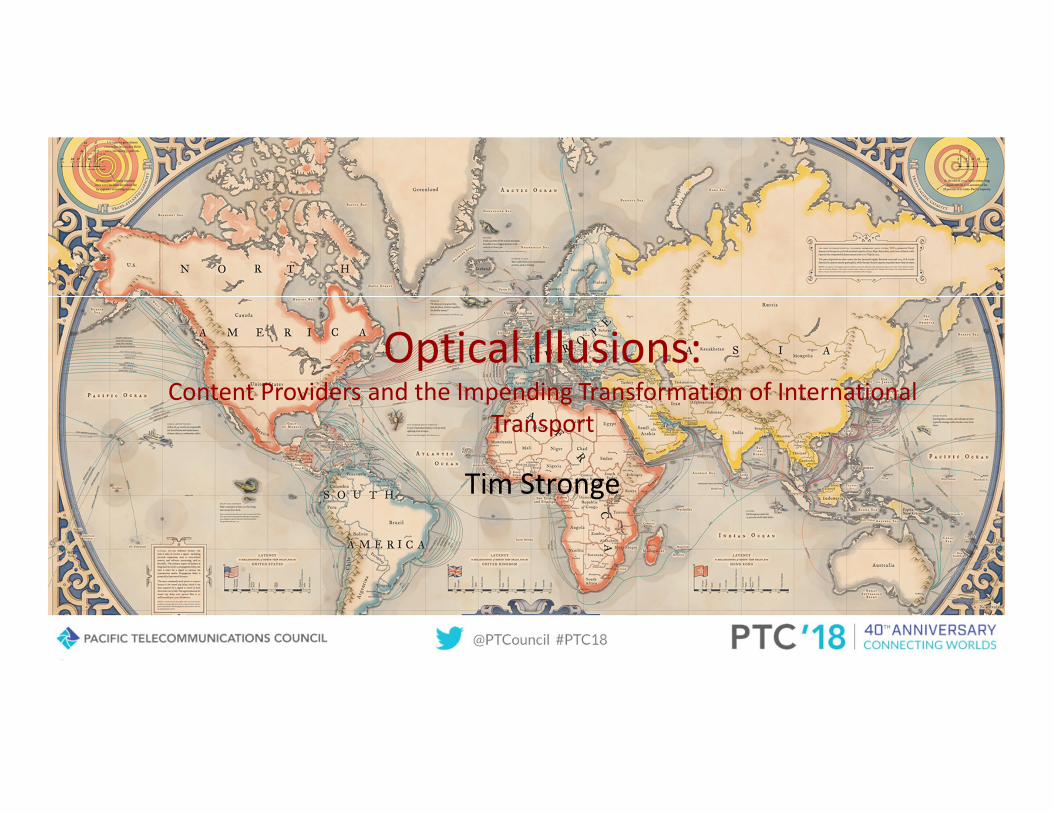
Optical Illusions: Content Providers and the Impending Transformation of International
Transport
Tim Stronge

Growth depends on content.

Illusion #1
Sometimes, we require motion to comprehend an
image

Source: http://www.michaelbach.de/ot/mot-biomot/index.html


Recognizing the new gestaltInternational Capacity Usage by Network Type

Recognizing the new gestaltInternational Capacity Usage by Network Type
Content providers are
building cables . . . sort of.

Illusion #2
Sometimes, we perceive motion that does not
exist

Source: http://www.ritsumei.ac.jp/%7Eakitaoka/index-e.html

Content really big on some routesInternational Capacity Usage by Network Type by Route, YE 2017

Demand shapes prices . . . but
not
in the way you think.

Illusion #3
Sometimes, we disregard established patterns

Source: http://www.kyb.tuebingen.mpg.de/research/dep/bu/more-on-this-topic/optical-illusions.html

Source: http://www.michaelbach.de/ot/fcs-hollowFace/index.html

A discovery about bandwidth
prices• Faster demand growth -> faster price declines
• Wait, what?

The magic is in the unit costs
• Let’s build a simple, hypothetical cost model:
• Ignore initial capital payoff
• Each cable has ~$7m annual opex
– Wet and dry O&M, backhaul fees, power, SG&A
• 100G upgrades = $100k now, falling 10% p.a.
• Each cable loaded with 6 Tbps in 2017
– Annual demand growth of 30% until fully loaded

Year 1 Year 2
Cost/Month $715,200 $734,760
÷ 100G Wave-Equivalents Sold ÷ 60 ÷ 78
= Cost per 100G Sold/Month = $11,920 = $9,420
Watch the denominator

Capacity drives cable unit costsCost Floor per 100G Wave Sold
Current avg. trans-Atl price

Price finally approaches cost floor?Cost Floor per 100G Wave Sold
Price ∆ if -15% p.a.

Content providers are a solution
to cable funding dilemma
. . . but also a problem.

Illusion #4
Sometimes, the closer we are to an object the less
we see

Source: http://cvcl.mit.edu/hybridimage/


A basic cash flow model
• Same parameters as previous model, except:
• New cable:
– RFS = 2020
– Construction = $150m
– IRU sales early; gradual transition to leases

Hypothetical cable cash flowAnnual Cash Flow: 0 of 6 Fiber Pairs Offloaded

Share the loadCumulative Cash Flow: 0 of 6 Fiber Pairs Offloaded

Share the loadCumulative Cash Flow: 2 of 6 Fiber Pairs Offloaded

Share the loadCumulative Cash Flow: 4 of 6 Fiber Pairs Offloaded
Annual Price ∆Required to Break Even
-17%
-13%
-10%

Content providers as buyers
• Good
– Lots of unanticipated
growth
– Lower unit cost
-> lower prices
– Heavily underwrite some
new cables
• Bad [?]
– Not ubiquitous
– Uncertain future
demand
– Market power shift to a
few buyers
– Content-only cables in
our future?

Final Words of Wisdom
Never be afraid to follow your dream!

Source: Jukin Media https://www.youtube.com/watch?v=69AmeXLnRfk

Final Words of Wisdom
Never be afraid to follow your dream!
Fire, like, BURNS bro!