Embed Size (px)
Citation preview

Glaucoma
Optical Coherence Tomography Analysis Based Predictionof Humphrey 24-2 Visual Field Thresholds in Patients WithGlaucoma
Zhihui Guo,1 Young H. Kwon,2,3 Kyungmoo Lee,4 Kai Wang,5 Andreas Wahle,4 Wallace L. M.Alward,2,3 John H. Fingert,2,3 Daniel I. Bettis,3 Chris A. Johnson,3 Mona K. Garvin,4,6 MilanSonka,3,4 and Michael D. Abramoff1–4,6
1Department of Biomedical Engineering, University of Iowa, Iowa City, Iowa, United States2Stephen A. Wynn Institute for Vision Research, University of Iowa, Iowa City, Iowa, United States3Department of Ophthalmology and Visual Sciences, University of Iowa, Iowa City, Iowa, United States4Department of Electrical and Computer Engineering, University of Iowa, Iowa City, Iowa, United States5Department of Biostatistics, College of Public Health, University of Iowa, Iowa City, Iowa, United States6Iowa City VA Health Care System, Iowa City, Iowa, United States
Correspondence: Michael D. Abram-off, The University of Iowa, 11205Pomerantz Family Pavilion, IowaCity, IA 52242, USA;[email protected].
Submitted: March 10, 2017Accepted: June 22, 2017
Citation: Guo Z, Kwon YH, Lee K, etal. Optical coherence tomographyanalysis based prediction of Hum-phrey 24-2 visual field thresholds inpatients with glaucoma. Invest Oph-thalmol Vis Sci. 2017;58:3975–3985.DOI:10.1167/iovs.17-21832
PURPOSE. A pilot study showed that prediction of individual Humphrey 24-2 visual field (HVF24-2) sensitivity thresholds from optical coherence tomography (OCT) image analysis ispossible. We evaluate performance of an improved approach as well as 3 other predictivealgorithms on a new, fully independent set of glaucoma subjects.
METHODS. Subjects underwent HVF 24-2 and 9-field OCT (Heidelberg Spectralis) testing. Nervefiber (NFL), and ganglion cell and inner plexiform (GCLþIPL) layers were cosegmented andpartitioned into 52 sectors matching HVF 24-2 test locations. The Wilcoxon rank sum test wasapplied to test correlation R, root mean square error (RMSE), and limits of agreement (LoA)between actual and predicted thresholds for four prediction models. The training dataconsisted of the 9-field OCT and HVF 24-2 thresholds of 111 glaucoma patients from our pilotstudy.
RESULTS. We studied 112 subjects (112 eyes) with early, moderate, or advanced primary andsecondary open angle glaucoma. Subjects with less than 9 scans (15/112) or insufficientquality segmentations (11/97) were excluded. Retinal ganglion cell axonal complex (RGC-AC)optimized had superior average R ¼ 0.74 (95% confidence interval [CI], 0.67–0.76) and RMSE¼ 5.42 (95% CI, 5.1–5.7) dB, which was significantly better (P < 0.05/3) than the other threemodels: Naıve (R ¼ 0.49; 95% CI, 0.44–0.54; RMSE ¼ 7.24 dB; 95% CI, 6.6–7.8 dB), Garway-Heath (R ¼ 0.66; 95% CI, 0.60–0.68; RMSE ¼ 6.07 dB; 95% CI, 5.7–6.5 dB), and Donut (R ¼0.67; 95% CI, 0.61–0.69; RMSE ¼ 6.08 dB, 95% CI, 5.8–6.4 dB).
CONCLUSIONS. The proposed RGC-AC optimized predictive algorithm based on 9-field OCTimage analysis and the RGC-AC concept is superior to previous methods and its performanceis close to the reproducibility of HVF 24-2.
Keywords: perimetry, visual field, image analysis, OCT, ganglion cell
The limitations of reliability and reproducibility of visual field(VF) testing, as the main parameter in assessing glaucoma
damage, inhibit optimal patient care and research for improvedoutcome. The clinical standard for VF testing in glaucoma isautomated perimetry, and the Humphrey 24-2 SITA Standard VF(HVF 24-2) is the most widely used method. However, oncemoderate VF loss occurs, 12 to 15 dB mean deviation (MD) lossor more, VF test–retest variability rises substantially1–4 andlimits a reliable determination of change.
Optical coherence tomography (OCT) can quantify glau-comatous damage through nerve fiber layer (NFL) thicknessand cup-to-disc estimates in a patient-friendly, robust, andreproducible fashion.5–7 However, OCT-derived measurementsof glaucoma damage correlate poorly with VF thresholds.8–11
We have shown previously that OCT-based image analysis inglaucoma patients allows loss to be quantified from the retinal
ganglion cell body to the optic nerve head (ONH),12 suggestingthat damage to the retinal ganglion cell–axonal complex occurssimultaneously along this entire path. We proposed the termretinal ganglion cell axonal complex (RGC-AC) to stress thedistributed nature of this loss in multiple neighboring ganglioncells and corresponding axons, which leads to characteristicglaucomatous VF loss, while damage to the part of the RGC-ACwithin the ONH leads to characteristic cupping.
We also demonstrated that retinal anatomy-based analysis ofmultifield spectral domain (SD)–OCT can predict the thresh-olds at all 52 test locations of the most widely used Humphrey24-2 VF with an average correlation of 0.68,13 in a leave-one-outtest design. In a pilot study, average correlation between repeatHumphrey 24-2 thresholds in established glaucoma patientsproficient in perimetry is 0.83 (Abramoff MD. IOVS 2015;56:AR-VO E-abstract 1696), which allows additional improvements in
Copyright 2017 The Authors
iovs.arvojournals.org j ISSN: 1552-5783 3975
This work is licensed under a Creative Commons Attribution-NonCommercial-NoDerivatives 4.0 International License.
Downloaded From: http://iovs.arvojournals.org/pdfaccess.ashx?url=/data/journals/iovs/936407/ on 08/12/2017

the image analysis and predictive algorithm up to thatperformance limit to be measured. Improvements in thepredictive algorithm make it of interest to compare these toour previously published approach, as well as the widely usedperipapillary NFL thickness assessment. In addition, anindependent test population of patients with a wide range ofglaucoma severity allows a better assessment of externalvalidity.
Thus, the purpose of this study was to demonstrate theperformance improvement by more sophisticated OCT imageanalysis and validate this performance on an independent testset of glaucoma subjects.
METHODS
Subjects
In this prospective study, inclusion criteria were as reportedpreviously and summarized here13: age 18 to 85, diagnosedwith glaucoma suspect or open-angle glaucoma according tothe following definitions: (1) Glaucoma suspect: suspiciousoptic nerve appearance (enlarged cupping on clinical exami-nation) with normal VF and IOP # 21 mm Hg or normal opticdisc appearance on biomicroscopy and normal VF, but withelevated IOP > 21 mm Hg. (2) Open-angle glaucoma: primaryor secondary open-angle glaucoma (e.g., exfoliative or pigmen-tary) with an open iridocorneal angle, glaucomatous optic disc,and/or NFL defects on biomicroscopy, and VF changes(regardless of IOP level). Glaucomatous optic discs wereidentified as those with either diffuse or focal thinning of theneuroretinal rim. VF abnormalities were considered to beglaucomatous if they were consistent with the optic nerveexamination and had either (1) a typical NFL distribution, or(2) a glaucoma hemifield test outside the normal limits. Thisdiagnosis was made by fellowship trained glaucoma specialistsaccording to the above definitions.
Inclusion criteria were subject’s fundus visualization suffi-cient on indirect ophthalmoscopy to allow OCT; able toundergo perimetry Humphrey 24-2 VF SITA Standard withsufficient reliability (false-positive [FP] error < 15% and false-negative [FN] error < 25%, fixation loss [FL] < 33%); perimetryobtained within a 3-month period of SD-OCT imaging; andperimetry free of artifacts, such as lens rim effects. Exclusioncriteria were a history of angle closure or combined mechanismglaucoma, or any nonglaucomatous optic neuropathy, corneal,or retinal diseases that can affect VF, cataracts or any otherdisease with visual acuity < 20/40, and OCT of unsuitablequality determined by visual observation. Subjects were
recruited matching age and disease severity in one of threeapproximately equally sized severity groups, based on the meandeviation of the 24-2 HVF threshold testing: early glaucoma(including glaucoma suspects) < 6 dB loss, moderate glaucoma6 to 12 dB loss, and advanced glaucoma > 12 dB loss.
One eye of each subject was studied. When both eyes wereeligible, the study eye was chosen to reflect adequaterepresentation of each of the three severity groups.
Data Collection
As stated previously,13 standardized automated perimetrybased on the SITA Standard 24-2 VF protocol was performedwith the Humphrey Field Analyzer (HFA II; Carl Zeiss Meditec,Inc., Dublin, CA, USA), which evaluates the VF as thresholdassessments at 52 different retinal locations (the two locationscorresponding to the blind spot were subtracted from the totalof 54 locations). For OCT image acquisition, a 9-field per eyeprotocol was used, where a subject sequentially fixates on aspot 12.58 apart in a 3 3 3 grid pattern. This protocol takesapproximately 5 minutes per eye and covers 608 on the retina,sufficiently large enough to include the 608 area probed with24-2 VF test. Each field is imaged with SD-OCT (768 3 61 3 496voxels, 9.53 3 8.07 3 1.92 mm3, with a voxel size of 12.41 3132.22 3 3.87 lm3; Spectralis; Heidelberg Engineering, Inc.,Heidelberg, Germany) using eye tracking mode. The deviceadditionally acquires a 2D scanning laser ophthalmoscopy(SLO) fundus image (768 3 768 pixels, 9.5 3 9.5 mm2 with apixel size of 12.41 3 12.41 lm2), automatically coregisteredwith the OCT image by the device. The raw VF data, exportedfrom the Humphrey Field Analyzer as integer threshold data, aswell as the raw OCT volumes, exported as .vol format, were de-identified, and stored in our XNAT ophthalmology researchdatabase.14 The study protocol was approved by the institu-tional review board of the University of Iowa and adhered tothe tenets of the Declaration of Helsinki; written informed
FIGURE 1. Wide field composite OCT obtained from 9-field OCTs aftercoregistration, showing the central B-scan overlaid with cosegmentedsurfaces for a subject with advanced glaucoma. NFL and GCLþIPLthicknesses were not measured within the ONH region.
FIGURE 2. Wide field composite OCT cosegmented NFL thickness (left) and GCLþIPL thickness (middle) of the same subject with advancedglaucoma, as in Figure 1. The HVF 24-2 derived S-Grid (right) illustrates the numbered sectors for all test locations, the cross marker indicates thefixation center, and sector 26 the blind spot. This S-grid is aligned with the wide field OCT and used to identify the OCT sectors for which NFL andGCLþIPL thickness are calculated.
OCT Based Prediction of Visual Fields IOVS j August 2017 j Vol. 58 j No. 10 j 3976
Downloaded From: http://iovs.arvojournals.org/pdfaccess.ashx?url=/data/journals/iovs/936407/ on 08/12/2017

consent was obtained from all participants, and HIPAAcompliance was adhered to.
Multifield Registration and Intraretinal LayerSegmentation
We previously have described how the 9-field OCT volumes areregistered, and regional NFL and ganglion cell layer (GCL)thickness is quantified.13 In summary, all 9 individual SLOimages were registered automatically, and the resulting affine(i.e., only including scaling, rotation, and translation) transfor-mations then were applied to the corresponding OCT volumes,so that their relative positions, scales, and rotations wereknown. The retinal layers (NFL, and GCL and inner plexiformlayer [GCLþIPL]) of all OCT volumes thus aligned, werecosegmented, taking into account the possible mutualdisplacements along the z-axis, using an extension of the IowaReference Algorithms.15–17 After cosegmentation, the volumesand segmented surfaces were stitched together to obtain awide-field composite OCT (Fig. 1) and the corresponding layer
thicknesses (Fig. 2). As we did previously, we partitioned thewide field composite OCT into 54 sectors that corresponded tothe HVF 24-2 SAP matrix, called Structure-Grid (S-Grid) wherethe automatically identified fovea and ONH center werecoregistered to the fixation and the center of sector 26,
FIGURE 3. Sectors used for Naive, Donut, and Garway-Heath predictivemodels, to predict the HVF 24-2 threshold for Sector 14. The predictedsector 14 is shown in red, the sectors of which NFL thickness is usedare in green. If a sector’s NFL and GCLþIPL are both used, it is shown inorange.
FIGURE 4. All sectors included in each sector-specific feature vector that is used to predict the HVF 24-2 threshold for that sector using RGC-ACoptimized. The predicted sector is red—this also is the sector whose GCLþIPL thickness is used. Sectors whose NFL thickness is used are green. IfNFL and GCLþIPL thicknesses are used for a sector, that sector is orange. Notice that in some cases, prediction performance was improved byincluding NFL sectors temporal of the sector to be predicted—this does not imply that the ganglion cell axons in that sector originate nasally, ratherthat damage to the axons in the more temporal sector covaries substantially with that of the predicted sector.
FIGURE 5. Map of the most relevant sectors’ NFL thickness forprediction of function using RGC-AC Optimized. The number in eachsector indicates the total number of sector-specific predictions thatsector’s NFL thickness is used for. In other words, if a sector S has ‘‘19,’’there are 19 sectors that have sector S’s NFL thickness in their featurevector.
OCT Based Prediction of Visual Fields IOVS j August 2017 j Vol. 58 j No. 10 j 3977
Downloaded From: http://iovs.arvojournals.org/pdfaccess.ashx?url=/data/journals/iovs/936407/ on 08/12/2017

respectively.13,18,19) Thus, essentially all A-scans in the widefield composite OCT were assigned to a corresponding S-Gridsector, and the average GCLþIPL and NFL thickness valueswere computed as the mean layer thickness from all A-scans inthat sector, from a total of approximately 2000 A-scans persector. Any missing thickness information of a sector wasbilinearly interpolated from the four neighboring sectors.
Prediction of VF Threshold for Each Sector FromNFL and GCLþIPL Thicknesses
As we did previously,13 we built independent predictivemodels for each sector threshold, except for sectors 26 and
35, which covered the ONH area. These models only used theNFL and GCLþIPL thicknesses for one or more (structural)sectors, so no functional information was used as input to themodel. To study the effect of the contribution of a structuralsector, that is, the contribution of a sector’s regional NFL andGCLþIPL thickness, four models were compared for eachsector threshold prediction, using four different approaches formodel inputs, with their descriptors as follows:
1. Naive: GCLþIPL and NFL thickness for the predictedsector only.
2. Donut: NFL thickness of 10 sectors that form a donutcentered on the ONH. This approach most closelyapproximates the use of peripapillary NFL thickness
TABLE 1. Averaged R, RMSE, and Width of LoA of Four Predictive Approaches for All Glaucoma Severity Groups
Performance RGC-AC Optimized Naıve Garway-Heath Donut
Average R 0.74 0.49 0.66 0.67Range of R [0.50, 0.85] [0.08, 0.74] [0.40, 0.83] [0.48, 0.75]P Value for difference in R to RGC-AC optimized – <0.001 <0.001 <0.001Average RMSE, dB 5.42 7.24 6.07 6.08P Value for difference in RMSE to RGC-AC optimized – <0.001 0.010 0.001Average width of LoA, dB 21.2 28.2 23.8 23.8P Value for difference in width of LoA to RGC-AC optimized – <0.001 0.009 <0.001
FIGURE 6. Sector-specific predictive performance R for each approach as well as average R over all sectors. The differences between R for RGC-ACoptimized and the other approaches are all significant.
OCT Based Prediction of Visual Fields IOVS j August 2017 j Vol. 58 j No. 10 j 3978
Downloaded From: http://iovs.arvojournals.org/pdfaccess.ashx?url=/data/journals/iovs/936407/ on 08/12/2017

measurements that is widely available in, for example,the Zeiss Cirrus SD-OCT.20
3. Garway-Heath: GCLþIPL thickness for the predictedsector, as well as all NFL sectors that fall within theGarway-Heath nerve fiber bundle distribution.21 This isthe approach we have reported previously13 (see Fig. 3for additional insight).
4. RGC-AC optimized: GCLþIPL thickness for the predictedsector, as well as NFL thicknesses for a set of between 1and 10 sectors following the so-called RGC-AC optimizedregional path. These sets are optimized for performanceon the training set and approximate the nerve fiberbundles as much as possible, by iteratively adding asector using sequential floating forward sector search,22
if the marginal improvement in correlation DR > 0.01(Figs. 4, 5).
All sectors of which NFL and/or GCLþIPL are used to predictthe HVF 24-2 threshold for sector 14 (as an example) for RGC-AC optimized are shown in Figure 4, and examples of thesectors used for a single sector prediction for the other threeapproaches are shown in Figure 3.
Each of these four approaches creates a feature vector thatthen is used to train the predictive model, implemented as asupport vector regression machine (SVM)23 with a radial basisfunction kernel. As previously, to account for the slightrotation between the OCT imaging and actual perimetry, theS-Grid and the 24-2 VF grid are aligned by similarity transformbetween two pairs of points, the center of the fovea on OCTand the fixation center and the ONH center and blind spotcenter. Then, a thin plate spline transform is used tointerpolate the actual measured thresholds on the S-Grid.Obviously, this interpolation is required only when thepredicted sensitivity threshold must be associated with themeasured sensitivity in a specific location. Each sector-specificSVM then is trained using the sector NFL and GCLþIPLthicknesses in the corresponding feature vector as describedabove, as well as using as the reference standard thecorresponding interpolated VF thresholds for the sector.
For training the predictive algorithms we used the datacollected for our previous study,13 as follows. We had collectedHVF 24-2 and 9-field OCT with exactly the same protocol andinclusion and exclusion criteria on 142 subjects from theGlaucoma Service at the University of Iowa. Among these 142
subjects, 20 had incomplete imaging, 4 had no composite OCTvolume and 7 had layer segmentation failure, and thus the dataof 111 subjects could be used. A random eye from each of theremaining 111 subjects was selected as the training set (111eyes, 999 scans), of which 59 were right and 52 were left eyes;39 had early, 36 moderate, and 36 advanced glaucoma. Thus,there were 111 (subjects) 3 52 (sectors) training vectors usedfor training the four approaches.
All other parameters for the SVM were the same for allsectors, and no other training data were used. Once trained,each sector’s predictive model, given a corresponding previ-ously unseen feature vector, produces a predicted threshold atthat sector. To make comparison to the familiar HVF 24-2printout easier, we simulated our result output as a grayscalemap.
Statistical Analysis
All left eye scans were mirrored to conform to the scans of theright eye. Primary outcome was the performance improve-ment, measured by Pearson correlation R between the actualand predicted HVF 24-2 thresholds, averaged over all 52sectors, of the RGC-AC optimized approach over the otherthree approaches, on the independent test set of newlyrecruited subjects with glaucoma. Average R and root meansquare error (RMSE) were calculated by averaging the Pearsoncorrelation coefficient (R) and RMSE between predicted andactual thresholds for all subjects for each sector, andhypotheses were tested using the Wilcoxon rank sum test.Bland-Altman plots24 were used to show the agreementbetween the predicted and measured HVF 24-2 thresholds,with the y-axis representing the difference and the x-axis themean of predicted and measured HVF 24-2 thresholds. The95% limits of agreement (LoA) were computed for eachsector.25 The average width of LoA was obtained by averagingthe width of LoA for each sector and testing between thedifferent models with the Wilcoxon rank sum test. Forstratified analysis, a linear regression and its 95% confidencelimits (CI)26 were calculated on the Bland-Altman plot for eachsector. At 10, 20, and 30 dB, we applied the Wilcoxon test to 2categories, the prediction error on the regression line (calledbias) to test the bias from 0, and the width of the 95% CI to testthe range of agreements for the prediction error. These also
TABLE 2. The Comparison of the Bias Between the RGC-AC Optimized Model and the Other Three Models Across 52 Sectors
Sensitivity, dB
RGC-AC Optimized Naıve Garway-Heath Donut
AverageBias, dB
P Value toRGC-AC
OptimizedAverageBias, dB
P Value toRGC-AC
OptimizedAverageBias, dB
P Value toRGC-AC
OptimizedAverageBias, dB
P Value toRGC-AC
Optimized
10 2.8 – 8.3 <0.001 3.8 0.15 2.3 0.1520 $0.01 – 1.0 <0.001 0.3 0.39 $0.4 0.1230 $2.8 – $6.3 <0.001 $3.4 0.17 $3.1 0.13
TABLE 3. The Comparison of the Width of 95% CI Between the RGC-AC Optimized Model and the Other Three Models Across 52 Sectors
Sensitivity, dB
RGC-AC Optimized Naıve Garway-Heath Donut
AverageWidth of
95% CI, dB
P Value toRGC-AC
Optimized
AverageWidth of
95% CI, dB
P Value toRGC-AC
Optimized
AverageWidth of
95% CI, dB
P Value toRGC-AC
Optimized
AverageWidth of
95% CI, dB
P Value toRGC-AC
Optimized
10 4.1 – 5.3 0.001 4.7 0.002 4.7 0.00120 2.4 – 2.9 <0.001 2.7 0.005 2.8 <0.00130 3.7 – 5.0 0.003 4.3 0.040 4.4 0.001
OCT Based Prediction of Visual Fields IOVS j August 2017 j Vol. 58 j No. 10 j 3979
Downloaded From: http://iovs.arvojournals.org/pdfaccess.ashx?url=/data/journals/iovs/936407/ on 08/12/2017

were calculated for the repeat HVF 24-2. Significance was set atthe 0.05/3 level, with Bonferroni correction. For qualitativeevaluation, grayscale maps of the actual and predicted HVF 24-2 were created.
RESULTS
We recruited 112 new consecutive participants from theGlaucoma Service at the University of Iowa. Of these 112participants, 15 were excluded due to incomplete imaging, and11/97 (11%) subjects were excluded because of complete layersegmentation failure (i.e., undetectable NFL/GCL layer and/orshift of NFL lower boundary to GCL lower boundary), leaving86 subjects for the study (we used 48 right and 38 left eyes).Thus, approximately 15% of the total number of potentialsubjects had to be excluded because of segmentation failures.One eye from each of the remaining subjects formed theindependent test set to evaluate the performance of the fourmodels. Thus, an independent test set was collected.Demographics of the 86 subjects were mean age, 65.3 yearsand 38 (44.2%) were male. A total of 30 patients had early, 24moderate, and 32 advanced glaucoma. The cohort included 79(self-identified) Caucasian, 3 African-American, 1 Asian-Amer-ican, 0 Native American, and 1 Native Hawaiian/Pacific Islandersubjects (race was unknown or undisclosed for remaining 2).None of the 79 Caucasian and one of the seven non-Caucasiansubjects identified as Hispanic.
The average Pearson correlation R (RMSE) between theinterpolated, actual HFA 24-2 and OCT-predicted VF thresholdsfor RGC-AC optimized model was 0.74 (5.42 dB), averaged overall severity groups, and this correlation was significantly higherthan the average R achieved by the other three approaches(Naıve, Donut, and Garway-Heath) on this dataset (Table 1).Figure 6 shows the correlation R for each sector, and for eachapproach, and RGC-AC optimized has significantly higherperformance than all other models.
From Tables 2 and 3, we concluded that the RGC-ACoptimized model was significantly better than the other threeover the entire range. Table 4 shows that repeat HVF in a highlyselect sample of good test-takers still performs better than theRGC-AC optimized model.
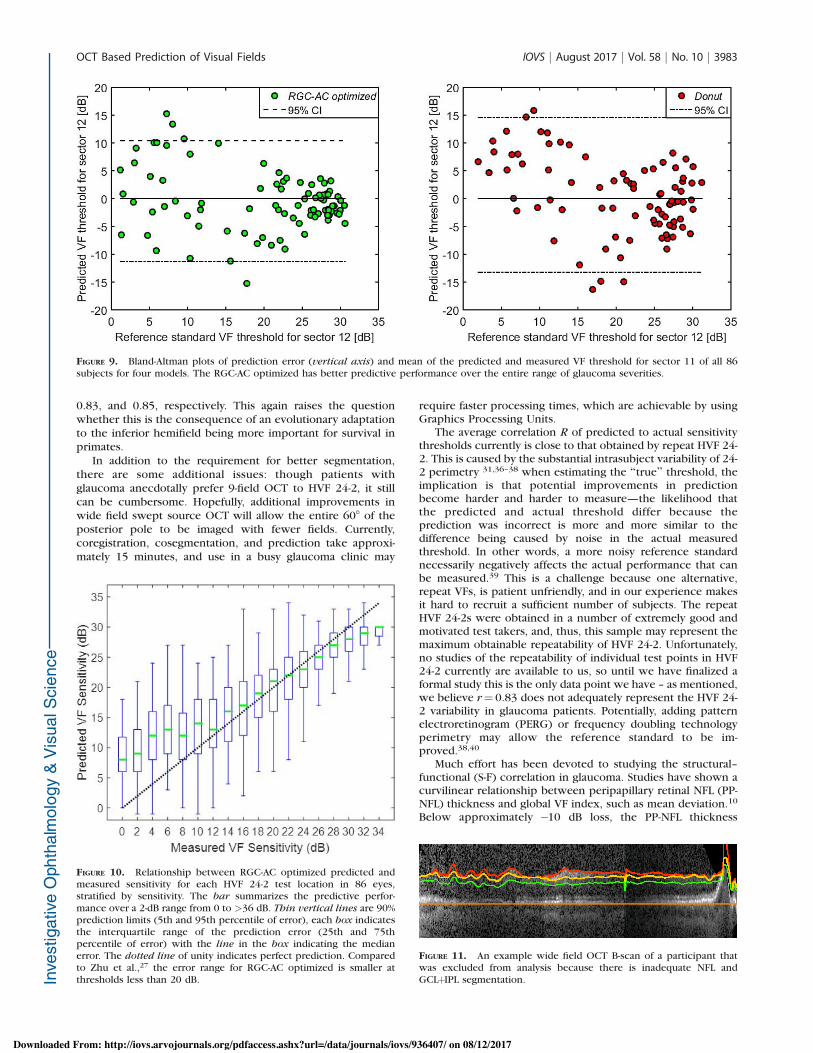
For qualitative evaluation, the grayscale maps that simulatethe HVF 24-2 printout were generated for actual and RGC-ACoptimized predicted thresholds, grouped by glaucoma severity,as shown in Figure 7, while a detailed comparison for a specificsubject with advanced glaucoma is shown in Figure 8. Figure 9compares the predictive performance of all 86 subjects for thefour models for a single HVF 24-2 sector (sector 11), whichshows the higher performance of the RGC-AC optimized modelin the entire range of threshold values. For comparisonpurposes, Figure 10 shows the predictive performance ofHVF 24-2 sensitivity across all sectors for RGC-AC optimizedusing the same box-whisker plot as used by Zhu et al.,27
showing superior predictive performance of the RGC-AC
optimized approach compared to their approach at thresholdsless than 20 dB. Average signed error from measuredthresholds was $0.05 dB, and average unsigned error was4.19 dB.28
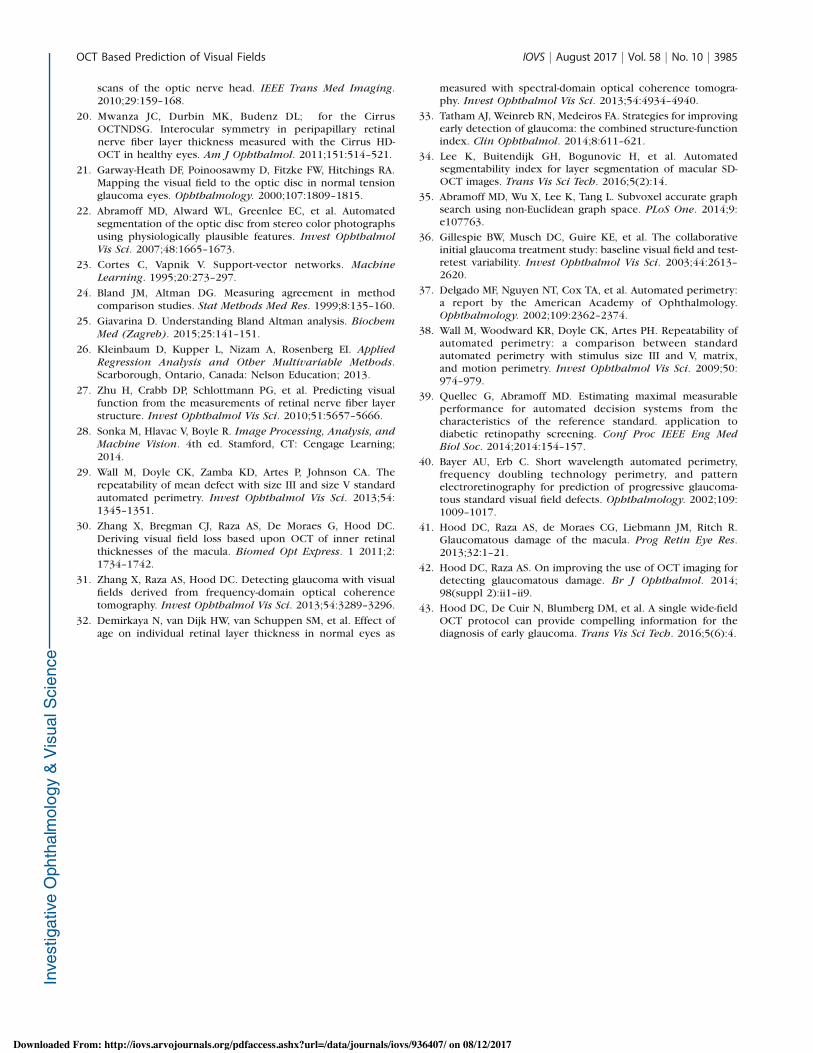
If we included the 11 participants who had inadequateNFL and GCLþIPL segmentation (Fig. 11), and, thus, did notuse the inclusion criteria, the RGC-AC Optimized predictionreached a lower average correlation R over all 97 subjects of0.66 (95% CI, 0.63–0.69). This clearly showed the importanceof accurate layer segmentation as well as the influence ofcorrect NFL and GCLþIPL layer thickness values on theprediction outcome.
DISCUSSION
Our results showed the high predictive performance of theRGC-AC optimized approach to predict VF thresholds from 9-field OCT image analysis, with an average correlation R of0.74 to the actual HVF 24-2 thresholds. This performance wasachieved on a newly recruited, independent population ofglaucoma subjects with a wide distribution of glaucomaseverity, using the RGC-AC optimized approach trained on aseparate training set. Thus, no OCT images or HVF 24-2thresholds of the subjects recruited for this study were everused to train the machine learning prediction algorithms. Inaddition, the performance of the newly developed RGC-ACoptimized approach was significantly better than threealternative approaches: Naıve, where only the NFL, GCL,and IPL thickness of the predicted sector are used forprediction; Garway-Heath, our previously published, and sofar best, approach using GCLþIPL thickness of the predictedsector as well as NFL thicknesses of the sectors in thepresumed nerve fiber bundle paths as determined by GarwayHeath et al.13; and Donut, the approach that uses peripapil-lary NFL thickness only to mimic as close as possible thismetric that is widely available on commercially available OCTdevices,20 even though Donut is a 2-D ring incorporatingmany more A-scans than the commercially available 1-D‘‘peripapillary circle.’’
Based on our results, we made several observations: Whilepresent, there is only a limited amount of ‘‘plateauing,’’ orleveling off of predictive performance, at increasing severity ofglaucoma. Compared to the study of Zhu et al.,27 there is less ofa plateau. It is possible that the predicted thresholds are closerto the ‘‘true’’ sensitivity below 20 dB, since studies havequestioned the reliability and accuracy of perimetry for suchlow sensitivities.29 In any case, we expect to continueimproving prediction performance and decreasing the plateauin future studies.
Contrary to our expectations, the performance improve-ment of the RGC-AC optimized approach over the peripapillaryDonut approach is seen across the entire range of glaucomaseverity (Tables 2, 3), and as illustrated for a single sector in thescatter plot in Figure 9. This is somewhat surprising as several
TABLE 4. The Comparison of the Bias and the Width of 95% CI Between RGC-AC Optimized Model and Repeat HVF at Different Sensitivities Across52 Sectors
Sensitivity, dB
RGC-AC Optimized Repeat HVF RGC-AC Optimized Repeat HVF
AverageBias, dB
P Valueto RGC-ACOptimized
AverageBias, dB
P Valueto RGC-ACOptimized
AverageWidth of
95% CI, dB
P Valueto RGC-ACOptimized
AverageWidth of
95% CI, dB
P Valueto RGC-ACOptimized
10 2.8 – $0.39 <0.001 4.7 – 3.2 <0.00120 $0.01 – 0.04 0.9 2.7 – 1.7 <0.00130 $2.8 – 0.5 <0.001 4.3 – 2.5 <0.001
OCT Based Prediction of Visual Fields IOVS j August 2017 j Vol. 58 j No. 10 j 3980
Downloaded From: http://iovs.arvojournals.org/pdfaccess.ashx?url=/data/journals/iovs/936407/ on 08/12/2017

studies have shown a saturation effect for structure–functioncorrelation at advanced glaucoma.5,8,9,30,31 The difference hereis that we averaged the correlation values from each of the 52sectors to calculate a final average R value for each eye, asopposed to correlating mean NFL thickness with global HVFMD, that is, using the average of only 2 numbers from each eye.As pointed out, Donut incorporates far more A-scans than the1-D circle that is used commercially. It is possible that thesedifferences account for at least part of the much more robust
correlation between structure and function across all severitylevels.
Substantial predictive performance can be obtained assum-ing that actual VF threshold sensitivity values are relateddirectly to layer thicknesses, as a proxy of the number of axonsor ganglion cells as measured with OCT. Our premise, thus,remains that HVF 24-2 threshold is related only to the numberof RGC and their axons (i.e., the amount of RGC-ACremaining), and, in fact, we and others have shown age-related
FIGURE 7. HFA 24-2 simulated printout of actual (left) and RGC-AC optimized predicted (right) thresholds for each subject grouped by glaucomaseverity (early, top; moderate, center; and advanced, bottom, respectively). The box is placed around the subject that is shown in Figures 1, 2, and 8.
OCT Based Prediction of Visual Fields IOVS j August 2017 j Vol. 58 j No. 10 j 3981
Downloaded From: http://iovs.arvojournals.org/pdfaccess.ashx?url=/data/journals/iovs/936407/ on 08/12/2017

loss of RGC-AC in normal subjects.32,33 However, this has notbeen confirmed and there also may be age-related changes inthe neuroretina affecting threshold sensitivity.
Significantly better performance was reached by the RGC-AC optimized predictive model. This uses RGC-AC bundlepaths, which are similar, but not identical, to the functionallyderived bundle paths that originally were described by Garway-Heath et al.21 As can be seen in Figure 4, the RGC-AC optimizedbundle paths, and thereby the underlying ganglion cell axons,display substantial overlap. In some sectors, RGC-AC optimizedpaths include NFL sectors temporal of the sector to bepredicted, which is unlikely to be anatomically correct. Rather,this is caused by the loss of axons in the more temporal sectorcovarying substantially with the loss in the predicted sector.Refinement of the paths by making the structural sectorssmaller, rather than being determined by the spacing between
HVF-24-2 test locations, may further elucidate the population-derived RGC-AC bundle paths.
Accurate automated segmentation of the NFL and GCLþIPLlayers is a prerequisite to achieving the reported predictionperformance. Even though our NLF and GCLþIPL segmentationhas matured, we excluded 11 participants (approximately11%), because their segmentations clearly were insufficient. Ifwe included these as subjects, predictive performance wassubstantially lower. Though we have developed automatedsegmentation quality methods,34 segmentation performanceclearly must be improved35 before our approach can beconsidered for use on glaucoma patients.
We also replicated our second initial finding, that thecorrelation between structure and function is higher in thesuperior than in the inferior retina. The correlations of theRGC-AC optimized model over the entire field thus calculatedfor the superior hemifield and the inferior hemifield were 0.82,
FIGURE 8. Detailed simulated printout of the actual HVF 24-2 (left column) and RGC-AC predicted HVF 24-2 (right column) thresholds, in a subjectwith advanced glaucoma, the same as in Figure 1, 2, and 7. Top row, dithered grayscale mapping for (a) actual, (b) predicted. Middle row, sensitivitythresholds in dB for (c) actual, (d) predicted. Bottom row, (e) differences between actual and predicted threshold per sector.
OCT Based Prediction of Visual Fields IOVS j August 2017 j Vol. 58 j No. 10 j 3982
Downloaded From: http://iovs.arvojournals.org/pdfaccess.ashx?url=/data/journals/iovs/936407/ on 08/12/2017
0.83, and 0.85, respectively. This again raises the questionwhether this is the consequence of an evolutionary adaptationto the inferior hemifield being more important for survival inprimates.
In addition to the requirement for better segmentation,there are some additional issues: though patients withglaucoma anecdotally prefer 9-field OCT to HVF 24-2, it stillcan be cumbersome. Hopefully, additional improvements inwide field swept source OCT will allow the entire 608 of theposterior pole to be imaged with fewer fields. Currently,coregistration, cosegmentation, and prediction take approxi-mately 15 minutes, and use in a busy glaucoma clinic may
require faster processing times, which are achievable by usingGraphics Processing Units.
The average correlation R of predicted to actual sensitivitythresholds currently is close to that obtained by repeat HVF 24-2. This is caused by the substantial intrasubject variability of 24-2 perimetry 31,36–38 when estimating the ‘‘true’’ threshold, theimplication is that potential improvements in predictionbecome harder and harder to measure—the likelihood thatthe predicted and actual threshold differ because theprediction was incorrect is more and more similar to thedifference being caused by noise in the actual measuredthreshold. In other words, a more noisy reference standardnecessarily negatively affects the actual performance that canbe measured.39 This is a challenge because one alternative,repeat VFs, is patient unfriendly, and in our experience makesit hard to recruit a sufficient number of subjects. The repeatHVF 24-2s were obtained in a number of extremely good andmotivated test takers, and, thus, this sample may represent themaximum obtainable repeatability of HVF 24-2. Unfortunately,no studies of the repeatability of individual test points in HVF24-2 currently are available to us, so until we have finalized aformal study this is the only data point we have – as mentioned,we believe r¼ 0.83 does not adequately represent the HVF 24-2 variability in glaucoma patients. Potentially, adding patternelectroretinogram (PERG) or frequency doubling technologyperimetry may allow the reference standard to be im-proved.38,40
Much effort has been devoted to studying the structural–functional (S-F) correlation in glaucoma. Studies have shown acurvilinear relationship between peripapillary retinal NFL (PP-NFL) thickness and global VF index, such as mean deviation.10
Below approximately $10 dB loss, the PP-NFL thickness
FIGURE 9. Bland-Altman plots of prediction error (vertical axis) and mean of the predicted and measured VF threshold for sector 11 of all 86subjects for four models. The RGC-AC optimized has better predictive performance over the entire range of glaucoma severities.
FIGURE 10. Relationship between RGC-AC optimized predicted andmeasured sensitivity for each HVF 24-2 test location in 86 eyes,stratified by sensitivity. The bar summarizes the predictive perfor-mance over a 2-dB range from 0 to >36 dB. Thin vertical lines are 90%prediction limits (5th and 95th percentile of error), each box indicatesthe interquartile range of the prediction error (25th and 75thpercentile of error) with the line in the box indicating the medianerror. The dotted line of unity indicates perfect prediction. Comparedto Zhu et al.,27 the error range for RGC-AC optimized is smaller atthresholds less than 20 dB.
FIGURE 11. An example wide field OCT B-scan of a participant thatwas excluded from analysis because there is inadequate NFL andGCLþIPL segmentation.
OCT Based Prediction of Visual Fields IOVS j August 2017 j Vol. 58 j No. 10 j 3983
Downloaded From: http://iovs.arvojournals.org/pdfaccess.ashx?url=/data/journals/iovs/936407/ on 08/12/2017

reaches a ‘‘floor,’’ thus, limiting its dynamic range. A similarcurvilinear relationship was found between macular GCLthickness and VF with a dynamic range limited to VF betterthan $10 dB.9 Given the nonlinear correlation between OCTand VF correlation thus established, some have advocated acombined structure–function index (CSFI) to estimate thenumber of retinal ganglion cells in the retina to improve earlydetection of glaucoma.33 Others have advocated carefulexamination of 2 joint OCT scans, that is, ONH NFL andmacular GCL thicknesses, for localized correlation with VFthresholds, paying particular attention to the so-called ‘‘mac-ular vulnerability zone.41,42 More recently, Hood et al.43 hasshown how single wide-field (9 3 12 mm) swept source OCT,thus encompassing ONH and the macula, can be used to detectearly glaucoma. Our results confirmed that wide-field OCTspanning the optic nerve and macula provides a more robustand accurate picture of the retinal structure and shouldimprove correlation with visual function. In fact, our coregis-tered 9-field OCT covers approximately a 608 view of theposterior pole, matching the same area as the HVF 24-2 grid.This allows us to estimate the structure–function correlations,and thereby sensitivity thresholds, for all HVF 24-2 testlocations, at substantial higher correlation than the circum-papillary circle scan and global VF indices. Finally, our resultsdemonstrated how more sophisticated models for integratingOCT structural information, what we call RGC-AC optimized,further improved the correlation to an average 0.74, and evenhigher in some individual, clinically relevant test locations.
In summary, our results showed a high predictive perfor-mance of individual VF thresholds predicted from OCT imageanalysis using the RGC-AC concept and the RGC-AC optimizedapproach, with an average correlation R of 0.74 to actual HFA24-2 perimetry. This performance was obtained on a newlyrecruited, independent population of glaucoma subjects with awide distribution of glaucoma severity. We believe we have laidthe foundation to predict visual function accurately based onOCT structural information, using more of available informa-tion and smart algorithms. Potentially, predicted functionderived objectively from OCT structure in patients withglaucoma may complement subjective VF testing in clinicalmanagement.
Acknowledgments
The authors thank Teresa Kopel for the help in providing theresearch subjects.
Supported by National Institutes of Health (NIH; Bethesda, MD,USA) Grants R01 EY019112, R01 EY018853, and R01 EB004640;the Department of Veterans Affairs; the Marlene S. and Leonard A.Hadley Glaucoma Research Fund; the Clifford M. & Ruth M.Altermatt Professorship (YHK); the Frederick C. Blodi Chair(WLMA); and the Robert C. Watzke MD Professorship (MDA).
Disclosure: Z. Guo, None; Y.H. Kwon, None; K. Lee, None; K.Wang, None; A. Wahle, None; W.L.M. Alward, None; J.H.Fingert, None; D.I. Bettis, None; C.A. Johnson, None; M.K.Garvin, P; M. Sonka, P; M.D. Abramoff, IDx LLC (I, C), P
References
1. Heijl A, Lindgren A, Lindgren G. Test-retest variability inglaucomatous visual fields. Am J Ophthalmol. 1989;108:130–135.
2. Henson DB, Chaudry S, Artes PH, Faragher EB, Ansons A.Response variability in the visual field: comparison of opticneuritis, glaucoma, ocular hypertension, and normal eyes.Invest Ophthalmol Vis Sci. 2000;41:417–421.
3. Wall M, Johnson CA, Kutzko KE, Nguyen R, Brito C, KeltnerJL. Long- and short-term variability of automated perimetry
results in patients with optic neuritis and healthy subjects.Arch Ophthalmol. 1998;116:53–61.
4. Werner EB, Petrig B, Krupin T, Bishop KI. Variability ofautomated visual fields in clinically stable glaucoma patients.Invest Ophthalmol Vis Sci. 1989;30:1083–1089.
5. Mwanza JC, Budenz DL, Godfrey DG, et al. Diagnosticperformance of optical coherence tomography ganglioncell–inner plexiform layer thickness measurements in earlyglaucoma. Ophthalmology. 2014;121:849–854.
6. Mwanza JC, Gendy MG, Feuer WJ, Shi W, Budenz DL. Effectsof changing operators and instruments on time-domain andspectral-domain OCT measurements of retinal nerve fiberlayer thickness. Ophthalmic Surg Lasers Imaging. 2011;42:328–337.
7. Mwanza JC, Oakley JD, Budenz DL, Chang RT, Knight OJ,Feuer WJ. Macular ganglion cell-inner plexiform layer:automated detection and thickness reproducibility withspectral domain-optical coherence tomography in glaucoma.Invest Ophthalmol Vis Sci. 2011;52:8323–8329.
8. Hood DC, Anderson SC, Wall M, Raza AS, Kardon RH. A test ofa linear model of glaucomatous structure-function loss revealssources of variability in retinal nerve fiber and visual fieldmeasurements. Invest Ophthalmol Vis Sci. 2009;50:4254–4266.
9. Raza AS, Cho J, de Moraes CG, et al. Retinal ganglion cell layerthickness and local visual field sensitivity in glaucoma. ArchOphthalmol. 2011;129:1529–1536.
10. Leite MT, Zangwill LM, Weinreb RN, Rao HL, Alencar LM,Medeiros FA. Structure-function relationships using the Cirrusspectral domain optical coherence tomograph and standardautomated perimetry. J Glaucoma. 2012;21:49–54.
11. Hood DC, Raza AS. Method for comparing visual field defectsto local RNFL and RGC damage seen on frequency domainOCT in patients with glaucoma. Biomed Opt Express. 2011;2:1097–1105.
12. Lee K, Kwon YH, Garvin MK, Niemeijer M, Sonka M,Abramoff MD. Distribution of damage to the entire retinalganglion cell pathway: quantified using spectral-domainoptical coherence tomography analysis in patients withglaucoma. Arch Ophthalmol. 2012;130:1118–1126.
13. Bogunovic H, Kwon YH, Rashid A, et al. Relationships ofretinal structure and Humphrey 24-2 visual field thresholds inpatients with glaucoma. Invest Ophthalmol Vis Sci. 2015;56:259–271.
14. Wahle A, Lee K, Harding AT, et al. Extending the XNAT archivetool for image and analysis management in ophthalmologyresearch. In: Proc. SPIE 8674, Medical Imaging 2013:Advanced PACS-based Imaging Informatics and TherapeuticApplications. Orlando, Florida: 2013:86740M.
15. Garvin MK, Abramoff MD, Wu X, Russell SR, Burns TL, SonkaM. Automated 3-D intraretinal layer segmentation of macularspectral-domain optical coherence tomography images. IEEETrans Med Imaging. 2009;28:1436–1447.
16. Quellec G, Lee K, Dolejsi M, Garvin MK, Abramoff MD, SonkaM. Three-dimensional analysis of retinal layer texture:identification of fluid-filled regions in SD-OCT of the macula.IEEE Trans Med Imaging. 2010;29:1321–1330.
17. Bogunovic H, Sonka M, Kwon YH, Kemp P, Abramoff MD, WuX. Multi-surface and multi-field co-segmentation of 3-D retinaloptical coherence tomography. IEEE Trans Med Imaging.2014;33:2242–2253.
18. Garvin MK, Abramoff MD, Lee K, Niemeijer M, Sonka M,Kwon YH. 2-D pattern of nerve fiber bundles in glaucomaemerging from spectral-domain optical coherence tomogra-phy. Invest Ophthalmol Vis Sci. 2012;53:483–489.
19. Lee K, Niemeijer M, Garvin MK, Kwon YH, Sonka M,Abramoff MD. Segmentation of the optic disc in 3-D OCT
OCT Based Prediction of Visual Fields IOVS j August 2017 j Vol. 58 j No. 10 j 3984
Downloaded From: http://iovs.arvojournals.org/pdfaccess.ashx?url=/data/journals/iovs/936407/ on 08/12/2017
scans of the optic nerve head. IEEE Trans Med Imaging.2010;29:159–168.
20. Mwanza JC, Durbin MK, Budenz DL; for the CirrusOCTNDSG. Interocular symmetry in peripapillary retinalnerve fiber layer thickness measured with the Cirrus HD-OCT in healthy eyes. Am J Ophthalmol. 2011;151:514–521.
21. Garway-Heath DF, Poinoosawmy D, Fitzke FW, Hitchings RA.Mapping the visual field to the optic disc in normal tensionglaucoma eyes. Ophthalmology. 2000;107:1809–1815.
22. Abramoff MD, Alward WL, Greenlee EC, et al. Automatedsegmentation of the optic disc from stereo color photographsusing physiologically plausible features. Invest OphthalmolVis Sci. 2007;48:1665–1673.
23. Cortes C, Vapnik V. Support-vector networks. MachineLearning. 1995;20:273–297.
24. Bland JM, Altman DG. Measuring agreement in methodcomparison studies. Stat Methods Med Res. 1999;8:135–160.
25. Giavarina D. Understanding Bland Altman analysis. BiochemMed (Zagreb). 2015;25:141–151.
26. Kleinbaum D, Kupper L, Nizam A, Rosenberg EI. AppliedRegression Analysis and Other Multivariable Methods.Scarborough, Ontario, Canada: Nelson Education; 2013.
27. Zhu H, Crabb DP, Schlottmann PG, et al. Predicting visualfunction from the measurements of retinal nerve fiber layerstructure. Invest Ophthalmol Vis Sci. 2010;51:5657–5666.
28. Sonka M, Hlavac V, Boyle R. Image Processing, Analysis, andMachine Vision. 4th ed. Stamford, CT: Cengage Learning;2014.
29. Wall M, Doyle CK, Zamba KD, Artes P, Johnson CA. Therepeatability of mean defect with size III and size V standardautomated perimetry. Invest Ophthalmol Vis Sci. 2013;54:1345–1351.
30. Zhang X, Bregman CJ, Raza AS, De Moraes G, Hood DC.Deriving visual field loss based upon OCT of inner retinalthicknesses of the macula. Biomed Opt Express. 1 2011;2:1734–1742.
31. Zhang X, Raza AS, Hood DC. Detecting glaucoma with visualfields derived from frequency-domain optical coherencetomography. Invest Ophthalmol Vis Sci. 2013;54:3289–3296.
32. Demirkaya N, van Dijk HW, van Schuppen SM, et al. Effect ofage on individual retinal layer thickness in normal eyes as
measured with spectral-domain optical coherence tomogra-phy. Invest Ophthalmol Vis Sci. 2013;54:4934–4940.
33. Tatham AJ, Weinreb RN, Medeiros FA. Strategies for improvingearly detection of glaucoma: the combined structure-functionindex. Clin Ophthalmol. 2014;8:611–621.
34. Lee K, Buitendijk GH, Bogunovic H, et al. Automatedsegmentability index for layer segmentation of macular SD-OCT images. Trans Vis Sci Tech. 2016;5(2):14.
35. Abramoff MD, Wu X, Lee K, Tang L. Subvoxel accurate graphsearch using non-Euclidean graph space. PLoS One. 2014;9:e107763.
36. Gillespie BW, Musch DC, Guire KE, et al. The collaborativeinitial glaucoma treatment study: baseline visual field and test-retest variability. Invest Ophthalmol Vis Sci. 2003;44:2613–2620.
37. Delgado MF, Nguyen NT, Cox TA, et al. Automated perimetry:a report by the American Academy of Ophthalmology.Ophthalmology. 2002;109:2362–2374.
38. Wall M, Woodward KR, Doyle CK, Artes PH. Repeatability ofautomated perimetry: a comparison between standardautomated perimetry with stimulus size III and V, matrix,and motion perimetry. Invest Ophthalmol Vis Sci. 2009;50:974–979.
39. Quellec G, Abramoff MD. Estimating maximal measurableperformance for automated decision systems from thecharacteristics of the reference standard. application todiabetic retinopathy screening. Conf Proc IEEE Eng MedBiol Soc. 2014;2014:154–157.
40. Bayer AU, Erb C. Short wavelength automated perimetry,frequency doubling technology perimetry, and patternelectroretinography for prediction of progressive glaucoma-tous standard visual field defects. Ophthalmology. 2002;109:1009–1017.
41. Hood DC, Raza AS, de Moraes CG, Liebmann JM, Ritch R.Glaucomatous damage of the macula. Prog Retin Eye Res.2013;32:1–21.
42. Hood DC, Raza AS. On improving the use of OCT imaging fordetecting glaucomatous damage. Br J Ophthalmol. 2014;98(suppl 2):ii1–ii9.
43. Hood DC, De Cuir N, Blumberg DM, et al. A single wide-fieldOCT protocol can provide compelling information for thediagnosis of early glaucoma. Trans Vis Sci Tech. 2016;5(6):4.
OCT Based Prediction of Visual Fields IOVS j August 2017 j Vol. 58 j No. 10 j 3985
Downloaded From: http://iovs.arvojournals.org/pdfaccess.ashx?url=/data/journals/iovs/936407/ on 08/12/2017