Embed Size (px)
Citation preview

JOURNAL OF GEOPHYSICAL RESEARCH, VOL. 92, NO. A5, PAGES 4575-4589, MAY 1, 1987
Optical and Radar Characterization of a Short-Lived Auroral Event at High Latitude
A. VALLANCE JONES AND R. L. GATTINGER
Herzberg Institute of Astrophysics, National Research Council of Canada, Ottawa, Ontario, Canada
P. SHIH AND J. W. MERIWETHER
Space Physics Research Laboratory, University of Michigan, Ann Arbor
V. B. WICKWAR AND J. KELLY
SRI International, Menlo Park, California
Observations of optical emission intensities and incoherent scatter radar returns in the magnetic zenith were compared in a study carried out at Sondre Stromfjord (A = 76.1 ø) in Greenland. The results were used to test the consistency of a theoretical model of ion chemistry and optical emissions in aurora and to explore the accuracy of relations between optical measurements and the average energy of the incident electrons. The incident primary electron spectrum and its temporal variation were inferred from zenith electron density profiles from the radar. The inferred primary energy spectrum at the peak intensity of the event approximated a Maxwellian distribution of characteristic energy 1.3 keV accelerated by an energy increment between 2 and 5 keV. Average energies inferred from the radar electron density profiles, from the N 2 + rotational temperature and the I(6300)/I(4278) ratio were in good agreement. The variation of the I(8446)/I(4278) ratio was studied and was found to be promising as an index of average incident electron energy. An empirical relation between this ratio and average energy was derived from the data. The observed values of I(4278) exceeded the theoretical values derived from the ionization rate profiles deduced from the radar data by a factor near 2.0. Observed electron density profiles and theoretical profiles calculated from optical data were in good agreement provided that the optically inferred ion production rates were reduced by the same factor of 2. This discrepancy is probably the cumulative result of small errors in instrument calibrations, viewing geometry, recombination coefficients and the exci- tation and ionization cross sections used in the model.
1. INTRODUCTION
The use of various optical spectral ratios to derive infor- mation about the flux and spectrum of incident electrons pro- vides a very useful tool in ground-based and satellite synoptic studies of aurora. The utility of such ratios depends on a knowledge of the relation between their values and the energy parameters of the primary flux. The calibration of spectral ratios for this purpose can be done empirically or from auro- ral excitation models. In this paper we attempt to perform empirical calibrations of several spectral ratios as well as to test some aspects of an auroral excitation model.
In recent years the predictions of theoretical treatments of auroral emission rate height profiles have been subjected to various tests. The simplest test is to compare the ratios of observed height integrated spectral emissions observed from the ground with theoretically predicted values for aurora with a "normal" height profile. This method has permitted first order testing of the models. In principle, a much more satisfac- tory test is to measure the height profiles of various emissions and to measure simultaneously by means of a rocket or satel- lite the incident particle spectrum above the aurora so that the predicted and observed emission profiles can be compared. Such comparisons, reported by Arnoldy and Lewis [1977], Kasting and Hays [1977], Rees et al. [1977] and Rees and Abreu [1984] are discussed in section 4.2. In practice it is difficult to measure the particle spectrum and the correspond- ing optical profile simultaneously. This might be achieved
Published in 1987 by the American Geophysical Union.
Paper number 6A8641.
better by means of a rocket experiment combined with ground- and rocket-based meridian scanning photometer sys- tems applied to determine volume emission profiles by tomo- graphic inversion as in the recent ARIES rocket campaign [Gattinger et al., 1985a].
Another possibility is to use an incoherent scatter radar to measure the magnetic zenith electron density profile, from which the ionization rate height profile may be deduced and then to use the latter as input for the theoretical model to provide a comparison with observed zenith integrated spectral
intensities. The magnetic zenith direction is uniquely appropri-, ate for this comparison because incoming electrons are guided along the magnetic field lines and consequently the measure- ments are not affected by the spatial structure of the aurora. This gives quite a stringent test of the model. In all cases it is necessary to use an atmospheric composition and temperature model because it is very difficult to make trustworthy direct measurements of atmospheric composition particularly of atomic oxygen. The technique of using radar-determined elec- tron density profiles to estimate primary electron energy spec- tra has been described and used by Vondrak and Baron [1976], Vondrak and Sears [1978], Sears and Vondrak [1981], de la Beaujardidre and Vondrak [1982] and Vondrak and Ro- binson [1985].
In this paper we present the first results from a program in which we attempt to test a theoretical auroral model by com- bining ground optical observations with radar measurements. Here we examine the internal consistency of the modelling of ion chemistry, electron density and emissions of the first nega- tive (1 N) N2 + bands.
4575

4576 VALLANCE JONES ET AL..' OPTICAL AND RADAR STUDY OF AURORA
TABLE 1. Photometer Spectral Channels
Wavelength, Bandwidth, Spectral A A Features
Blue U V Tube
3374 30 N 2 2P 0, 0 3430 30 N 2 VK 1, 10 3466 3O NI 2F
3404 30 background 3914 30 N 2 + 1N 0, 0 4280 10 N 2 + 1N 0, I P branch 4256 10 N 2 + 1N 0, I R branch 4400 15 background 5577 15 OI 3F
Red IR Tube
6300 15 OI 1F
8446 18 OI 4
8579 18 background 8629 18 0 2 Atm R branch 8684 18 NI 1
8714 18 N 2 2, 1 first positive (1P)
The assessment and testing of the applicability of the spec- tral ratios, I(6300)/I(4278) and I(8446)/I(4278) as a measure of the primary energy of auroral electrons follows naturally. In subsequent work we will compare the predicted and observed intensities of 5577-A OI, 6300-A OI and the permitted IR OI lines.
2. OBSERVATIONS
The optical observations were made using a 15-channel filter wheel photometer. This instrument uses a single filter wheel on which are mounted two sets of 28-mm-diameter in-
terference filters. There is an inner set of six filters centered on
a circle of 71-mm diameter and an outer set of nine filters
centered on a circle of 146-mm diameter. This arrangement permits the use of two different photomultiplier tubes, opti- mized respectively for the blue-ultraviolet and red-infrared re- gions. The integration time for the individual channels is also increased by using two separate photomultipliers. The tubes used were the EMI 9635 and the RCA C31034. Both were
cooled to minimize dark current. For the EMI tube, dark
current was further reduced by means of a permanent magnet assembly at the photocathode. The filter disc rotates at 20 Hz which determines the sampling frequency of each of the 15 channels. The channels are listed in Table 1.
The photometer has a circular field of view of 4 ø. The UV and IR filter sets view the magnetic zenith through separate telescopes which employ fused quartz and glass optics, respec- tively. The photomutipliers are operated in the pulse counting mode and their outputs were recorded on digital tape. The photometer was calibrated using a low brightness source cali- brated by the Physics Division of the National Research Council of Canada. The filter pass bands were measured by means of a grating monochromator having a resolution of 1 ,& and the efficiencies of the filters for the emissions determined
by integrating the product of filter transmission and synthetic spectra of the emission features. No corrections for atmo- spheric extinction were applied to the data because the sky was clear and the observations were in the zenith.
The incoherent scatter radar was also set to view the mag- netic zenith with a transmitted pulse pattern optimized to produce data in E and lower F region. These data were pro- cessed so as to provide electron density profiles every 15 s with a height resolution of about 9 km. The radar has a beam width of 0.6 ø , which is considerably less than the 4 ø field of the
photometer. The radar viewing direction is believed to be ac- curate to within 0.2 ø , while that of the photometer was adjust- ed to within 0.5 ø of the correct direction by using a spirit level as a reference. The radar pulse pattern had a repetition period of 36 ms.
The radar and the photometer were operated for several nights in November 1983, but only on one night was there sufficiently bright aurora combined with good optical observ- ing conditions. The event observed consisted of a bright (IBC 2-3) band which moved rapidly poleward, in less than 10 min, from the southern horizon until it crossed the magnetic zenith. Strong signals were recorded by the photometer for a period of about 60 s. Strong E region echos were simultaneously measured by the radar. The observations reported here cover a period of about 150 s from 0339:58.5 UT on November 13, 1983. The detailed morphology of the auroral band is unfortu- nately not available since no meridian scanning photometers or imaging systems were available. This study concerns itself with the temporal evolution of electron density, derived pri- mary electron flux and optical emissions within a fixed column of atmosphere in the magnetic zenith direction and defined by the fields of view of the radar and the photometer. From this point of view the dynamic morphology of the auroral form is not relevant to our study although it would be of interest in relating our conclusions as to the variation of the primary electron spectrum to the theory of auroral arc production.
3. METHOD OF COMPARISON OF THEORY
AND OBSERVATION
The theoretical ion chemistry and auroral excitation model to be compared with observation has been described in detail by Vallance Jones [1975] as updated by Gatfinger and Val- lance Jones [1979] and Gatfinger et al. [1985b]. In the present version, quenching of O(XD) is assumed to be dominated by collisions with N: with a rate constant of 2.3 x 10- xx cm 6 s- x following the work of Rees et al. [1983].
The radar data provides primarily height profiles of electron concentration (one every 15 s) while the optical instrument provided integrated intensities for several emission features (one set per second) along the same line of sight parallel to the direction of the terrestrial magnetic field. The relations be- tween the data available and the quantities derived from them are shown in schematic form in Figure 1. The arrows indicate the paths followed in obtaining derived data so that compari- sons are possible where two arrows lead to a single box.
RADAR OPTICAL ] MEASUREMENTS MEASUREMENTS ]
[-- ne(h) ]
L
Fig. 1. Schematic diagram showing observed and calculated quantities from radar and optical measurements. The arrows indicate the paths followed in obtaining derived data.

VALLANCE JONES ET AL.' OPTICAL AND RADAR STUDY OF AURORA 4577
OBSF. RVF. B ELECTRON BENS I T I F.S
10-
d
+ I = 15s
• I = Os , • C •0
80 100 1•.0 1•0 1•0 1•0 a•0 HEIGHT km
__
Fig. 2a. Observed electron densities from incoherent scatter radar. The markers indicate the observed values and the solid lines are the smoothed curves from which data was taken for further analysis. The values of T are times in seconds from the starting time 0339:59 UT on November 13, 1983. The zeros for successive curves are displaced upwards by 1 unit to avoid overlap.
First, from the observed electron density profile, ne(h), the ion production rate profile r/i(h ) may be deduced as described below. From this the primary electron spectral shape, 4•(E), can be inferred by matching the observed profile with synthet- ic profiles calculated from the model for various assumed forms of the spectrum. Finally, the average primary electron energy, (E)= • E•(E) dE/• •(E) dE, can be calculated. It should be noted that, for a Maxwellian energy distribution, (E) = 2E 0 where E 0 is the characteristic energy parameter of the distribution function.
The optical data give the integrated intensity of I(4278), the 0, 1 N 2 + first negative band. This is related to total ionization rate rh(h ) by the equations
•1(4278)/•1,(h) = (1/46.5)/{1 + 1.06n(O2)/n(N2)
+ 0.59n(O)/n(N2)} (la)
I(4278) = i r/(4278) dh (lb) OBSERVED ELECTRON DENS
T = 150s
10- • • • • • mr •r •r •r •r •r •r •r •r
z w
z
w
T = 135s
0
80 1•0 1•0 180 •00 HE I GHT km
Fig. 2b. Similar to Figure 2a for T = 75 to 150 s except that the zeros are displaced upwards successively by 2 units.

4578 VALLANCE JONES ET AL..' OPTICAL AND RADAR STUDY OF AURORA
30-
•o ,...•I ( 5577 ]
• •,.., .,• •:, '•',u,,,... ,r•,,•.•, • •I [6300)•10 z
• ',,,,•I [ •27 •0 8]•5 ,
• I [ 8dd6] •
__
0 '
TIHE seconds
Fig. •. Observed optical ime•iiie• for the emi•io• feai•re• i•dicaied. The ime•iiie• of 28446• 263• a•d 24278 have bee• m•liiplied by the facio• i•dicaied. The zero fo• the time •cale i• the •ame a• for Figure
where r/(4278) is the volume emission rate of ,•4278 and the factor in curly brackets takes account of the relative con- centration of N 2 and differences in the ionization cross sec- tions of O, O 2 and N 2 [Vallance Jones, 1974, p. 105]. The constant '46.5 is the product of A(0, 0)/A(0, 1) (the transition probability ratio for the ,•3914 and ,•4278 N2 + 1N bands) multiplied by the ratio of the total ion production rate of N 2
comparison is possible between the observed value of I(4278) and the value derived by equation (1) from the radar observa- tions.
Second, the optical data give a weighted value of the netural atmospheric temperature as determined from the rotational structure of the 4278• N 2 + band. The weighting factor is the height profile of the emission rate, r/(4278, h) as given above,
to the volume emission rate of ,•3914. The recent value of Zipf and consequently, et al. [1985] for the second factor is within 1% of the value used earlier. The total ionization cross sections for O, O2 and N 2 adopted by Zipf et al. would lead to the replacement of the constants 1.06 and 0.59 in equation (la) by 1.17 and 0.54, respectively. These changes produce insignificant changes in the calculations reported in section 4. Consequently, a direct
( T•) = f T(h)rl(4278) dh/ f •l(4278) dh (2)
This provides another series of comparisons between the two data sets.
TIME seconds
Fig. 3b. Same format as Figure 3a showing intensity variation for •,4278, and •,6300, together with curves of •,4278 smeared with time constants of 11, 33 and 110 s and normalized to the same peak value as the curve for ;•6300.

VALLANCE JONES ET AL.' OPTICAL AND RADAR STUDY OF AURORA 4579
110 km
• krnv • I// / 101 km
1- .. ;-'
o
0 1'5 3'0 •'5 do 7'5 9'0 1•)5 1•.0 1•5 1•0 TIME seconds
Fig. 4. Selected interpolated electron density curves from the smoothed data points of Figure 2.
The optical data also provides values of the spectral ratios, Rg = I(5577)/I(4278) and R, = I(6300)/I(4278) which have been frequently used to estimate av. erage primary electron energies, (E), in aurora. Likewise, (T•) can, as described below, be used to estimate values of (E) which can likewise be tested. Values of (E) can be inferred from the radar data and com- pared to estimates based on the optical data.
Finally, a test of the ion-chemistry model can be made in which the electron fluxes derived from the radar and optical data are used as inputs leading to calculated values of the electron density profiles for comparison with the observations. In the present study this comparison was made, first, during the initial period when primary electron spectra were to be deduced directly from the radar data and, second, after 60 s when information on the primary particle characteristics was obtained solely from the optical spectral ratios and intensities. (During the period of declining intensity beyond 60 s it was not possible, as discussed in section 4.1, to deduce ionization rate profiles from the radar returns.) The second half of the test is more stringent and interesting. During the first period, the modelling is essentially no more than a reversal of the steps (based on equation (3)) used to infer the ion production rates from the observed electron densities.
4. RESULTS AND COMPARISON WITH OBSERVATION
4.1. Ion Production Rate Profiles and Primary Electron Spectra
The measured electron density values are plotted against height in Figure 2 which shows the data at 15-s intervals during the 150-s period of observation. There is some scatter in the electron density data and, consequently, smooth curves were drawn among the data points in an attempt to reduce the effect of this scatter on subsequent steps in the analysis. Smoothed electron densities, plotted at fixed heights in Figure 4 enable a more direct comparison to be made with the opti- cal data to be described in the next paragraph.
The corresponding zenith optical measure, ments are shown in Figure 3a for the same period. The optical data were averaged over 1 s. intervals. During the period of observation the I(5577) increased from about 7 kR to a maximum of nearly
30 kR and then fell back to about 1 kR by the end of the period of observation. I(4278) shows a similar variation at a lower intensity level while I(6300) shows a similar but smaller intensity variation. It is to be noted that the variation of I(6300) does not correspond simply to I(4278) smeared with the radiative lifetime of O(XD). In Figure 3b are plotted the results of convolving I(4278) with the impulse responses corre- sponding to the emission of excited species with lifetimes of 11 s, 33 s and 110 s. The convolution was extended back in time by 165 s with the help of I(4278) intensities recorded before T = 0 (not shown). None of the smeared curves reproduce the observed intensity variation of 26300. Moreover, it does not appear that any combination of the three smeared curves would do better. This suggests that an important factor in the time variation of I(6300) is a strong variation in the primary electron spectrum together with the existence of a substantial component of the 6300/•, emission arising from lower heights where the effective lifetime is shortened by collisional deacti- vation. Eather [1969] reported such short time constant fluc- tuations in 26300. There does not appear to be any simple way to extract from this data the steady state values of 26300 which would have been approached if the time variations had been much slower.
The curve for I(8446) follows the variation of I(4278) but increases less strongly at the higher intensity levels.
In comparing the radar and optical data it is necessary first to infer the height profile of the ionization rate and secondly to deduce the primary electron spectrum. The primary elec- tron spectrum may be deduced by a variant of the method described by Wickwar et al. [1975]. The first step is to obtain the ion production rate profile, r/i(h ), from the measured elec- tron concentration profile, ne(h ), of Figure 2. The connection between these quantities is given by the continuity equation
d%/dt = rli -- •z' ne 2 (3)
In the work of Wickwar et al., conditions when d%/dt was small were chosen, but in the present case the effect of this term must be considered. First, the data from Figure 2 were replotted as functions of time for fixed heights. Representative examples of the time variation of electron concentration at several heights observed are shown in Figure 4 where each

4580 VALLANCE JONES ET AL.' OPTICAL AND RADAR STUDY OF AURORA
N•ck•aP et oLo ]975
HodeL - TcaLcuLated
Hodek - T radar
•l 1 •10 -• Effectuve Recombunotuon Coeffucuent cm s
Fig. 5. Comparison of values of effective electron recombination co- efficient in aurora as described in the text.
curve is drawn smoothly through values taken from the smoothed curves in Figure 2. The gradients of the curves of Figure 4 were then used to calculate r/i(h ) profiles using (3). The values for the effective recombination coefficients were
initially taken from curve 2 from Figure 3 of Wickwar et al. However, in order to make the analysis more consistent with the model, we derived theoretical values of • by running the model, until a steady state electron density was reached with a set of constant input ionization rate values approximately equal to the values derived in this study for T = 45 s. Values of • were then determined from equation (3) with dn,/dt set equal to zero. This was done for two cases: (1) with the elec- tron temperature, T,, recalculated at each time step, and (2) with T• set equal to the values measured by the radar. The calculated height profile for • for these two cases and the original values from Wickwar et al. are plotted in Figure 5. In the important region between 100 km and 140 km the three curves agree within 20%. For subsequent calculations we adopted the intermediate curve corresponding to case 1. The absolute values of r/i(h), particularly above 150 km, are signifi- cantly affected by the choice between the three curves of Figure 5 but the relative values between 100 and 150 km upon which the estimate of primary electron energy depend, are affected much less. The sensitivity of the results to this choice will be discussed below as appropriate. The contributions to the terms of (3) for the 11 height profiles measured by the radar are shown in Figures 6a and 6b. More detailed plots of the first five profiles are given in Figure 6c, in which the derived values of rli(h) are shown by the discrete points. For T = 15 to T = 60 s the contribution of dne/dt is significant but not dominant and the calculated profiles, r/i(h ), appear to be satisfactory. For T -- 0 the calculated points are somewhat scattered. In this case the time derivative term (see Figure 6a) is dominant because of the rapid increase of electron density
at the beginning of the event. The estimate of dhe/dt which is obtained from the gradient of the curves of Figure 4 will be subject to inaccuracies when the increase of n• is rapid. Like- wise beyond T - 60 the estimates of r h gave scattered points with some regions of negative values. (It should be noted that the x axis scale for Figure 6b has been increased by a factor of 3.0.) In this period the dn•/dt terms are more important possi- bly because the time constant for recombination, zx/2 = 1/•n, is of the order of 40 s beyond T = 75 s above 140 km and, consequently, the observed electron density is dominated by the decaying density from earlier times rather than by the ion production terms.
A possible inaccuracy in the analysis is the effect of trans- port terms which are neglected in (3). Huuskonen et al. [1984] have shown that vertical motions caused by perpendicular electric fields could affect the vertical ionization profiles. In the absence of accurate knowledge of such fields, we have not been able to take this effect into account. We also neglect effects due to vertical io n diffusion. If either of these effects
were significant we would expect marked discrepancies to appear between the observed and calculated ionization height profiles reported in section 4.8. These discrepancies would appear in the period after T = 60 s when the electron density profile is calculated from the primary electron fluxes derived from the optical data alone by means of an ion chemistry model in which the transport terms are neglected.
There is some indication from the radar data that there
were no strong electric fields at the time of the event. First, an analysis of 45 seconds data when the aurora was bright showed that the E region electron temperature was not elevat- ed above the ion temperature as can occur in the presence of strong fields [Wickwar et al., 1981]. Second, the F region ion temperature, estimated at 15-s intervals lay in the range 500- 800 K, which suggests that there was no significant electric field heating of F region ions. Moreover, the data do not provide a means of estimating whatever small electric field may have been present. The radar beam was fixed in the magnetic zenith and consequently it was not possible to esti- mate the perpendicular electric field by the Doppler method [Wickwar et al., 1984].
The next step is to match the inferred ion production rate height profiles of Figure 6c with model height profiles so as to obtain estimates of the primary electron energy. We used a set of monoenergetic ion production profiles calculated by the model described by Gattin,let et al. [1985b]. For neutral at- mospheric density and composition we used the MSIS-83 model described by Hedin [1983] computed for the night of the observations. Various methods which have been used to
solve for the primary electron spectrum are referenced in the introduction. We found it practical to vary the parameters of a suitable analytical form for the spectrum until agreement within experimental error was obtained with the ion pro- duction rate profile. This may not be the most convenient method for routine use, but it appears quite satisfactory for a limited number of profiles. The modelled ion production pro- files are shown as the solid lines in Figure 6c. We did not attempt to use this technique to obtain energy spectrum esti- mates beyond 60 s. because the ion production rate profiles show too much scatter, including small negative values after I(5577) had dropped below 5 kR.
The results of the analysis are summarized in Table 2 which shows the parameters of the primary electron spectrum and the average electron energy. It was found that all but one of the observed height profiles could be fitted very well by an

VALLANCE JONES ET AL.' OPTICAL AND RADAR STUDY OF AURORA 4581
200 200 200
, T = s T = $s T = 30s •"•, ' ...... ,•, l O0 1 O0 1 O0
-'1 -•l . . . 6 • .... .S . . 3.0 •.S 6•.0 .S 0 •.S 0 -'1 S 3•.0 •.S -• -, 0-• -• -, 0-• -• -, 0-• cm s xl cm s xl cm s xl
200
100
200 200
, T = 45s T = 60s ,
•..... _ _ _ _.
1 O0 , 100, -•l [ 3 ]. •[ 6' -]l • ] 3 [ •[ ' 6' .5 0.0 1.5 0 .5 .0 .5 0.0 1.5 3].0 4[.5 d.0 -1.5 0.0 1.5 .0 .5 .0
-• -, 0-• -• -, 0-• -• -, 0-• cm s xl cm s xl cm s xl
T = 7%s
Fig. 6a. Calculated total ion production rate profiles (dashed line) and values of terms of equation calculated from the data of Figure 4 for T = 0 to 75 s. The solid line gives values of dne/dt and the dotted line gives values of •. %2.
accelerated Maxwellian spectrum, i.e., a Maxwellian popu- possible that the ion production rate profile from which it was lation of characteristic energy E o to which a constant amount derived could be an artifact obtained in the process of averag- of energy E a ismadded to each electron as would arise in falling through a constant potential difference. The only exception was the height profile at T = 0. In this case the best fitting primary spectrum was obtained by using a power law distri- bution with spectral index N but with a low energy cutoff at a minimum energy E m. It is not clear whether the latter distri- bution could have any physical significance and indeed it is
ing the radar data over the 15-s integration time.
4.2. Comparison of Observed Values of 1(4278) and Values Predicted From Radar Ionization Height Profile
As discussed above, the most direct test of the consistency of the theoretical relations between electron density, ionization rate and optical emissions in the N2 + bands is that between
200 200 200
T = Os T = 05s , T = 120s l O0 l O0 l O0
-'0.5 . 0'.5 l'.O 1.5 0 -'0. 0'.5 l'.O 1.5 0 -'0.5 0.0 5 l.O 1'.5 2'.0 2 [. ß 2'. 0'. -• -, 0-• -• -, 0-• -• -, 0-• cm s xl cm s xl cm s xl
200 200 T = 135s
l O0 l O0
05 0.0 0'.5 0 5 0 5 0.0 - . l'. l'. 2'. -'0. -3 -1 cm s xl
T = 150s
i i
0 [. 5 1.0 I. 5 2'. 0 -3 -1 0-•1 cm S x1
LEGENO
dn /dr
Fig. 6b. Same as Figure 6a for T --- 90 to 150 s except for an increase in scale of 3x in the x axis.

4582 VALLANCE JONES ET AL..' OPTICAL AND RADAR STUDY OF AURORA
198 MODEL & RRBFIR BRTFI
o
z • T-4Ss o c4- x x x .'<. x
r,_) o :z:) ß
o• T- 3Os
•:• o " T-15s • ß
m 0 0 o- T=0s
0 0 0 0 0 0 0 0
CD C I I
80 100 120 l •t0 160 180 200
HEIGHT km
Fig. 6c. Relative ion production rates. The markers indicate the values replotted from the dashed curves of Figure 6a while the solid curves are modelled values in which the parameters of the electron flux distribution were adjusted (as detailed in Table 2) to give a good fit to the derived points.
the observed intensity of N: + and that deduced from the ionization rate profile as given by (1). Values of I(4278) using this equation are compared with photometer data in Table 3. Since the radar data are acquired over 15-s intervals, the opti- cal data were averages over the same time intervals. The effect on the results of the choice between the recombination coef-
ficient curves of Figure 5 was explored and it was found that the higher values of • corresponding to the radar derived electron temperatures led to increases in the derived values of I(4278) of less than 10%.
The values derived from the radar data are almost half the
observed optical values (if the values for T = 0 are omitted). In addition to the factors discussed in section 4.1 there could
be inaccuracies in one or more of the following: (1) the ratio between the total ionization cross section for N 2 and that for the production of the 4278-A N•_ + band; (2) the absolute cali- bration of the radar; (3) the absolute calibration of the pho- tometer; (4) some mismatch between the optical and radar observations; (5) the neutral atmosphere composition ratios derived from the MSIS83 model.
TABLE 2. Primary Energy Spectrum Parameters
Parameters Mean
Time, Spectral Energy, s Form N and E,,E o and E a keV
N E,, 0 cutoff power 4.0 2.5 3.6
Eo, keV Ea, keV 15 Maxwellian 1.4 2.2 5.0 30 Maxwellian 1.4 4.0 6.8 45 Maxwellian 1.3 4.5 7.1 60 Maxwellian 1.2 4.7 7.2
The first possibility that there are serious errors in the cross sections seems to be ruled out by the good agreement which exists between the predictions of the model and direct com- parisons of electron energy flux and auroral intensities. For example, Kasting and Hays [1977] and Deehr and Egeland [1972] report average measured efficiencies for the production of auroral 24278 emission of 256 and 270 R/(erg/cm 2 s). The auroral model used in this paper gives efficiencies in the range 220-250 R/(erg/cm 2 s) for monoenergetic fluxes of energies from 2.6 to 12 keV. Other comparisons of predicted Ne + 1N band intensities from observed electron fluxes measured by rocket and satellite flights have been made by Arnoldy and Lewis [1977] and Rees and Abreu [1984] with excellent agree- ment. In these cases the predictions were made with models using similar cross sections to ours. In the work of Rees et al. [1977] the observed N2 + band intensity (measured by a rocket photometer) was less than was predicted by the model from the particle flux measured by the AE-C satellite in a coordinated experiment but, as the authors point out, the sat- ellite and rocket measurements were not exactly conjugate over the relevant part of the rocket ascent. In any case the discrepancy noted by Rees et al. is that the observed 24278 profile is weaker than predicted.
TABLE 3. Observed and Calculated Values of I(4278)
Time, I(4278) Observed I(4278) Equation (1), s kR kR
0 1.0 1.2
15 2.3 1.3
30 2.9 1.6 45 3.4 2.0 60 3.3 1.6

VALLANCE JONES ET AL.: OPTICAL AND RADAR STUDY OF AURORA 4583
1000 1 900
8oo- . T•(N:') K
700 - ,oo_ """ ,xoo ,00,% ..... : , .................. ,oo_ : v
"' '.:' 0:•. ,. : ' '" •, ' ,oo " " "• "?•' ,,,-,, ,,,, ,,,' ,"' v '" ", .1 xOO I ,' "'-" • • /
200 • ,,' ',, /- • •'
,oo o ............... i i i
o ,• •o • •o is •o ,•s ,20 T I HE seconds
Fig. 7. Observed spectral data which are sensitive to the primary electron energy spectrum. The spectral ratios are indicated. The N•_ + rotational temperatures are plotted as the solid line. The solid circles indicate the rotational temper- atures predicted from the ionization rate profiles of Figure 6. The numerical ordinate scale applies to each of the curves as labelled.
We do not believe that the error due to either of the second
or third factors could be as large as a factor of 2. The fourth possible source of disagreement between the
radar and optical measurements is a mismatch between 0.6 ø field of the radar and the 4 ø field of the photometer. Thus the optical data are spatially averaged over a circle about 8 km in diameter at 115 km compared to a diameter of a little over 1 km for the radar observations.
However, the temporal averaging over 15 s applied to both data sets probably minimize the effects of the spatial mismatch since the rapid motion of the fine structure of auroral forms would tend to produce a uniform time-averaged intensity and electron density profile across the photometer field. Some of the scatter in the ratios of columns 2 and 3 of Table 3 could
possibly arise from this cause, but it is hard to see how this could introduce a large systematic error. Since we believe the photometer field to have been centered on the radar field within 0.5 ø, it is unlikely that a sighting error could have contributed significantly to the deviations of the ratios of Table 3 from unity.
All in all, we have not been able to identify a single likely cause for the discrepancy which may indeed arise from an accumulation of several smaller errors. In any case, agreement to within a factor of 2 could be considered reasonably satisfac- tory in a complex measurement of this kind.
It follows that the ionization rates used in the modelling, based on the photometer data, will be too high by a factor of 2 and consequently in the detailed comparison with the model described in section 4.8 we have reduced the optically normal- ized ionization rates by 50%.
4.3. Comparison of Observed Band Rotational Temperatures With Average N2 + Temperatures Predicted From the Radar Ionization Rate Height Profile
Estimates of the magnetic zenith N 2 + band mean rotational temperature, (T,), were provided by two filter channels cen- tered at 4275 /!• and 4251 /!• with band passes of about 12 A.
These detect the P and R branches, respectively, of the 0,1 N2 + first negative band. It was shown by Hunten et al. [1963] that the ratio of the signal of two such filters provides a sensi- tive measure of the rotational temperature of the band and there is good evidence, at least in the absence of heavy ion precipitation that the temperature obtained equals the neutral atmospheric temperature. The temperature calibration de- pends on an accurate knowledge of the instrumental profiles of the two channels, followed by a determination of the rela- tive signals from a series of synthetic spectra at different tem- peratures. The calibration so obtained was applied to the mea- sured ratios during the event observed and the results are plotted on Figure 7. It will be seen that there were substantial changes in the observed values of (T•) during the intensi- fication of the aurora and also that (T•) and intensity are inversely related. It should be noted that the observed values of (T•) are believed [Hilliard and Shepherd, 1966] to be due to changes in the height profile of the emission and not to any change in the atmospheric temperature profile.
These observed temperatures may be compared (see Figure 1) with estimates of the mean N2 + rotational temperature derived from the radar estimate of the ionization height profile by means of (2). In evaluating this equation we used the total ion production rate as plotted in Figure 6. The values of so obtained are plotted as the solid circles on Figure 7 and agree very well with the rotational temperatures. The values of (T•) derived are affected by less than 3% by the choice of the curves of Figure 5.
4.4. Average Primary Energies from N 2 + Rotational Temperatures
The procedure described in section 4.3 may be reversed to provide estimates of the mean primary particle energy which are at least as good as those provided by the ratios of emission features. The method was tested earlier by Shepherd and Eather [1976].
The basis for the procedure is shown in Figure 8, which

4584 VALLANCE JONES ET AL.' OPTICAL AND RADAR STUDY OF AURORA
o
25O
LEGEND
o = Monoener9etcc • o = MaxueLt•an
• • RcceLerated MaxueLLLan Eo-O.SkeV + - RcceLerated MaxueLLLan E•] OkeV
0 • x = RcceLerated MaxweLL•an E =l •keV
, o
noted HaxweLLuan Eo=2.SkeV
3•o 3;o 4•o 4•o s$o s;o 65o 6;o 75o 7;o 8•o 8;o MEBN ROTBTIONBL TEMPERBTURE [N•+} K
Fig. 8a. Predicted N2 + rotational temperatures plotted against average primary' electron energy for various modelled primary elec- tron flux distributions as indicated in the legend and text.
shows a plot of the values of (T•) against average primary electron energy for a variety of forms of the primary energy spectrum. The model was used to generate the ionization rate profiles which were then substituted into equation (2). The two main curves in the figure give the relation between (T,) and (E) for the extreme cases of Maxwellian and monoenergetic primary fluxes. These curves indicate that, in the absence of any knowledge of the shape of the primary spectrum, it is possible to estimate the average energy from (T,) with an accuracy of the order of 30%. The intermediate curves in Figure 8 correspond to intermediate cases of accelerated Max- wellians which provide a range of spectral shapes which ap- proach the Maxwellian or monoenergetic for extreme values of the parameters E a and E o as defined in section 4.1. Esti- mates of (E) using this method are compared with the values derived from the radar data in Table 4 below. The lower value
shown in the energy estimate from (T,) is for the Maxwellian case and the higher for the monoenergetic one. If one had no a priori knowledge of the spectral type and assumed a Maxwel- lian form, the energy estimates by this method would have been low but within 25% except for the measurement at T = 0. As noted above, the primary spectral shape is peculiar in this case and may have been an artifact of the temporal variation during the radar integration period.
A somewhat surprising feature of the curves of Figure 8 is that for a given value of (E), the value of (T,) is higher for the monoenergetic distribution. One might intuitively expect that the monoenergetic flux would be concentrated more sharply toward the lower edge of the form where the temper- ature would be lower. Apparently, however, the broader spread of energies in a Maxwellian distribution produces ioni- zation below as well as above the heights dominant for a monoenergetic spectrum. For the lower region the relative
CD n• U z u
u CD •Z n• U
o
0.01
LEGEND o = Rees (1985)
o- Rees & •cke•q (1974) + NRC MS! 3 HonoenergetLc ß • NRC MSIS83 MoxweLLLon
116300//I 14278)
Fig. 8b. Theoretical values of the ratio I(6300)/I(4278) plotted against the average energy (E) for Maxwellian electron energy distributions, isotropic over the downward hemisphere. The points for the curves labelled NRC MSIS83 represent theoretical values calculated by the model described in the text for monoenergetic and Maxwellian primary electron spectra. The dashed line through the crosses is a plot of equation (4). The solid lines connect the points for the other cases.
VALLANCE JONES ET AL.' OPTICAL AND RADAR STUDY OF AURORA 4585
z L•]
0.6
+ LEGEND
•,• x + = MEFIN E PROM REO LINE x x x = MEFIN E FROM TEMPERFITURE
½•x x +
+ +Xx x
+• x
xx•½+•x x • •x x •
i
Fig. 8c. Values of the ratio I(8446)/I(4278) measured in this work plotted against estimates of the mean incident electron energy derived from the ratio I(6300)/I(4278) and
concentration of N 2 is higher so that the mean value of T• is weighted to lower values.
4.5. Average Primary Energies From 1(6300)/1(4278) Ratios
This ratio has frequently been used for estimates of the average energy of primary electrons. As with estimates based on rotational temperature it is necessary to make an assump- tion about the form of the primary spectrum to derive a unique relation theoretically. The usual practice has been to assume a Maxwellian form for the primary spectrum.
The I(6300)/I(4278) ratio, denoted for convenience by R r, is plotted in Figure 7 as a function of time. The value of I(4278) is replotted on this figure for comparison. It is rather well established that R r is a function of the energy of the primary electron even though there is some question as to the mecha- nism of excitation of the 6300-/• line. A theoretical relation-
ship calculated by Rees and Luckey [1974] has been widely used. Vondrak and Sears [1978] followed a similar procedure
TABLE 4. Comparison of Primary Electron Energy Estimates From Radar Data and Optical Line Ratio Rr
Mean Electron Energy, keV
R•, R o, From Time, I(6300)/ I(5577)/ (Tr) From From Radar
s I(4278) I(4278) K (T•) R• Data
0 1.33 6.71 502 2.5-3.5 3.7 3.6
15 0.70 6.66 397 4.5-5.5 5.8 5.0
30 0.60 6.71 356 5.5-7.0 6.4 6.8
45 0.52 6.76 353 5.5-7.0 7.0 7.1
60 0.55 6.85 350 5.5-7.0 6.7 7.2
LEGEND o = MERN E FROM RED LINE
i A • •?• o = MERN E FROM TEMPERRTURE
1'5 3'0 ,'5 6• 7'5 ½ 1•5 1•0 1•5 150 TIME seconds
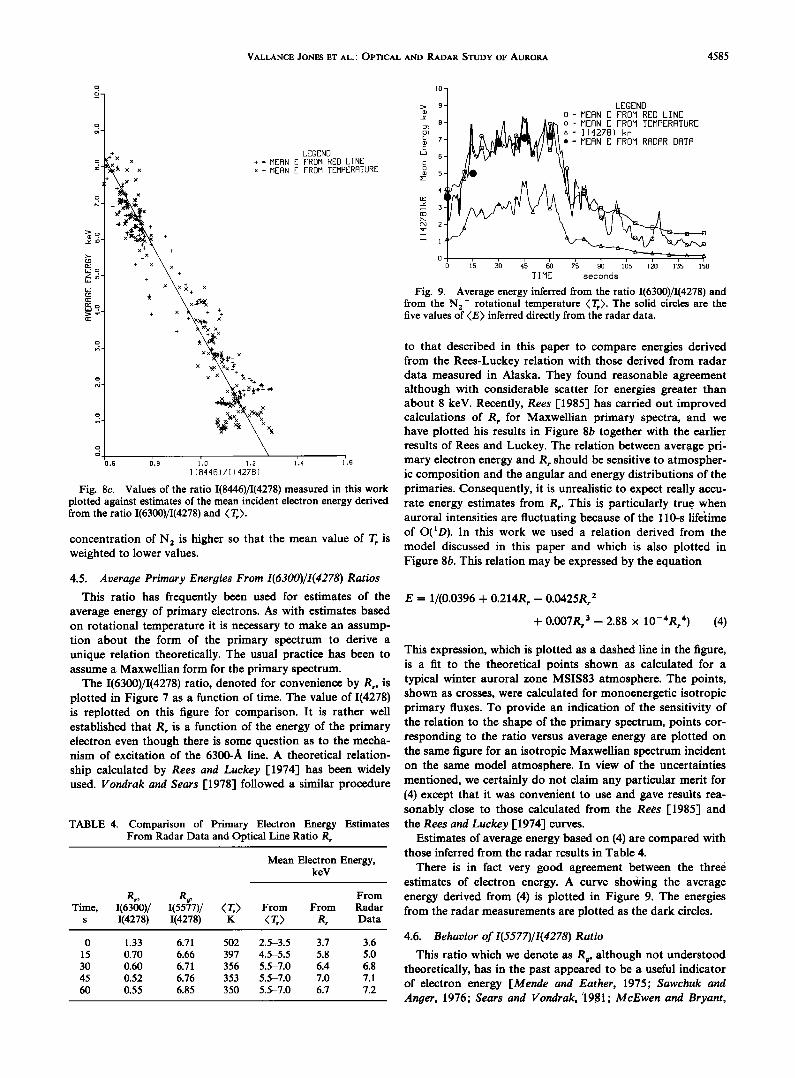
Fig. 9. Average energy inferred from the ratio I(6300)/I(4278) and from the N: + rotational temperature (T•). The solid circles are the five values of (E) inferred directly from the radar data.
to that described in this paper to compare energies derived from the Rees-Luckey relation with those derived from radar data measured in Alaska. They found reasonable agreement although with considerable scatter for energies greater than about 8 keV. Recently, Rees [-1985] has carried out improved calculations of R• for Maxwellian primary spectra, and we have plotted his results in Figure 8b together with the earlier results of Rees and Luckey. The relation between average pri- mary electron energy and R• should be sensitive to atmospher- ic composition and the angular and energy distributions of the primaries. Consequently, it is unrealistic to expect really accu- rate energy estimates from Rr. This is particularly true when auroral intensities are fluctuating because of the 110-s lifdtime of O(•D). In this work we used a relation derived from the model discussed in this paper and which is also plotted in Figure 8b. This relation may be expressed by the equation
E = 1/(0.0396 + 0.214R• -- 0.0425R• 2
q- 0.007Rr 3 -- 2.88 x 10-'•R/•) (4)
This expression, which is plotted as a dashed line in the figure, is a fit to the theoretical points shown as calculated for a typical winter auroral zone MSIS83 atmosphere. The points, shown as crosses, were calculated for monoenergetic isotropic primary fluxes. To provide an indication of the sensitivity of the relation to the shape of the primary spectrum, points cor- responding to the ratio versus average energy are plotted on the same figure for an isotropic Maxwellian spectrum incident on the same model atmosphere. In view of the uncertainties mentioned, we certainly do not claim any particular merit for (4) except that it was convenient to use and gave results rea- sonably close to those calculated from the Rees [1985] and the Rees and Luckey [1974] curves.
Estimates of average energy based on (4) are compared with those inferred from the radar results in Table 4.
There is in fact very good agreement between the three estimates of electron energy. A curve showing the average energy derived from (4) is plotted in Figure 9. The energies from the radar measurements are plotted as the dark circles.
4.6. Behavior of 1(5577)/1(4278) Ratio
This ratio which we denote as R•, although not understood theoretically, has in the past appeared to be a useful indicator of electron energy [Mende and Eather, 1975; Sawchuk and Anger, 1976; Sears and Vondrak, •i981; McEwen and Bryant,

4586 VALLANCE JONES ET AL.' OPTICAL AND RADAR STUDY OF AURORA
TABLE 5. Average Rotational Temperature Versus E a
Ea, keV < T•), K
0.0 540 1.0 504
2.0 460 3.0 418
4.0 380
5.O 352 6.0 328 7.0 305
8.0 294
E o = 1 keV.
error as values deduced from I(6300)/I(4278) because of possi- ble variations in atmospheric composition.
4.8. Comparison of Observations With Ion Chemistry Model
A more detailed test of the ion chemistry model is to com- pare the observed electron density profiles with profiles pre- dicted by the model using the inferred primary electron spec- tra. The comparison can be made directly up to T = 60 s, but after that time only the average energy estimated from the N 2 + temperature measurements or the red line ratio is avail- able. The form of the relative energy spectrum beyond 60 s must be assumed, although in principle the initial assumption could be modified to improve the fit. Once the primary elec-
1978; McEwen et al., 1981]. The results obtained here are tron spectrum is defined as a function of time, the variation of the electron density profile can be calculated from the model tabulated in Table 4 and do not appear to indicate any strong
variation over the range of energies covered. This is more or and compared with the observations. less consistent with the observation that for normal aurora the Primary electron energies inferred from temperature ratio of the corresponding volume emission rates is rather measurements were used since these should be more reliable constant with height (for example, Feldman [1978]). It would than the red line ratio values in the present case where the appear that this ratio would only be useful for energies above intensity varies rapidly with time. the range measured here, i.e., above about 8 keV. The values The choice of spectral form was made on physical grounds. of Rg in Table 4 are somewhat higher than we have normally Inspection of Table 2 and the time variation of the auroral encountered at auroral oval latitudes for values of I(4278) intensity in Figure 2 suggests that the enhancement of inten- above 1 kR [Gattinger and Vallance Jones, 1972]. It is possi- sity associated with the event is connected with some kind of ble that the atomic oxygen concentration is somewhat higher. parallel field acceleration of a Maxwellian population of mag-
netospheric electrons of which the characteristic energy de- 4.7. Behavior of the 1(8446)/1(4278)Ratio clines slowly from 1.4 to 1.2 keV. It seems reasonable to
This intensity ratio is an excellent candidate to provide an assume that the decay in intensity is associated primarily with index of excitation energy. The 8446-A OI line is clearly en- the decay in the accelerating field, and consequently we at- hanced in spectra from higher levels in aurora as seen, for tributed the rise in the observed .temperature after 60 s to the example, in the spectra obtained by Vallance Jones and Gat- softening of the particle spectrum corresponding to a drop in tinget [1973] '(see also Oreholt [1957], Christensen et al. E a while the characteristic energy remained constant at 1.0 [1978]). It appears likely, from the recent work of Hecht et al. keV. The relation between (T•) and Ea with E 0 = 1.0 keV is [1985], that the 8446-A multiplet is excited directly from tabulated in Table 5. atomic oxygen by electron impact and in this case it would be It may be seen from Figure 7 that the derived rotational expected that the I(8446)/I(4278) ratio would be determined temperature rises above 540K beyond 90 s, and consequently principally by the ratio of n(O)/n(N,) which shows consider- we assumed that further softening of the primary spectrum able variation over the normal 100-160 km range of auroral was associated with a decrease in the characteristic energy E 0. heights. In this regime, the connection between average temperature
The variation of intensity of the 8446-A emission is plotted and characteristic energy as calculated by the model is given in Figure 3, which shows that the emission is relatively weaker in Table 6. as the intensity of I(4278) increases. The ratio I(8446)/I(4278), We then used the observed rotational temperatures to inter- Rir, is plotted in Figure 7. This shows that the ratio, by coin- polate in the data of Tables 5 and 6 to define the parameters cidence, remains almost exactly proportional to the N 2 + rota- of the primary electron spectrum. The relative ionization rate tional temperature and, consequently, should be a good index profile was calculated by the modelling program. Its absolute of particle energy. The ratio, Rir, is easier to measure than the value was then obtained by normalizing to the observed value rotational temperature. Both quantities will be sensitive to of I(4278) as plotted in Figure 3. As noted in section 4.2, the some extent to variations in atmospheric composition and ionization rates so derived were reduced by 50% to correct for temperature profiles, and it remains to be seen which can apparent calibration errors in the observations or the relative provide the most reliable index of primary electron energy. In comparison with the 1(6300)/1(4278) ratio, both rotational temperature and R•r have the advantage of not being affected by temporal changes in the auroral emission.
As described in more detail in the next section, the average primary particle energy was inferred both from the measured values of R• and of (T•) and plotted in Figure 9. In Figure 8c, these values of energy are plotted against the measured values of the ratio I(8446)/I(4278). This figure shows as expected a good correlation between the average energy and the spectral ratio. The relation may be represented by the equation
(E> = 15.5- 12.1 x R• (5) This equation would be expected to provide reasonable values of (E) although the results will be subject to the same kind of
cross sections used in the model. Values were calculated at 1-s
intervals.
The values of the average energy based on the above as- sumptions are plotted on Figure 9 for the full period of obser-
TABLE 6. Average Rotational Temperature Versus E o
Eo, key (T•), K
0.8 581
0.6 633 0.4 700
0.2 789
0.1 836

VALLANCE JONES ET AL.' OPTICAL AND RADAR STUDY OF AURORA 4587
OBSERVEBiRNO ORLOULRTEB ELEOTRON DENSITIES
8 o
z• s , x - T = 60s
o z • • • •
1 • 0
O•
8o •oo xao x•o x6o •8o zoo 8 HEIGHT km
OBSF, RVF, B RNB CF•LCULF•TF, O F, LF, CTRON BF, B$ITIBS
T i 150s
Fig. 10. The markers indicate the observed electron densities replotted from Figure 2. The solid curves are the modelled electron densities derived as indicated in the text from the inferred primary electron spectra. The curves are displaced as for Figure 2.
vation. There,is good agreement between the values based on (T•) and the values derived from R r.
During the early period before T = 60 s the ionization rate profiles were found in a similar way except that the form of the primary spectra was obtained by interpolating the param- eters listed in Table 2.
In the modelling, the ionization rate variation was first cal- culated at 5-km intervals and then used as input to the ion chemistry model to derive the variation of electron con-
centration during the full 150 s of the event. The observed and modelled electron concentration height profiles at 15-s inter- vals are compared in. Figure 10. The initial profile used was the observed profile at T = 0.
It will be seen that the agreement between the predicted and observed profiles is good during the period where the fitted electron spectra could be used and reasonably good during the later period when the auroral intensities were declining. The agreement for T = 60 s is not altogether surprising, since

4588 VALLANCE JONES ET AL..' OPTICAL AND RADAR STUDY OF AURORA
the calculation of n e from qi is effectively an inversion of (3) which was used to derive the g/i from it/e in the first place. However, this is not true for T > 60 s, and in this interval the reasonable agreement shown by Figures 10a and 10b does constitute a good test of the ability of the model to determine the ne(h ) profiles based on the optical data alone.
5. SUMMARY AND CONCLUSIONS
The radar and optical data obtained during a short-lived but bright auroral event at high latitude in the midnight sector poleward of the auroral oval have been studied in detail. From the electron density profiles measured by the radar, height profiles of the ionization rate were calculated and from these energy spectra for the primary electrons were deduced. The mean energy values corresponding to these spectra were compared with the optical data.
The optical data provided absolute values of the ionization rate of N 2 from the first negative N2 + band intensity observed in the magnetic zenith. The ionization rates estimated in this way were approximately twice those deduced from the elec- tron density profiles. No good reason was found for this dis- crepancy, which was tentatively ascribed to the cumulative effect of small errors arising from calibrations, viewing geome- try, atmospheric model, recombination coefficients and rela- tive ionization cross sections.
The optical data also provided values of the ratios, I(6300)/I(4278), I(8446)/I(4278), I(5577)/I(4278) and of the average rotational temperature of the 0, 1 Ne + 4278-/• IN band.
Several theoretical determinations of the variation of pri- mary electron energy with I(6300)/I(4278) were compared, and it was found that this ratio gave estimates of the incident electron energy in good agreement with values obtained from the radar data.
The variation of the mean Nz + rotational temperature •T• with primary particle energy was examined and it was found that the values of •T• predicted from the ionization profiles measured by the radar were in good agreement with the opti- cal measurements of • T•. Conversely, it was shown that opti- cal values of • T• provide a reasonable estimate of the average primary electron energy.
The variation of the ratio I(8446)/I(4278) was compared with the average primary electron energies deduced from R r and • T• and it was concluded that this ratio provides a useful index of values of the incident electron energy •E• with the dependence being expressible by (5).
There was little variation of the ratio I(5577)/I(4278) during the event, and it was concluded that this ratio is not very sensitive to incident electron energy for primary energies in the range observed, i.e., less than 8 keV.
Primary electron energies deduced from the N 2 + rotational temperatures were combined with optical estimates of the total energy input from 1(4278) to provide optically estimated ionization rate profiles during the second phase of the event. These ionization rate profiles were used as input to a detailed ion chemistry calculation of the height profiles of the electron density. The calculated electron density profiles agreed well with the profiles measured by the radar. From this we con- clude that the ion chemistry model gives a satisfactory repre- sentation of the rise and fall of electron density in a short lived auroral event of the kind observed. Ion diffusion and trans-
port effects due to winds or electric fields do not appear to have been important.
Acknowledgments. We wish to acknowledge the indispensible and generous help of the staff of the Sondrestrom Radar Laboratory and in particular of the late Finn Steenstrup. Two of us (A.V.J. and R.L.G.) are grateful for the invitation of SRI International and the Space Physics Research Laboratory of the University of Michigan to use the optical facility at Sonderstrom. Four of us wish to acknowl- edge support through NSF grant ATM-8419806 (J.W.M., P.S.) and the NSF cooperative agreement, grant ATM-8121671 (J.W.M., P.S., V.B.W. and J.K.), which provides funding for the Sonderstrom Radar Laboratory. It is a pleasure to acknowledge the indispensable help of Dale Tyler of NRC in the operation of the NRC photometer. We are also indebted to Denise Cardinal in the plotting of the figures. Thanks are due also to M. H. Rees for providing data on his unpublished theoretical results on the red line ratio. National Research Council of
Canada paper NRCC 26736. The Editor thanks H. R. Anderson and J.-C. G6rard for their assist-
ance in evaluating this paper.
REFERENCES
Arnoldy, R. L., and P. B. Lewis, Correlation of ground-based and topside photometric observations with auroral electron spectra measurements at rocket altitudes, J. Geophys. Res., 82, 5563, 1977.
Christensen, A. B., M. H. Rees, G. J. Romick, and G. G. Sivjee, OI (7774/•) and OI (8446/•) emissions in aurora, J. Geophys. Res., 83, 1421, 1978.
Deehr, C. S., and A. Egeland, Auroral morphology, Ann. Geophys., 28, 415, 1972.
de la Beaujardi•re, O., and R. Vondrak, Chatanika radar observa- tions of the electrostatic potential distribution of an auroral arc, J. Geophys. Res., 87, 797, 1982.
Eather, R. A., Short-period auroral pulsations in ;•6300 OI, J. Geo- phys. Res., 74, 4998, 1969.
Feldman, P. D., Auroral excitation of optical emissions of atomic and molecular oxygen, J. Geophys. Res., 83, 2511, 1978.
Gattinger, R. L., and A. Vallance Jones, The intensity ratios of auro- ral emission features, Ann. Geophys., 28, 91, 1972.
Gattinger, R. L., and A. Vallance Jones, Observations and interpreta- tion of spectra and rapid time variations of type-B aurora, Planet. Space Sci., 27, 169, 1979.
Gattinger, R. L., F. R. Harris, F. Creutzberg, A. Yau, D. J. McEwen, and A. Vallance Jones, Comparison of modelling prediction with ground based multi-station measurements of emission profiles, paper presented at Symposium on Airglow and Auroral Excitation and Models, Int. Assoc. of Geomagn. and Aeron., Prague, 1985a.
Gattinger, R. L., F. R. Harris, and A. Vallance Jones, The height spectrum and mechanism of type-B red aurora and its bearing on the excitation of O(XS) in aurora, Planet. Space Sci., 33, 207, 1985b.
Hecht, J. B., A. B. Christensen, and J. B. Pranke, High resolution auroral observations of the OI (7774) and OI(8446) multiplets, Geo- phys. Res. Lett., 12, 605, 1985.
Hedin, A. E., A revised thermospheric model based on mass spec- trometer and incoherent scatter data: MSIS-83, J. Gephys. Res., 88, 10,170, 1983.
Hilliard, R. L., and G. G. Shepherd, Upper atmosphere temperatures from Doppler line widths, IV, A detailed study using the OI 5577• auroral and nightglow emission, Planet. Space Sci., 14, 383, 1966.
Hunten, D. M., E.G. Rawson, and J. K. Walker, Rapid measurement of N 2 + rotational temperatures in aurora, Can. J. Phys., 41, 258, 1963.
Huuskonen, A., T. Nygr6n, L. Jalonen, and J. Oksman, The effect of electric field-induced vertical convection on the precipitation E- layer, J. Atrnos. Terr. Phys., 46, 927, 1984.
Kasting, J. F., and P. B. Hays, A comparison between N2 + 4278-A emission and electron flux, J. Geophys. Res., 82, 3319, 1977.
McEwen, D. J., and D. A. Bryant, Optical-particle characteristics of pulsating aurora, J. Atrnos. Terr. Phys., 40, 871, 1978.
McEwen, D. J., C. N. Duncan, and R. Montalbetti, Auroral electron energies: Comparisons of in-situ measurements with spec- troscopically inferred energies, Can. J. Phys., 59, 1116, 1981.
Mende, S. B., and R. H., Eather, Spectroscopic determination of the characteristics of precipitating auroral particles, J. Geophys. Res., 80, 3211, 1975.
Omholt, A., Red and near IR auroral spectrum, J. Atrnos. Terr. Phys., 10, 320, 1957.
Rees, M. H., The auroral [OI] 6300/• red line revisited, paper present-

VALLANCE JONES ET AL..' OPTICAL AND RADAR STUDY OF AURORA 4589
ed at Symposium on Airglow and Auroral Excitation and Models, Int. Assoc. of Geomagn. and Aeron., Prague, 1985.
Rees, M. H., and V. J. Abreu, Auroral photometry from the Atmo- spheric Explorer satellite, J. Geophys. Res., 89, 317, 1984.
Rees, M. H., and D. Luckey, Auroral electron energy derived from ratio of spectroscopic emissions, I, Model computations, J. Geo- phys. Res., 79, 5181, 1974.
Rees, M. H., A. I. Stewart, W. E. Sharp, P. B. Hays, R. A. Hoffman, L. H. Brace, J.P. Doering, and W. K. Peterson, Coordinated rocket and satellite measurements of an auroral event, 1, Satellite observa- tions and analysis, J. Geophys. Res, 82, 2250, 1977.
Rees, M. H., B. A. Emery, R. G. Roble, and K. Stamnes, Neutral and ion gas heating by auroral electron precipitation, J. Geophys. Res., 88, 6289, 1983.
Sawchuk, W., and C. D. Anger, Intensity ratio I(5577)/I(3914) in type-B red aurora, Panet. Space Sci., 24, 893, 1976.
Sears, R. D., and R. R. Vondrak, Optical emissions and ionization profiles during an intense pulsating aurora, J. Geophys. Res., 86, 6853, 1981.
Shepherd, M. M., and R. H. Eather, On the determination of auroral electron energies and fluxes from optical spectral measurements, J. Geophys. Res., 81, 1407, 1976.
Vallance Jones, A., Aurora, D. Reidel, Hingham, Mass., 1974. Vallance Jones, A., A model for the excitation of electron aurora and
some applications, Can. J. Phys., 53, 2267, 1975. Vallance Jones, A., and R. L. Gattinger, Indirect excitation processes
in aurora, in Physics and Chemistry of the Upper Atmosphere, edited by B. McCormac, p. 232, D. Reidel, Hingham, Mass., 1973.
Vondrak, R. R., and M. J. Baron, Radar measurements of the latitudi- nal variation of auroral ionization, Radi. Sci., 11, 939, 1976.
Vondrak, R. R., and R. Robinson, Inference of high-latitude ioniza-
tion and conductivity from AE-C measurements of auroral electron fluxes, J. Geophys. Res., 90, 7505, 1985.
Vondrak, R. R., and R. D. Sears, Comparison of incoherent scatter radar and photometric measurements of the energy distribution of auroral electrons, J. Geophys. Res., 83, 1665, 1978.
Wickwar, ¾. B., M. J. Baron, and R. D. Sears, Auroral energy input from energetic electrons and Joule heating at Chatanika, J. Geo- phys. Res., 80, 4364, 1975.
Wickwar, V. B., C. Lathuill•re, W. Kofman, and G. Lejeune, Elevated electron temperatures in the auroral E layer measured with the Chatanika radar, J. Geophys. Res., 86, 4271, 1981.
Wickwar, V. B., J. D. Kelly, O. de la Beaujardi•re, C A. Leger, F. Steenstrup, and C. H. Dawson, Sondrestrom overview, Geophys. Res. Lett., 11, 883, 1984.
Zipf, E. C., N. W. Kao, and P. W. Erdman, On the simultaneous ionization-excitation of the OI(;t834A) resonance transition by elec- tron impact on atomic oxygen, Planet. Space $ci., 33, 1309, 1985.
R. L. Gattinger and A. Vallance Jones, Herzberg Institute of Astro- physics, National Research Council of Canada, Ottawa, Ontario, Canada K1A 0R6.
J. Kelly and V. B. Wickwar, SRI International, Menlo Park, CA 94025.
J. W. Meriwether and P. Shih, Space Physics Research Laboratory, University of Michigan, Ann Arbor, MI 48109.
(Received July 7, 1986; revised December 10, 1986;
accepted December 18, 1986.)