Embed Size (px)
Citation preview

______________________________________________________________
Opportunity to Learn English and Mathematics in Ghanaian Primary
Schools
[A study conducted on behalf of Ghana Education Service, Curriculum Research
and Development Division (CRDD) to facilitate the Basic Education Comprehensive Assessment System (BECAS)]
Mereku, K. D.
Amedahe, F. K.
Etsey, K.
Long, B.
Adu, John
Synder, W. C.
Moore A.
June 27, 2005

1
OPPORTUNITY TO LEARN ENGLISH AND MATHEMATICS IN GHANAIAN PRIMARY SCHOOLS
[Report of a Study Conducted on Behalf of Ghana Education Service, Curriculum Research and Development Division
(CRDD) to Facilitate the Basic Education Comprehensive Assessment System (BECAS)] Dr. K. D. Mereku, Faculty of Science Education, UEW, Winneba
Dr. F. K. Amedahe, Faculty of Education, University of Cape Coast Dr. K. Etsey, Faculty of Education, University of Cape Coast
Abstract The Ghana Basic Education Comprehensive Assessment System (BECAS) is a new assessment system which replaced national tests that were instituted since the 1992 to monitor primary school pupils’ achievement and progress in English and Mathematics. To ensure the new system assesses closely what teachers actually teach, the BECAS Team carried out a survey of the contexts of learning in primary schools to inform the development of a new comprehensive assessment system. The study examined whether or not the opportunities provided in primary schools for learning are good enough to promote learning for all of pupils and assure high levels of outcomes for all pupils.
The study which involved 1,063 teachers sampled from the ten regions of the country was carried out in schools in July 2004. A questionnaire was used to gather data on teachers’ schools, classes taught, location of schools, class size, gender, professional qualifications, instructional resources for teaching English and mathematics, instructional time for teaching English and mathematics, and coverage of content of English and mathematics in teachers’ instruction over the year.
A major finding of the study was that OTL standards for most schools were very low and it was observed that the majority of teachers completed nearly 60% of the content of the mathematics and English syllabuses. The analysis also indicated that there were grave inequalities between schools as well as districts in the following
availability and adequacy of textbooks, availability and adequacy of instructional materials, teachers’ instructional practices and management of instructional time, and teachers’ preparedness to implement the content standards.
These inefficiencies could be attributed to the fact that the curriculum content standards are clearly defined by the syllabuses of the various subjects taught at the basic level, no OTL standards have been set to guide their implementation. It is recommended that CRDD should be made to set OTL standards that will assure a high level of achievement for all pupils. That is, state the indicators that will assure a fair and appropriate provision of inputs and processes in basic schools. Also teacher education programmes should ensure that teachers are not only exposed sufficiently to OTL standards but also the strategies that they can be adopted to ensure such standards are maintained and improved.

2
Introduction Five years after the Educational Reform Programme was initiated in 1987, a national test,
designated Criterion Referenced Test (CRT) was instituted to assess Primary 6 pupils’
achievement in English and Mathematics. Despite the fact that the CRT was a quality
assurance measure, it was instituted principally to ensure whether or not the processes and
inputs introduced during the educational reforms were helping to improve the quality of
education (CRDD, 2001). The USAID assisted the Ministry of Education in the
development and administration of the CRT from 1992 to 1999. Though the CRT indicated
that less than 10 percent of the pupils are reaching mastery and the performance in both
English and Mathematics has been rising slowly but steadily beginning from the base year
of 1992, it could not provide enough information to assess the effectiveness of the
processes and inputs introduced during the educational reforms.
It has been observed that pupils perform best on tests that assess subject matter content
which pupils have had the opportunity to learn (Gamoran, Porter, Smithson, and White,
1997; Robitaille, et al, 1994). Though supported time and again by research, this
observation is little more than common sense. In connection with assessment, Winfield
(1987:438) notes that opportunity to learn relates to "the provision of adequate and timely
instruction of specific content and skills prior to taking a test". She adds that opportunity to
learn may be measured by "time spent in reviewing, practicing, or applying a particular
concept or by the amount and depth of content covered with particular groups of students"
(p. 439).
One the major limitation of the CRT was that the test coverage exceeded the realities of the
classroom. Items for the CRT covered the entire curriculum (syllabus) for Primary 6 and
outcomes pupils attained were compared with the entire intended curriculum, even though a
substantial proportion of the content prescribed in the syllabus could not be implemented
under the conditions that prevailed in schools. Though curriculum standards in the various
Ghanaian primary school subjects are clearly defined by syllabuses designed by CRDD,

3
little is said about the processes and inputs required for their attainment. That is, the
curriculum standards we currently have in this country are silent over the opportunities to
learn that must be provided to promote high level of achievement for all pupils.
Opportunity To Learn (OTL) Standards
Opportunity to learn refers to equitable conditions or circumstances within the school or
classroom that promotes learning for all students (Porter, 1993). It includes provision of
curricula, teaching/learning material, facilities, teachers, and instructional experiences that
enable students to achieve high standards. The term also refers to absence of barriers that
prevent learning.
Delivery of educational opportunities (defined by the national curriculum and high
expectations of student outcomes) includes a number of inputs and processes. OTL
standards are in fact indicators that will assure a fair and appropriate provision of these
inputs and processes. Since views about the specifics of or the use of standards differ from
one educational system to another, it is impossible to state a universal definition of OTL
standards. It can be defined as the criteria for, and the basis of assessing the sufficiency or
quality of the resources, practices, and conditions necessary at each level of the education
system to provide all students with the opportunity to learn the material in national
curriculum (Ysseldyke, Thurlow, and Shin, 1995).
OTL standards differ from country to country and depend on nature of a nation’s economy
and educational policies. But within the same nation when OTL standards are defined
differently, indices of OTL in different schools, districts, or regions cannot be compared.
There is therefore a need for consensus on ‘what should constitute opportunity to learn’ for
the primary school pupil in this country that will be comparable across districts and regions
of the country. OTL standards are usually set around the following areas:
Resource Standards to assure that all schools have sufficient resources to deliver
high level of curriculum content and to achieve higher levels of outcomes for all
students;
4
Curriculum Delivery Standards to assure high levels of curriculum delivery to all
students;
Outcome and Capacity Building Standards to assure that all schools have the
continued capacity to deliver quality education and are evaluated by their delivery
of quality educational opportunities to all students.
In the present study however, some aspects of the resource and curriculum delivery
standards were considered. Indicators of the aspects considered include
Teachers’ coverage of the curriculum content in English and mathematics;
Teachers’ emphasis in the national curriculum content in English and mathematics
Availability of teaching/learning materials and technology;
Teachers’ content emphasis for individual students or groups of students (i.e.
whether or not the content is differentiated to ensure each student achieves his/her
highest potential);
Teachers’ preparedness to implement the content of the curriculum in English and
mathematics - knowledge of subject matter content and pedagogy (e.g., subject
credentials, certification, professional experiences).
Studies on Opportunity to learn and teachers’ content coverage
Ysseldyke, Thurlow, and Shin (1995) recommend the use of the following indicators in
measuring the extent to which OTL standards are met.
i. The amount of time that students spend in school - Determining the school day and
total time in the year that students spend in school. The amount of time allocated to
instruction - This would be done as an index of OTL, since a considerable amount
of time that students are in school may be spent in non-instructional activities.
Minutes or hours of academic content that students are taking is another way to
measure allocated time. These can be ascertained from the syllabus and timetable.
ii. Counting the amount of money spent on providing instruction - This could be the
overall school budget, per-pupil expenditure, teacher salaries, or other similar
measures.

5
iii. Information on teachers’ coverage of the curriculum - Interviews and/or daily logs
can be used to gather information on how well the curriculum is covered. For
example, content coverage is indicated by topics covered in each class period and by
the amount of emphasis placed on each topic. This information also will indicate the
modes of instruction, the types of student activities, and the types of instructional
materials that were used.
According to Porter et al. (1979), ‘content coverage’, can be distinguished into ‘content
covered’ and ‘content emphasised’. The first -content covered - refers to actual counts
made of concepts introduced or the range of content (or skills) actually taught (McDonald,
1976). Measures of content emphasised identified in the literature includes such proxies for
content coverage as time allocated to content, textbook length or number of pages in
textbook devoted to concept or topic (Good et al. 1978; Barr, 1987; Freeman and Porter
1989).
Many investigators of content coverage have been concerned with “the influence of the
curriculum on learners’ opportunities to learn concepts measured by achievement tests”
(Barr, 1987). Most of the studies in content coverage have treated coverage as a condition
that acts upon learning autonomously. In these studies, the researchers were concerned with
the influence of content coverage (which is analogous to ‘opportunity to learn’) on learners’
achievement. Other researchers have considered coverage as a reflection of a complex set
of instructional components that jointly affect learning. The empirical literature on content
coverage can be separated into two main strands. One explored the influence of content
coverage on learners’ achievement and the other were studies which have been concerned
with content coverage as part of a complex instructional component that influences the
whole curriculum. In both strands similar methods have been used to estimate the extent of
coverage.
Studies in curriculum delivery standards and pupils’ achievement
In the first International Association for the Evaluation of Educational Achievement (IEA)
study of mathematics achievement (Husen, 1967), teachers from 12 participating nations

6
were asked to judge whether they had promoted the learning of (that is, whether their
students had had the opportunity to learn) the content exemplified by each test item. IEA
studies have found a substantial relationship between teachers’ reported content coverage
(i.e. opportunity to learn) and students’ mathematics achievement (TIMSS, 2004; Mullis, et.
al., 2000).
Studies have shown that strong correlations exist between student OTL scores and mean
student achievement scores in mathematics (Husen, 1967; Schmidt). Baratz-Snowden
(1993) asserts that if students are held accountable for their learning, schools must be held
accountable simultaneously for providing students with the opportunity to learn to meet the
standards. Winters, et. al., (1994) stated further that opportunity to learn (OTL) often
serves as part of the evidence for alternative interpretation of student performance.
International summaries of research on relationship between content coverage and
achievement demonstrate that students learn the content of the curriculum they are taught;
the more they are taught, the more they learn (Oxenham, 1992). Lockheed and Verspoor
(1990) reported that most nations have closer to 40 per cent of their teaching time devoted
to the national language and 20 per cent to mathematics. In this vein, Oakes (1989), and
Porter (1991) recommended that school administrators, teachers, and policy makers should
not judge test results without considering and analyzing students’ opportunity to learn
(OTL).
Studies in national curriculum in Ghana
No study in Ghana has looked fully at the curriculum delivery standards. Only two studies
have examined aspects of the standards. One was a study commissioned by the Ghana
Ministry of Education in 1993 to examine and analyze the primary school official
curriculum materials – syllabuses, pupils’ textbooks and teacher’s guides. The study
reported that mathematics teaching in basic schools focuses on computation skills, learning
of formulas, rote practice and teaching as telling. The study also reported that the vast
majority of Ghanaian children are growing up functionally illiterate in both their native
language and in English. The principal investigator in this study, Kraft (1994), attributed

7
these unfortunate developments to the poor nature of curriculum, including syllabi,
textbooks and teachers’ handbooks, used in the nation’s schools. He argued that the current syllabi, textbooks and teachers’ handbooks do not meet the highest international standards, nor the current best thinking on sequence, learning and pedagogy and will not prepare Ghanaian students for the needs of the next century (Kraft:2).
The second study was TIMSS-2003, which was the third in a series of studies undertaken
once every four years by the International Association for the Evaluation of Educational
Achievement (IEA). The performance of the junior secondary school form 2 (JSS2)
students in the TIMSS was unsurprisingly very poor because of the nature of mathematics
students are made to experience at school in this country (Anamuah-Mensah, et al, 2004).
Analyses of the students’ performance on the TIMSS mathematics test items show that the
few (about 15%) items for which most students were able to make correct responses were
those that were testing knowledge of facts and procedures. They performed poorly on items
that tested their ability to use concepts, solve non-routine problems and reason
mathematically.
Analysis of the TIMSS data on the context for learning mathematics in Ghanaian schools
indicate students have little opportunity to engage in activities that will enable them to use
concepts, solve non-routine problems and reason mathematically (Mullis, et. al., 2004).
Anamuah-Mensah, et al (2004) observed that only 42 percent of Ghanaian JSS mathematics
teachers used the mathematics textbooks as the main basis for mathematics lessons while
54 percent used it as a supplementary resource. Thus, the textbooks were used mainly by
Ghanaian teachers as a supplement to other materials that teachers may have in their
possession. This was not the case in most of the high performing countries such as
Singapore, Korea and Japan, where the textbooks were the primary materials used in
teaching the subject. In Ghana, the textbooks were used mainly as a supplementary resource
because they are obsolete and do not align with the current syllabuses in school.
Rationale for the study
An Opportunity to Learn study was included in the planning of the Ghana Basic Education
Comprehensive Assessment System (BECAS) to provide essential information that will
ensure the quality of the assessments and the ethics of testing what is actually taught.

8
Articulation between curriculum, instruction, and assessment is important. To ensure this,
clear OTL standards should be set. The OTL study will guide the BECAS Senior Advisory
Group (SAG) in framing its policy directives about OTL standards that will address the
following
Curricula, instructional materials, and technologies
Teacher capability and continuous professional development
Curriculum delivery process - instructional practices and
Non-discriminatory policies - curricula, and instructional practices for special needs
Other factors that help students receive a fair opportunity to achieve the knowledge
and skills in the content standards
Finally information from the OTL study will guide the development of the new NEA to
make it assess performances on what is actually taught, as well as document what aspects of
the curriculum go unlearned and/or untaught.
Purpose of the study
In order to come out with a comprehensive assessment system that can ensure all primary
school pupils do reasonably well or do not feel failures, it is necessary to consider the OTL
provided in the primary schools. It is necessary to know whether or not the opportunities
provided in primary schools for learning are good enough to promote learning for all of
pupils and assure high levels of outcomes for all pupils.
The purpose of the study was to find out
teachers’ preparedness to implement the content of the national curriculum in
English and mathematics
the adequacy and availability of resources provided for the delivery of the
national curriculum content in English and mathematics;
how well the instructional times for teaching English and mathematics were
managed;

9
extent of teachers’ coverage of the national curriculum content in English and
mathematics
extent of teachers’ emphasis in the national curriculum content in English and
mathematics
teachers’ content emphasis for individual students or groups of students (i.e.
whether or not the content is differentiated to ensure each student achieves
his/her highest potential);
The study did not cover all aspects of OTL for Ghanaian schools.
Methodology
Population and Sample
The population for the study consisted of all teachers teaching primary schools in the
country. That is, all trained and untrained teachers teaching in classes in primary schools.
The use of opportunity sample of schools instead of a random selection enabled information
on teachers’ delivery of the curriculum to be collected to provide contextual data that could
be used to explain students’ performance in the BECAS tests that will be conducted in July
2005. Opportunity sample comprised schools located in towns and villages where students
from the University of Education, Winneba, who volunteered to undertake the study, had
their long vacation holidays.
Instrument
A questionnaire was designed by a team of consultants who were teacher educators. The
instrument was pre-tested to ensure suitability of language, flow and length. A copy of the
questionnaire can be seen in Appendix A. The questionnaire was designed to provide
information on teacher’s school, classes taught, class size, gender, professional
qualification, instructional resources for teaching English and mathematics, instructional
time for teaching English and mathematics, and coverage of content of English and
mathematics in teachers instruction over the year. The questionnaire included items

10
structured to elicit dichotomous responses along a two-point scale – taught or not taught - to
indicate whether the teacher had done more than a week’s teaching or a week or less
teaching on units in the English and mathematics syllabuses. These items were intended to
provide information on teacher’s coverage of topic/units and emphasis on content domains
in the official primary mathematics and English curricula. The questionnaire took the
teachers about 30 minutes to complete.
Data collection and analyses
Prior to commencement of the data collection, all the students who volunteered to
administer the instruments were briefed on the project requirements and were thoroughly
trained to use the questionnaire. In all 110 students at the University of Education,
Winneba, volunteered to administer the questionnaire. Each student visited 2 schools. That
is, each student was able to interview 12 teachers and completed a questionnaire for each
teacher interviewed. About 80% of the questionnaires were returned. The data obtained
were keyed onto the computer and the SPSS application package was used to do the
analysis.
Analysis of findings
Introduction
The study involved 1,063 teachers of which 44.1% were male and 55.9 were female. The
teachers who participated in the study were taken from the six primary classes in schools in
the ten regions across the country. Table 1 is the distribution of teachers by region and by
gender. The table shows that the study covered the whole country and the sample was very
fair with gender of teachers that participated. The representation of regions was also fair.
The proportion of teachers taken in each region ranged between 4.5 and 12.1 percent.
Table 1 Distribution of teachers by region and by gender
Region Male Female Total Percent
Ashanti 42 86 129 12.1 Brong Ahafo 71 49 120 11.3 Central 47 63 110 10.3

11
Eastern 50 67 117 11.0 Greater Accra 26 106 132 12.4 Northern 82 26 108 10.2 Upper East 16 32 48 4.5 Upper West 43 41 84 7.9 Volta 45 76 122 11.5 Western 46 47 93 8.7 Total 468 593 1063 100.0
Table 2 is the distribution of teachers by region and by class they taught. There was fair
representation of each primary class (Primary 1 to 6) that was involved in the study. The
number of each primary school class in the study ranged between 161 and 190.
Table 2 Distribution of teachers by region and by classes they taught
Number of teachers
Region Primary
1 Primary
2 Primary
3 Primary
4 Primary
5 Primary
6 Total* Ashanti 23 22 22 18 21 21 127 Brong Ahafo 24 24 24 24 24 24 144 Central 29 17 11 21 12 12 102 Eastern 24 25 25 21 25 20 140 Greater Accra 28 28 28 16 28 25 153 Northern 17 17 17 17 16 17 101 Upper East 6 6 6 6 6 6 36 Upper West 14 14 14 14 13 13 82 Volta 25 23 23 24 23 24 142 Total 190 176 170 161 168 162 1027
*Note Classes of 36 teachers were not indicated
Teachers’ preparedness to implement the content of the curriculum in English and mathematics One of the indicators of OTL standards is teachers’ preparedness to implement the
curriculum content. This standard can be measured in terms of the teachers’ knowledge of
subject matter content and pedagogy, which often depends on the teachers subject,
credentials, certification, and professional experiences. In this study, the teachers’
preparedness to implement the curriculum content was measured in terms of their teaching
qualifications.

12
The study involved teachers with four categories of teaching qualification – untrained;
certificate A; diploma and B.Ed degree. Table 3 shows the number and proportion of
teachers with each teaching qualifications
Table 3 Distribution of teachers by region and by gender
Qualification Untrained Certificate A Diploma B.Ed degree
Number of teachers 130 892 27 11 Percent 12.3 84.2 2.5 1.0
The majority of teachers trained to teach at the primary level in Ghana took pre-service
education programmes that led ‘Certificate A’ qualifications. The initial training of primary
school teachers in Ghana was done at two levels: the post-middle (or junior-secondary)
level; and the post senior-secondary level. Even though programmes offered at both levels
led to equivalent qualifications (i.e. Teacher's Certificate 'A'), the first was a four-year
programme while the other was, and still is, a three-year programme. The four-year college
progamme was phased out in 1991 and all colleges are now running the 3-year post-
secondary programme. Since the expectation of the designers of these Teachers’ Certificate
'A' programmes, was to educate teachers whose academic attainment would be equivalent
to that of O-level General Certificate of Education (GCE), the programmes placed more
emphasis on subject content at the expense of pedagogy. Thus the academic qualification of
most Ghanaian primary school teachers is low.
The study had shown that 84 percent of the primary school teachers involved in the study
had such low teaching qualifications and a substantial proportion (12.3%) was not at all
trained. It can be argued in this regard that the preparedness of the majority of teachers to
implement the content of the curriculum in English and mathematics is low and therefore
there is an urgent need to increase school-based in-service education activities to support
these teachers.
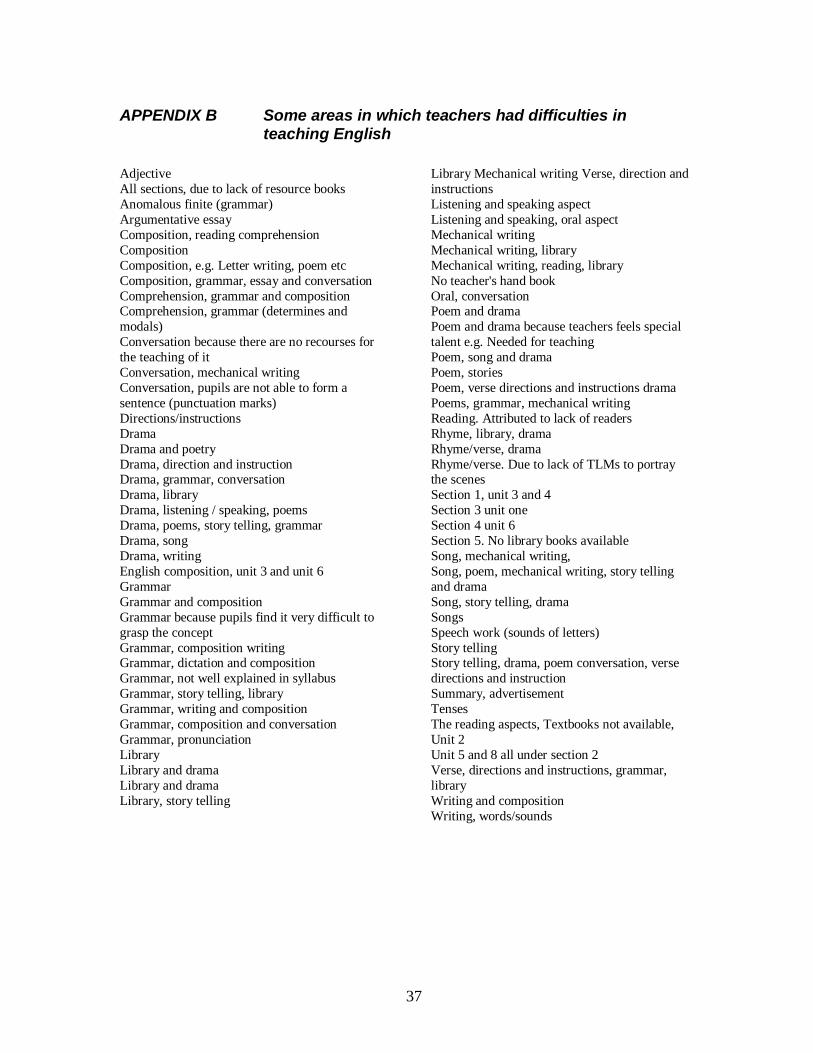
The study also examined teachers’ preparedness to implement the content of the curriculum
by looking at difficulties they encountered in teaching the topics in English and
Mathematics. In teaching English language, 21 percent of the teachers indicated that they

13
had difficulties in teaching certain topics or aspects of the syllabus. Below are some of the
areas in which teachers had difficulties in teaching English.
Adjective All sections, due to lack of resource books Anomalous finite (grammar) Argumentative essay Comprehension, grammar (determines and modals) Conversation because there are no recourses for the teaching of it Conversation, mechanical writing Directions/instructions Drama and poetry Drama, listening / speaking, poems Grammar because pupils find it very difficult to grasp the concept Grammar, not well explained in syllabus Grammar, story telling, library
Library Library and drama Listening and speaking aspect Listening and speaking, oral aspect Mechanical writing No teacher's hand book Poem, song and drama Reading. Attributed to lack of readers Rhyme/verse. Due to lack of TLMs to portray the scenes Song, story telling, drama Songs Speech work (sounds of letters) Story telling The reading aspects, Textbooks not available
In teaching Mathematics, 34 percent of the teachers indicated that they had difficulties in
teaching certain topics of the syllabus. That is, more teachers had difficulties in teaching
mathematics than English. Below are some of the areas in which teachers had difficulties in
teaching mathematics.
Areas and length Capacity and volume measurement of weight Chance Collecting and handling data 1 and 2 Collecting and handling data, chance Decimal, fractions, percentage, ratio and proportion Decimal, fractions, percentage Division and fraction Drawing geometric figures, measurement, length, capacity etc Fractions and decimals Geometric figures in space Graphs, Integers, decimal fractions Integers, graphs ratio proportion, movement Integers, the number plane
Investigation with numbers Length, mass and capacity, area and volume Long division and decimals Number plane, investigation with numbers Numbers + numerals 0 - 10,000 Operations on fraction, decimal fractions and percentages Ratio, Rational numbers (3) Shapes, space. Measurement of weight time and money Story problem forms of questions are difficult for children. They cannot read and interpret Syllabus is different from textbook What are the chances? Topics in the syllabus do not tally with textbooks hence difficulty
In spite of the fact that most teachers have little or no teaching qualifications and for that
matter know little about the pedagogy for teaching many of the topics, units or aspects of
14
the syllabuses, it was obvious in their comments that their difficulties had been made worse
by the lack textbooks that match the contents of the syllabuses. The full list of areas in
which teachers had difficulties in teaching mathematics can be seen at Appendix C.
The adequacy and availability of resources for delivery
As observed above, the delivery of educational opportunities defined by the national
curriculum includes a number of inputs and processes. The study also sought to determine
the current resource standards, that is, whether or not schools have sufficient resources to
deliver high level of curriculum content and to achieve higher levels of outcomes for all
students.
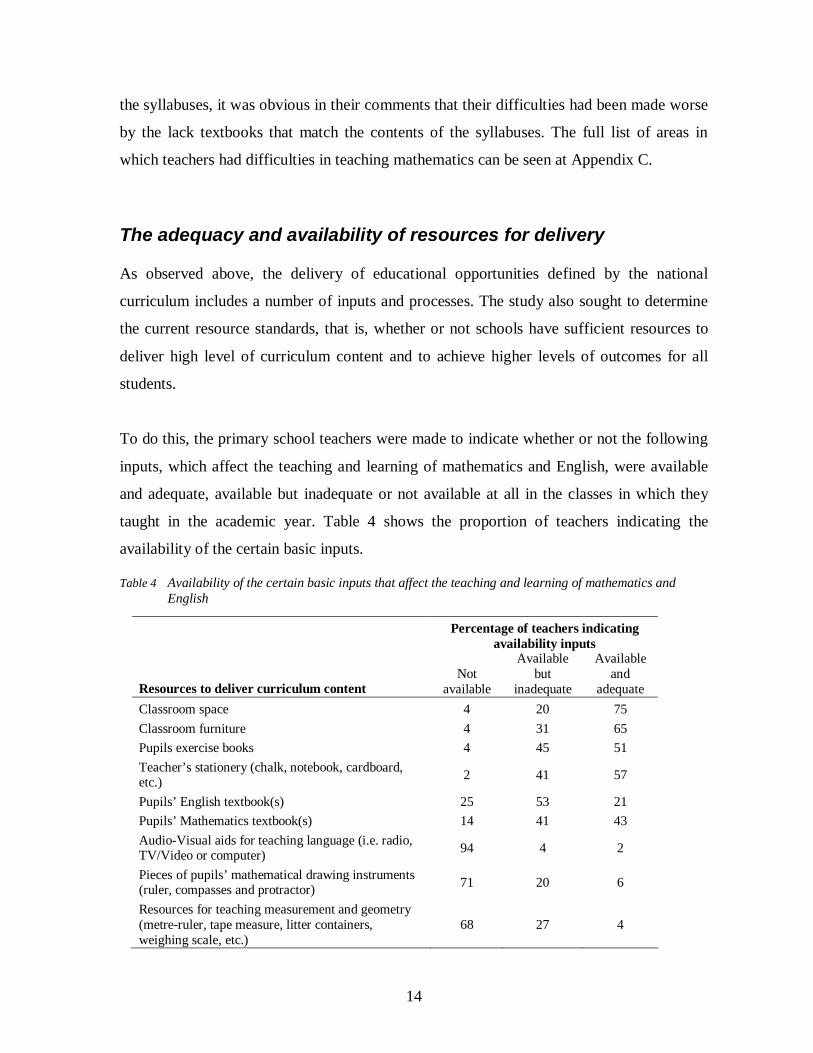
To do this, the primary school teachers were made to indicate whether or not the following
inputs, which affect the teaching and learning of mathematics and English, were available
and adequate, available but inadequate or not available at all in the classes in which they
taught in the academic year. Table 4 shows the proportion of teachers indicating the
availability of the certain basic inputs.
Table 4 Availability of the certain basic inputs that affect the teaching and learning of mathematics and English
Percentage of teachers indicating availability inputs
Resources to deliver curriculum content Not
available
Available but
inadequate
Available and
adequate Classroom space 4 20 75 Classroom furniture 4 31 65 Pupils exercise books 4 45 51 Teacher’s stationery (chalk, notebook, cardboard, etc.) 2 41 57
Pupils’ English textbook(s) 25 53 21 Pupils’ Mathematics textbook(s) 14 41 43 Audio-Visual aids for teaching language (i.e. radio, TV/Video or computer) 94 4 2
Pieces of pupils’ mathematical drawing instruments (ruler, compasses and protractor) 71 20 6
Resources for teaching measurement and geometry (metre-ruler, tape measure, litter containers, weighing scale, etc.)
68 27 4

15
It is interesting to note from Table 3 that 4 percent of the teachers were teaching pupils in
structures that were not originally constructed as classrooms and their pupils were without
classroom furniture. It can be observed from the table that 24 percent of pupils have no
adequate classroom space and 35 per cent have no adequate classroom furniture. The
assistant researchers (i.e. the questionnaire administrators) observed that some children sat
on stools they have brought from home and some on boards resting on blocks. More than
40 percent of the pupils do not have enough exercise books to do their class exercises and
about 50 percent of the teachers do not have enough stationery (chalk, notebook, manila
card, cardboard, etc.) for teaching their daily lessons.
It was found that 80 percent of the teachers owned copies of the mathematics and English
syllabuses. But interestingly, half of the 20 percent which did not own copies indicated that
they had access to them only at weekends when preparing their lesson notes, and the other
half had them whenever they wanted them in the week.
It was also observed that though the textbooks1 currently in use in the nation’s primary
schools for teaching English and mathematics were published over a decade ago, there was
inadequate or little supplies of these books in over half of the schools involved in the study.
Only 21 percent of the teachers indicated that pupils’ English textbooks were available and
adequate while 43 percent indicated that pupils’ mathematics textbooks were available and
adequate.
Majority of the teachers (70%) indicated that measurement and mathematical drawing
instruments such as tapes, litre-containers, weighing scales, rulers, compasses and
protractors were not available in their schools for teaching topics in measurement and
geometry. Audio-Visual aids for teaching language (i.e. radios, TV/Videos or computers)
were found in the schools of only 2 percent of the teachers and 95 percent of them did not
have these in their schools.
The schools do not have sufficient resources to deliver high level of curriculum content and
also to achieve higher levels of outcomes for all students. It can be argued in this light that
the environment for learning mathematics and English for many Ghanaian pupils is not 1 Ghana Mathematics Series: Primary Schools Pupil’s Books 1 – 6, published in 1987 by CRDD.
An English course for Ghana: Pupil’s Books 1 – 6, published in 1988 by CRDD.

16
conducive for teachers to deliver their best and help pupils to achieve their highest
potentials.
Management of instructional time
Primary schools in Ghana begin work at 08.00 hrs and finish at 13.30 hrs. The amount of
time that pupils spend in school each school day is 5 hours since there are two breaks that
last 30 minutes each. The total time expected to be spent in school for the 40 weeks in an
academic year is 1,000 hours. But much of this time is not achieved by the pupils because
lessons in many schools do not start early. Some of the reasons for not starting lessons on
time are pupils stay far away from school and are always late administration work (head teacher) and also stays far from school due to the shift system because transition from morning to afternoon becomes difficult I travel a long way to school and transport is difficult to get in this area most pupils come from villages and on market days some pupils send food stuffs to the market
before coming to school pupils come from surrounding villages hence come late pupils come to school late during the afternoon section some children come from far village some of the children come to school late teachers stays far away from town school is situated tidying up of the compound eats into the time for the first lesson transportation problems
The instructional time was also often interrupted with co-curricular (or planned non-
instructional) activities like, school worship, cleaning compound and classrooms,
gardening, practicing sports for athletics meetings, practicing matching and cultural
activities, just to mention a few.
The amount of time allocated to teaching mathematics and English is stated in the teaching
syllabuses as ten periods a week for each subject, each period lasting 30 minutes. The two
subjects together take 40 percent of the instructional time each day. But many very often a
considerable amount of this time that pupils are expected to be learning these subjects is
spent on some of the non-instructional activities mentioned above.
To ascertain if pupils were fully engaged during the time allocated to teaching mathematics
and English, the teachers were asked to indicate whether or not they followed the suggested
timetable when teaching or taught all subjects on the time table each day. More than half of
the teachers (53%) indicated they followed the timetable, but as many as 47 percent did not

17
rigidly follow it. Several reasons were given for not following the. Some interesting ones
are as follows: we usually miss the first periods activities like sports, culture, and grounds works, disrupt the timetable as non-detached head teacher, I combine classroom work with administrative work children are slow learners and slow in writing class size too large to be able to teach all subjects contact hours not enough difficult to plan/teach all the subjects due to morning worship, and sometimes visits by educational heads etc. Ghanaian language for instance cannot be taught because I'm not good at that (i.e. Fante) lack of textbooks on subjects like music pupils can't finish exercise on time marking of pupils exercises and corrections take some of the teaching time. teaches multiple of classes, i.e. P4, P5 and P6 the children are slow in understanding concept time table is loaded. Uses Physical Education periods in teaching other subject like mathematics
Teachers’ coverage of the curriculum content of English and Mathematics To determine the extent teachers’ coverage of the curriculum content of English and
Mathematics they were made to indicate the proportion of the syllabuses they were likely to
complete by the end of the academic year. They were also made to provide information on
their coverage of the curriculum by indicating whether or not they taught topics, units or
sections in the syllabuses. They were asked to reflect on their prepared schemes of work
and what they actually taught in the year to indicate the topics, units or sections in the
syllabuses that were taught in the year. They also gave brief reasons why topics, units or
sections in the syllabuses were not taught in the year.
Teachers’ coverage of the curriculum content of English Table 5 shows the proportions of curriculum content of the English syllabus covered by all
the teachers.
Table 5 Proportion of English syllabus covered by teachers by class
Number and percentage of teachers Primary
1 Primary
2 Primary
3 Primary
4 Primary
5 Primary
6 Total % Cumulative
Total Below 40% 1 1 1 3 0.3%

18
.6% .6% .6% .3% 55 47 47 44 58 47 298
40% to 50% 28.9% 26.7% 27.8% 27.3% 34.7% 29.0% 29.1%
29.4%
17 11 15 12 13 8 76 51% to 60%
8.9% 6.3% 8.9% 7.5% 7.8% 4.9% 7.4% 36.8%
33 25 21 23 21 21 144 61% to 70%
17.4% 14.2% 12.4% 14.3% 12.6% 13.0% 14.0% 50.8%
46 55 47 50 41 40 279 71% to 80%
24.2% 31.3% 27.8% 31.1% 24.6% 24.7% 27.2% 78.0%
7 5 4 6 6 6 34 81% to 90%
3.7% 2.8% 2.4% 3.7% 3.6% 3.7% 3.3% 81.4%
32 32 35 25 28 39 191 91% to 100%
16.8% 18.2% 20.7% 15.5% 16.8% 24.1% 18.7% 100.0%
190 176 169 161 167 162 1025 Total
100.0% 100.0% 100.0% 100.0% 100.0% 100.0% 100.0%
About 30 percent of the teachers indicated that they were able to cover half of the English
syllabus content and 19 percent indicated that they were able to cover all the content. That
is, only about 20 percent completed the syllabus, the majority were able to cover up to 80%
of the content of the English syllabus. The information the teachers provided on topics in
the English syllabus was further examined to expose content areas that were not taught by
many teachers. Table 5 shows the proportion of teachers indicating topics that were not
taught. Note that in the table proportions of topics not taught that were lower than 5 percent
were ignored.
Table 6 Proportion of teachers indicating topic was not taught in English lessons
Percentage* of teachers indicating section/unit was not taught Sections/units of English
Primary 1
Primary 2
Primary 3
Primary 4
Primary 5
Primary 6
English Content Domain 1: Comprehension/Reading Reading/Pre-reading Conversation Library 35.2 28.9 23.3 20.9 12.1 14.4 English Content Domain 2: Writing/Composition Mechanical writing 9.5 11.6 15.6 Composition Spelling Dictation 6 6 English Content Domain 3: Oral Language (listening and speaking) Story telling 4.8 5.8 7.7 8.3 6.1 6.4 Drama 16 26 20.5 29.4 22.1 23.1 Conversation

19
Poem 11.4 14 8.8 Rhyme Verse, directions, instructions
7.1 13.3 12.7 10.1
Song 8.0 14.4 15.2 19.5 20.8 English Content Domain 4: Language Item (grammar and structure) Conversation 6.4 4.3 4.0 Grammar
*Note Proportions of topics not taught that were lower than 5 percent were ignored.
The table shows the following topics were not taught by many of the teachers: library, story telling, drama, song,
mechanical writing, poem verse, directions and instructions
Teachers’ coverage of the curriculum content of Mathematics Table 7 shows the proportions of curriculum content of the mathematics syllabus covered
by all the teachers.
Table 7 Proportion of mathematics syllabus content covered by teachers by class
Number and percentage of teachers Primary 1 Primary 2 Primary 3 Primary 4 Primary 5 Primary 6 Total
% Cumulative
Total 1 1 2
Below 40% .6% .6% .2%
.2
57 55 51 52 54 52 321 40% to 50%
30.2% 31.3% 30.0% 32.3% 32.3% 32.3% 31.3% 31.5
10 4 10 10 5 9 48 51% to 60%
5.3% 2.3% 5.9% 6.2% 3.0% 5.6% 4.7% 36.2
28 19 23 18 26 12 126 61% to 70%
14.8% 10.8% 13.5% 11.2% 15.6% 7.5% 12.3% 48.5
42 48 46 43 41 37 257 71% to 80%
22.2% 27.3% 27.1% 26.7% 24.6% 23.0% 25.1% 73.6
11 11 8 5 10 6 51 81% to 90%
5.8% 6.3% 4.7% 3.1% 6.0% 3.7% 5.0% 78.6
41 39 32 32 31 44 219 91% to 100%
21.7% 22.2% 18.8% 19.9% 18.6% 27.3% 21.4% 100
189 176 170 161 167 161 1024 Total
100.0% 100.0% 100.0% 100.0% 100.0% 100.0% 100.0%

20
In mathematics the coverage was very similar to that of English. About 31 percent of the
teachers indicated that they were able to cover only half of the mathematics syllabus
content and 21 percent indicated that they were able to cover all the content. That is, only
about 20 percent completed the mathematics syllabus, the majority were able to cover up to
nearly 80% of the content of the mathematics syllabus.
To find out which content areas that were least covered, the information the teachers
provided on topics in the mathematics syllabus was further examined to expose content
areas that were not taught by many teachers. Table 8 shows the proportion of teachers
indicating topics that were not taught. Note that in the table proportions of topics not taught
that were lower than 5 percent were ignored.
Table 8 Proportion of teachers indicating topic was not taught in mathematics lessons
Percentage of teachers indicating topic was not taught
Topics in Mathematics Primary
1 Primary
2 Primary
3 Primary
4 Primary
5 Primary
6 Mathematics Content Domain 1: Number and Numerals Counting objects Groups of objects Ten and ones Sets of numbers Numbers and numerals Concept of fractions Decimals and percentages Mathematics Content Domain 2: Number operations and algebra Addition and subtraction Multiplication Division 20.6 Decimals and percentage 11.1 Operations on fractions 14.8 12.6 Ratio and proportion 17.6 Investigations with numbers 28.7 33.6 23.0 Mathematics Content Domain 3: Measurement Length, capacity and mass 24.2 19.6 Time and money 17.4 30.4 Capacity and mass 23.1 Length and area 13.2
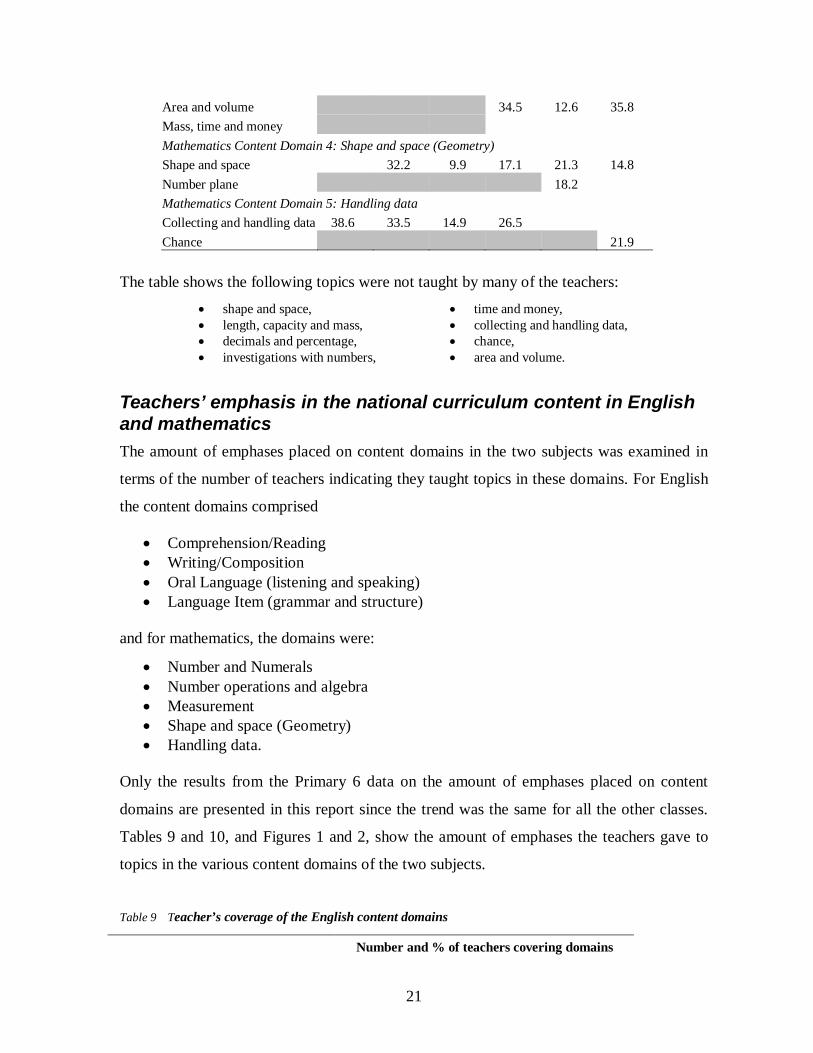
21
Area and volume 34.5 12.6 35.8 Mass, time and money Mathematics Content Domain 4: Shape and space (Geometry) Shape and space 32.2 9.9 17.1 21.3 14.8 Number plane 18.2 Mathematics Content Domain 5: Handling data Collecting and handling data 38.6 33.5 14.9 26.5 Chance 21.9
The table shows the following topics were not taught by many of the teachers:
shape and space, length, capacity and mass, decimals and percentage, investigations with numbers,
time and money, collecting and handling data, chance, area and volume.
Teachers’ emphasis in the national curriculum content in English and mathematics The amount of emphases placed on content domains in the two subjects was examined in
terms of the number of teachers indicating they taught topics in these domains. For English
the content domains comprised
Comprehension/Reading Writing/Composition Oral Language (listening and speaking) Language Item (grammar and structure)
and for mathematics, the domains were:
Number and Numerals Number operations and algebra Measurement Shape and space (Geometry) Handling data.
Only the results from the Primary 6 data on the amount of emphases placed on content
domains are presented in this report since the trend was the same for all the other classes.
Tables 9 and 10, and Figures 1 and 2, show the amount of emphases the teachers gave to
topics in the various content domains of the two subjects.
Table 9 Teacher’s coverage of the English content domains
Number and % of teachers covering domains

22
Content domain
Not adequately
covered Percent Adequately
covered Percent Comprehension/Reading 22 13% 146 87% Writing/Composition 26 15% 142 85% Oral Language (listening and speaking) 71 42% 97 58% Language Item (Grammar) 20 12% 148 88% It is clearer from Figure 1 that the teachers gave equal attention to comprehension/reading,
writing/composition and language item (grammar and structure). But nearly half of them
did not give adequate attention to units in oral language (listening and speaking).
0
20
40
60
80
100
120
140
160
num
ber o
f tea
cher
s
Com
preh
ensi
on/R
eadi
ng
Writ
ing/
Com
posi
tion
Ora
l Lan
guag
e (li
sten
ing
and
spea
king
)
Lang
uage
Item
(Gra
mm
ar)
Not adequately coveredAdequately covered
Figure 1 Teacher’s coverage of the English content domains
Table 10 Teacher’s coverage of the Mathematics content domains
Number and % of teachers covering domains Content domain Not Percent Adequately Percent

23
adequately covered
covered
Number and Numerals 2 1% 161 99% Number operations and algebra 69 42% 94 58% Measurement 56 34% 107 66% Shape and space (Geometry) 16 10% 146 90% Handling data. 57 35% 106 65%
In mathematics, almost all teachers teach topics in number and numeral as well as shape
and space. It is clearer from Figure 2 that a substantial proportion of teachers gave little
attention to the other content domains – operations/algebra, measurement and handling
data.
0
20
40
60
80
100
120
140
160
180
num
ber o
f tea
cher
s
Num
ber a
ndN
umer
als
Num
ber
oper
atio
ns a
ndal
gebr
a
Mea
sure
men
t
Shap
e an
dsp
ace
(Geo
met
ry)
Han
dlin
g da
ta.
Not adequately coveredAdequately covered
Figure 2 Teacher’s coverage of the Mathematics content domains
Teachers’ content emphasis for individual students or groups of students As pointed out earlier, content emphasis for students or groups of students is one of the
indicators of opportunity to learn. In this study, data was obtained on a number of factors
that facilitate content emphasis for students or groups of students. These are factors that

24
help students receive a fair opportunity to achieve the knowledge and skills in the content
standards set in English and mathematics. The factors considered in this study were
teacher’s class size, availability of teaching inputs and frequency by which teachers put
their pupils into ability groups while teaching.
As observed above, inputs for teaching the two subjects are not enough to go round most
pupils. It was found that only 21 percent of the teachers indicated that pupils’ English
textbooks were available and adequate while 43 percent indicated that pupils’ mathematics
textbooks were available and adequate. This presupposes that teachers should plan to make
their pupils to work often in groups in order to share the few resources that are available.
Interestingly, as can be seen in Figure 3, many of the teachers indicated they often or
sometimes grouped their pupils by ability during mathematics and English lessons.
0100200300400500600700800
Usually Sometimes Never
How often puplis are grouped during English and mathematics lessons
EnglishMathematics
Figure 3 Frequency of grouping pupils by ability during lessons
The proportions of the teachers who indicated they grouped pupils by ability usually or
sometimes during English lessons were are 27% and 65 percent respectively, while those
who did so in mathematics lessons were 11 and 74 percent respectively. These results were
interesting because the classes were too large for organizing any effective group work.
Table 11 shows the size of classes at the various grade levels in the primary school.
Table 11 Classes by Class sizes
Class(es) Class size categories Total

25
Less than 20 pupils
21 to 30 pupils
31 to 40 pupils
41 to 50 pupils
51 to 60 pupils
61 to 70 pupils
Over 71 pupils
17 36 41 54 30 4 11 193 Primary 1 8.8% 18.7% 21.2% 28.0% 15.5% 2.1% 5.7% 100.0% 17 30 44 52 21 7 11 182 Primary 2 9.3% 16.5% 24.2% 28.6% 11.5% 3.8% 6.0% 100.0% 14 35 45 44 27 8 4 177 Primary 3 7.9% 19.8% 25.4% 24.9% 15.3% 4.5% 2.3% 100.0% 17 24 46 35 28 9 7 166 Primary 4 10.2% 14.5% 27.7% 21.1% 16.9% 5.4% 4.2% 100.0% 15 35 41 51 21 5 4 172 Primary 5 8.7% 20.3% 23.8% 29.7% 12.2% 2.9% 2.3% 100.0% 19 38 45 40 18 8 2 170 Primary 6 11.2% 22.4% 26.5% 23.5% 10.6% 4.7% 1.2% 100.0% 99 198 262 276 145 41 39 1060 Total 9.3% 18.7% 24.7% 26.0% 13.7% 3.9% 3.7% 100.0%
In about 25 percent of the classes the number of pupils in a class ranged from 31 to 40, and
there were over 40 pupils in more than 40 percent of the classes.
Summary, Conclusions and Recommendations Summary The study was an attempt to find out whether or not the opportunities provided in primary
schools for pupils to learn are good enough to promote learning for all of them and assure
high levels of outcomes for all them. The study focused specifically on
i. teachers’ preparedness to implement the content of the national curriculum in
English and mathematics
ii. the adequacy and availability of resources provided for the delivery of the national
curriculum content in English and mathematics
iii. how well the instructional times for teaching English and mathematics were
managed
iv. extent of teachers’ coverage of the national curriculum content in English and
mathematics
v. extent of teachers’ emphasis in the national curriculum content in English and
mathematics

26
vi. teachers’ content emphasis for individual students or groups of students (i.e.
whether or not the content is differentiated to ensure each student achieves his/her
highest potential).
The study involved 1,063 teachers teaching in primary schools in the country. There were
both trained and untrained teachers of which 44.1% were male and 55.9 were female. A
questionnaire was used to gather data on teachers’ schools, classes taught, location of
schools, class size, gender, professional qualifications, instructional resources for teaching
English and mathematics, instructional time for teaching English and mathematics, and
coverage of content of English and mathematics in teachers instruction over the year.
The main findings of the study were
i. Majority (84) percent of the primary school teachers have low teaching qualifications
and a substantial proportion (12.3%) is not at all trained. It can be argued in this regard
that the preparedness of the majority of teachers to implement the content of the
curriculum in English and mathematics is low.
ii. Difficulties in teaching certain topics in the two subjects were expressed by 21 and 34
percent of the English and mathematics teachers respectively.
iii. The schools do not have sufficient resources to deliver high level of curriculum content
and also to achieve higher levels of outcomes for all students. Only 21 percent of the
teachers indicated that pupils’ English textbooks were available and adequate while 43
percent indicated that pupils’ mathematics textbooks were available and adequate. The
environment for learning mathematics and English for many Ghanaian pupils is not
conducive for teachers to deliver their best and help pupils to achieve their highest
potentials.
iv. Lessons in many schools do not start early. The instructional time was often interrupted
with co-curricular (or planned non-instructional) activities like, school worship,
cleaning compound and classrooms, gardening, practicing sports for athletics meetings,
practicing matching and cultural activities, just to mention a few.

27
v. More than half of the teachers (53%) indicated they followed the timetable, but as many
as 47 percent did not rigidly follow it.
vi. About 30 percent of the teachers indicated that they were able to cover only half of the
English syllabus. Only about 20 percent completed the syllabus but the majority was
able to cover up to 80% of the content of the English syllabus.
vii. About 31 percent of the teachers indicated that they were able to cover only half of the
mathematics syllabus content and 21 percent indicated that they were able to cover all
the content. The majority was able to cover up to nearly 80% of the content of the
mathematics syllabus.
viii. Certain topics/units were not taught by many of the teachers in the two subjects.
Some of the unpopular topics in mathematics were shape and space, length, capacity
and mass, decimals and percentage, investigations with numbers, time and money,
collecting and handling data, chance, and area and volume. While some of the
unpopular topics in English were library, story telling, drama, song, mechanical writing,
poem and verse, and directions/instructions
ix. In teaching English, the teachers gave equal attention to comprehension/reading,
writing/composition and language item (grammar and structure). But nearly half of
them did not give adequate attention to units in oral language (listening and speaking).
In teaching of mathematics, almost all teachers taught topics in number and numeral as
well as shape and space. A substantial proportion of teachers gave little attention to the
other content domains – operations/algebra, measurement and handling data.
x. Many of the teachers indicated they often or sometimes grouped their pupils by ability
during mathematics and English lessons. However it was observed that classes were too
large for organizing any effective group work. In about 25 percent of the classes the
number of pupils in a class ranged from 31 to 40, and there were over 40 pupils in more
than 40 percent of the classes.
Conclusion
It was found that the preparedness of the majority of teachers to implement the content of the curriculum in English and mathematics was low; and a substantial proportion experienced difficulties in teaching certain topics in the two subjects. The schools were also

28
found not to have sufficient resources to deliver high level of curriculum content and also to achieve higher levels of outcomes for all students. Textbooks, classroom furniture and teaching/learning materials were inadequate in supply. Notwithstanding, classes were too large for organizing any effective group work. There were over 40 pupils in more than 40 percent of the classes. Besides, lessons in many schools do not start early and the instructional time in the year was often interrupted with co-curricular (or planned non-instructional) activities. As a result, that a substantial proportion of the primary school mathematics and English curricula go untaught. Some of the unpopular topics in mathematics were shape and space, length, capacity and mass, decimals and percentage, investigations with numbers, time and money, collecting and handling data, chance, and area and volume. While some of the unpopular topics in English were library, story telling, drama, song, mechanical writing, poem and verse, and directions/instructions. Another consequence of the insufficient textbooks and resources to deliver the curriculum is teachers giving little attention to units in oral language (i.e. listening and speaking) and little attention to operations/algebra, measurement and handling data in mathematics.
Though curriculum content standards are clearly defined by the syllabuses of the various subjects taught at the basic level, the study has shown that no OTL standards have been set guide the implementation of these content standards. Hence there are grave inequalities between schools in
availability and adequacy of instructional materials, availability and adequacy of textbooks, teachers’ instructional practices and management of instructional time, and teachers’ preparedness to implement the content standards.
Recommendations
i. The tests items for NEAs and SEAs developed for the BECAS should cover largely the critical objectives in the primary mathematics and English syllabuses which are usually taught by all teachers. This will also ensure there is match in content emphasis as well as coverage in the official curricula and what teachers actually teach.
ii. The CRDD should be made to set opportunities to learn (OTL) standards that must be provided to promote high level of achievement for all pupils. It should indicate who should provide the resources that will be required to meet the OTL standards for teaching in basic schools. In doing so, they should make a list of resources that schools can be encouraged to acquire themselves in the implementation of the content standards and those that have to be supplied by the government.
iii. The CRDD should also advise the MOES on issues relating policy on class sizes, INSET and continuing professional education of teachers, use of instructional time,
iv. Textbooks that match the revised syllabuses for mathematics and science should be purchased for teachers.
v. A quality assurance mechanism should be put in place to ensure schools meet these standards in the implementation of the content standards.

29
References Aldrich, J.L. (1969). “Thoughts on a cross-national program: African Education Program”.
Reproduced in Wilson, B. (1981), Cultural contexts of Science and Mathematics Education, Leeds: University of Leeds, Centre for Studies in Science Education.
Anamuah-Mensah, J., Mereku, D. K. and Asabere-Ameyaw, A. (2004). Ghanaian Junior Secondary School Students’ Achievement in Mathematics and Science: Results from Ghana’s participation in the 2003 Trends in International Mathematics and Science Study, Accra: Ministry of Education Youth and Sports.
Baratz-Snowden, J. C. (1993). Opportunity to learn. Implications for professional development. Journal of Negro Education, 62, 311-323
Barr, R. (1987) ‘Content Coverage’, In Dunkin, M.J. (ed.), The International Encyclopedia of Teaching and Teacher Education, Oxford: Pergamon Press.
CRDD - Curriculum Research and Development Division of GES, (1986) Ghana Mathematics Series: Primary Pupil’s Book 1-6. (2nd edition) Accra: Ghana Publishing Corporation.
CRDD (2001). Performance of Pupils in Criterion-Referenced Test: 1992 – 1999, Accra: GES CRDD
Freeman, D. J. and Porter, A. C., (1989). Do Textbooks Dictate The Content Of Mathematics Instruction In Elementary Schools, American Educational Research Journal, Vol. 26, No. 3, p 403-421.
Gamoran, A., Porter, A.C., Smithson, J., & White, P.A. (1997). Upgrading high school mathematics instruction: Improving learning opportunities for low-achieving, low-income youth. Educational Evaluation and Policy Analysis, 19(4), 325-338.
GMOE – Ghana Ministry of Education - (1999) National Education Forum Report, Accra: Ghana Ministry of Education
Good, T.L., Grouws, D.A. and Beckerman, T.M. (1978). ‘Curriculum pacing: some empirical data in mathematics’, Journal of Curriculum Studies Vol. 10, pp.75-81.
Hawes, Hughes (1979). Curriculum Reality in African Primary Schools, Bristol, England: Longman.
Howson, A.G., Keitel, C. and Kilpatrick, J., (1981). Curriculum Development in Mathematics, Cambridge : Cambridge University Press.
Howson, G. and Wilson, B. (1986) School Mathematics in the 1990s, Cambridge: Cambridge University Press,pp21.
Husen, T. (1967). International study of achievement in mathematics, 2. New York, NY: Wiley and Sons.
Kraft, R. J. (1994) Teaching and learning in Ghana: a curriculum, textbook, syllabus and handbook analysis. Accra, Ghana: Ministry of Education.

30
McDonald, F.J. (1976) Research on teaching and its implications for policy making: Report on Phase II of the Beginning Teacher Evaluation Study, Princeton, New Jersey: Educational Testing Service.
Mereku, K. D. (1995) A comparison of the official primary mathematics curriculum in Ghana with the way in which it is implemented by teachers, University of Leeds: School of Education. (Ph.D. Dissertation).
Mullis, I. V. S., Martin, M. O., Gonzalez, E. J., and Chrostowski, S. J. (2004) TIMSS-2003 International Mathematics Report: Findings from IEA’s Trends in International Mathematics and Science Study at the Fourth and Eighth Grades, Chestnut Hill, MA: Boston Colege
Mullis, I. V. S., Martin, M. O., Gonzalez, E. J., Gregory, K. D., Garden, R. A., O’Connor, K. M., Chrostowski, S. J. and Smith, T. A. (2000). TIMSS 1999 International Mathematics Report: Findings from IEA’s Repeat of the Third International Mathematics and Science Study at the Eight Grade. Chestnut Hill, MA: International Study Centre, Boston College.
Oakes, J. (1989). What educational indicators? The case for assessing the school context. Educational Evaluation and Policy Analysis, 11(2), 181-199.
Porter et al. (1979), Teacher Autonomy and the control of content taught (Research Series No. 24). East Lansing, Michigan: Michigan State University, Institute for Research on Teaching.
Porter, A. C. (1991). Creating a system of school process indicators. Educational Evaluation and Policy Analysis, 13(1), 13-29.
Porter, A. C. (1993). Defining and Measuring Opportunity to Learn. Madison, WI: University of Wisconsin.
Robitaille, D. F., Schmidt, W. H., Raizen, S., McKnight, C., Britton, E. and Nicol, C. (1994). Curriculum Frameworks for Mathematics and Science: TIMSS Monograph No.1: Vancouver, BC: Pacific Educational Press.
Wilson, B.J., (1992). “Mathematics Education in Africa”, In R. Morris (ed.) Studies in Mathematics Education, Paris: UNESCO pp125-147.
Winfield, L F. (1987). Teachers' estimates of test content covered in class and first-grade students' reading achievement. Elementary School Journal, 87(4), 438-445.
Winters, L., Burstein, L., Ang, A., Jo, B., Wang (Moody), J. & Leonard, J. (1994). What we know about opportunity to learn: Tracking the technical terrain. Paper presented at the 1994 annual CRESST conference, Los Angeles, CA.
Ysseldyke, J., Thurlow, M., & Shin H. (1995). Opportunity-to-learn standards (Policy Directions No. 4). Minneapolis, MN: University of Minnesota, National Center on Educational Outcomes. Retrieved [today's date], from the World Wide Web: http://education.umn.edu/NCEO/OnlinePubs/Policy4.html (accessed 4/7/2004)

31
GHANA EDUCATION SERVICE CURRICULUM RESEARCH AND DEVELOPMENT DIVISION (CRDD)
Survey of Basic School Contexts and Curriculum Implementation for the
Basic Education Comprehensive Assessment System (BECAS)
PRIMARY 1 TEACHERS’ QUESTIONNAIRE
Dear Teacher, As you are aware, assessment is an integral part of teaching. The teacher must be supported to assess his or her pupils well. This questionnaire is surveying the contexts of basic schools and their curriculum implementation to inform the development of a new comprehensive assessment system for basic schools. We will be pleased if you will complete this questionnaire to provide information for the process. Your responses will be treated with utmost confidentiality. Thank you for your cooperation. ……………………………………
Mr. E. ACQUAYE (DIRECTOR, CRDD)
INSTRUCTION In each case, COMPLETE THE STATEMENT(S) and/or TICK (√) THE APPROPRIATE OPTION.
1. SCHOOL: …………………………………………….
2. TOWN: ……………………………………….…
3. DISTRICT: ………………………………………..
4. REGION: ………………
5a. SEX: MALE [ ] FEMALE [ ]
5b. PROFESSIONAL’S QUALIFICATION: UNTRAINED [ ]
CERTIFICATE ‘A’ [ ] DIPLOMA [ ] DEGREE (B.Ed) [ ]
6. CLASS(ES) YOU TEACH PRESENTLY …………………………..

32
7. NUMBER OF PUPILS IN YOUR CLASS …………………………… 8. Do you usually start teaching on time? YES [ ] NO [ ]
9. If NO, why do you usually start late?
……………………………………………………………………………………
……………………………………………………………………………………
……………………………………………………………………………………
10. Tick (√) to show whether the following inputs, which affect the teaching and learning of Mathematics and English, were not available, available but inadequate, or available and adequate in your class in the academic year.
SCALE
CLASS INPUTS Not
A
vaila
ble
Ava
ilabl
e Bu
t In
adeq
uate
A
vaila
ble
And
A
dequ
ate
a) Pupils exercise books
b) Teacher’s stationery (chalk, notebook, cardboard, etc.)
c) Pupils’ Mathematics textbook(s)
d) Pupils’ English textbook(s)
e) Pieces of pupils’ mathematical drawing instruments (ruler, compasses and protractor)
f) Classroom space
g) Classroom furniture
h) Resources for teaching measurement and models for work in number and shape (metre-ruler, tape measure, litter containers, weighing scale, etc.
i) Audio-Visual aids for teaching language (i.e. radio, TV/Video or computer)

33
11. Do you have your own copy of the mathematics syllabus? YES [ ] NO [ ]
12. If NO, how often do you have access to the mathematics syllabus?
A. At the beginning of term when writing my scheme of work B. Only at weekends when preparing my lesson notes C. Any day during the week that I need it D. Other, Please specify…………………………………………….
13. Do you have your own copy of the English syllabus? YES [ ] NO [ ]
14. If NO, how often do you have access to the English syllabus?
A. At the beginning of term when writing my scheme of work B. Only at weekends when preparing my lesson notes C. Any day during the week that I need it D. Other, Please specify…………………………………………….
15. Do you usually follow the time table when you teach (or do you teach all subjects
on the time table each day)? YES [ ] NO [ ] 16. If NO, how many subjects are you able to teach each day? ……………...
17. What prevents you from teaching all subjects on the time table each day?
……………………………………………………………………………………
……………………………………………………………………………………
……………………………………………………………………………………
……………………………………………………………………………………
18. How many mathematics periods do you teach each week? ………………………..
19. What proportion of the mathematics syllabus are you likely to complete by the end of the academic year? (Please tick only one)
A. Below 40% [ ] B. 40% to 50% [ ]
C. 51% to 60% [ ] D. 61% to 70% [ ]
E. 71% to 80% [ ]

34
F. 81% to 90% [ ] G. 91% to 100% [ ]
20. How many English periods do you teach each week? ………………………..
21. What proportion of the English syllabus are you likely to complete by the end of the academic year? (Please tick only one) A. Below 40% [ ] B. 40% to 50% [ ]
C. 51% to 60% [ ] D. 61% to 70% [ ]
E. 71% to 80% [ ] F. 81% to 90% [ ]
G. 91% to 100% [ ]
22. Do you have any difficulties in teaching any of the topics in Mathematics?
YES [ ] NO [ ]
23. If yes, which topics in Mathematics?
……………………………………………………………………………………
……………………………………………………………………………………
……………………………………………………………………………………
24. How often do you group your pupils by ability during your mathematics lessons? USUALLY [ ] SOMETIMES [ ] NEVER [ ]
25. Do you have any difficulties in teaching any of the Sections/Units in English?
YES [ ] NO [ ]
26. If yes, which Sections/Units in English?
……………………………………………………………………………………
……………………………………………………………………………………

35
……………………………………………………………………………………
27. How often do you group your pupils by ability during your English lessons?
USUALLY [ ] SOMETIMES [ ] NEVER [ ]
28. Below are the Sections/Units that are to be taught in Primary 1 according to the new English syllabus. Reflecting on your scheme of work and what you actually taught in the year
i. TICK (√) whether or not you taught the Sections/Units in the year; and
ii. Give brief reasons why Section/Unit was not taught in the year.
SECTIONS/UNITS OF ENGLISH TAUGHT
NOT TAUGHT
REASON WHY SECTION/UNIT WAS NOT
TAUGHT 1. Pre-reading/reading
2. Conversation
3. Grammar
4. Rhyme
5. Mechanical Writing
6. Story Telling
7. Drama
8. Library

36
29. Below are the Units that are to be taught in Primary 1 according to the new
mathematics syllabus. Reflecting on your scheme of work and what you actually taught in the year
i. TICK (√) whether or not you taught the Units in the year; and ii. Give brief reasons why the Unit was not taught in the year.
MATHEMATICS UNIT OR TOPIC TAUGHT
NOT TAUGHT
REASON WHY TOPIC WAS NOT TAUGHT
1. Pre-Number Work
2. Groups of Objects
3. Counting Objects
4. Numbers and Numerals I
5. Addition (Up to 5)
6. Solid Shapes
7. Number and Numerals II
8. Addition 6 - 9
9. Subtraction 0 - 9
10. Ten and Ones
11. Addition and Subtraction
12. Measurement of Length, Capacity and Mass
13. Measurement of Time and Money
14. Collecting and Handling Data
15. Addition and Subtraction of Number (0 - 99)
THANK YOU
37
APPENDIX B Some areas in which teachers had difficulties in teaching English Adjective All sections, due to lack of resource books Anomalous finite (grammar) Argumentative essay Composition, reading comprehension Composition Composition, e.g. Letter writing, poem etc Composition, grammar, essay and conversation Comprehension, grammar and composition Comprehension, grammar (determines and modals) Conversation because there are no recourses for the teaching of it Conversation, mechanical writing Conversation, pupils are not able to form a sentence (punctuation marks) Directions/instructions Drama Drama and poetry Drama, direction and instruction Drama, grammar, conversation Drama, library Drama, listening / speaking, poems Drama, poems, story telling, grammar Drama, song Drama, writing English composition, unit 3 and unit 6 Grammar Grammar and composition Grammar because pupils find it very difficult to grasp the concept Grammar, composition writing Grammar, dictation and composition Grammar, not well explained in syllabus Grammar, story telling, library Grammar, writing and composition Grammar, composition and conversation Grammar, pronunciation Library Library and drama Library and drama Library, story telling
Library Mechanical writing Verse, direction and instructions Listening and speaking aspect Listening and speaking, oral aspect Mechanical writing Mechanical writing, library Mechanical writing, reading, library No teacher's hand book Oral, conversation Poem and drama Poem and drama because teachers feels special talent e.g. Needed for teaching Poem, song and drama Poem, stories Poem, verse directions and instructions drama Poems, grammar, mechanical writing Reading. Attributed to lack of readers Rhyme, library, drama Rhyme/verse, drama Rhyme/verse. Due to lack of TLMs to portray the scenes Section 1, unit 3 and 4 Section 3 unit one Section 4 unit 6 Section 5. No library books available Song, mechanical writing, Song, poem, mechanical writing, story telling and drama Song, story telling, drama Songs Speech work (sounds of letters) Story telling Story telling, drama, poem conversation, verse directions and instruction Summary, advertisement Tenses The reading aspects, Textbooks not available, Unit 2 Unit 5 and 8 all under section 2 Verse, directions and instructions, grammar, library Writing and composition Writing, words/sounds

2
APPENDIX C Some areas in which teachers had difficulties in teaching Mathematics Areas and length Capacity and volume measurement of weight Chance Chance, investigation of numbers Collecting and handling data 1 and 2 Collecting and handling data investigation with numbers Collecting and handling data, chance Collecting and handling data Data collection Data, measurement Decimal, fractions, measurement, Decimal, fractions, percentage, ratio and proportion Decimal, fractions, percentage. Multiplication and division Division and fraction Division, fractions, and multiplication Division, fractions, line segment Division, measurement of capacity and volume Drawing geometric figures, measurement, length, capacity etc Fraction ii Fraction ii, geometry, graphs Fraction, Fractions Fractions and decimals Fractions, collecting and handling data Fractions, collecting and handling data, measurement Fractions, division Fractions, measurement place value Geometric figures Geometric figures Geometric figures in space measurement of length to angles percentages Geometric shapes Geometry and estimating with numbers Geometry I and II and graphs Geometry, fraction Geometry, fractions Geometry, measurement and operations Graphs, measurements, geometry Integers, decimal fractions Integers, graphs ratio proportion, movement geometry, area, volume Integers, the number plane Integers, the number plane
Investigation Investigation with numbers Investigation with numbers Investigation with numbers, fractions, shapes, etc Investigation with numbers, measurement of capacity and volume Investigation with numbers, measurement, data collection Length Length and area Length and area, shapes measurement of capacity and mass Length, mass and capacity, area and vol. Space and shape Long division Long division and decimals Mass capacity, time and measurement Mass under measurement Measurement - capacity, volume, mass, etc Measurement of capacity and mass Measurement of capacity and mass Measurement of capacity and volume, collecting and handling data Measurement of length Measurement of length and area Measurement of length capacity mass Measurement of length capacity of mass Measurement of length, area, capacity, volume. Measurement of time and money. Measurements (weight/mass) Multiplication, fractions, measurement, graphs Number chart, large numbers mass and capacity Number plane Number plane, investigation with numbers Number plane, shape/space Number plane, shape/space Numbers + numerals 0 - 10,000 Operations Operations on fraction, decimal fractions and percentages Ratio, measurement, number plane, multiplication Rational numbers (3) Shape and space 6 Shape and space fractions Shape and space, number plane

3
Shapes, collecting data Shapes, measurement of capacity Shapes, space fraction, measurements Shapes, space. Measurement of weight time and money Shape and space Solid figures, decimals Story problem form of questions are difficult for children. They cannot read and interpret Subtraction and addition, sentences involving compound expression, fractions
Subtraction and addition, sentences involving compound expression, fractions Syllabus is different from textbook Tens and ones measurement of length mass capacity The number plane, graphs, what are the chances Topics in the syllabus do not tally with textbooks hence difficulty Weight and mass
Page 1 Proportion of Proportion mathematics of English syllabus syllabus covered covered REGION Mean Mean _____________ ___________ __________ ASHANTI 3.98 3.76 BRONG AHAFO 4.67 4.13 CENTRAL 4.03 4.20 EASTERN 4.33 4.31 GREATER ACCRA 4.84 5.13 NORTHERN 4.05 4.08 UPPER EAST 3.48 3.21 UPPER WEST 4.08 3.96 VOLTA 4.29 4.26

2
Page 1 CLASS SIZE REGION Mean _____________ ________ ASHANTI 42.46 BRONG AHAFO 34.91 CENTRAL 43.24 EASTERN 35.97 GREATER ACCRA 42.67 NORTHERN 51.06 UPPER EAST 54.23 UPPER WEST 42.50 VOLTA 30.72 Report CLASS SIZE REGION Mean N Std.
DeviationMinimum Maximum
ASHANTI 42.4574 129 12.6176 5.00 67.00BRONG AHAFO
34.9097 144 10.1154 13.00 58.00
CENTRAL 43.2364 110 15.5167 10.00 102.00EASTERN 35.9716 141 12.2853 12.00 75.00GREATER ACCRA
42.6731 156 11.6984 10.00 68.00
NORTHERN
49.1869 107 18.7461 10.00 120.00
UPPER EAST
54.2292 48 17.4188 30.00 90.00
UPPER WEST
41.3095 84 22.5906 12.00 117.00
VOLTA 30.7234 141 10.9356 8.00 71.00Total 40.2425 1060 15.4943 5.00 120.00
Report CLASS SIZE CLASS(ES
)Mean N Std.
DeviationMinimum Maximum
1.00 40.4789 190 15.6927 10.00 117.002.00 41.5000 176 17.6525 5.00 120.003.00 39.9647 170 13.7819 10.00 96.00

3
4.00 40.9125 160 15.6259 8.00 89.005.00 39.1437 167 13.9820 8.00 90.006.00 38.1925 161 14.0386 9.00 78.00
Total 40.0596 1024 15.2272 5.00 120.00

4
Class size categories
Frequency Percent Valid Percent
Cumulative Percent
ValidLess than 20 pupils
99 9.3 9.3 9.3
21 to 30 pupils
198 18.6 18.7 28.0
31 to 40 pupils
262 24.6 24.7 52.7
41 to 50 pupils
276 26.0 26.0 78.8
51 to 60 pupils
145 13.6 13.7 92.5
61 to 70 pupils
41 3.9 3.9 96.3
Over 71 pupils
39 3.7 3.7 100.0
Total 1060 99.7 100.0 MissingSystem 3 .3
Total 1063 100.0
Class size categories
Class(es) Less than 20 pupils
21 to 30 pupils
31 to 40 pupils
41 to 50 pupils
51 to 60 pupils
61 to 70 pupils
Over 71 pupils Total
17 36 41 54 30 4 11 193 Primary 1 8.8% 18.7% 21.2% 28.0% 15.5% 2.1% 5.7% 100.0% 17 30 44 52 21 7 11 182 Primary 2 9.3% 16.5% 24.2% 28.6% 11.5% 3.8% 6.0% 100.0% 14 35 45 44 27 8 4 177 Primary 3 7.9% 19.8% 25.4% 24.9% 15.3% 4.5% 2.3% 100.0% 17 24 46 35 28 9 7 166 Primary 4 10.2% 14.5% 27.7% 21.1% 16.9% 5.4% 4.2% 100.0% 15 35 41 51 21 5 4 172 Primary 5 8.7% 20.3% 23.8% 29.7% 12.2% 2.9% 2.3% 100.0% 19 38 45 40 18 8 2 170 Primary 6 11.2% 22.4% 26.5% 23.5% 10.6% 4.7% 1.2% 100.0% 99 198 262 276 145 41 39 1060 Total 9.3% 18.7% 24.7% 26.0% 13.7% 3.9% 3.7% 100.0%

5
Class size (or Number of pupils in class)
Less than 20
21 to 30 31 to 40 41 to 50 51 to 60 61 to 70 Over 71 pupils
Primary 1 17 36 41 54 30 4 11
Primary 2 17 30 44 52 21 7 11
Primary 3 14 35 45 44 27 8 4
Primary 4 17 24 46 35 28 9 7
Primary 5 15 35 41 51 21 5 4
Primary 6 19 38 45 40 18 8 2
99 198 262 276 145 41 39
050
100150200250300350
Num
ber
of te
ache
rs
Below 40%
40% to 50%
51% to 60%
61% to 70%
71% to 80%
81% to 90%
91% to 100%
Proportion of syllabus covered in English and mathematics
English Mathematics