Embed Size (px)
Citation preview

1
Strive for sustainable growth in automotive industry through advanced technology and partnership
Opportunity Day
1Q2019June 5, 2019
Automotive Industry Overview
2
Tractor Industry Overview
Sale Performance
Financial Highlights
Company Overview
3
Company Overview
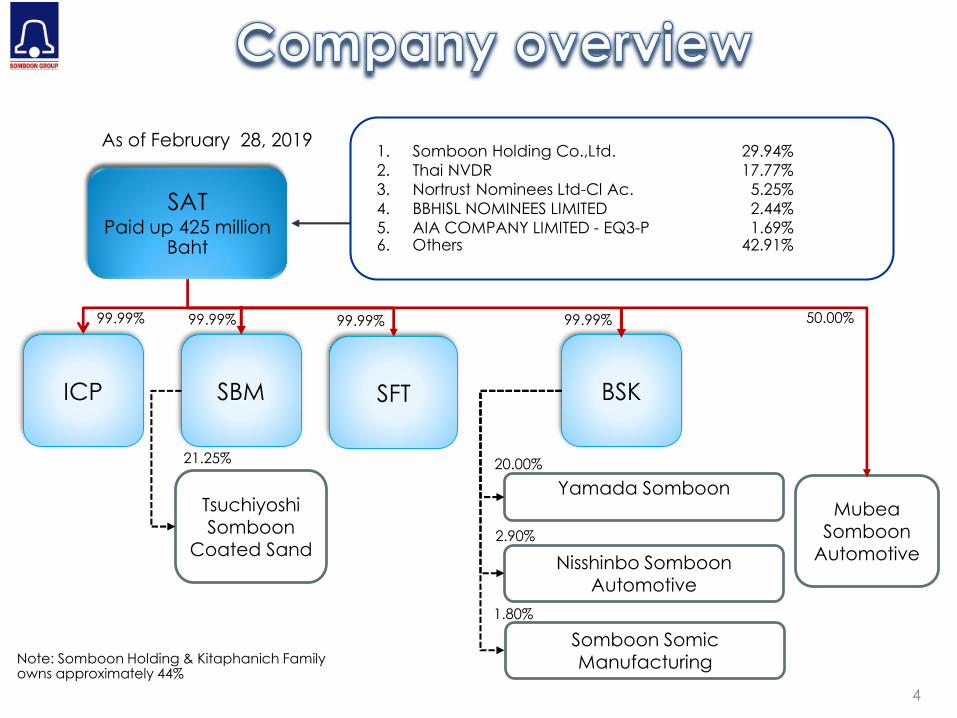
4
SATPaid up 425 million
Baht
ICP SBM BSKSFT
Tsuchiyoshi Somboon
Coated Sand
Yamada Somboon
Nisshinbo Somboon Automotive
Somboon Somic Manufacturing
21.25% 20.00%
2.90%
1.80%
1. Somboon Holding Co.,Ltd. 29.94%
2. Thai NVDR 17.77%
3. Nortrust Nominees Ltd-Cl Ac. 5.25%
4. BBHISL NOMINEES LIMITED 2.44%
5. AIA COMPANY LIMITED - EQ3-P 1.69%6. Others 42.91%
As of February 28, 2019
99.99% 99.99% 99.99% 99.99%
Note: Somboon Holding & Kitaphanich Family owns approximately 44%
MubeaSomboon
Automotive
50.00%
5
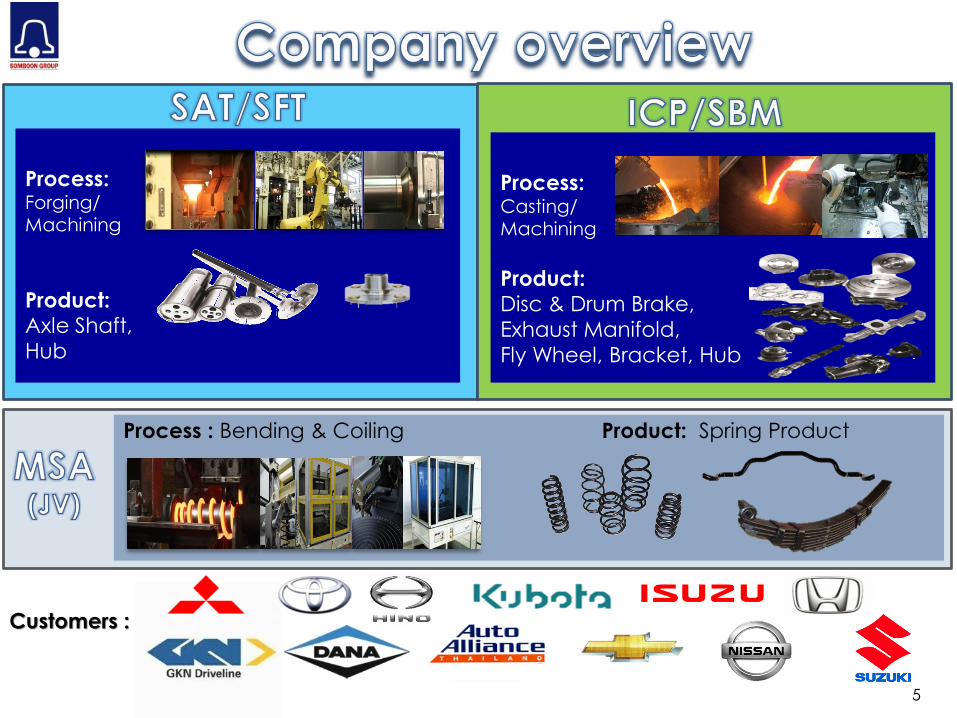
Process:Forging/Machining
Product:Axle Shaft,
Hub
Process:Casting/Machining
Product:Disc & Drum Brake,
Exhaust Manifold,
Fly Wheel, Bracket, Hub
Process : Bending & Coiling Product: Spring Product
Customers :

6
Parts of Pick up & truck
Parts of Passenger &Eco Car
7
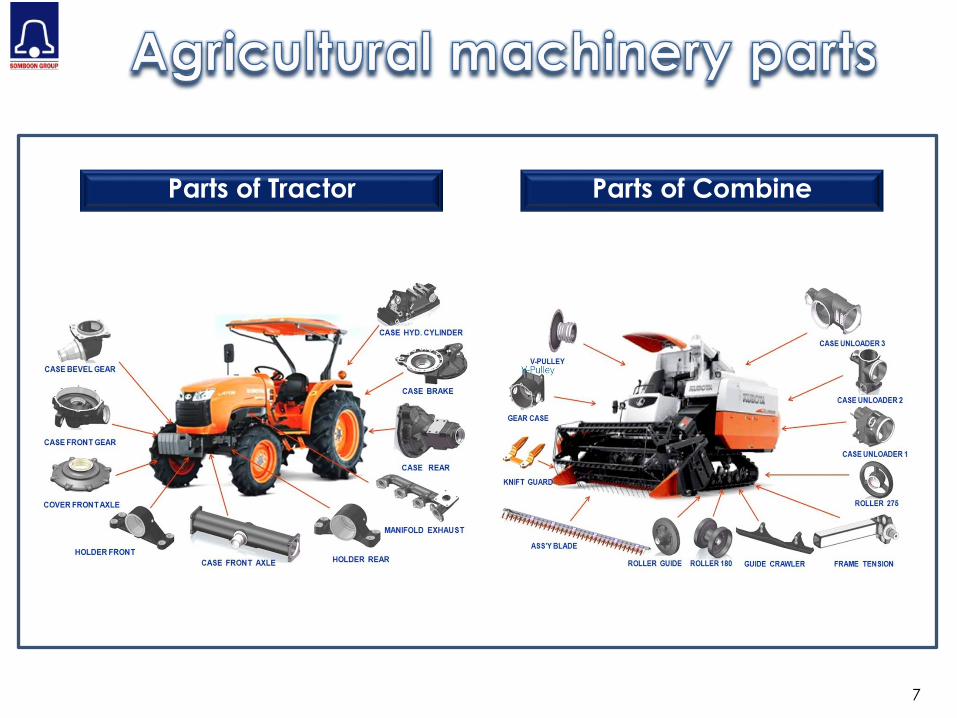
Parts of Tractor Parts of Combine
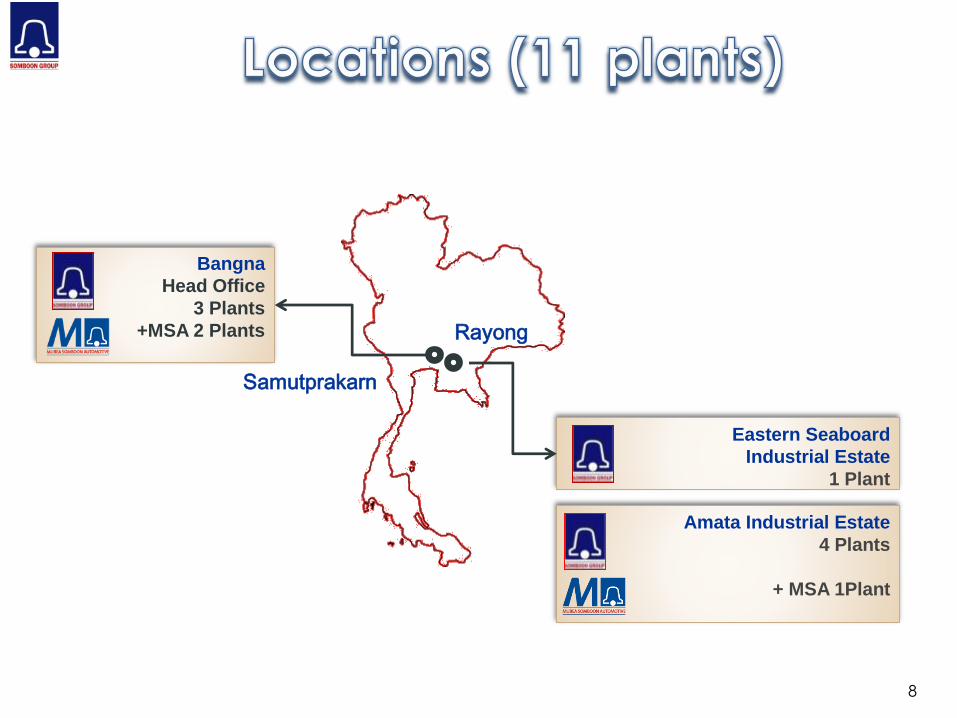
Amata Industrial Estate
4 Plants
+ MSA 1Plant
Samutprakarn
Rayong
Eastern Seaboard
Industrial Estate
1 Plant
Bangna
Head Office
3 Plants
+MSA 2 Plants
8
9
Automotive Industry Overview
239
245
255 2
85
258
301
271 292
278 304
540
517 5
48 564
561
0
100
200
300
400
500
600
1Q18 2Q18 3Q18 4Q18 1Q19
Domestic Export Total
10
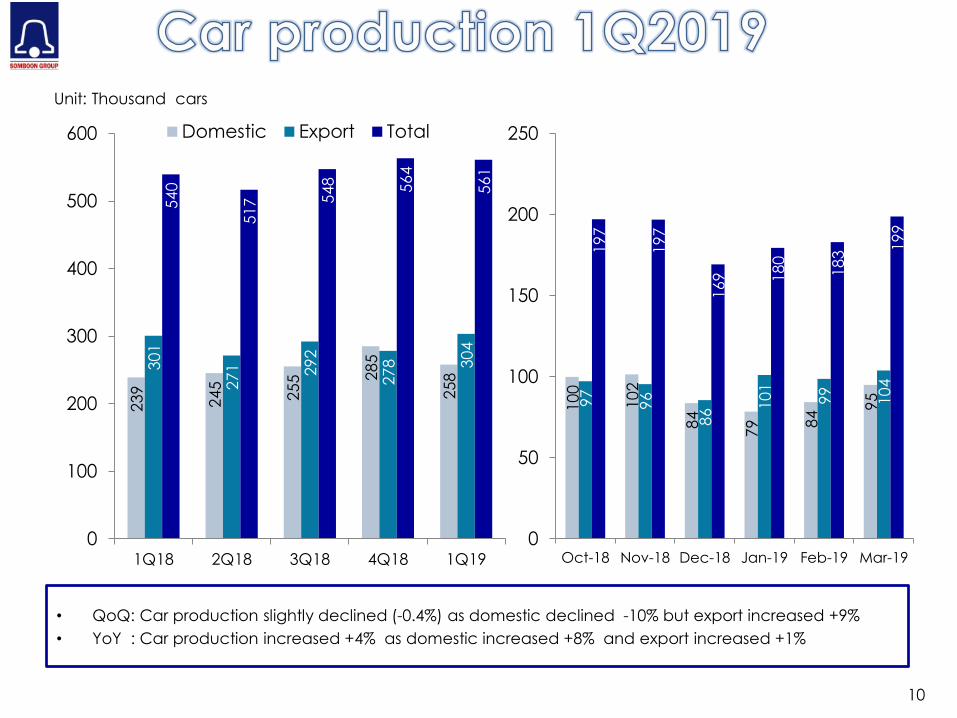
• QoQ: Car production slightly declined (-0.4%) as domestic declined -10% but export increased +9%
• YoY : Car production increased +4% as domestic increased +8% and export increased +1%
100
102
84
79 8
4
9597
96
86 1
01
99
104
197
197
169 180
183
199
0
50
100
150
200
250
Oct-18 Nov-18 Dec-18 Jan-19 Feb-19 Mar-19
Unit: Thousand cars
11
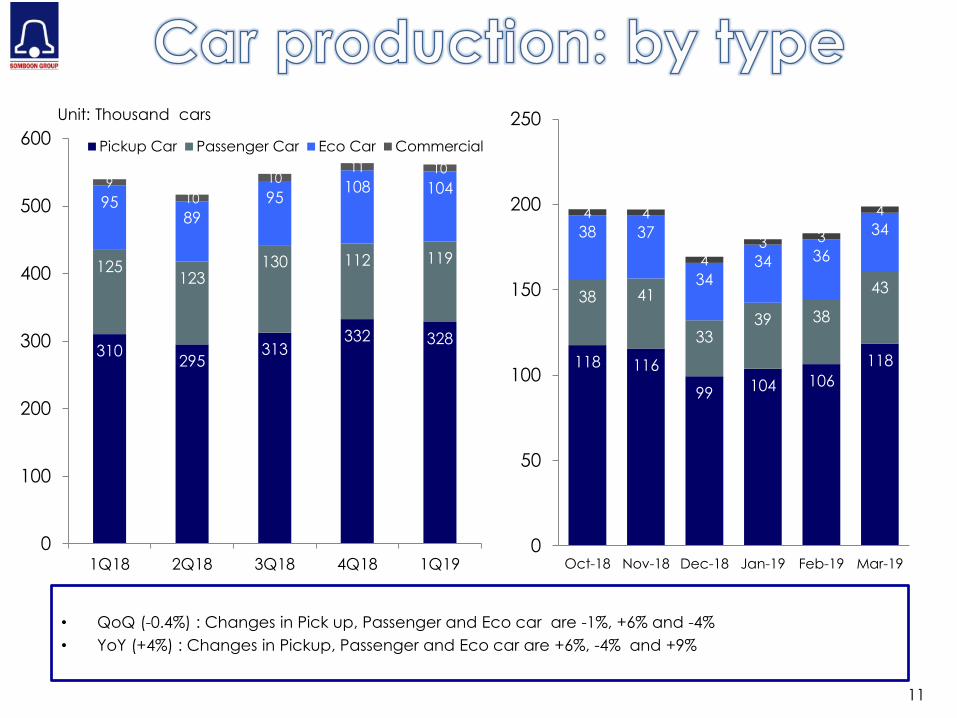
• QoQ (-0.4%) : Changes in Pick up, Passenger and Eco car are -1%, +6% and -4%
• YoY (+4%) : Changes in Pickup, Passenger and Eco car are +6%, -4% and +9%
Unit: Thousand cars
310295
313332 328
125123
130 112 119
9589
95108 1049
10
1011 10
0
100
200
300
400
500
600
1Q18 2Q18 3Q18 4Q18 1Q19
Pickup Car Passenger Car Eco Car Commercial
118 116
99 104 106
118
38 41
3339 38
43
38 37
3434 36
344 4
4
3 3
4
0
50
100
150
200
250
Oct-18 Nov-18 Dec-18 Jan-19 Feb-19 Mar-19
12
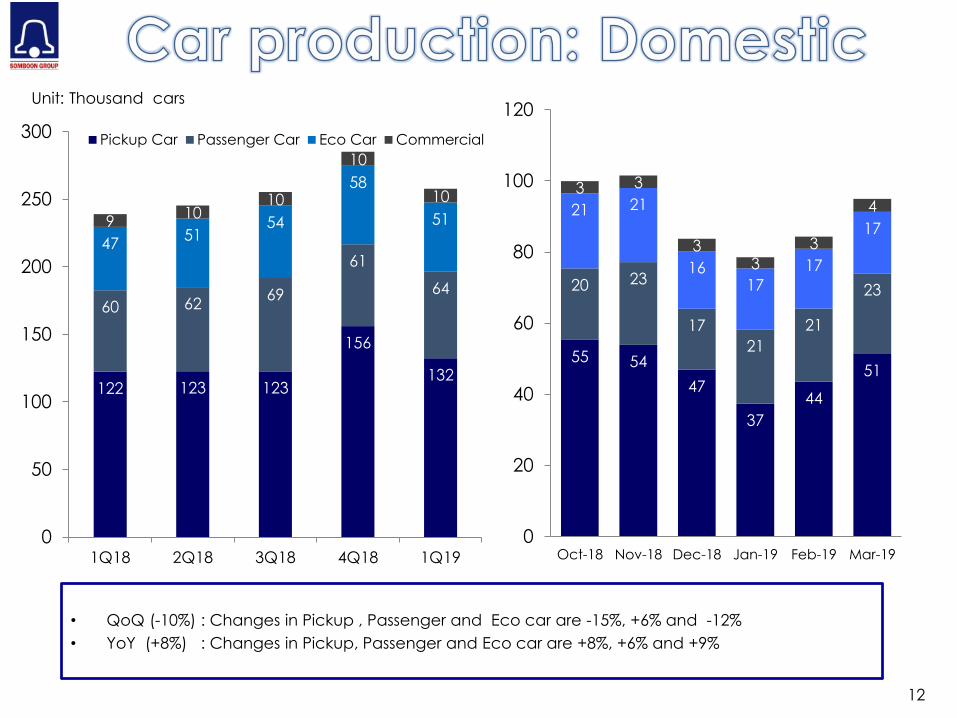
• QoQ (-10%) : Changes in Pickup , Passenger and Eco car are -15%, +6% and -12%
• YoY (+8%) : Changes in Pickup, Passenger and Eco car are +8%, +6% and +9%
Unit: Thousand cars
122 123 123
156
132
60 6269
61
64
4751
54
58
51910
10
10
10
0
50
100
150
200
250
300
1Q18 2Q18 3Q18 4Q18 1Q19
Pickup Car Passenger Car Eco Car Commercial
55 54
47
37
44
51
20 23
17
21
21
23
21 21
1617
17
17
3 3
33
3
4
0
20
40
60
80
100
120
Oct-18 Nov-18 Dec-18 Jan-19 Feb-19 Mar-19
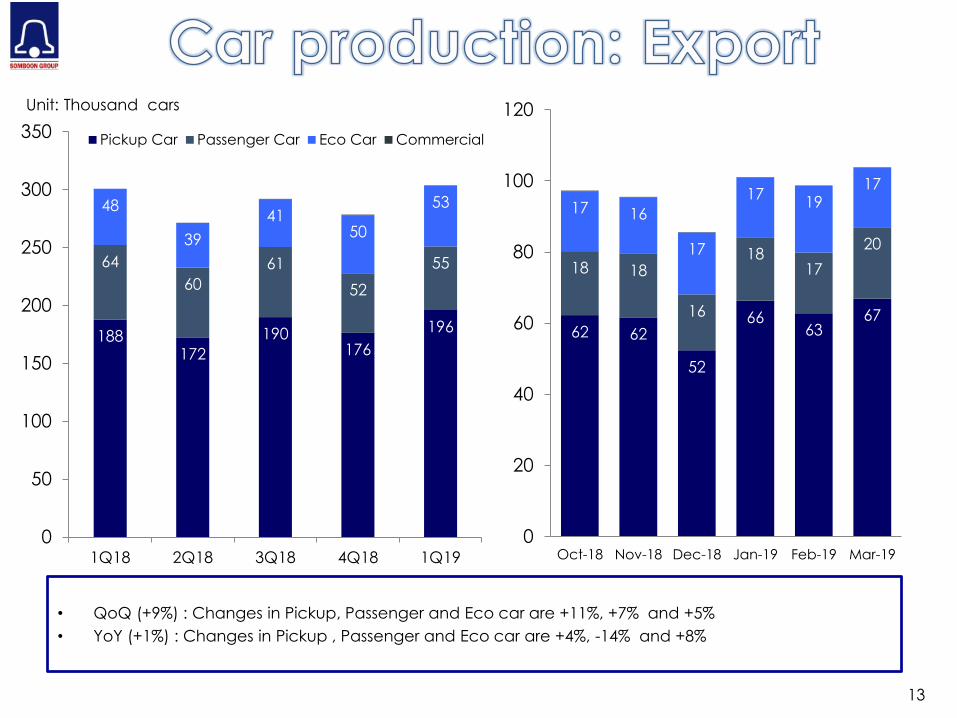
13
• QoQ (+9%) : Changes in Pickup, Passenger and Eco car are +11%, +7% and +5%
• YoY (+1%) : Changes in Pickup , Passenger and Eco car are +4%, -14% and +8%
Unit: Thousand cars
188172
190176
196
64
60
61
52
55
48
39
4150
53
0
50
100
150
200
250
300
350
1Q18 2Q18 3Q18 4Q18 1Q19
Pickup Car Passenger Car Eco Car Commercial
62 62
52
6663
67
18 18
16
1817
20
17 16
17
1719
17
0
20
40
60
80
100
120
Oct-18 Nov-18 Dec-18 Jan-19 Feb-19 Mar-19
14
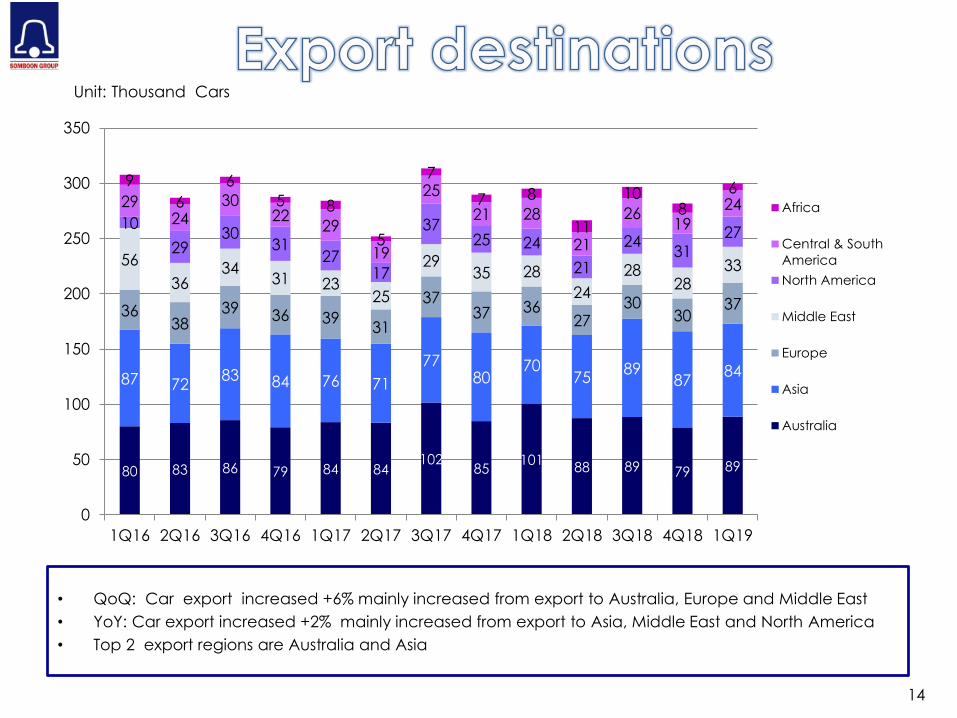
Unit: Thousand Cars
• QoQ: Car export increased +6% mainly increased from export to Australia, Europe and Middle East
• YoY: Car export increased +2% mainly increased from export to Asia, Middle East and North America
• Top 2 export regions are Australia and Asia
80 83 86 79 84 84102
85101
88 89 79 89
87 7283 84 76 71
7780
7075
8987
84
3638
39 36 3931
3737 36
2730
3037
56
3634
31 2325
2935 28
24
2828
33
10
2930
3127
17
3725 24
21
2431
27
2924
3022
29
19
25
21 28
21
2619
24
9
6
6
5 8
5
7
7 8
11
108
6
0
50
100
150
200
250
300
350
1Q16 2Q16 3Q16 4Q16 1Q17 2Q17 3Q17 4Q17 1Q18 2Q18 3Q18 4Q18 1Q19
Africa
Central & South
America
North America
Middle East
Europe
Asia
Australia
0.5
0.3
0.1
0.2
0.3
0.3
0.4
0.5
0.6
0.7
0.7
0.6
0.6
0.5
0.8
0.8
1.4
1.3
0.8
0.7
0.8
0.9
1.0
2
-
0.0
0.0
0.1
0.1
0.2
0.2
0.2
0.2
0.3
0.4
0.5
0.7
0.8
0.5
0.9
0.7
1.0
1.1
1.1
1.2
1.2
1.1
1.1
4
0.6
0.4
0.2
0.3 0.4 0.5
0.6
0.8
0.9
1.1 1.2
1.3 1.4
1.0
1.6
1.5
2.5 2.5
1.9 1.9 1.9 2.0
2.2 2.1
2.3 2.4
-
0.5
1.0
1.5
2.0
2.5
3.0
Export
Domestic
Total Production
15
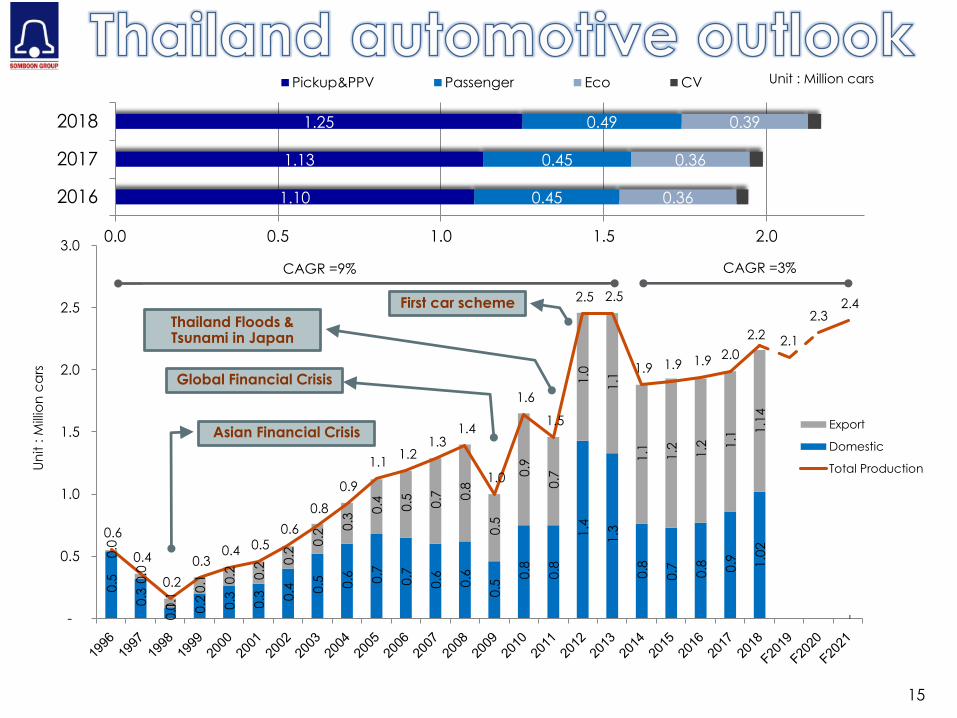
Asian Financial Crisis
Global Financial Crisis
Thailand Floods & Tsunami in Japan
CAGR =3%CAGR =9%
First car scheme
1.10
1.13
1.25
0.45
0.45
0.49
0.36
0.36
0.39
0.0 0.5 1.0 1.5 2.0
2016
2017
2018
Pickup&PPV Passenger Eco CV
Un
it : M
illio
n c
ars
Unit : Million cars

16
Tractor Industry Overview

17
Source : Customer
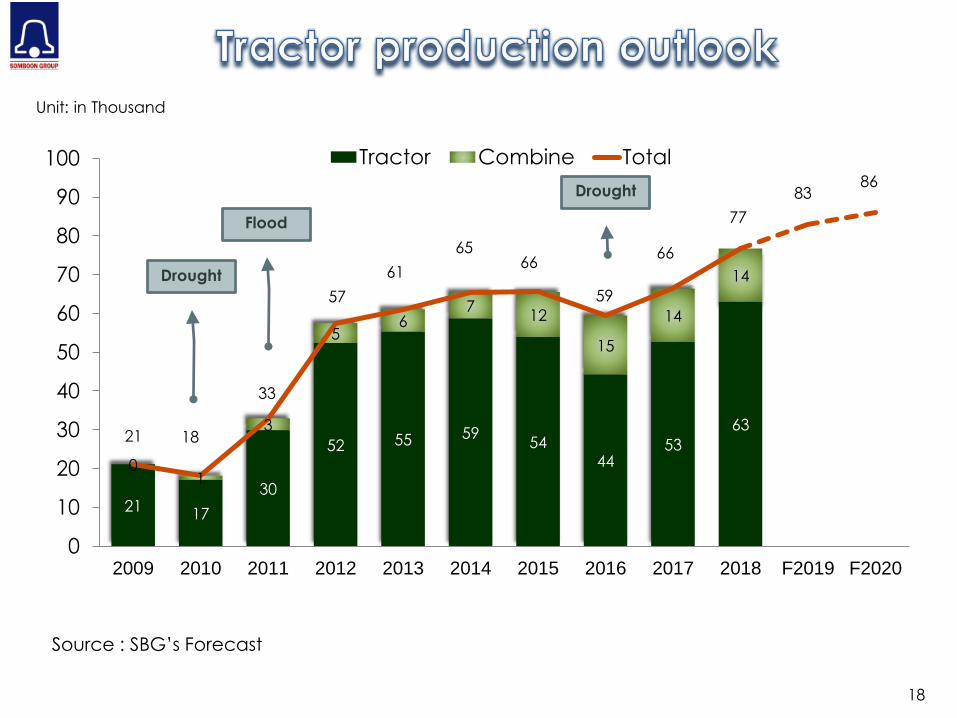
Unit: in Thousand
• QoQ: Increased +16%
• YoY : Increased +23%
119
12 11 11
15 1412
1517
15 16
21
3
3
55
3
26
2
33 5 3
1
14
12
17 17
15
17
20
15
1819
2019
22
0
5
10
15
20
25
1Q16 2Q16 3Q16 4Q16 1Q17 2Q17 3Q17 4Q17 1Q18 2Q18 3Q18 4Q18 1Q19
Tractor Combine Total
2117
30
52 55 5954
4453
63
01
3
56
712
15
14
14
21 18
33
57
61
6566
59
66
77
8386
0
10
20
30
40
50
60
70
80
90
100
2009 2010 2011 2012 2013 2014 2015 2016 2017 2018 F2019 F2020
Tractor Combine Total
Drought
18
Unit: in Thousand
Flood
Drought
Source : SBG’s Forecast

19
Sale Performance
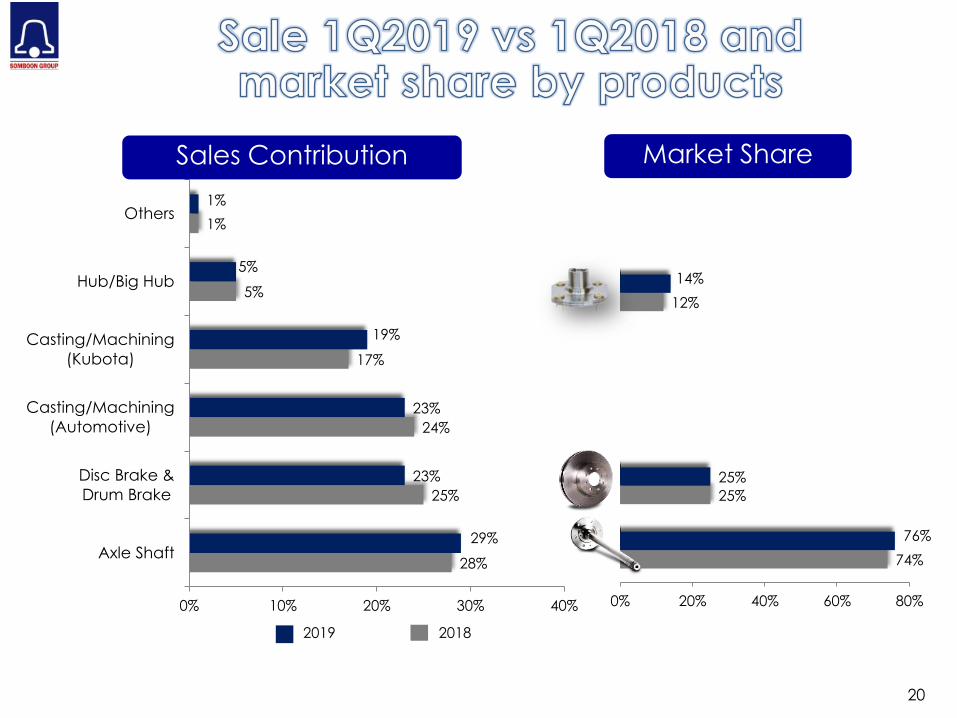
28%
25%
24%
17%
5%
1%
29%
23%
23%
19%
5%
1%
0% 10% 20% 30% 40%
Axle Shaft
Disc Brake &
Drum Brake
Casting/Machining
(Automotive)
Casting/Machining
(Kubota)
Hub/Big Hub
Others
20182019
74%
25%
12%
76%
25%
14%
0% 20% 40% 60% 80%
20
Market ShareSales Contribution

21
36%
25%
17%
7%
5%
3%
2%
2%
3%
33%
25%
20%
6%
4%
2%
2%
2%
6%
0% 5% 10% 15% 20% 25% 30% 35% 40%
Mitsubishi
Toyota/Hino
Kubota
Isuzu
Honda
Nissan
GM
Ford & Mazda
Others*
2019 2018
Note : *Other : Other customer , Direct export and REM customer.

2018 1Q2018 4Q2018 1Q2019
Production line Capacitypcs /month
Utilization(%)
Capacitypcs /month
Utilization(%)
Capacitypcs /month
Utilization(%)
Capacitypcs /month
Utilization(%)
Axle Shaft 365,500 64% 365,500 63% 365,500 68% 365,500 75%
Machining (Auto) 437,000 70% 418,400 73% 437,000 73% 437,000 72%
Machining (non-Auto)
229,000 76% 229,000 68% 229,000 81% 229,000 80%
General Forging 280,500 42% 280,500 42% 280,500 42% 280,500 44%
Total (SBG) 67% 66% 70% 73%
22
Note : 1. Capacity is calculated based on 500 hours per month (20 hours x 25 days) except Axle Shaft & General Forging: 550 hours per month
23
Financial Highlights
24
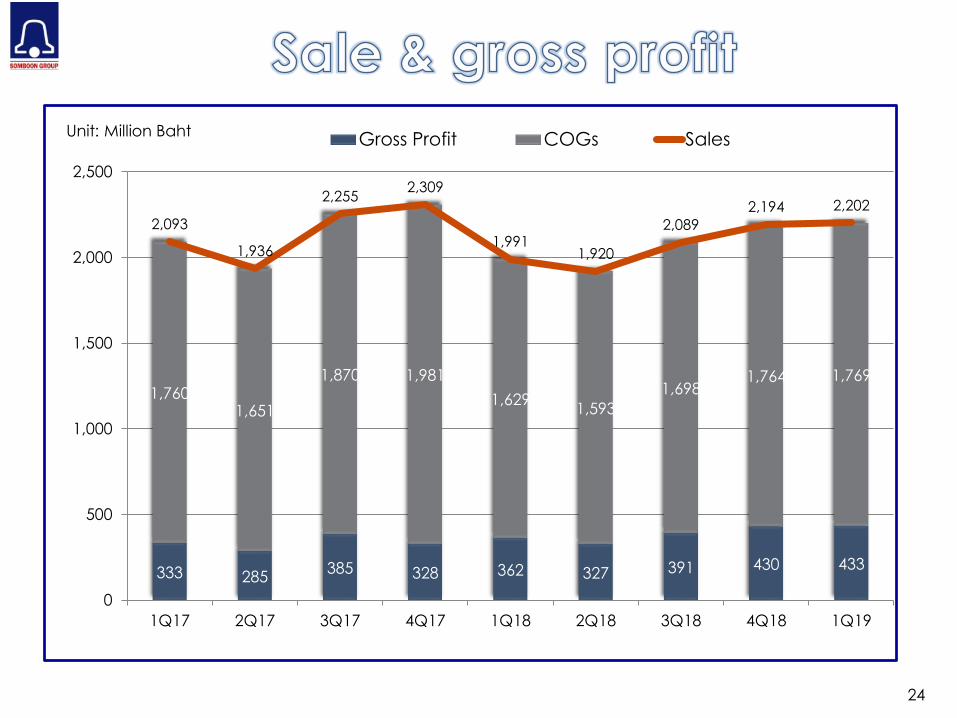
333 285385 328 362 327 391 430 433
1,7601,651
1,870 1,981
1,6291,593
1,6981,764 1,769
2,093
1,936
2,2552,309
1,9911,920
2,089
2,194 2,202
0
500
1,000
1,500
2,000
2,500
1Q17 2Q17 3Q17 4Q17 1Q18 2Q18 3Q18 4Q18 1Q19
Gross Profit COGs SalesUnit: Million Baht

25
430 433
1,764 1,769
19.6% 19.7%
0%
5%
10%
15%
20%
25%
0
500
1,000
1,500
2,000
2,500
4Q18 1Q19
Gross Profit COGs %GP
QoQ Comparison➢ Sale 0.4%
➢ COGS 0.3%
➢ GP (amount) 0.7%
➢ %GP 0.1%
• Sale increased by 8 MB or 0.4%
mainly from the improvement of
the agricultural machinery
industry and sales from direct
export.
Unit: Million Baht %GP
26
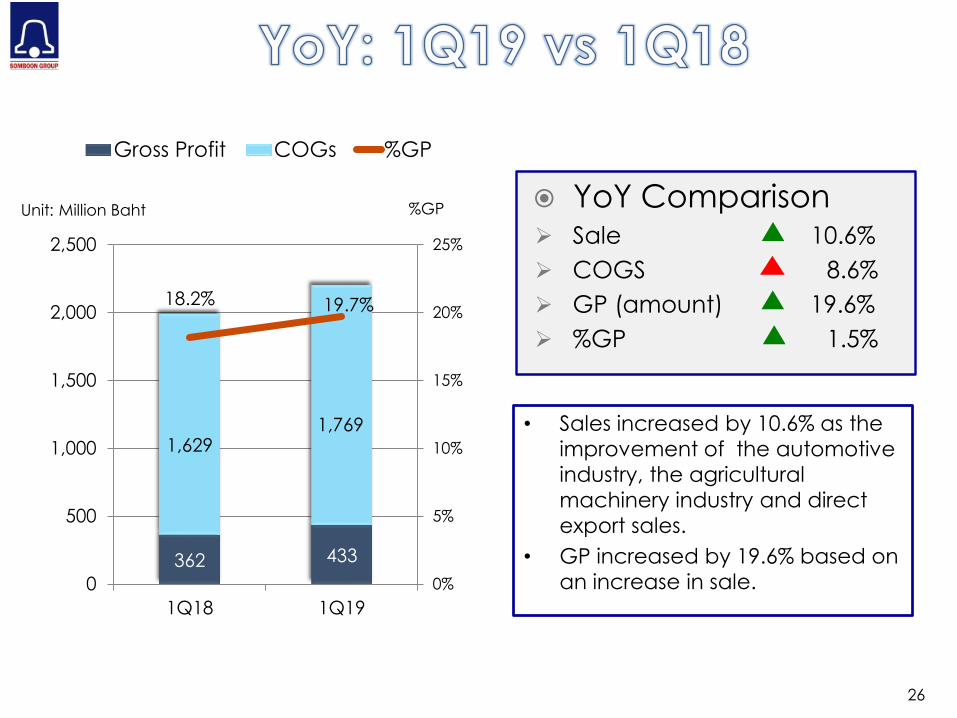
362 433
1,6291,769
18.2% 19.7%
0%
5%
10%
15%
20%
25%
0
500
1,000
1,500
2,000
2,500
1Q18 1Q19
Gross Profit COGs %GP
YoY Comparison➢ Sale 10.6%
➢ COGS 8.6%
➢ GP (amount) 19.6%
➢ %GP 1.5%
• Sales increased by 10.6% as the
improvement of the automotive
industry, the agricultural
machinery industry and direct
export sales.
• GP increased by 19.6% based on
an increase in sale.
Unit: Million Baht %GP
27
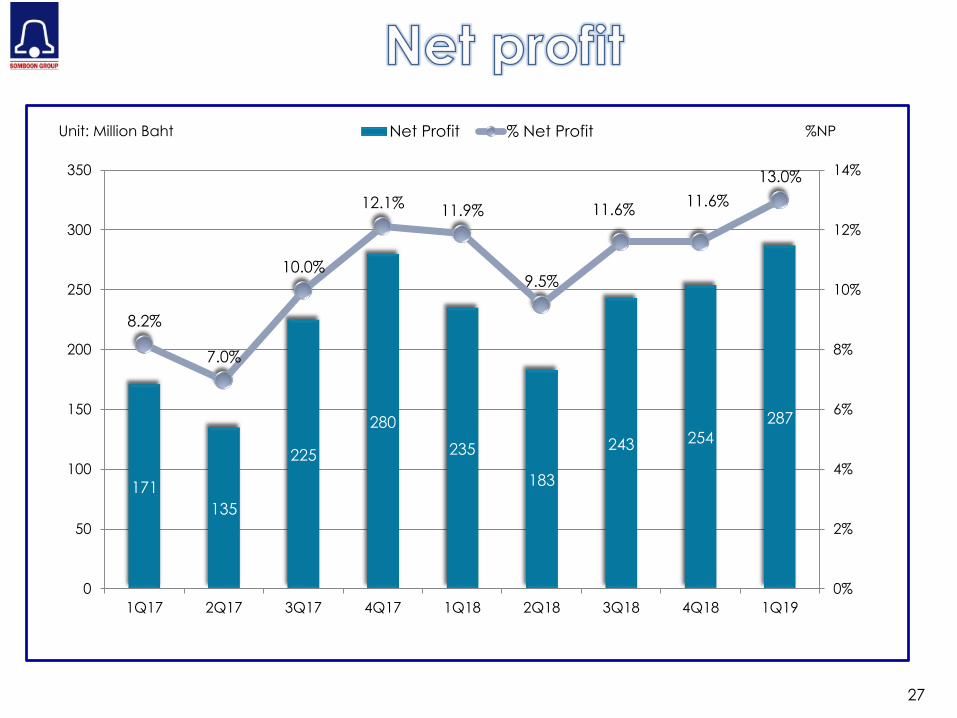
171
135
225
280
235
183
243 254
287
8.2%
7.0%
10.0%
12.1%11.9%
9.5%
11.6%11.6%
13.0%
0%
2%
4%
6%
8%
10%
12%
14%
0
50
100
150
200
250
300
350
1Q17 2Q17 3Q17 4Q17 1Q18 2Q18 3Q18 4Q18 1Q19
Net Profit % Net Profit %NPUnit: Million Baht

28
Note: 1 Others include gain/loss on fx , other incomes, and other expenses
1
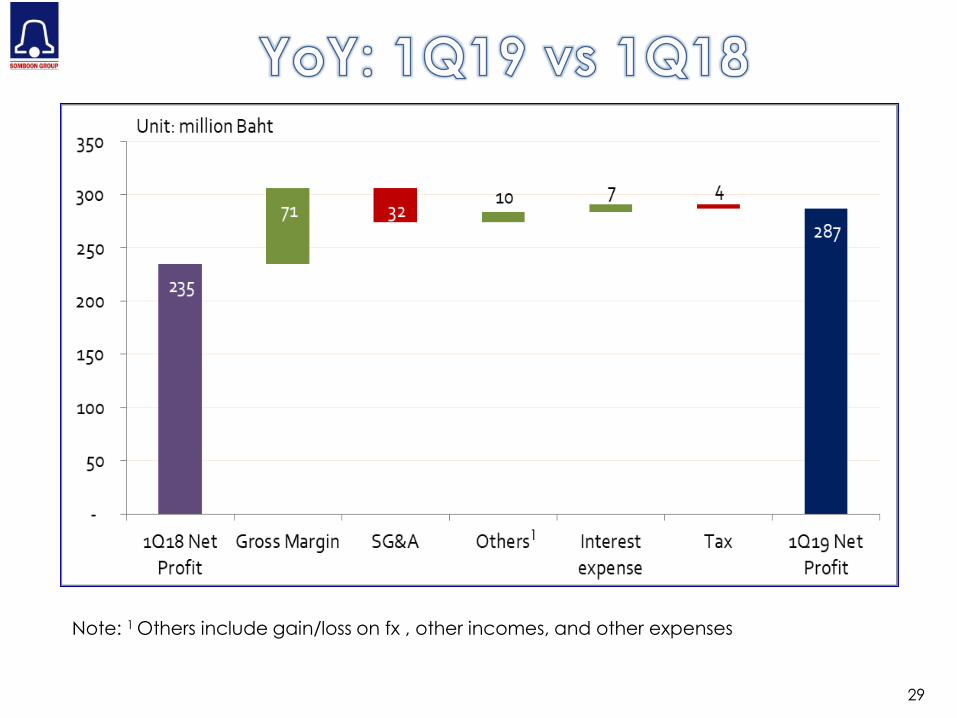
29
Note: 1 Others include gain/loss on fx , other incomes, and other expenses
1

30
397362
462
519
435
371
439 448478
19.0% 18.7%
20.5%
22.5%21.8%
19.3%
21.0% 20.5%21.7%
0%
5%
10%
15%
20%
25%
0
100
200
300
400
500
600
1Q17 2Q17 3Q17 4Q17 1Q18 2Q18 3Q18 4Q18 1Q19
EBITDA % EBITDAUnit: Million Baht %EBITDA

1.4
8
1.4
8
1.9
7 2.1
2
1.0
5
2.2
7
1.1
9
2.4
0
2.0
0
1.5
3
1.5
1
1.4
3
1.9
1
2.1
5
0.4
5
0.5
0 0.7
0
0.3
0
0.0
0
0.9
0
0.4
5
0.9
7
0.7
5
0.6
0
0.6
0
0.6
0
0.9
0
1.3
5
30% 34%36%
14%
0%
40%38%
40%38% 39% 40%
42%
47%
63%
0%
10%
20%
30%
40%
50%
60%
70%
0.00
0.50
1.00
1.50
2.00
2.50
3.00
2005 2006 2007 2008 2009 2010 2011 2012 2013 2014 2015 2016 2017 2018
EPS DPS %Dividend Payout
31
Unit: Baht per Share Unit: % Payout
Note: Dividend policy at a minimum rate of 30% of net profit after tax and legal reserve

32
Awards from customer
❖ TCC HRD Activity 2017 from Toyota
❖ The Winner TPS Award 2017 from Toyota
❖ MCC QCC Activity 2017 from Mitsubishi
❖ Quality Award and Delivery 2017 from
Kubota
❖ SKC Delivery Skill Contest 2017 from Kubota
❖ RUNNER UP SKC Delivery Kaizen Award 2017
from Kubota
❖ Gold Award QCD 2017 from Kubota
❖ Quality Award and Delivery 2017 from Isuzu
Awards from various agencies
❖ Sustainability Awards of Honor 2018 from SET
❖ Thailand Sustainability Investment 2018 (THIS)
from SET
❖ Best Investor Relations Awards 2017-2018 from
SET
❖ Best IR Awards 2015-2016 from IAA
❖ Gold Level Thailand HR Innovation Award
2017, the highest award from the National
Institute for Productivity in collaboration with
the PMAT & NIDA
❖ CSR-DIW Continuous Award 2017 from DIW

33
Unit : Million Baht 1Q17 2Q17 3Q17 4Q17 1Q18 2Q18 3Q18 4Q18 1Q19 QoQ YoY Y2017 Y2018 YoY
Sales 2,093 1,936 2,255 2,309 1,991 1,920 2,089 2,194 2,202 0.4% 10.6% 8,593 8,194 -4.6%
Total Revenue 2,109 1,959 2,275 2,459 2,020 1,952 2,118 2,218 2,235 0.8% 10.6% 8,802 8,308 -5.6%
Gross Margin 333 285 385 328 362 327 391 430 433 0.7% 19.6% 1,331 1,510 13.4%
SG&A 167 164 167 182 151 170 168 194 184 -5.2% 21.9% 680 683 0.4%
FOREX Gain (Loss) 2 2 2 2 2 1 2 1- 0 -132.0% -92.0% 8 4 -49.5%
Interest Expense 17 15 14 12 10 6 4 3 3 -3.1% -72.6% 57 23 -60.2%
Net Profit 171 135 225 280 235 183 243 255 287 12.5% 22.1% 811 916 12.9%
Net Profit excluding fx 169 133 223 278 233 182 241 256 287 12.3% 23.1% 803 912 13.5%
EBITDA 397 362 462 519 435 371 439 449 478 6.5% 10.0% 1,741 1,694 -2.7%
Cash Flow from Operating 298 421 521 385 165 410 509 369 359 -2.7% 118.2% 1,625 1,453 -10.6%
Depreciation 192 198 199 200 166 165 167 165 161 -2.4% -3.0% 789 663 -16.0%
CAPEX 46 71 57 121 56 105 87 109 52 -52.3% -7.1% 295 357 21.0%
Effective Tax Rate 9% 10% 10% 9% 9% 9% 9% 9% 9% -0.6% 0.4% 9% 9% 0.0%
Total Assets 9,439 9,217 9,328 9,572 9,128 8,787 8,953 9,065 9,401 3.7% 3.0% 9,572 9,065 -5.3%
Interest Bearing Debt 1,574 1,386 1,199 1,207 747 422 390 309 281 -9.1% -62.4% 1,207 309 -74.4%
Total Liabilities 3,382 3,200 3,191 3,152 2,473 2,225 2,299 2,178 2,228 2.3% -9.9% 3,152 2,178 -30.9%
Equity 6,058 6,017 6,137 6,420 6,656 6,562 6,654 6,887 7,174 4.2% 7.8% 6,420 6,887 7.3%
Key Financial Ratios 1Q17 2Q17 3Q17 4Q17 1Q18 2Q18 3Q18 4Q18 1Q19 QoQ YoY Y2017 Y2018 YoY
%GP 15.9% 14.7% 17.1% 14.2% 18.2% 17.0% 18.7% 19.6% 19.7% 0.1% 1.5% 15.5% 18.4% 2.9%
%SG&A 8.0% 8.5% 7.4% 7.9% 7.6% 8.9% 8.0% 8.8% 8.4% -0.5% 0.8% 7.9% 8.3% 0.4%
%NP 8.2% 7.0% 10.0% 12.1% 11.8% 9.5% 11.6% 11.6% 13.0% 1.4% 1.2% 9.2% 11.0% 1.8%
%NP excluding fx 8.1% 6.9% 9.9% 12.0% 11.7% 9.5% 11.6% 11.6% 13.0% 1.4% 1.3% 9.1% 11.0% 1.9%
%EBITDA 19.0% 18.7% 20.5% 22.5% 21.8% 19.3% 21.0% 20.5% 21.7% 1.3% -0.1% 19.8% 20.4% 0.6%
%ROA 7.1% 5.8% 9.7% 11.8% 10.1% 8.1% 10.6% 10.9% 12.4% 1.4% 2.3% 8.5% 10.1% 1.6%
EBITDA/CAPEX 8.63 5.10 8.11 4.29 7.76 3.53 5.05 4.12 9.20 5.08 1.44 5.90 4.74 -1.2
%ROE 11.7% 9.3% 15.2% 18.2% 14.8% 11.6% 15.2% 15.3% 16.6% 1.3% 1.8% 12.6% 13.3% 0.7%
%ROIC 9.8% 8.1% 12.9% 16.6% 15.3% 10.5% 13.7% 13.9% 15.6% 1.7% 0.3% 9.1% 10.4% 1.3%
Interest bearing Debt/Equity 0.26 0.23 0.20 0.19 0.11 0.06 0.06 0.04 0.04 -0.01 -0.07 0.19 0.04 -0.14
D/E 0.56 0.53 0.52 0.49 0.37 0.34 0.35 0.32 0.31 -0.01 -0.06 0.49 0.32 -0.17
EPS (Baht) 0.40 0.32 0.53 0.66 0.55 0.43 0.57 0.60 0.68 12.5% 22.1% 1.91 2.15 12.7%
BVPS (Baht) 14.25 14.16 14.44 15.11 15.66 15.44 15.66 16.20 16.88 4.2% 7.8% 15.11 16.20 7.3%
34
Somboon Advance Technology Public Company Limited – Investor Relations Department
Tel. +66 2 080 8197, Fax. +66 2 080 8198 , Email : [email protected], Website : http://www.satpcl.co.th