Embed Size (px)
Citation preview

LBNL-46141
Opportunities to Improve EnergyEfficiency and Reduce Greenhouse GasEmissions in the U.S. Pulp and PaperIndustry
N. Martin, N. Anglani, D. Einstein, M. Khrushch,
E. Worrell, and L.K. Price
Environmental EnergyTechnologies Division
July 2000
This work was supported by the Climate Protection Division, Office of Air and Radiation, U.S.Environmental Protection Agency through the U.S. Department of Energy under Contract No.DE-AC03-76SF00098.
ERNEST ORLANDO LAWRENCEBERKELEY NATIONAL LABORATORY

Disclaimer
This document was prepared as an account of work sponsored by the United StatesGovernment. While this document is believed to contain correct information, neitherthe United States Government nor any agency thereof, nor The Regents of theUniversity of California, nor any of their employees, makes any warranty, express orimplied, or assumes any legal responsibility for the accuracy, completeness, orusefulness of any information, apparatus, product, or process disclosed, or representsthat its use would not infringe privately owned rights. Reference herein to any specificcommercial product, process, or service by its trade name, trademark, manufacturer, orotherwise, does not necessarily constitute or imply its endorsement, recommendation,or favoring by the United States Government or any agency thereof, or The Regents ofthe University of California. The views and opinions of authors expressed herein donot necessarily state or reflect those of the United States Government or any agencythereof, or The Regents of the University of California.
Ernest Orlando Lawrence Berkeley National Laboratory is an equalopportunity employer.

1
Opportunities to Improve Energy Efficiency and Reduce Greenhouse Gas Emissionsin the U.S. Pulp and Paper Industry
N. Martin, N. Anglani, D. Einstein, M. Khrushch, E. Worrell, L.K. Price
Energy Analysis DepartmentEnvironmental Energy Technologies Division
Ernest Orlando Lawrence Berkeley National Laboratory
ABSTRACTThe pulp and paper industry accounts for over 12% of total manufacturing energy use in the
U.S. (U.S. EIA 1997a), contributing 9% to total manufacturing carbon dioxide emissions. In the lasttwenty-five years primary energy intensity in the pulp and paper industry has declined by anaverage of 1% per year.
However, opportunities still exist to reduce energy use and greenhouse gas emissions in themanufacture of paper in the U.S. This report analyzes the pulp and paper industry (StandardIndustrial Code (SIC) 26) and includes a detailed description of the processes involved in theproduction of paper, providing typical energy use in each process step. We identify over 45commercially available state-of-the-art technologies and measures to reduce energy use andcalculate potential energy savings and carbon dioxide emissions reductions. Given the importanceof paper recycling, our analysis examines two cases. Case A identifies potential primary energysavings without accounting for an increase in recycling, while Case B includes increasing paperrecycling. In Case B the production volume of pulp is reduced to account for additional pulprecovered from recycling. We use a discount rate of 30% throughout our analysis to reflect theinvestment decisions taken in a business context.
Our Case A results indicate that a total technical potential primary energy savings of 31%(1013 PJ) exists. For case A we identified a cost-effective savings potential of 16% (533 PJ).Carbon dioxide emission reductions from the energy savings in Case A are 25% (7.6 MtC) and 14%(4.4 MtC) for technical and cost-effective potential, respectively. When recycling is included inCase B, overall technical potential energy savings increase to 37% (1215 PJ) while cost-effectiveenergy savings potential is 16%. Increasing paper recycling to high levels (Case B) is nearly cost-effective assuming a cut-off for cost-effectiveness of a simple payback period of 3 years. If thismeasure is included, then the cost-effective energy savings potential in case B increases to 22%.

2

3
TABLE OF CONTENTS
ABSTRACT ......................................................................................................................................... 1
I. INTRODUCTION....................................................................................................................... 6
II. OVERVIEW OF THE U.S. PULP AND PAPER INDUSTRY ........................................................ 6
III. PROCESS DESCRIPTION.......................................................................................................... 8
Raw Materials Preparation ................................................................................................................ 8Pulping............................................................................................................................................. 8Mechanical Pulping.......................................................................................................................... 8Chemical Pulping ........................................................................................................................... 10Semi-Chemical Pulping................................................................................................................... 11Chemical Recovery......................................................................................................................... 11Extended Delignification................................................................................................................. 12Bleaching ....................................................................................................................................... 12Pulp Drying .................................................................................................................................... 13Papermaking................................................................................................................................... 13
IV. HISTORICAL ENERGY USE AND CARBON DIOXIDE EMISSIONS IN THE U.S. PULP ANDPAPER INDUSTRY .................................................................................................................. 14
V. 1994 BASELINE ENERGY USE AND CARBON DIOXIDE EMISSIONS ................................... 16
Energy Consumption .......................................................................................................................... 16
Carbon Dioxide Emissions Baseline.................................................................................................... 19
VI. ENERGY EFFICIENCY TECHNOLOGIES AND MEASURES FOR THE U.S. PULP AND PAPERINDUSTRY............................................................................................................................... 19
Raw Materials Preparation ................................................................................................................ 22Ring style debarkers........................................................................................................................ 22Cradle Debarker............................................................................................................................. 22Enzyme-assisted debarker ............................................................................................................... 22Bar-type chip screens...................................................................................................................... 22Chip conditioners ........................................................................................................................... 22Improved Screening Processes –Screen out thick chips................................................................... 22Belt conveyers ................................................................................................................................ 23Fine-slotted wedge wire baskets ...................................................................................................... 23
Mechanical Pulping............................................................................................................................ 23Refiner Improvements ..................................................................................................................... 23Biopulping...................................................................................................................................... 23
Thermo-Mechanical Pulping............................................................................................................... 24RTS (short Residence time, elevated Temperature , high Speed)....................................................... 24LCR (Low Consistency Refining)..................................................................................................... 24Thermopulp .................................................................................................................................... 24Super Pressurized GroundWood ..................................................................................................... 25Heat recovery in thermomechanical pulping.................................................................................... 25Improvements in Chemi-ThermoMechanical Pulping....................................................................... 25

4
Chemical Pulping............................................................................................................................... 26Continuous digesters....................................................................................................................... 26Continuous digester modifications .................................................................................................. 26Batch digester modification............................................................................................................. 26
Chemical Recovery............................................................................................................................. 27Falling film black liquor evaporation .............................................................................................. 27Tampella recovery system ............................................................................................................... 27Lime kiln modifications ................................................................................................................... 27
Extended Delignification .................................................................................................................... 28Extended Cooking in Continuous Digesters ..................................................................................... 28Oxygen delignification .................................................................................................................... 28
Bleaching ........................................................................................................................................... 28Ozone bleaching ............................................................................................................................. 28Oxidative extraction........................................................................................................................ 29Biobleaching (Enzyme Bleaching) ................................................................................................... 29Improved brownstock washing ........................................................................................................ 29Washing presses ............................................................................................................................. 29
Stock preparation and sheet formation................................................................................................ 30Gap forming ................................................................................................................................... 30High consistency forming................................................................................................................ 30Extended nip press (Shoe press) ...................................................................................................... 31Hot pressing ................................................................................................................................... 31Direct drying cylinder firing ........................................................................................................... 31Reduced air requirements (closing hoods and optimizing ventilation) .............................................. 31Waste heat recovery........................................................................................................................ 32Condebelt drying ............................................................................................................................ 32Infrared profiling............................................................................................................................ 32Dry sheet forming ........................................................................................................................... 33
General Measures ............................................................................................................................. 33
Pinch Analysis ................................................................................................................................ 33Optimization of regular equipment .................................................................................................. 33Energy-efficient lighting.................................................................................................................. 33Efficient motor systems ................................................................................................................... 34
Efficient Steam Production and Distribution ...................................................................................... 34
Boiler maintenance ......................................................................................................................... 34Improved process control................................................................................................................ 34Flue gas heat recovery.................................................................................................................... 34Blowdown steam recovery............................................................................................................... 35Steam trap maintenance.................................................................................................................. 35Automatic steam trap monitoring .................................................................................................... 35Leak repair ..................................................................................................................................... 35Condensate return .......................................................................................................................... 35
Other Measures.................................................................................................................................. 36Increased use of recycled pulp (only included in Case B)................................................................. 36Increased combined heat and power................................................................................................ 36
Advanced Technologies ..................................................................................................................... 36
Alcohol based solvent pulping ......................................................................................................... 36Black liquor gasification with gas turbine ....................................................................................... 37Impulse drying................................................................................................................................ 37

5
Infrared drying ............................................................................................................................... 37Pre-treatment of incoming pulp into drying section ......................................................................... 38Air impingement drying .................................................................................................................. 38Steam impingement drying .............................................................................................................. 38Airless drying ................................................................................................................................. 38Press drying ................................................................................................................................... 38
VII. ENERGY EFFICIENCY AND CARBON DIOXIDE EMISSIONS REDUCTION ......................... 38
Supply Curve Methodology................................................................................................................. 38
Case A: Cost-Effective Energy and Carbon Savings without Recycling................................................ 39
Case B: Cost-Effective Energy and Carbon Savings with Recycling..................................................... 43
VIII. SUMMARY AND CONCLUSIONS............................................................................................ 45
IX. FUTURE AREAS OF RESEARCH ............................................................................................ 45
X. ACKNOWLEDGEMENTS............................................................................................................. 45
XI REFERENCES ......................................................................................................................... 46
APPENDIX A. NATIONAL ENERGY SAVINGS AND CARBON DIOXIDE EMISSIONS REDUCTIONSRESULTS ................................................................................................................................. 56
TABLES
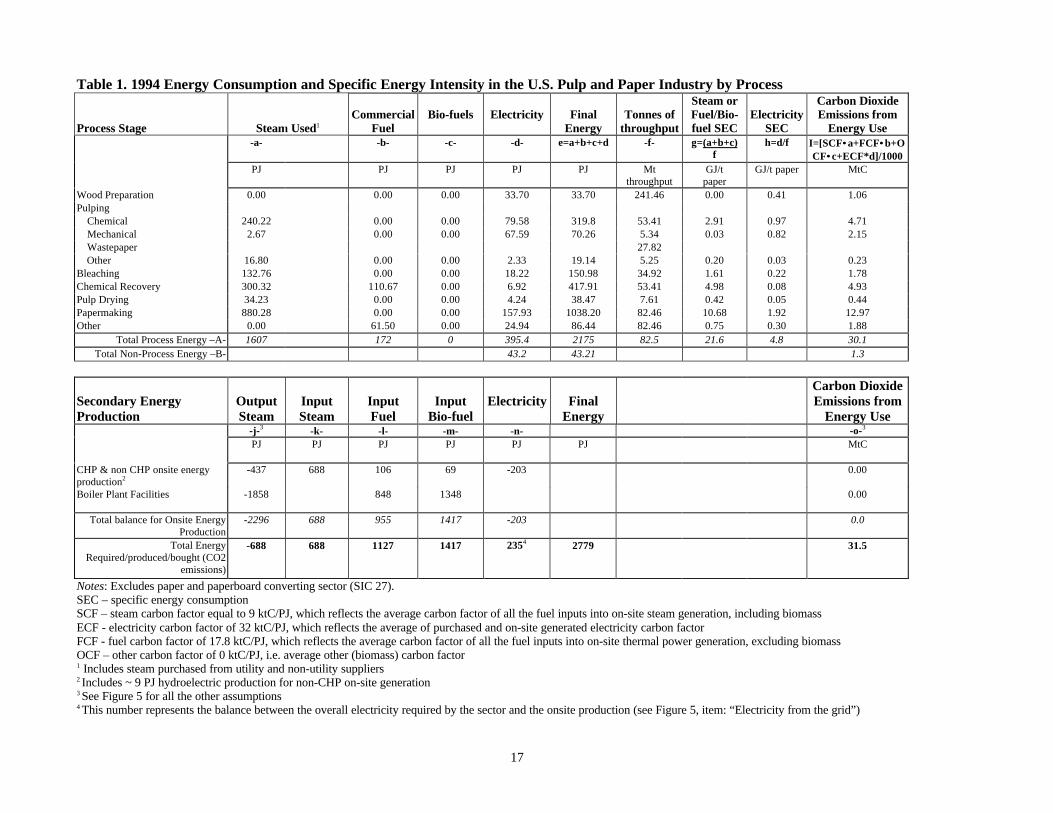
Table 1. 1994 Energy Consumption and Specific Energy Intensity in the U.S. Pulp and Paper Industry byProcess ........................................................................................................................................... 17
Table 2. Energy Consumption, Carbon Emissions Coefficients, and Carbon Emissions from EnergyConsumption for the U.S. Pulp and Paper Industry (SIC 26) in 1994................................................ 19
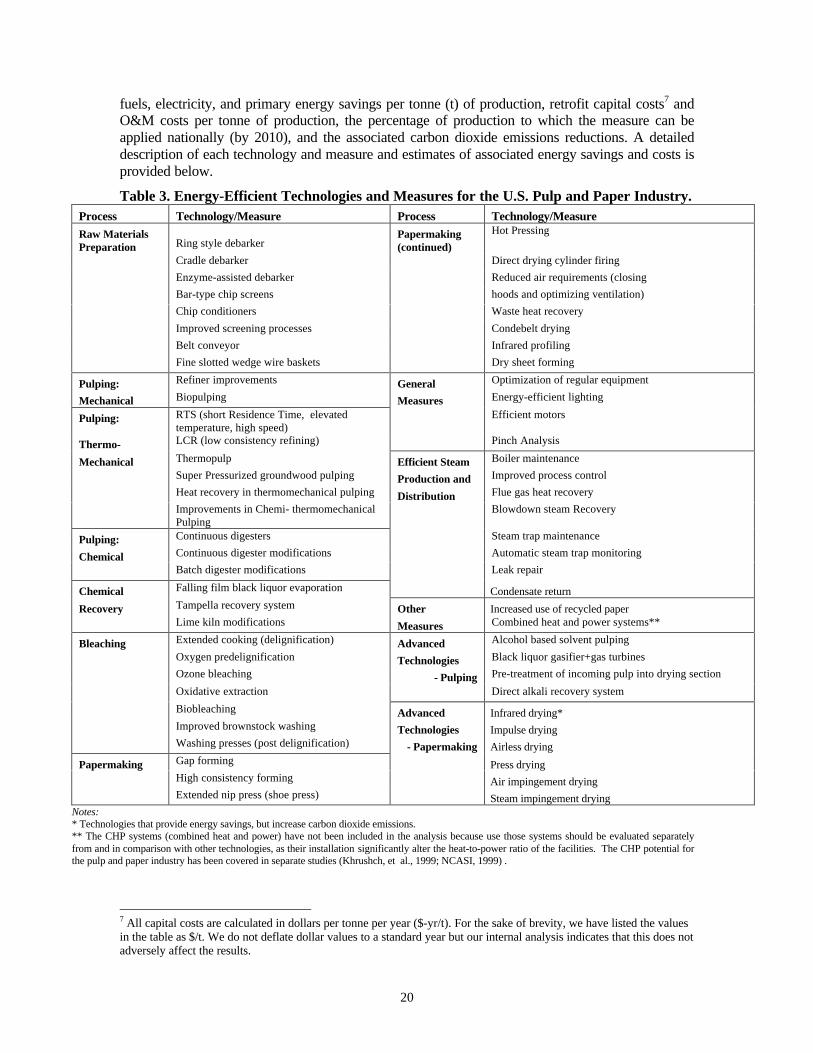
Table 3. Energy-Efficient Technologies and Measures for the U.S. Pulp and Paper Industry. ................... 20Table 4. Energy Savings, Costs, and Carbon Dioxide Emissions Reductions for Energy-Efficient
Technologies and Measures Applied to the U.S. Pulp and Paper Industry in 1994. ........................... 21Table 5. Annual operating costs saved for three modern alternative washing systems............................... 29Table 6. Case A: Cost of Conserved Energy for Selected Measures in U.S. Pulp and Paper Industry ........ 42Table A-1 National Energy Savings And Carbon Dioxide Emissions Reductions..................................... 56
FIGURES
Figure 1. U.S. Paper Production by Process, 1970 to 1994........................................................................ 7Figure 2. Schematic of the Pulp and Papermaking Process......................................................................... 9Figure 3. Primary Energy Use in U.S. Paper Production ......................................................................... 15Figure 4. Carbon Dioxide Emissions from Fuel Consumption in U.S. Paper Production.......................... 16Figure 5. Estimate of Energy Flow (PJ) and Carbon Dioxide Emissions (MtC) in the U.S. Pulp and Paper
Industry –1994................................................................................................................................ 18Figure 6. Case A: Energy Conservation Supply Curve for U.S. Pulp and Paper Industry (Excluding
increased recyling of waste paper)................................................................................................... 40Figure 7. Case A: Carbon Dioxide Emission Reduction Supply Curve for U.S. Pulp and Paper Industry .. 41Figure 8. Case B: Energy Conservation Supply Curve for U.S. Pulp and Paper Industry (Including
increased recycling of waste paper) ................................................................................................. 44Figure 9. Case B: Carbon Dioxide Emission Reduction Supply Curve for U.S. Pulp and Paper Industry... 45

6
I. INTRODUCTION
In 19941 the U.S. manufacturing sector consumed 22.8 EJ of primary energy, almost one-quarter ofall energy consumed that year in the United States (U.S. EIA 1997a).2 Within manufacturing, asubset of raw materials transformation industries (pulp and paper, primary metals, cement,chemicals, petroleum refining) require significantly more energy to produce or transform productsthan most other manufactured products. This report reflects an in-depth analysis of one of theseenergy-intensive industries – pulp and paper.
The manufacture of paper and paperboard is an important element of a modern economy. It alsois a highly capital and energy-intensive process. International comparisons show that U.S.papermaking energy intensities are greater than those in many other countries (Farla et al., 1997).As such, opportunities exist for increasing energy efficiency in the pulp and paper industry in theU.S.
This paper is divided into six sections. After providing an overview of the U.S. pulp and paperindustry (Section II), we describe the various stages of the pulp and papermaking process (SectionIII). We then present information on the industry’s historical energy use and carbon dioxideemissions (Section IV). This is followed by a more detailed breakdown of energy use in our baseyear of analysis (Section V). In Section VI we describe the various technologies and measures thatwe assessed in our efficiency analysis, including estimates of costs and energy savings. Finally,we estimate technical and cost-effective potential energy savings and the associated carbondioxide emissions reductions from the investment in various technologies and measures (SectionVII) followed by a summary and conclusion (Section VIII).
II. OVERVIEW OF THE U.S. PULP AND PAPER INDUSTRY
The health of the U.S. pulp and paper industry in an increasingly competitive global paper market ishighly dependent upon an accessible fiber resource base, continuing capital investments, themaintenance of a pool of skilled labor, and demand powered by the growth in the economy. TheUnited States, with its developed economy, growing population income, vast forest resources, largepool of skilled labor and access to capital is the largest producer of pulp and paper in the world. TheU.S. pulp and paper industry is made up of three primary types of producers: i) pulp mills, whichmanufacture pulp from wood or other materials, primarily wastepaper; ii) paper mills, whichmanufacture paper from wood pulp and other fiber pulp; and iii) paperboard mills, whichmanufacture paperboard products from wood pulp and other fiber pulp.
There were 190 operating pulp mills and 598 operating paper and paperboard mills in the U.S. in1996. About 58% of all the paper/paperboard mills are located in the Northeast and the NorthCentral regions, close to final consumers. However, 56% of the paper/paperboard capacity andmore than 70% of wood pulp capacity are located in the South Atlantic and the South Centralregions, close to the sources of fibers. Mills located in those regions are mostly large integrated pulpand paper mills (Kincaid, 1998). More than 45% of all paper and paperboard and about 60% of allwood pulp are produced by mills with capacity over 450 tonnes per year (tpy). The average capacityof an U.S. paper/paperboard mill in 1995 was about 168 tpy, while the average capacity of a woodpulp mill was about 330 tpy. 1 We use a base year of 1994 throughout our analysis since these are the latest available nationally published energydata by the U.S. Energy Information Administration.2 Primary energy accounts for losses in electricity transmission and distribution and is calculated using a conversionrate from final to primary electricity of 3.08, reflecting the difference between an average power plant heat rate of10,500 Btu/kWh and a site rate of 3412 Btu/kWh. To convert from EJ to Quads, from PJ to TBtu, and from GJ toMBtu, multiply by 0.95; to convert from metric tons to short tons, multiply by 1.1; to convert from GJ/metric tonne toMBtu/short ton, multiply by 0.86.

7
Virgin pulp is used to produce a variety of pulps in the U.S., most importantly chemical pulp,semi-chemical pulp, mechanical pulp, dissolving pulp, and pulp made from non-wood fibers.Total U.S. pulp production increased from 37.9 Mt (Million tonnes) in 1970 to 60.0 Mt in 1994,at a rate of 1.9% per year, though growth has slowed slightly in recent years (UN, 1998). Pulpproduction increased at a 2.2% average annual rate between 1970 and 1980, decreasing to anaverage of 1.8% per year between 1980 and 1994. Overall, pulp production increased steadily,with periodic minor decreases. In 1970, chemical pulp accounted for 77% of pulp production,while mechanical and other pulp, accounted for 9.8% and 13.5%, respectively. While total pulpproduction has increased significantly since 1970, the composition of U.S. pulp production haschanged little; chemical pulp production has become more dominant, comprising 82% of totalpulp production while mechanical pulp production has fallen to 9%. In addition to the varioustypes of raw pulp, recovered paper is used as a raw material in producing paper products.Recovered paper use has grown from 8.4 Mt in 1961 to 33.3 Mt in 1997, at an average rate of3.9% per year.
Figure 1. U.S. Paper Production by Process, 1970 to 1994
Source: UN, 1998.
Paper production in the U.S. consists primarily of wrapping and packaging paper, paperboard, andprinting and writing paper, which made up about 80% of U.S. paper production in 1994. Theremainder is made up of newsprint, household and sanitary paper, and paper and paperboard notelsewhere specified, a catch-all category for such paper products as Kraft paper, blotting paper, andfilter paper. Total U.S. paper production increased from 45.81 Mt in 1970 to 82.46 Mt in 1994, anaverage increase of 2.5% per year. Growth has slowed slightly in recent years, though paperproduction still increased at 2.2% per year between 1970 and 1980, and 2.7% per year between1980 and 1994. In 1970 the shares of paper by type were: 57% wrapping and packaging paper, 21%printing and writing paper, 7% household and sanitary paper, 7% newsprint, and 8% paper notelsewhere specified (see Figure 1). Although the share of wrapping and packaging paper fell from
0
10
20
30
40
50
60
70
80
90
100
1970
1972
1974
1976
1978
1980
1982
1984
1986
1988
1990
1992
1994
Year
Mill
on
to
nn
es Other paper and paperboard
Sanitary and household
Wrapping and packaging
Printing and writing paper
Newsprint

8
57% to 51% by 1994, and the share of printing and writing paper increased from 21% to 28% therewere no other major structural changes. The share of newsprint increased from 7% to 8%, the shareof household paper remained the same, and the share of paper not elsewhere specified increasedfrom 4% to 5%. The primary change in the sector over the period was the decline in wrapping andpackaging paper and the increase in printing and writing paper.
III. PROCESS DESCRIPTION
The pulp and paper industry converts fibrous raw materials into pulp, paper, and paperboard. Theprocesses involved in papermaking include raw materials preparation, pulping (chemical, semi-chemical, mechanical, or waste paper), bleaching, chemical recovery, pulp drying, andpapermaking. A flow diagram of the processes is shown in Figure 2. The most significant energy-consuming processes are pulping and the drying section of papermaking.
Raw Materials PreparationIn 1994 wood pulp accounted for 68% of paper production by weight, with used paper (discussedunder pulping) covering the remaining 32% (Kincaid, 1998). The main raw materials preparationoperations typically include debarking, chipping, and conveying. Logs are transported to pulpingmills where the bark is treated. Several of these logs are then placed in a rotating drum, whererubbing against each other and the edge of the drum removes the bark (Saltman, 1978), which isthen used for fuel. In some cases, hydraulic debarking is used, but this is more energy intensive, andrequires the bark to be pressed before it can be used for fuel. Debarking requires about 8.5 kWh ofelectricity per tonne of raw material (Elaahi and Lowitt, 1988; Nilson et al., 1995; Giese, 1989;Giraldo and Hyman, 1994; Jaccard and Willis, 1996). After debarking the logs are chipped, mostoften in a radial chipper. Energy is used in conveyors to transport chips to the digesters. Theseprocesses consume about 30.3 kWh/t raw material (Elaahi and Lowitt, 1988; Nilson et al., 1995;Giese, 1989; Giraldo and Hyman, 1994; Jaccard and Willis, 1996).
PulpingThe next stage in the papermaking process is pulping. The primary purpose of pulping is to free thefibers from the lignin that binds the fibers together in wood, and then to suspend the fibers in water.Typical wood consists of about 50% fiber, 20-30% non-fibrous sugars, and 20-30% lignin (Kline,1991). Pulp with longer fibers and less lignin is considered best, in order to produce the strongestpaper with the greatest resistance to aging. There are three main pulping processes: mechanical,chemical, and semi-chemical. Of these, the Kraft chemical pulping process accounts for themajority of U.S. pulp production today (Kincaid, 1998).
Mechanical PulpingMechanical pulping is the original form of pulping and although it has been largely replaced bychemical pulping, it is still used for lower grade papers such as newsprint and is the only processused for recycled paper. The main subdivisions of this method are stone groundwood pulping,refiner pulping, thermomechanical pulping (TMP), and recycled paper pulping. Mechanical pulpaccounted for 9% of production in 1994 (Kincaid, 1998). The principle behind all mechanicalpulping is to take a raw material and grind it down into individual fibers. The advantage ofmechanical pulping is that it produces much higher yields than chemical pulping (90-95% of thewood ends up as usable pulp). However, a problem with leaving impurities in the pulp is that itproduces a weaker paper with less resistance to aging. The weakening effect is compounded by thefact that the grinding action of mechanical pulping produces shorter fibers (Kincaid, 1988).
Stone groundwood pulping is the oldest and least energy-intensive mechanical pulping process,using approximately 1650 kWh/t pulp (Elaahi and Lowitt, 1988; Jaccard and Willis, 1996). This

9
process takes small logs and grinds them against artificial bonded stones made of silicon carbide oraluminium oxide grits. These stones can be submerged (pit grinding) or sprayed with water to keepthem cool while maintaining grinding performance and fiber quality. The advantage of this methodis its very high yield. The disadvantages are that the fibers produced are very short and often mustbe combined with strong but expensive chemical fibers to be strong enough to pass through thepaper machine, coaters and printing processes.
Figure 2. Schematic of the Pulp and Papermaking Process
Used Paper
Wood Preparation Bark (hog fuel)
Electricity
Pulping Steam
Electricity
Electricity
Bleaching Steam
Electricity
Chemical Recovery Steam
Electricity
Steam
Electricity
Fuel
Electricity
Pulp DryingSteam
Electricity
Electricity
Papermaking Steam
Electricity
Electricity
Steam
Electricity
Steam
Electricity
Trees
Barking
Chipping
Bleach plant Bleach Plant
Refiner
Mechanical Pulping
Chemical Pulping
unbleached pulp
unbleached pulp
bleached pulp
bleached pulp
Recausticization
Liquor concentration
Energy Recovery
Thick black liquor
green liquor
Waste paper Pulping
Kneading
deinked pulp
white liquor
Forming
Pressing
Drying
Stock Preparation
Pulp Drier
Repulper
market pulp

10
Refiner pulping keeps the high yield advantages of stone groundwood, while producing somewhatlonger fibers with greater strength. RPM (refiner-mechanical pulping) was introduced in order touse wood in chip rather than in log form. In this process, wood chips are ground between twogrooved discs. The fibers produced permit lighter weight paper to be used for printing, thusdelivering more print media area per tonne. Estimates of the energy consumption of this processvary widely throughout the published sources depending upon furnish species and desired freeness.In this analysis we estimate an average electricity consumption of about 1972 kWh/t pulp (Elaahiand Lowitt, 1988; Jaccard and Willis, 1996).
Thermomechanical pulping produces the highest grade of pulp from mechanical pulping and overthe past fifteen years has become the most common process used, despite some drawbacks (i.e.high-energy intensive process, production of darker pulp more costly to bleach). This processsteams wood chips to soften them before putting them through the same machine that is used in therefiner process. Yields are nearly as high as other mechanical processes. Average steamconsumption for this process is estimated at 0.9 GJ/t pulp while electricity consumption is estimatedto be about 2041 kWh/t pulp (Elaahi and Lowitt, 1988; Jaccard and Willis, 1996; Pulp and Paper,1998).
Chemi-thermomechanical pulp (CTMP) process entails application of chemicals to the chips priorto refining. The process begins with an impregnation of sodium sulfite and chelating agents. Themixture is then preheated at 120-130 ºC and refining follows. The chemical pre-treatment of thechips permits less destructive separation of fibers from the wood, resulting in a higher, longer fibercontent and a much lower shive content3. Other advantages of CTMP over TMP are that CTMPdelivers more flexible fibers (providing higher sheet density and higher burst and tensile strength)and provides a higher brightness before bleaching. When compared to bleached softwood kraft,CTMP has a better opacity and tear strength but it still has problems of color reversion. The majordrawback remains the high-energy demand of the process which was reported in 1985 to run 26.8GJ/t (Elaahi and Lowitt, 1988; Kincaid, 1998).
Pulp generated from recovered paper accounted for 32% of the pulp consumed in 1994 (Kincaid,1998). The machine that is responsible for most recycled paper pulping is called the Hydrapulper.Paper is dumped into the top of the hydrapulper and is pulped in a manner similar to a blender byproducing slurry. The pulp exits the bottom of the machine, while the impurities exit out the side.Objects that float and heavy objects like nuts and bolts also exit out the side. The ragger pulls largecontaminants out of the bath (Anonymous, 1995b). Since recovered paper can use considerably lessenergy in pulp production than wood-based pulp, making secondary fibers competitive with virginones can save significant energy in the mill. Modern techniques for removing contaminants fromsecondary fibers have made them competitive in all papers, except for the highest grade of paperswhere long fibers are essential. We assume an energy consumption of 392 kWh/t for waste paperpulping.
Chemical PulpingChemical pulping is by far the most common method for pulping wood in the U.S. Chemicalprocesses have a low yield (40-55%) but the pulp produced is of very high quality. These highquality pulps are mainly used for higher quality paper production, such as office paper. Chemicalprocesses accounted for 82% of the wood pulp produced in the U.S. in 1994 (AFPA, 1998).
The Kraft, or sulfate, process is the most common of the chemical processes, accounting for over95% of the chemical pulp produced in 1994 (Kincaid, 1998). In this process, the wood chips arefirst pre-steamed to soften them and force out any trapped air. Then they are combined with ahighly alkaline solution, called white liquor, which contains sodium hydroxide (NaOH), and sodiumsulfide (Na2S). All these ingredients are mixed together in a digester, where they are pressurized 3 Shives are small bundles of fibers that are not fully separated in the pulping operation.

11
and heated to 160-170°C. Over several hours, the liquid permeates the chips, and eventuallydissolves most of non-fibrous materials in the wood. After being cooked in this fashion, the chipsare separated into individual fibers by being blown into low-pressure tanks. The spent liquor anddissolved contaminants, now called black liquor, are washed away and the fibers move on to thebleaching phase. This process consumes about 4.4 GJ/t pulp of steam and around 406 kWh/t pulp ofelectricity (Elaahi and Lowitt, 1988; Jaccard and Willis, 1996, Nilsson et al., 1995; Giraldo andHyman, 1994). The black liquor can be concentrated and burned to provide the heat required for theprocess. After burning, the pulping chemicals can be extracted and reused (Elaahi and Lowitt,1988).
The other main type of chemical pulping is called the sulfite process. The two chemical processesuse very similar kinds of wood and produce a similar type of paper, but each still has its advantagesand disadvantages. The Kraft process produces pulp with longer fibers, while sulfite pulp, usinglower process temperatures, produces more white pulp with shorter fibers. The disadvantages ofsulfite pulping are the production of slightly lower strength paper and the relative difficulty ofrecovering spent chemicals. The solvent, sulfite liquor, is produced by burning sulfur and mixingthe resulting gasses with a basic solution. Similar to the Kraft process, the sulfite process allows forburning of the used liquor, allowing the pulping chemicals to be reused in the majority of mills. Dueto the disadvantage of the sulfite pulping, it is only used when special kinds of fibers are desired, i.e.in very smooth papers (Elaahi and Lowitt, 1988). Estimates of energy consumption for this processare 4.2 GJ/t pulp of steam consumption and 572 kWh/t pulp electricity consumption (Jaccard andWillis, 1996; Elaahi and Lowitt, 1988).
Semi-Chemical PulpingThe last form of pulping is a combination of chemical and mechanical pulping: semi-chemical orchemi-mechanical pulping. In both of these systems, the wood chips are chemically pre-treatedbefore they are mechanically pulped. Whether it is called chemi-mechanical or semi-chemicaldepends on whether the chemical or mechanical parts of the process are performing the largest partof the pulping. These methods are primarily used for hardwoods, which have short narrow fibers.This type of fiber does fill in areas between softwood fibers, making a smoother, denser, and moreopaque sheet of paper. This process accounted for 6% of U.S. wood pulp production in 1994 andconsumes approx. 5.3 GJ/t pulp of thermal energy and approximately 505 kWh/t of electricity(Kincaid, 1998).
Chemical RecoveryExtraction and reuse of the pulping chemicals following chemical pulping consists of three stages:black liquor concentration, energy recovery, and recaustization of the remaining liquor. Theconcentration usually takes place in Multiple Effect Evaporators (MEEs) and Direct ContactEvaporators (DCEs). The MEEs use steam to evaporate water from the black liquor, concentratingthe black liquor to about 50% solids. A DCE uses the exhaust gases from the recovery boiler todrive up the final concentration to 70-80%. Advances in this area have focused on producing MEEsystems that can handle higher solids content, thus reducing or eliminating the need for the lessefficient DCEs. Higher solids content makes the recovery boiler process more efficient.Concentration requires about 4.4 GJ of steam/t of pulp and 25 kWh of electricity/t pulp (Elaahi andLowitt, 1988; Jaccard and Willis, 1996, Nilsson et al., 1995).
The black liquor is sprayed into the recovery boiler where the remaining water evaporates. Theorganic components of the solids burn, thereby releasing the heat that dries the liquor transferringheat to boiler tubes for heat generation. The heat of this combustion smelts the remaining inorganicchemicals, which flow from the furnace and are ready for recaustization. The recovery boilerconsumes an estimated 1.1 GJ/t pulp of supplementary fuel and 58 kWh of electricity/t pulp forfurnace auxiliaries (Elaahi and Lowitt, 1988; Nilsson et al., 1995). The boiler also produces

12
between 10 and 17 GJ/t pulp of useable heat, that is used to create steam for other parts of theprocess (Elaahi and Lowitt, 1988; Jaccard and Willis, 1996, Nilsson et al., 1995). This large rangeis explained by the fact that there have been great strides in efficiency since the invention of therecovery boiler.
Most of the sulfur is reduced via chemical reaction to form one of the principal pulping chemicalcomponents contained in the smelt. The smelt from the recovery boiler is mixed with some weakwhite liquor to form green liquor. This green liquor consists mostly of sodium carbonate (Na2CO3)and sodium sulfide (Na2S). The green liquor is recausticized by the addition of calcium hydroxide(Ca(OH)2) under controlled temperature and agitation. This recaustization converts the sodiumcarbonate back to sodium hydroxide (NaOH) and leaves a precipitate of calcium carbonate(CaCO3). The precipitate is removed, and what is left is white liquor that can be reused to pulp morewood. The calcium carbonate precipitate also feeds back into the process in to the lime kiln, whereit is heated to produce lime (CaO). The lime is then dissolved in water to produce the calciumhydroxide used in recaustization. The lime kiln is usually fuelled by oil or gas, and requires onaverage 2.3 GJ/t pulp fuel and 15 kWh/t pulp electricity (Elaahi and Lowitt, 1988; Jaccard andWillis, 1996, Nilsson et al., 1995).
Extended DelignificationExtended delignification is the modification of the pulping equipment that provides a more uniformreaction of chips in the pulping process and results in greater delignification. Several alternativetechnologies are available which could be applied depending on the age, type and condition of theexisting equipment and associated recovery operations at the mill site. Mills with continuousdigesters can choose for example from Modified Continuous Cooking (MCC), Extended ModifiedContinuous Cooking (EMCC) from Ahlstrom and Isothermal Cooking (ITC) from Kvaerner. Thebatch digester options are Rapid Dispersion Heating (RDH) from Beloit, Enerbatch from Ingersoll-Rand, and Super Batch from Sunds Defibrator4. Oxygen delignification, kraft pulping additives andalternative pulping chemistry can further extend the delignification process and reduce the use ofbleaching chemicals (Pulliam, 1995).
BleachingThe removal of the remaining lignin (after chemical pulping) that is still closely bonded to the pulpoccurs through a series of bleaching stages. Prior to the late 1980s, elemental chlorine wascommonly used in the first stage of bleaching. Environmental concerns, however, have lead toincreasing use of alternative chemicals such as ozone, hydrogen peroxide, enzymes, and chlorinedioxide. Not all the alternative bleaching chemicals are applicable to all types of pulp bleaching andthe selection of chemicals is also driven by cost considerations. Bleaching is used for different typesof paper, varying from unbleached pulps, to brightened newsprint, to highly white printing paper.The selection of one technology among the others and the mill specific case may make theconsumption of energy vary, i.e. in the refining section. For our analysis we assume an averageenergy consumption of 4.3 GJ/t pulp steam consumption and 159 kWh/t pulp electricityconsumption for Kraft pulp bleaching (Elaahi and Lowitt, 1988; Jaccard and Willis, 1996, Nilssonet al., 1995). A typical bleaching sequence for Kraft pulp includes several towers, known as stages,where the pulp is mixed with different chemicals. In between stages, the chemical is removed, andthe pulp is washed. One example of a bleaching system begins with an elemental chlorine stage,which acidifies the lignin. The next stage is the extraction phase where a strong alkaline solution ofsodium hydroxide extracts the lignin acid. Finally, the pulp is whitened by some combination of the
4 These processes claim to reduce Kappa numbers 30-50% lower than conventional pulping without significant loss inpulp yield or strength (Pulliam, 1995). Kappa numbers are defined as percentage share of lignin in total pulp.

13
following: sodium hypochlorite5, chlorine dioxide, or hydrogen peroxide. The conditions vary ineach stage, but all stages take place between 25° and 80°C at 3-43% consistencies (Kline, 1991).Increasingly stringent effluent limitations have meant increasing interest in ECF (ElementalChlorine Free), TCF (Totally Chlorine Free), and TEF (Totally Effluent Free) bleaching processes.These processes are very diverse, but all seek to reduce chlorine use or make the bleachingchemicals recoverable. By 1998, about 60% of North American pulp mills had converted to havethe ability to produce elemental chlorine free pulp, and about 50% of the pulp produced in the U.S.is ECF (Ferguson, 1998). After bleaching, pure chemical pulps must be briefly refined (see refinerpulping description).
Recent developments in the bleaching processes in the U.S. are mainly driven by the EPA ClusterRulemakings that requires pulp and paper industry to switch from chlorine gas as a bleaching agentto chlorine dioxide (ECF) and even to chlorine-free (TCF) chemicals for sulfite pulp. For newsources in bleached papergrade kraft and soda sub-category ECF+, oxygen delignification isrequired (Dean, 1998). Under the EPA’s incentive-based best available technology (BAT) Tier Ioption it is required that only pulps of Kappa numbers of 20 or less are sent to the bleach plant. Atthis Kappa number, the effluent quality from ECF bleaching is the same as that from TCF(Parthasarathy, 1997).
TCF pulps tend to have lower brightness and reduced strength properties compared with ECF pulps.The bleaching yield in TCF pulps is generally lower compared with ECF bleaching process, startingfrom the same Kappa level number (Panchapakesan et al., 1995). In all the bleaching stages,bleaching chemicals consumption in the first-stage is directly proportional to the incoming Kappanumber (Parthasarathy, 1997). Bleaching costs of TCF bleaching are on par with the cost of ECFbleaching at a Kappa number of around 20 (Södra, 1998). Total operating costs (wood, power,chemicals) are higher for TCF pulps. ECF adds $5-$10/t of total production cost above chlorinebleaching, while TCF adds $40-60/t, including capital expenditures (Pulliam, 1995).
The amount of elemental chlorine consumed in 1994 was 790 thousand tonnes (Kincaid, 1998). Theamount of bleached pulp produced by ECF bleaching was 33% (NCASI, 1998). It is estimated thatthe conversion of all U.S. bleached kraft mills to ECF bleaching will require 20 PJ/year forgeneration of chlorine dioxide. Reductions of 13.7 PJ/year in energy use will be achieved fromchlorine elimination and improvements in pulp washing and spill control practices. This will resultin additional 6.3 PJ/year of energy requirements (NCASI, 1998).
Pulp DryingIn situations where the pulp and paper mills are not located in the same place or when a temporaryimbalance between pulp production and paper machine requirements occurs, the pulp must be dried.Market pulp is dried on average to 20% water. Once the pulp is dried, it can be shipped to a papermill, where it is re-pulped using a machine similar to the kind used for pulping recycled paper. Pulpdrying is energy intensive and not essential to the papermaking process, therefore large savingsmight be achieved through co-locating the pulp and paper mills. Pulp drying consumes about 4.5 GJof steam per tonne of pulp and 155 kWh/t pulp electricity (Elaahi and Lowitt, 1988; Jaccard andWillis, 1996, Nilsson et al., 1995).
PapermakingAfter bleaching, the pulp is ready to enter the final stage: papermaking. The process can be dividedinto three basic steps –stock preparation, sheet formation and finishing (pressing and drying). Stockpreparation consists of blending pulps and additives to form a uniform and continuous slurry(Elaahi and Lowitt, 1988). Next, the paper web is formed (sheet formation). By far the most
5 The use of sodium hypochlorite in bleaching is decreasing, mainly due to the effect of the effluent limitationguidelines.

14
common forming machines are the Fourdrinier machines for thin sheets and the twin wire formersand cylinder board machines for thick or multilayered sheets. Both of these machines spray lowconsistency pulp (~1% pulp) onto a moving wire mesh, which allows water to drain away. Weestimate that stock preparation consumes about 274 kWh/t paper electricity and 0.7 GJ/t papersteam (Elaahi and Lowitt, 1988; Jaccard and Willis, 1996).
Once the fibers have been sufficiently dewatered that they begin to bond to form paper, they moveon to the press section. Here the paper is pressed to remove water, and promote further bondingbetween fibers. As it moves through the press section, the paper is held together by felts, which areactually woven materials that allows water to pass through. The pressing section is the target ofmany of the energy efficiency improvements in papermaking because the drier the paper is leavingthe press section, the less energy it consumes in the drying section. Together forming and pressingconsume about 238 kWh/t paper electricity (Elaahi and Lowitt, 1988; Jaccard and Willis, 1996).
Lastly, the paper moves to the drying section, where steam filled rollers dry the paper throughevaporation. This section consumes the bulk of energy in papermaking. In the middle of this sectionis the size press which can apply coating to the paper. The size press must be placed so that thepaper can continue drying after coating because the coating itself must dry as well. The last stage inthe papermaking process is the Calendar stack, which is a series of carefully spaced rollers thatcontrol the thickness and smoothness of the final paper. Energy consumption in the drying section isrelatively high. We estimate consumption at 10 GJ/t paper steam and 21 kWh/t paper electricity(Elaahi and Lowitt, 1988; Jaccard and Willis, 1996, Nilsson et al., 1995).
IV. HISTORICAL ENERGY USE AND CARBON DIOXIDE EMISSIONS IN THE U.S.PULP AND PAPER INDUSTRY
Primary energy consumption6 in the U.S. pulp and paper industry increased steadily between 1960and 1994 from 1495 PJ9 to 3267 PJ equivalent to an increase of 2.3% per year. Final energyconsumption (not accounting for electricity generation and distribution losses) grew at a rate of2.1% per year. Primary energy consumption growth has slowed in recent years, evidenced by a1.5% annual energy consumption growth rate between 1970 and 1994, and a 1.3% annual growthrate between 1980 and 1994 (see Figure 3 for primary energy consumption). The composition of thefuel mix has changed substantially over the period. Biomass and electricity grew more rapidly,increasing their shares from 35% and 5% in 1970 to 43% and 7.2% in 1994, respectively. Use ofcoal and coke, along with oil, decreased most rapidly in the paper sector, as coal and coke fell from21% to 11%, and oil fell from 11.4% to 7%, between 1970 and 1994.
6 Primary energy accounts for losses in electricity transmission and distribution and is calculated using a conversionrate from final to primary electricity of 3.08, reflecting the difference between an average power plant heat rate of10,500 Btu/kWh and a site rate of 3412 Btu/kWh.

15
Figure 3. Primary Energy Use in U.S. Paper Production
Source: U.S. DOC, various years; U.S. DOE, 1988, 1991, 1994, and 1997.
The OPEC oil embargo of 1973 (otherwise known as the oil crisis) had a significant impact on theU.S. paper industry. Since the oil crisis, the industry has been trying to reduce its dependence on oil,by changing the fuel mix away from oil as well as reducing the energy intensity of the mills.Between 1970 and 1994 industry reduced its primary energy consumption per tonne of paper andpaperboard produced by 27%, from 49.9 to 39.6 GJ/tonne, at a rate of 1% per year. (Kincaid, 1998;U.S. EIA 1997a). This energy intensity decline reflects process efficiency investment and increasedcombined heat and power capacity additions over the period.
The leveling off of energy prices in the mid-1980s has appeared to reduce the rate of efficiencyimprovement, although there still are continuing improvements (Nilsson et. al., 1995). In particular,there is a strong interest in reducing the amount of purchased electricity which currently representsabout 45% of total energy costs in the industry (EIA, 1997). Some of this improvement will be theresult of upgrading old power boiler systems (about 80% of the operating boilers in the industry,both power boilers and recovery boilers, were installed prior to 1980) as well as through investmentin combined heat and power (Cadmus, 1998).
The paper industry’s carbon dioxide emissions increased overall between 1960 and 1994 from 27.7Mt to 31.5 Mt, at a rate of 1.4% per year, less than the rate of increase of primary energyconsumption which increased 2.3% per year over the same period. Since 1970, the rate of growth ofcarbon dioxide emissions has been more gradual, 0.5%/year. This slower growth is due primarily totwo major changes in the industry. First, as noted earlier, there has been a significant increase in theshare of biomass fuels over the past few decades. This results in lower carbon emissions per unit ofenergy consumed on an industry-wide basis. Secondly, there has also been a significant increase inthe use of waste paper or recycled pulp which grew from 10.8 Mt to 28 Mt in 1994. Recycled pulpproduction is significantly less energy intensive, thereby contributing to reductions in energy
0
500
1,000
1,500
2,000
2,500
3,000
3,500
4,000
1970
1972
1974
1976
1978
1980
1982
1984
1986
1988
1990
1992
1994
Year
Pet
ajo
ule
s
Electricity losses
Electricity
Wood
Coal & coke
Gas
Oil

16
intensity as well to reductions in carbon dioxide emissions. Carbon intensity, as measured byemissions per tonne of product, has declined rapidly (3% per year) from 0.6 tC/t of paper in 1970to 0.4 tC/t of paper in 1994. This decline reflects the fuel and product shifts discussed above.
Figure 4. Carbon Dioxide Emissions from Fuel Consumption in U.S. Paper Production
Source: U.S. DOC, various years, U.S. DOE, 1988, 1991, 1994, 1997, IPCC, 1995.
V. 1994 BASELINE ENERGY USE AND CARBON DIOXIDE EMISSIONS
Energy ConsumptionIn 1994, the U.S. pulp and paper industry, excluding converting industry, consumed 2779 PJ offinal energy, accounting for about 12% of total U.S. manufacturing energy use. The industry (SIC26) emitted 31.5 MtC that contributed about 9% to total U.S. manufacturing carbon dioxideemissions (U.S. EIA, 1997a; U.S. EIA, 1997b). The fact that carbon emissions are lower than theshare of energy use is mainly due to the assumption of biomass neutrality in carbon dioxideemissions accounting. Table 1 and Figure 5 provide an estimate and a better understanding of 1994U.S. baseline energy consumption and carbon dioxide emissions by process for pulp, paper andpaperboard production, excluding the paper and paperboard converting industry (SIC 27). Thisanalysis does not include the amount of carbon sequestered in forests as well as industry’s productsand wastes. As the table indicates, most of the commercial and bio-fuels are used to first producesteam which is then used in various processes and to generate electricity. The estimate of steam,fuels, and electricity consumption by process was based on average unit consumption estimatesfound existing literature especially (Elaahi and Lowitt, 1988; Nillson et al., 1995; Jaccard andWillis, 1996; Giraldo and Hyman, 1994; Kincaid, 1998; and EIA, 1997)
0
5,000
10,000
15,000
20,000
25,000
30,000
35,000
1970
1972
1974
1976
1978
1980
1982
1984
1986
1988
1990
1992
1994
Year
KtC
Electricity
Coal & Coke
Gas
Oil
17
Table 1. 1994 Energy Consumption and Specific Energy Intensity in the U.S. Pulp and Paper Industry by Process
Process Stage Steam Used1Commercial
FuelBio-fuels Electricity Final
EnergyTonnes of
throughput
Steam orFuel/Bio-fuel SEC
ElectricitySEC
Carbon DioxideEmissions from
Energy Use-a- -b- -c- -d- e=a+b+c+d -f- g=(a+b+c)
fh=d/f I=[SCF••a+FCF••b+O
CF••c+ECF*d]/1000PJ PJ PJ PJ PJ Mt
throughputGJ/t
paperGJ/t paper MtC
Wood Preparation 0.00 0.00 0.00 33.70 33.70 241.46 0.00 0.41 1.06Pulping Chemical 240.22 0.00 0.00 79.58 319.8 53.41 2.91 0.97 4.71 Mechanical 2.67 0.00 0.00 67.59 70.26 5.34 0.03 0.82 2.15 Wastepaper 27.82 Other 16.80 0.00 0.00 2.33 19.14 5.25 0.20 0.03 0.23Bleaching 132.76 0.00 0.00 18.22 150.98 34.92 1.61 0.22 1.78Chemical Recovery 300.32 110.67 0.00 6.92 417.91 53.41 4.98 0.08 4.93Pulp Drying 34.23 0.00 0.00 4.24 38.47 7.61 0.42 0.05 0.44Papermaking 880.28 0.00 0.00 157.93 1038.20 82.46 10.68 1.92 12.97Other 0.00 61.50 0.00 24.94 86.44 82.46 0.75 0.30 1.88
Total Process Energy –A- 1607 172 0 395.4 2175 82.5 21.6 4.8 30.1Total Non-Process Energy –B- 43.2 43.21 1.3
Secondary EnergyProduction
OutputSteam
InputSteam
InputFuel
InputBio-fuel
Electricity FinalEnergy
Carbon DioxideEmissions from
Energy Use-j-3 -k- -l- -m- -n- -o-3
PJ PJ PJ PJ PJ PJ MtC
CHP & non CHP onsite energyproduction2
-437 688 106 69 -203 0.00
Boiler Plant Facilities -1858 848 1348 0.00
Total balance for Onsite EnergyProduction
-2296 688 955 1417 -203 0.0
Total EnergyRequired/produced/bought (CO2
emissions)
-688 688 1127 1417 2354 2779 31.5
Notes: Excludes paper and paperboard converting sector (SIC 27).SEC – specific energy consumptionSCF – steam carbon factor equal to 9 ktC/PJ, which reflects the average carbon factor of all the fuel inputs into on-site steam generation, including biomassECF - electricity carbon factor of 32 ktC/PJ, which reflects the average of purchased and on-site generated electricity carbon factorFCF - fuel carbon factor of 17.8 ktC/PJ, which reflects the average carbon factor of all the fuel inputs into on-site thermal power generation, excluding biomassOCF – other carbon factor of 0 ktC/PJ, i.e. average other (biomass) carbon factor1 Includes steam purchased from utility and non-utility suppliers2 Includes ~ 9 PJ hydroelectric production for non-CHP on-site generation3 See Figure 5 for all the other assumptions4 This number represents the balance between the overall electricity required by the sector and the onsite production (see Figure 5, item: “Electricity from the grid”)

43.21 Electricity TO non-process use1.37 MtC
260.1 purch. 268.6 purch + renewable Electricity Used 438.6 0.032 MtC/PJ
0.04847 MtC/PJ 8.47 renewable 11.82 MtC 13.93 MtC 395.4 Electricity TO the process stage11.40 MtC 11.82 MtC 12.55 MtC
235.3 170.0 electricity FROM on-site cogen w/o renewable 0.032 MtC/PJ
Electricity FROM the grid 33.30 sent out FROM cogen-onsite 2.1 MtC0.41 MtC
Cogeneration (all fuels except hydro and diesel) 183.4 203.3 Output electricity FROM cogen w/o renewable2.52 MtC 2.52 MtC
0.012 MtC/PJ 211.8 (cogen w renewable)
618.3 18% 2.52 MtC
5.03 MtC 62% 111.3 20.0 Other **0.008 MtC/PJ 1.13 MtC
31.67 25% 7.92 Nomenclature:0.56 MtC 55% 0.26 MtC BP BOILER PLANT
EE ELECTRICITY EFFICIENCYTE THERMAL EFFICIENCY
4.58 45% 2.06 EFF EFFICIENCY0.08 MtC 35% 0.05 MtC OTHER, OTHER **, OTHER*** ACCORDING TO MEC97 DEFIN.
UNKNOWN #
27.49 6.05 * ACCORDING TO MEC97 DEFIN. AND ASSUMING 50% FUEL and 50% STEAM22%
45.10 18.00% 8.12 STEAM0 MtC 0 MtC
69.97 * ELECTRICITY0.57 MtC
0.008 MtC/PJ 30% 41.98 69.97 * 50% 1.09 MtC FUEL
1.25 MtC
23.76 OTHER ***
0 MtC 25.00% 5.94 31% checked with http://www.scana.com/sce&g/business_solutions/technology/ezipdry.htm0 MtC
-688.31 Steam TO the power system5.60 MtC
106.221.89 MtC 383.4 17.4 1.6 35.0 437.4 2295.60 1607 Steam TO the process stage
0.0178 MtC/PJ 3.90 0.31 0.04 0.73 MtC 4.96 MtC 20.07 MtC 14.47 MtC
848.35 0.011 MtC/PJ 0.009 MtC/PJ
15.10 MtC 80% 678.68 0.0178 MtC/PJ 15.10 MtC
68.86 1858.231,416.9 0 MtC 1179.55 15.105 MtC
Other *** 1,348.0 87.50% 0 MtC 0.008 MtC/PJ0 MtC 0 MtC
0 MtC/PJ 955 0 MtC/PJ
1,126.7 17.00 MtC 172 direct fuel TO the processFuel 3.07 MtC20.06 MtC 0.0178 MtC/PJ0.0178 MtC/PJ
-27.49 Steam FROM process2778.87 TO power system
31.5 MtC Figure 5: Estimate of Energy Flow (PJ) and Carbon Dioxide Emissions (MtC) in the U.S. Pulp and Paper Industry -1994
OTHER EE =
STEAM TURBINE EE = TE =
GAS TURBINE EE =TE =
COMBINED CYCLE EE = TE =
Steam turbine with steam from process HR. EE =
COMBINATION
EE = TE =
UNKNOWN#
EE =
BP for fuel
BP for "other"

19
Carbon Dioxide Emissions BaselineTable 2 below shows 1994 energy consumption by fuel type for the pulp and paper industry (SIC26) and the respective carbon emissions by fuel. The data for 1994 carbon coefficients for thevarious commercial fuels come from the U.S. Energy Information Administration database (U.S.EIA, 1997b). A carbon emissions factor of 48.5 ktC/PJ is used for purchased electricity, reflectingthe average carbon intensity in 1994 of U.S. public electricity production.
Table 2. Energy Consumption, Carbon Emissions Coefficients, and Carbon Emissions fromEnergy Consumption for the U.S. Pulp and Paper Industry (SIC 26) in 1994
Energy – Related Carbon Dioxide Emissions
FuelEnergy Use
(PJ)
CarbonEmissionsCoefficient(ktC/PJ)
CarbonEmissions
(MtC)Electricity (Purchased) 235.3 48.5 11.4Residual Fuel Oil 182.5 20.4 3.7Distillate Fuel Oil 9.5 18.9 0.2Natural Gas 605.6 13.7 8.3LPG 5.3 16.1 0.1Coal 323.9 24.3 7.7Other (biomass & steam) 1416.9 0.0 0.0Total Energy 2,779 -N.A.- 31.5
Sources: U.S. EIA, 1996; U.S. EIA, 1997; UNEP et al., 1996.
VI. ENERGY EFFICIENCY TECHNOLOGIES AND MEASURES FOR THE U.S.PULP AND PAPER INDUSTRY
A large number of technologies and measures exist that can reduce energy intensity (i.e., theelectricity or fuel consumption per unit of output) of the various process stages of pulp and paperproduction. This section provides estimates on the technologies and measures and their costs andpotential for implementation in the U.S. Table 3 lists the technologies and measures that have beenanalyzed for this study. These technologies can be divided into two general categories: current state-of-the-art technologies and advanced technologies. Current state-of-the-art technologies aretechnologies currently implemented in the pulp and paper mills world-wide, while advancedtechnologies are technologies that are currently used only in pilot plants or are at an early stage ofcommercialization. Advanced technologies are not included in the analysis of measures for energyintensity reductions, but are shown in Table 3 for general information.
Several technologies and measures are analyzed by means of an extensive literature review anddiscussions with industry specialists. For each technology and measure, we have estimated energysavings and/or carbon dioxide emissions reductions per tonne of product produced in 1994. Wehave also calculated the capital investments needed and the change in operation and maintenancecosts (O&M) associated with the implementation of these technologies and measures per annualtonne of product. The analysis mostly focuses on retrofit measures. A further conversion fromenergy savings, carbon dioxide emissions reductions and associated costs, expressed in per tonne ofproduct, to values expressed in per tonne of paper is given. This is assessed multiplying each valueby the ratio of throughput (production from a specific process) to total paper produced. Finally,based on a variety of information sources and expert judgment, the authors provide an estimate ofthe potential penetration rate for each technology and measure that can be attained by the year 2010,and project this estimate on the 1994 baseline to estimate the potential energy efficiencyimprovements in that year.Table 4 provides the summary of the input data and assumptions for the scenarios. The table shows
20
fuels, electricity, and primary energy savings per tonne (t) of production, retrofit capital costs7 andO&M costs per tonne of production, the percentage of production to which the measure can beapplied nationally (by 2010), and the associated carbon dioxide emissions reductions. A detaileddescription of each technology and measure and estimates of associated energy savings and costs isprovided below.
Table 3. Energy-Efficient Technologies and Measures for the U.S. Pulp and Paper Industry.Process Technology/Measure Process Technology/Measure
Raw MaterialsPreparation Ring style debarker
Papermaking(continued)
Hot Pressing
Cradle debarker Direct drying cylinder firing
Enzyme-assisted debarker Reduced air requirements (closing
Bar-type chip screens hoods and optimizing ventilation)
Chip conditioners Waste heat recovery
Improved screening processes Condebelt drying
Belt conveyor Infrared profiling
Fine slotted wedge wire baskets Dry sheet forming
Pulping: Refiner improvements General Optimization of regular equipment
Mechanical Biopulping Measures Energy-efficient lighting
Pulping: RTS (short Residence Time, elevatedtemperature, high speed)
Efficient motors
Thermo- LCR (low consistency refining) Pinch Analysis
Mechanical Thermopulp Efficient Steam Boiler maintenance
Super Pressurized groundwood pulping Production and Improved process control
Heat recovery in thermomechanical pulping Distribution Flue gas heat recovery
Improvements in Chemi- thermomechanicalPulping
Blowdown steam Recovery
Pulping: Continuous digesters Steam trap maintenance
Chemical Continuous digester modifications Automatic steam trap monitoring
Batch digester modifications Leak repair
Chemical Falling film black liquor evaporation Condensate return
Recovery Tampella recovery system Other Increased use of recycled paperLime kiln modifications Measures Combined heat and power systems**
Bleaching Extended cooking (delignification) Advanced Alcohol based solvent pulping
Oxygen predelignification Technologies Black liquor gasifier+gas turbines
Ozone bleaching - Pulping Pre-treatment of incoming pulp into drying section
Oxidative extraction Direct alkali recovery system
Biobleaching Advanced Infrared drying*Improved brownstock washing Technologies Impulse dryingWashing presses (post delignification) - Papermaking Airless drying
Papermaking Gap forming Press dryingHigh consistency forming Air impingement dryingExtended nip press (shoe press) Steam impingement drying
Notes:* Technologies that provide energy savings, but increase carbon dioxide emissions.** The CHP systems (combined heat and power) have not been included in the analysis because use those systems should be evaluated separatelyfrom and in comparison with other technologies, as their installation significantly alter the heat-to-power ratio of the facilities. The CHP potential forthe pulp and paper industry has been covered in separate studies (Khrushch, et al., 1999; NCASI, 1999) .
7 All capital costs are calculated in dollars per tonne per year ($-yr/t). For the sake of brevity, we have listed the valuesin the table as $/t. We do not deflate dollar values to a standard year but our internal analysis indicates that this does notadversely affect the results.

21
Table 4. Energy Savings, Costs, and Carbon Dioxide Emissions Reductions for Energy-EfficientTechnologies and Measures Applied to the U.S. Pulp and Paper Industry in 1994.
Production FuelSavings
ElectricitySavings
PrimaryEnergySavings
CarbonSavings
RetrofitCost of
Measure
AnnualOperating
Cost Change
Applicable Share ofProduction
Measure (Mt) (GJ/t) (GJ/t) (GJ/t) (kgC/t) (US$/t) (US$/t) %Raw Materials PreparationRing style debarker 241.5 0.00 0.02 0.03 0.5 1.3 -0.01 15%Cradle debarker 241.5 0.00 0.03 0.05 0.8 25.8 0.0 15%Enzyme-assisted debarker 241.5 0.00 0.02 0.04 0.7 3.9 0.0 15%Bar-type chip screens 49.5 0.35 0.00 0.50 3.1 1.5 -0.7 20%Chip conditioners 49.5 0.21 0.00 0.30 1.9 N/A -0.4 30%Improved screening processes 49.5 0.35 0.00 0.50 3.1 1.5 -0.7 20%Belt conveyors 239.4 0.00 0.02 0.04 0.7 N/A -0.5 20%Fine-slotted wedge wire baskets 5.3 0.00 0.61 1.24 19.4 N/A N/A 10%Pulping: MechanicalRefiner Improvements 3.2 0.00 0.81 1.63 25.6 7.7 2.6 20%Biopulping 5.3 -0.50 2.04 3.41 60.1 27.0 9.4 20%Pulping: Thermomechanical (TMP)RTS 3.0 0.00 1.10 2.23 35.0 50.0 0.0 30%LCR 3.0 0.00 0.51 1.04 16.3 N/A 0.0 5%Thermopulping 3.0 0.00 1.10 2.20 35.0 226.7 N/A 15%Super Pressurized groundwood 3.0 0.00 2.67 5.40 84.7 220.0 -2.6 10%Heat recovery in TMP 3.0 6.05 -0.54 7.52 37.4 21.0 18.0 20%Improvements in Chemi-TMP 3.0 0.00 1.10 2.23 35.0 300.0 N/A 20%Pulping: ChemicalContinuous digesters 49.5 6.30 -0.27 8.40 48.1 196.0 0.0 25%Continuous digester modifications 49.5 0.97 0.00 1.39 8.8 1.3 0.2 50%Batch digester modifications 49.5 3.20 0.00 4.55 28.8 6.6 0.5 15%Chemical RecoveryFalling film black liquor evaporation 53.2 0.80 0.001 1.14 10.1 90.00 0.00 30%Tampella recovery system 53.2 2.90 0.0 4.13 23.9 N/A N/A 1%Lime kiln modifications 53.2 0.46 0.0 0.46 7.82 2.50 N/A 20%Extended Delignification and BleachingOzone bleaching 29.6 0.00 0.01 0.02 0.3 149.5 -2.0 25%Brownstock washing 29.6 0.01 0.05 0.11 1.5 50.0 -2.3 15%Washing presses (post-delignification) 29.6 0.39 0.00 0.55 3.5 17.0 -0.5 15%PapermakingGap forming 82.5 0.00 0.15 0.30 4.7 70.0 0.7 35%High consistency forming 70.6 1.50 0.15 2.43 18.2 70.0 0.7 20%Extended nip press (shoe press) 82.5 1.60 0.00 2.28 14.4 37.6 2.2 40%Hot pressing 82.5 0.61 0.00 0.87 5.5 25.7 0.0 10%Direct drying cylinder firing 82.5 1.05 0.00 1.50 9.5 111.2 1.4 5%Reduced air requirements 82.5 0.76 0.02 1.12 7.5 9.5 0.1 40%Waste heat recovery 82.5 0.50 0.00 0.71 4.5 17.6 1.6 30%Condebelt drying 82.5 1.60 0.07 2.43 16.7 28.2 0.0 50%Infrared profiling 82.5 0.70 -0.08 0.84 3.8 1.2 0.0 15%Dry sheet forming 82.5 5.00 -0.75 5.59 21.2 1504.0 0.0 15%General MeasuresOptimization of regular equipment 82.5 0.00 0.10 0.20 3.4 N/A 1.0 30%Energy-efficient lighting 82.5 0.00 0.05 0.10 1.6 1.20 -0.01 20%Efficient motor systems 82.5 0.00 0.62 1.25 19.6 6.00 0.0 100%Pinch analysis 82.5 1.79 0.00 2.54 16.1 8.00 0.0 20%Efficient Steam Production and DistributionBoiler maintenance 82.5 1.26 0.00 1.79 11.3 0.0 0.06 20%Improved process control 82.5 0.54 0.00 0.76 4.8 0.4 0.08 50%Flue has heat recovery 82.5 0.25 0.00 0.36 2.3 0.7 0.09 50%Blowdown steam recovery 82.5 0.23 0.00 0.33 2.1 0.8 0.11 41%Steam trap maintenance 82.5 1.79 0.00 2.54 16.1 1.2 0.09 50%Automatic steam trap monitoring 82.5 0.89 0.00 1.27 8.0 1.2 0.16 50%Leak repair 82.5 0.54 0.00 0.76 4.8 0.3 0.03 12%Condensate return 82.5 2.68 0.00 3.81 24.1 3.8 0.54 2%Fiber SubstitutionIncrease use of recycled paper 60 13.4 2.1 22.4 186 485 -73.9 15%

22
Raw Materials Preparation
Ring style debarkersWet debarkers remove bark by rotating logs in a pool of water and knocking the logs against thedrum. Dry debarkers eliminate the use of about 7-11 tonnes of water per tonne of wood, thusreducing water and energy use (EPA, 1993). Dry debarkers dominate the industry. However weestimate that dry debarkers can still replace wet debarkers for about 15% of pulpwood debarking.Wet debarkers use approximately 0.04 GJ/t of debarked logs of energy, while ring style debarkersuse approx. 0.025 GJ/t of debarked logs (Jaccard, Willis, 1996). We estimate investment costs of$1.3/t of woodpulp, and savings in O&M costs of $0.01/t of woodpulp.
Cradle DebarkerThe Cradle Debarker marketed by Dieter Bryce Co. (U.S.) has an electricity load 90 kW of energyand can debark about 120 cords of pulpwood per hour (Anonymous, 1995c, Dieter Bryce, 1999).The price of the Cradle Debarker is about 70% of a regular drum debarker (Dieter Bryce, 1999). Weestimate energy savings of 0.025 GJ/t of debarked logs, and apply this measure to 15% of debarkedlogs throughput. Estimated investments are of $25.8/t of woodpulp, and O&M costs are same as forregular drum debarker.
Enzyme-assisted debarkerEnzyme-assisted debarking is based on enzyme pretreatment of logs for debarking that reducesenergy consumption in the process. Investment costs for a enzyme-assisted debarker are about$CAN 1.4 million (1990) for an 800 tpd plant, while O&M costs are the same as for other drydebarkers (Jaccard, Willis, 1996). Enzyme-assisted debarkers use about 0.01 GJ/t of debarked logsof electricity (Jaccard, Willis, 1996). We estimate energy savings of 0.021 GJ/t of debarked logs ofelectricity from enzyme-assisted debarker, and apply this measure to 15% of debarked logsthroughput. The necessary capital investments are of $3.9/t of woodpulp. The energy associatedwith the production of enzymes is not included.
Bar-type chip screensThe design of a bar screen is different from the majority of the installed disc and V-type screens inthe U.S. Due to the design the life-time of a bar-screen is longer than that of conventional screens.Maintenance costs in bar screens are lower, and working energy consumed is minimal (Strakes,1995). Energy savings from bar-type screen installations are estimated at 0.35 GJ/t chemical pulp,due to about 2% increase in yield. O&M cost savings due to improved yield are $0.7/t pulp(Kincaid, 1998). Capital costs required for new bar-type screens are approximately the same as forother screening equipment (EPA, 1993). We apply this measure to 20% of chemical pulpthroughput.
Chip conditionersChip conditioners prepare chips for efficient delignification by making cracks along their grains,unlike chip slicers that fractionate chips (Henry, Strakes, 1993). Chip conditioning generates lessfines, achieves an average reduction of 1.2% in rejects, and requires less maintenance than slicingequipment. Rader’s Dyna Yield Chip Conditioner is powered by two 150-hp motors and cancondition about 73 tonnes of chips per hour (Henry and Strakes, 1993). We estimate energy savingsfrom replacing chip slicers with chip conditioners as 0.2 GJ/t chemical pulp, and savings in O&Mcosts from improved yield of $0.4/t chemical pulp (Kincaid, 1998). We apply this measure to 30%of raw materials throughput.
Improved Screening Processes –Screen out thick chipsElahi and Lowitt (1988) note that improved screening processes that allow for a more even sizedistribution of wood chips entering the digester will reduce steam consumption in both the digesterand the evaporator in chemical pulping. Energy savings from this measure are estimated to be 0.35

23
GJ/t pulp assuming an increase of 2% in quality chip yield (Elahi and Lowitt, 1988). Costs forscreening equipment for a greenfield installation are estimated to be $1.1/t chemical pulp. Theretrofit option has higher investment costs, and is estimated at $1.5/t pulp (EPA, 1993). O&M costsavings from improved yield are $0.7/t pulp (Kincaid, 1998). We apply this to 20% of chemicalpulp throughput.
Belt conveyersIn the woodyard of some mills chips are conveyed by pneumatic chip-blowing systems that areintensive energy users. The more efficient bark and chip handling systems are belt conveyors. Beltconveyors use about 15% of power required for pneumatic conveyors. Belt conveyors reduce fineand chip pin losses, which improves yield by about 1.6% (Hamid, 1993, Young, 1994). Estimatedelectricity savings from replacing pneumatic systems with belt conveyors are 0.021 GJ/t rawmaterial handled (Hamid, 1993) or 5.8 kWh/t. We estimate reduction in O&M costs of $0.53/t ofraw materials handled from reduction in fines and pin chip losses. Currently, pneumatic conveyors,as they wear out, are being replaced by belt conveyors. However, potential for replacement stillexists. We apply this measure to 20% of raw materials throughput.
Fine-slotted wedge wire basketsThis kind of technology can yield significant improvement in shive removal, enhancement ofphysical pulp properties, and, in some cases, reduction of electrical power. It has already beenimplemented in many European mills (Cannell, 1999). A prerequisite is a chip supply with lowdirt/bark content and an efficient chip wash system. Cannell (1999) also claims lower capital coststhan the traditional screening systems, in some cases, and less O&M costs because pipes’ diametersand pump sizes can be reduced and sometimes the TMP mainline cleaners can be shut down.Estimated electricity savings in mechanical pulping is roughly 9% in refiner energy consumptionthat is 169 kWh/t of mechanical pulp (Cannell, 1999). The technology has lower capital costs thanthe traditional screening systems, because of the reduced pipe diameters and pump sizes arereduced. The main drawback is that the wedge wire baskets are mechanically weaker thanconventional baskets and prone to failure. We apply this measure to 10% of mechanical pulpthroughput, due to high level of mechanical failures at the current stage of development of thistechnology.
Pulping
Mechanical Pulping
Refiner ImprovementsSeveral improvements are possible with the refiner section of a mill, which can reduce electricityconsumption in mechanical pulping. A newsprint mill in Quebec, Canada recently implemented arefiner control strategy to minimize variations in the freeness of ultra-high-yield sulfite pulps andsaved 51.3 kWh/t due to reduced motor load (Tessier et al., 1997). Another option in refining is theswitch to conical refiners rather than disk refiners. By decreasing the consistency of pulping toabout 30% from 50% a 7 to 15% electricity savings are possible in TMP and RMP (Alami, 1997).Based on these measures, we assume an electricity savings potential of 11% or 305 kWh/t formechanical refining improvements and a capital cost of $7.7/t pulp (Caddet, 1990). An increase inthe O&M costs of $2.6/t of pulp has been taken into account by switching from one to two refiningstages (Caddett, 1990; Jaccard and Willis 1996). We apply this measure to 20% of mechanicalpulping.
BiopulpingBiopulping consists of pretreating the wood chips with biological agents to degrade the lignin.These agents can consist of fungi containing a variety of enzymes (or isolated enzymes) that break

24
down the lignin. The physical process begins after the pulpwood has been chipped and screened foroversize chips. At this point the chips are briefly heated to 100 ºC to kill off anything that mightcompete with the lignin-degrading fungus. The chips are then air-cooled and the fungus and thenutrients are added. The treated chips are placed in a pile for the next 1 to 4 weeks: climatic andseasonal factors are very important for the effectiveness of the treatment. The fact that up to 4weeks worth of chips must be stored may be a problem for mill sites with space constraints. Thissystem is not yet commercial, but has been demonstrated in large-scale tests (Scott et al., 1998).Experts agree that many unresolved issues still need to be deepened. Electricity savings frombiopulping have been estimated at 25-40% compared to mechanical refining. (Scott et al., 1998).However, there are some additional steam requirements. We therefore assume savings of 30% or565 kWh/t pulp and additional steam consumption of 0.5 GJ/t. This process may extend machinelife and improve product quality. Scott and Swaney (1998.) report a cost investment of $6M for a600 ton/day output. We therefore assume a cost of $27/t pulp. Operations and maintenance costs areexpected to increase with this process. We assume an increase of $9.4/t based on (Scott andSwaney, 1998). Given that this technology is used for smaller sized mills, we assume that 20% ofall mechanical pulp mills less than 600 tpd are retrofitted with biopulping technology.
Thermo-Mechanical Pulping
RTS (short Residence time, elevated Temperature , high Speed)The RTS process has been commercialized in 1996. Energy consumption is reduced by increasingthe rotational speed of the primary refiner. This leads to reduced residence time, smaller plate gapsand higher refining intensity. Chips are subjected to elevated temperatures for a short residence timeprior to high speed primary stage refining. Temperatures of approximately 165 ºC are used,resulting in a reduction in specific energy consumption with no loss of pulp quality and a one-pointbrightness improvement (Cannell, 1999; Fergusson, 1997; Patrick, 1999). The pulp produced withlow-retention/high-pressure/high-speed conditions demonstrated approximately 15% lowerspecific energy requirements than the pulp produced with a traditional refining system. Thisreflects a savings of 306 kWh/t in TMP with an investment cost of $50/t pulp. This pulp hasslightly higher strength properties and comparable optical properties to TMP pulps. There are fiveRTS installations in operation at 1999 in the world. We assume a potential penetration of 30% inremaining thermomechanical pulping, as it is becoming more and more common in TMP mills.
LCR (Low Consistency Refining)Installation of LCR (it functions as a third stage refiner) is justified based on energy savings and/oran increase in production rate (from 4% to 12%) (Cannell, 1999). The reduction in specific energyis due to the difference in the refining response for LCR versus high consistency refining for aparticular freeness range and is assessed being about 7% less than TMP energy requirements(Cannell, 1999). Energy savings of 142 kWh/t of thermomechanical pulp can be achieved. Weapply this measure to a small portion (5%) of thermomechanical pulp production (i.e. technologyapplications limited to low freeness TMP).
ThermopulpThermopulping is a variation of the TMP process whereby pulp from the primary stage refiner issubject to a high temperature treatment for a short time in a thermo-mixer and in the subsequentsecondary refiner. Temperatures in the primary stage are below the lignin softening temperature.
The higher operating pressures in the secondary refiner reduce the volumetric flow of generatedsteam. An advantage is that in contrast with other energy savings technologies this process can beturned on and off as desired by mill personnel. A drawback is a small brightness loss and a slightreduction in the tear index. Commercial development of this process is ongoing in 6 mills, reportingsavings in the range of 10% to 20% (Cannell, 1999). Based on these measures, we assume an

25
energy saving potential of approx. 306 kWh/t (15% savings) for mechanical refining improvements.One drawback in this process was reported at the Ortviken mill. Mill tests experienced an increaseof peroxide, in the bleaching section, ranging from 1.35 to 3.6 kg/t of pulp, depending on thenumber of stages in the TMP process before switching to Thermopulp (Höglund, 1997). We assumea cost of $226 tpy of pulp (Anonymous, 1997) for a new installation and a potential penetration of15% in the TMP pulp production. We keep the penetration limited because the average mill size ofmany mills in North America doesn’t not allow use of thermopulping.
Super Pressurized GroundWoodPressurized groundwood pulping was first developed in Scandinavia in the 1970s. In a pressurizedgroundwood system, grinding takes place under pressure where water temperature is high (morethan 95 ºC), thereby allowing for higher grinding temperatures without steam flashing (P&P Staffreport, 1989). The technical literature claims a 36% saving in electricity (~ 740 kWh/t) comparedwith TMP (Caddett, 1992). Costs for system installations are estimated at $220/t as well as a $2.6/tsaving for O&M costs (Sutton, 1989). With the Super pressurised groundwood technology bettersmoothness and opacity of paper is achieved (EPA, 1994). One of the reasons that may attract millsto adopt this technology is also a better handling of lower fiber coarseness (SC paper grades). Weassume a potential application for 10% of 1994 thermomechanical pulping. The strength propertiesof PGW-s improve by 30-50% compared to atmospheric grinding and 15-20% compared toconventional PGW without using any more energy.
Heat recovery in thermomechanical pulpingA vast amount of steam is produced as by-product of thermo-mechanical pulping. Most of thisenergy (about 60-70%) can be recovered as low pressure steam in an evaporator/reboiler system(Franko 1989; Lahner, 1989; Engstrom 1989, Komppa 1993.). This recovery can also beaccomplished by other technologies such as: MVR8 (Tistad 1989; Engstrom 1989; Ryham 1989) forintegrated mills, where all the steam available can be used in the paper machine dryer section,ejectors9 (Engstrom 1989) and cyclotherm systems+ heat pump10 (Engstrom 1989; Klass 1989).The steam must be at about 0.27 MPa to be suitable for use in other processes such as the papermachine dryer section. The TMP process generates 2-3 kg of steam per kg of refined pulp. Theamount varies with pulp production rate, refining fiber consistency, dilution water temperature, andpower input rate (Rockhill, 1989). Heat recovery systems can be expected to save between 3.2 to5.5 GJ/t of pulp (Tistad, 1989) while electricity consumption is expected to increase up to 149kWh/t pulp. Installation costs may greatly change depending on the system. Klass (1989), Rockhill(1989), Jaccard et at. (1996) report a wide range of installation costs. According to this lastreference, we assume an installation cost of $21/t of pulp and a significant increase in the O&Mcosts of approx. $18/t of pulp, if compared to a traditional cyclotherm system. We assume apotential penetration of 20% in remaining thermomechanical pulping.
Improvements in Chemi-ThermoMechanical PulpingFirst developed in Scandinavia during late 1970s, chemi-thermomechanical pulping entailsapplication of chemicals to the chips prior refining. The process begins with an impregnation of 2%to 5% of sodium sulfite and chelating agents at a pH of 9 to 12. The mixture is preheated for 2 to 5minutes at 120ºC to 130 ºC and refined. Depending on the raw materials and amount of chemicalsused, yields for unbleached softwood CTMP are in the range of 86% to 90% (Kincaid, 1998). Pre-steaming is done to remove air from the woodchips and stabilise the chip temperature (Grossman 8 Mechanical vapor recompression: clean steam is produced recovering heat from dirty steam or heat that comes fromthe refiner. If the pressure is too low to be directly used in the drying section, a compressor is needed to increase itsenthalpy content.9 in Ejectors or TVR (thermal vapor recompression): high-pressure steam from boilers is used to transport the rejectedsteam into the ejector, thus converting the velocity of the mixture to pressure a diffuser.10 Cyclotherm and heat pump is a system using heat from dirty steam in an inverse-Carnot cycle. The difference withMVR is that an intermediate fluid is used to be compressed and not directly the steam.

26
and Salmen, 1997). The chemical pre-treatment of the chips permits less destructive separation offibers from the wood resulting in a higher longer fiber content and a much lower shive content thanthermomechanical pulp (Stationwala, 1994). CTMP proved a higher brightness before bleachingand is better suited for absorbent grades and food packaging. Typically, newsgrade quality CTMPfrom black spruce requires 9.3-10 GJ/t of refining energy. However, increasing the first stagerefiner speed and decreasing the pH of the sulfite liquor can allow this process to operate at 6.5-8.3GJ/t (Stationwala, 1994). We assume savings of 15% or 283 kWh/t (Grossman and Salmen, 1997).An increase in waste treatment requirements, caused by the added dissolved materials, may beexperienced. Though the applicability and costs of CTMP are species specific, installation costs forthis technology have been estimated on average of $300/t pulp, including chip washingimpregnation, refiners, heat recovery system, wash presses and motors. Improvements in CTMP arestill in progress. We assume a potential technical penetration of 20% for thermomechanical pulping(Meadow, 1998).
Chemical Pulping
Continuous digestersContinuous digesters are a more efficient technology than the cheaper batch digesters. In acontinuous digester the wood chips are pre-steamed and cooked in pulping liquor at 160°C. Asopposed to a batch process, there is a continuous stream of chips into the digester and a continuousexit stream of pulp. The continuous flow within the digester allows recovery of heat from one partof the process to heat another. (Kline, 1991). Although continuous digesters require about 0.27 GJ/tpulp of additional electricity (+75 kWh/t), this is compensated by reduced steam requirements. Weestimate average steam savings of 6.3 GJ/t pulp (Elahi and Lowitt, 1988, Jaccard, and Willis, 1996).Continuous digesters can be easily adapted for computer control, have lower labor requirements,have reduced digester corrosion, and produce higher strength product (Elahi and Lowitt, 1988).Installation of continuous digesters will require replacement of the whole pulp line, which includestechnology for bleaching and chemical recovery. Estimates of such replacements run $100-400million for a 450 tpd mill (Anonymous, 1993b; Anonymous, 1994b; Elahi and Lowitt, 1988). Forthe digester portion alone we estimate a cost of $50 million, or $196/t pulp (Anonymous, 1998).O&M costs are anyway assumed the same as for batch digester, because of an increased number ofpumps and fans. As of 1988, 50% of chemical pulp in the U.S. was produced using continuousdigesters. We assume that an additional 25% penetration, starting from 1994 data, is possible.
Continuous digester modificationsModifications of the continuous digesters focus on reducing the amount of material that must beheated and increasing the level of heat recovery. Measures involve minimizing the liquor to woodratio, improving the recycling of waste heat, use of heat exchangers, improved steam recovery, andincreased insulation (Elahi and Lowitt, 1988). Increased indirect heating as a result of thesemodifications also can improve pulp uniformity, strength, and yield. We assume energy savings of0.97 GJ/t pulp (Jaccard, and Willis, 1996). Costs may vary depending on the specific modification.We assume a cost of $1.25 /t pulp for computer control modifications, and increase in O&M costsof $0.16/t pulp (Jaccard, and Willis, 1996). We assume that continuous digester modifications canbe made to 50% of throughput.
Batch digester modificationFor smaller mills, it may not be operationally efficient to switch to larger batch digesters in thedigesting operation. Additionally, specialty mills or mills that need to be able to produce a varietyof pulp types are less suited for continuous digesters. There are several approaches to reduce energyconsumption in batch digesters, such as the use of indirect heating and cold blow. In indirectheating cooking liquor is withdrawn from the digester through a center pipe, pumped through an

27
external heat exchanger, and returned into the digester at two separate locations in the vessel,thereby reducing direct steam loads. Savings are estimated to amount to 3.2 GJ/t (Elaahi andLowitt). There are however some additional maintenance costs with this system includingmaintaining the heat exchangers (Elahi and Lowitt, 1988). We estimate an increase in O&M costsof $0.49/t pulp, and the necessary investment for equipment modifications of about $6.6/t pulp(Jaccard, and Willis, 1996). We apply this measure to 15% of digester throughput, given thepreponderance of continuous digesters in our technical potential scenario.
Chemical Recovery
Falling film black liquor evaporationA tube type falling film evaporator effect operates almost exactly the same way as a moretraditional rising film effect, except that the black liquor flow is reversed. The falling film effect ismore resistant to fouling because the liquor is flowing faster and the bubbles flow in the oppositedirection of the liquor. This resistance to fouling allows the evaporator to produce black liquor withconsiderably higher solids content (up to 70% solids rather than the traditional 50%) thuseliminating the need for a final concentrator. (Nilsson et al., 1995). We estimate steam savings of0.8 GJ/t pulp with no change in electricity consumption (Elaahi and Lowitt, 1988). Cost forevaporator systems are estimated at $90/t pulp (Minton, 1986). Most new mills already install thissystem. We apply this therefore to 30% of integrated kraft (Elahi and Lowitt, 1988).
Tampella recovery systemThe Tampella recovery system recovers the chemicals and energy from the sulfite process spentliquor to produce chemicals for the sulfite process. It is one of the few operational systems that isable to recausticize sulfite liquor for reuse in the pulping operation. The recovery process begins thesame way as the Kraft process, with a recovery boiler producing green liquor consisting of anaqueous solution of Na2CO3 and Na2S. CO2 from scrubbed flue gasses is pumped into the solution,allowing these chemicals to react with it and the surrounding water. The H2S gas leaving during thestripping process is burned to form SO2 which is pumped into the solution of Na2CO3 to form thesulfite cooking liquor. Since sulfite liquors are not usually recovered, the use of this process couldsave considerable energy (Ingruber et al., 1985.). Energy savings are estimated at 2.9 GJ/t (Elahiand Lowitt, 1988). The Tampella recovery is fairly common in Japan but not in the U.S. (Ingruberet. al, 1985). We assume that 50% of 1994 sulfite pulping capacity could still implement the system.
Lime kiln modificationsThe lime kiln calcines the calcium carbonate (CaCO3) in lime mud to produce quicklime (CaO).Several modifications are possible to reduce energy consumption in the kiln. High efficiency filterscan be installed to reduce the water content of the kiln inputs, thereby reducing evaporation energy.Higher efficiency refractory insulation brick can be installed or chains to increase heat transfer inthe kiln. Heat can also be captured from the lime and from kiln exhaust gases to pre-heat incominglime and combustion air. We calculate that the average savings achieved by these measures isapproximately 0.46 GJ/t pulp (Elahi and Lowitt, 1988; Grace et al., 1989; Byrne and Larsen, 1997;Lewko, 1996; Pearson and Dion, 1999; Martin, Worrell, Price, 1999). These improvements canalso improve the rate of recovery of lime from green liquor, thus reducing the plant’s requirementfor additional purchased lime. Based on a detailed analysis of kiln modifications in cementproduction we assume an investment cost of $2.5/t pulp (Martin et al., 1999). We assume that suchmodifications are applicable to 20% of the existing lime kilns.

28
Extended Delignification
Extended Cooking in Continuous DigestersMCC (Modified Continuous Cooking) and EMCC (Extended MCC) allow to extend cooking timeswithout loss in pulp quality or yield by maintaining a more even alkali charge than conventionalcooking. This measure results in significant reductions of bleaching chemicals. However, we didnot find a corresponding energy savings on site, and therefore do not include this measure in ourtechnical potential scenario.
Oxygen delignificationOxygen delignification is a bleaching process where oxygen is mixed with pulp, is allowed to reactwith the lignin, and is washed away. This process can be beneficial for selectivity, pulp quality andenvironmental impact. We did not however find significant energy savings and therefore do notinclude this measure in our technical potential scenario.
Bleaching
Ozone bleachingOzone bleaching is an alternative bleaching process that can produce pulp of equal brightness toeither ECF or TCF. Ozone is a very effective delignifying agent, but its usage has been limited dueto high investment costs and increased energy consumption, approximately 10 kWh/kg of O3
(Korhonen, 1993). Laboratory tests showed that the least expensive option for adding ozone (Z) isto add it to the first chlorine dioxide (D) bleaching stage. In this case ozone serves as a replacementchemical for chlorine dioxide11 (Chirat, Lachenal, 1998, Finchem 1998). Used in the rightcombination of stages, ozone bleachng can save on capital costs, reduce consumption of chlorinedioxide, and eliminate one washing stage (Finchem, 1998).
Another process, the EnZone being developed at the University of Georgia combines oxygen andenzymatic delignification of hardwood pulps with ozone treatment and a final hydrogen peroxidebleaching stage (Eriksson and Alophson, 1997). The use of ozone has proven to be effective withand without oxygen delignification, and employs much of the existing bleach plant equipment,thereby minimizing capital costs for the installation (Ferguson, 1998). Further optimization ofozone bleaching focuses on low pulp consistency bleaching (3-4%) rather than medium pulpconsistency bleaching, and demonstration projects have been tested in this area (Ferguson, 1998).
Union Camp has developed a C-Free ozone bleaching process for Kraft pulping, which uses verylittle energy. This process can be used with ECF as well as with TCF sequences, and uses oxygenfor bleaching before the ozone bleaching (Union Camp, 1998, Ferguson, 1998). The first cost forthe installation was cited at $113 million for a 900 tpd plant which reflected the construction of allnew bleaching facilities (Ferguson, 1993). The systems capital costs (for the ECF line) are 25-30%higher than that of a traditional chlorine system, but its operating costs are lower -- bleaching costshave been reduced by 30-40%. Consolidated papers reported an investment of $34 million for a 650tpd plant retrofit, which reflected investments in dewatering elements, ozone reactor and generationequipement, but no oxygen generation equipment. (Bergin, 2000) Others claim that ozonationsystems can be cost effective for new bleaching plants, however they are unlikely to be used asretrofit, due to high capital costs (Lamarre, 1997).
Ozone systems are likely to gain more interest as new extended cooking and oxygen delignificationsystems, which are prerequisites for successful ozone bleaching, come online. Ozone will also gainmore interest as a low cost partial substitute for expensive chlorine dioxide (EPA, 1993). We
11 Chlorine (C) and ozone (O3) are the most effective bleaching chemicals available, capable of reacting with all types ofaromatic structures in residual lignin. Chlorine dioxide (D) and oxygen (O) react primarily with free phenolic groups inlignin, and are not as efficient as far as delignification is concerned (Chirat, Lachenal, 1998).

29
assume 1:2.3 substitution of chlorine dioxide with ozone, which result in 3 kWh/t of pulping energysavings. Although chemical costs are higher than in a conventional DC sequence, they are smallerthan in a chlorine dioxide stage. Combined wood and chemical costs are about $2/t lower (Finchem,1998). For our analysis we assume a retrofit capital investment of $149.5/t throughput. We applythis measure to 25% of bleached chemical pulp throughput.
Oxidative extractionThe addition of gaseous oxygen in the first caustic extraction stage can enhance the removal oflignin and reduce the requirements for chlorine and chlorine dioxide. This measure results insignificant reductions of bleaching chemicals. However, we did not find a corresponding energysavings on site, and therefore do not include this measure in our technical potential scenario.
Biobleaching (Enzyme Bleaching)Enzymes are biological catalysts that break bonds between lignin and hemicelluloses after cooking.The use of enzymes in the bleaching process reduces bleaching chemical requirements such ashypochlorite and chlorine dioxide. However, we did not find a corresponding energy savings onsite, and therefore do not include this measure in our technical potential scenario.
Improved brownstock washingConventional brownstock washing technology consists of series of three to four drum washerswhere a fiber mat under vacuum pressure is sprayed with water to dissolve solids. State-of-the-art,while washing systems replace the vacuum pressure units with pressure diffusion or wash presses(belt washers are less common). These systems remove solids more efficiently, require less electricpower and/or steam and less bleaching chemicals.
Table 5 shows operating costs and energy savings/losses for three washing systems. Capital costsfor all three systems range from $10.2 to $12.3 million for a hypothetical mill (EPA, 1993). Weassume capital costs of $12 million for a drum displacer, O&M non-energy cost savings of $2.3/t,steam savings of 0.01 GJ/t, and electricity savings of 12.6 kWh/t. We apply this measure to 15% ofchemical pulp throughput.
Table 5. Annual operating costs saved for three modern alternative washing systemsUnits Chemi-Washer CB Filters Drum Displacer
Power at $0.0525/kWh Thous. $US $12 ($12) $158
Electricity consumption kWh/t 0.96 -0.96 12.61
Steam at $7/t Thous. $US $1,555 $370 $88
Steam consumption GJ/t 0.013 0.003 0.001
Total energy savings GJ 3837 -106 11005
Defoamer at $1/kg $0.45 $118 $236 $297
Maintenance – labor and materialsfor facewire change
Thous. $US ($60) $15 $15
O&M non-energy cost savings $/t $0.2 $1.1 $1.3
Total annual savings Thous. $US $1,225 $609 $558
Savings per t $US $5.14 $2.55 $2.34
Source: modified from EPA, 1993.
Washing pressesIn a conventional bleach plant that has four bleaching stages using an ECF process it is difficult toachieve low water consumption without excessive increase in the bleaching chemical consumption.Relatively low water consumption can be achieved through recycling bleach plant filtrates fordilution and washer showers without excessive increase in chemical consumption. When a highdegree of bleaching plant closure is required, a different type of washing equipment is needed forsuccessful D(EOP)DD bleaching. Pulp washing on presses (with a washing efficiency of 70-85%)

30
instead of filters (with a washing efficiency of 65%) is better suited for such an application (Germget al., 1994). The press is a significantly better pulp washer than a filter, but has larger capital costs.However, lower building costs and smaller filtrate tanks can compensate or even outweigh highercapital cost requirements of press washing. Savings in steam and chemicals consumption provideadditional benefits. Therefore, a press-bleach plant may be a competitive alternative for a new pulpmill. Sunds Defibrator applies dewatering presses for washing and dewatering to high solidscontent. Washing is carried out counter-current to the refining process to ensure maximum removalof dissolved material using a minimum of fresh water while preparing the pulp for the bleachingsequence. We estimate energy savings from reduced steam consumption of 0.38 GJ/t pulp (Germget al., 1994). Operating cost savings from lower chemicals use will amount to $0.53/t pulp. Capitalcost of the pre- and post-delignification washing equipment of a 900 tpd are listed at $6 million(Parthasarathy, 1997), equivalent to $17/t throughput. Therefore, for greenfield capacities and forretrofitting plants we assume that capital costs for both filters are the same. Press washers can alsobe considered as a good alternative for mill retrofits and additional washing stages, since they havevery small space requirements (Panchapakesan et al., 1993). We apply this measure to 15% ofbleached chemical pulp.
Papermaking
Stock preparation and sheet formation
Gap formingThe most common papermaking machines are based on the Fourdrinier design, but they are beingreplaced by both twin wire former and gap former designs. Gap formers are categorized as bladeformers, roll formers, and roll-blade formers (Kincaid et al., 1998; Buehler and Guggemos, 1995).Gap formers receive furnish (processed pulp) which is injected into the head box through a gap ofair onto a twin wire unit. As the furnish passes between the wires, moisture is removed from thefibers through the wires forming a paper web between the wires from the pulp . Rolls, blades, orvacuums facilitate the removal of excess water from the web, known as dewatering. (Kincaid et al.,1998). Some new top wire formers have been shown to achieve formation equivalent to gapformers (Gustafson and Duchesne, 1996). The forming sections on both former types are very shortand the formation takes place in a fraction of the time it takes for a Fourdrinier machine. The gapformer produces a paper of equal and uniform quality at a higher rate of speed. Coupling the formerwith a press section rebuild or an improvement in the drying capacity increases production capacityby as much as 30% (Kincaid et al., 1998; Paulapuro, 1993; Elenz and Schaible, 1995)12.Nevertheless, retrofitting a gap former may increase retention losses. Energy savings from gapformers come from reduced electricity consumption (Kline, 1982). The technology also mayimprove quality. We assume electricity savings of 41 kWh/t of paper (Jaccard & Willis, 1996).Based on (AF&PA, 1999) installation costs including the head box for a gap former isapproximately $75,750 per inch of width, as opposed to $30,750 for a fourdrinier with head box.We assume a capital cost of $70/t of paper with an additional maintenance cost of $0.72/t (Jaccard& Willis, 1996). Gap formers are becoming a standard technology for new machines. As from 1994to 1998 the penetration in the paper production has been of approximately 26% (AF&PA, 1999).We assume a penetration of 35% of paper production in our analysis.
High consistency formingIn high consistency forming, the furnish (process pulp) which enters at the forming stage has morethan double the consistency (3%) than normal furnish. This measure increases forming speed, andreduces dewatering and vacuum power requirements (Elahi and Lowitt, 1988). Application of this
12 Note that Anon., 1996 discusses the use of top wire formers for mini-fourdrinier and Bristol Super Formers.

31
technology is limited to specific paper grades, especially low-basis weight grades such as tissue,toweling, and newsprint. Electricity savings are estimated at 8% that is about 41 kWh/t of paper.(Elahi and Lowitt, 1988; de Beer et al., 1993). High consistency formers are expected to cost $70/tof paper with an additional maintenance cost of $0.72/t (Jaccard & Willis, 1996), also assuming thatnew paper machine wet ends are similarly costly. We apply this measure to 20% of current paperproduction with exclusion to light grade.
Extended nip press (Shoe press)After paper is formed, it is pressed to remove as much water as possible. Normally, pressing occursbetween two felt liners pressed between two rotating cylinders. Extended nip presses use a largeconcave shoe instead of one of the rotating cylinders. The additional pressing area allows for greaterwater extraction, (about 5-7% more water removal) to a level of 35-50% dryness (Elaahi andLowitt, 1988; Miller Freeman, 1998; Lange and Radtke, 1996). Since this technology reduces theload on the dryer, it allows plants to increase capacity up to 25% in cases where the plant was dryerlimited. Extended nip pressing also increases wet tensile strength (Lange and Radtke, 1996). In ouranalysis, we assume steam savings in the drying section of 16% or 1.6 GJ/t paper (de Beer et al.,1994). Although there are additional electricity requirements, we have already included them in ourtotal energy savings estimate. We assume investment costs of $38/t of paper and additionalmaintenance costs of $2.24/t (deBeer et al., 1994). According to Jaccard & Willis (1996) thistechnology has been implemented in almost half the Canadian mills. We assume an additionalpenetration of 40% in the U.S industry.
Hot pressingPre-heating the water in the paper sheet before pressing can reduce the evaporation load. In hotpressing a steam shower is used to heat the water in the sheet to 80°C or more, which lowers theviscosity of the water and softens the structure of the sheet to improve water flow (Elahi and Lowitt,1988). Steam showers can reduce dryer loads and increase machine speed and overall production.This technology reduces residence time in the nip and therefore counteracts some of the benefits ofthe extended nip press (Elahi and Lowitt, 1988). Use of steam showers has been estimated to reducethe steam requirement by 1 kg of steam per kg paper. We estimate steam energy savings of 0.61GJ/t paper through hot pressing. Costs for hot pressing technology are estimated to be $26.7/t paper.The potential share of 10% in the U.S market is mainly due to the fact that this measure is alreadynear its maximum potential implementation.
Direct drying cylinder firingInstead of heating the drying cylinders in a standard drying section of a paper machine with steam,direct drying cylinder firing heats the cylinders using natural gas or other petroleum productsthereby reducing the intermediate step of steam production. This technology can achieve significantfuel savings of 1.1 GJ/t paper13 (average for the paper grades examined) but does require additionaloperation and maintenance. We estimate additional O&M costs at $1.4/t paper (Jaccard and Willis,1996). Retrofit costs are high, $111/t paper (Jaccard and Willis, 1996), since the cylinder systemrequires significant modification. We therefore estimate a penetration rate of 5% (EIA, 1997).
Reduced air requirements (closing hoods and optimizing ventilation)Air to air heat recovery systems on existing machines recover only about 15% of the energycontained in the hood exhaust air. This percentage could be increased to 60-70% for mostinstallations with proper maintenance and extensions of the systems (Maltais –ABB Industrialdrying 1993). Paper machines with enclosed hoods require about one-half the amount of air pertonne of water evaporated that paper machines with a canopy hoods require. Enclosing the papermachine reduces thermal energy demands since a smaller volume of air is heated. Electricityrequirements in the exhaust fan are also reduced (Elaahi and Lowitt, 1988). We assume steam
13 Based on eliminating losses in steam distribution
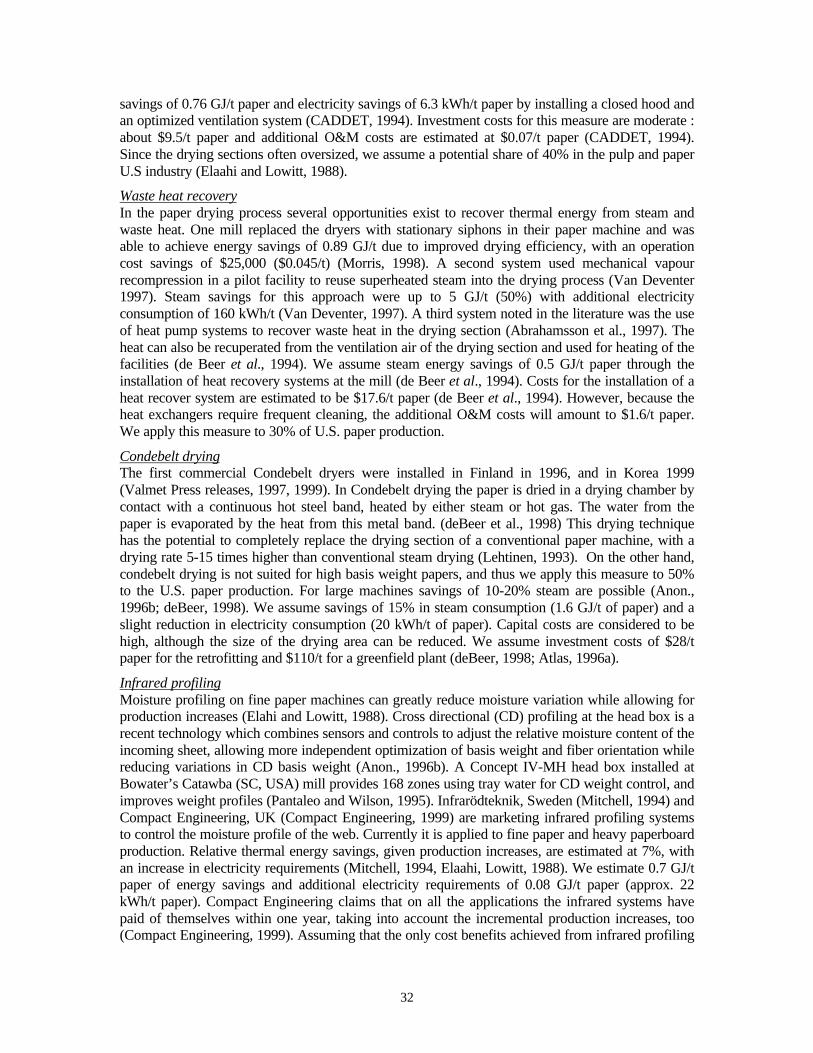
32
savings of 0.76 GJ/t paper and electricity savings of 6.3 kWh/t paper by installing a closed hood andan optimized ventilation system (CADDET, 1994). Investment costs for this measure are moderate :about $9.5/t paper and additional O&M costs are estimated at $0.07/t paper (CADDET, 1994).Since the drying sections often oversized, we assume a potential share of 40% in the pulp and paperU.S industry (Elaahi and Lowitt, 1988).
Waste heat recoveryIn the paper drying process several opportunities exist to recover thermal energy from steam andwaste heat. One mill replaced the dryers with stationary siphons in their paper machine and wasable to achieve energy savings of 0.89 GJ/t due to improved drying efficiency, with an operationcost savings of $25,000 ($0.045/t) (Morris, 1998). A second system used mechanical vapourrecompression in a pilot facility to reuse superheated steam into the drying process (Van Deventer1997). Steam savings for this approach were up to 5 GJ/t (50%) with additional electricityconsumption of 160 kWh/t (Van Deventer, 1997). A third system noted in the literature was the useof heat pump systems to recover waste heat in the drying section (Abrahamsson et al., 1997). Theheat can also be recuperated from the ventilation air of the drying section and used for heating of thefacilities (de Beer et al., 1994). We assume steam energy savings of 0.5 GJ/t paper through theinstallation of heat recovery systems at the mill (de Beer et al., 1994). Costs for the installation of aheat recover system are estimated to be $17.6/t paper (de Beer et al., 1994). However, because theheat exchangers require frequent cleaning, the additional O&M costs will amount to $1.6/t paper.We apply this measure to 30% of U.S. paper production.
Condebelt dryingThe first commercial Condebelt dryers were installed in Finland in 1996, and in Korea 1999(Valmet Press releases, 1997, 1999). In Condebelt drying the paper is dried in a drying chamber bycontact with a continuous hot steel band, heated by either steam or hot gas. The water from thepaper is evaporated by the heat from this metal band. (deBeer et al., 1998) This drying techniquehas the potential to completely replace the drying section of a conventional paper machine, with adrying rate 5-15 times higher than conventional steam drying (Lehtinen, 1993). On the other hand,condebelt drying is not suited for high basis weight papers, and thus we apply this measure to 50%to the U.S. paper production. For large machines savings of 10-20% steam are possible (Anon.,1996b; deBeer, 1998). We assume savings of 15% in steam consumption (1.6 GJ/t of paper) and aslight reduction in electricity consumption (20 kWh/t of paper). Capital costs are considered to behigh, although the size of the drying area can be reduced. We assume investment costs of $28/tpaper for the retrofitting and $110/t for a greenfield plant (deBeer, 1998; Atlas, 1996a).
Infrared profilingMoisture profiling on fine paper machines can greatly reduce moisture variation while allowing forproduction increases (Elahi and Lowitt, 1988). Cross directional (CD) profiling at the head box is arecent technology which combines sensors and controls to adjust the relative moisture content of theincoming sheet, allowing more independent optimization of basis weight and fiber orientation whilereducing variations in CD basis weight (Anon., 1996b). A Concept IV-MH head box installed atBowater’s Catawba (SC, USA) mill provides 168 zones using tray water for CD weight control, andimproves weight profiles (Pantaleo and Wilson, 1995). Infrarödteknik, Sweden (Mitchell, 1994) andCompact Engineering, UK (Compact Engineering, 1999) are marketing infrared profiling systemsto control the moisture profile of the web. Currently it is applied to fine paper and heavy paperboardproduction. Relative thermal energy savings, given production increases, are estimated at 7%, withan increase in electricity requirements (Mitchell, 1994, Elaahi, Lowitt, 1988). We estimate 0.7 GJ/tpaper of energy savings and additional electricity requirements of 0.08 GJ/t paper (approx. 22kWh/t paper). Compact Engineering claims that on all the applications the infrared systems havepaid of themselves within one year, taking into account the incremental production increases, too(Compact Engineering, 1999). Assuming that the only cost benefits achieved from infrared profiling

33
are from reduced energy costs, we estimate capital investments of $1.12/t paper (Elaahi, Lowitt,1988). We assume a penetration rate of 15%.
Dry sheet formingThe principle behind dry sheet forming is the production of paper without the addition of water. Thefibers can be dispersed either through carding (mechanical disbursement) or air laying techniques.In the air laying technique, the fibers are suspended in air and the paper is formed in thissuspension. Resins are sprayed on the sheet and are then polymerized to help forming the web. Fewplants are in operation but significant savings are possible. We estimate energy savings of 5 GJ/twith an increase in electricity requirements of 208 kWh/t (de Beer, 1998). In Germany a new dry-formed paper machine with a capacity of 25000 t/y for $37.6 million was scheduled to start up in1997. An installation cost of $1500/t has been assumed (Pulp & Paper Online, 1995).
General Measures
Pinch AnalysisPinch analysis has been used successfully in many energy-intensive industries to better optimizethermal energy flows throughout the plant. This analysis technique identifies heat flows betweencold streams (operations that require heat) and hot streams (operations that lose heat), and thenoptimizes the stream flows. The Augusta Newsprint Company identified overall steam savings of42% at a cost of $7.15/t paper (EPRI, 1997). Kimberly Clarke’s Coosa Pines facility in Alabamaalso undertook a pinch analysis in 1996. After implementing the projects, mill staff were able toachieve energy savings of 22% at a cost of $15.4/t paper. A recent analysis of the potential for pinchanalysis/process integration in Canada found a cost-effective energy savings potential of 8% (Bruce,1999). A pinch analysis of an ALCELL plant in New Brunswick, Canada found steam savings of15% (Ronan et al., 1994) with a payback period of 4 years. In our analysis we assume a thermalsaving potential of 10% (1.8 GJ/t) at a cost of $8/t paper. We do not assume any additionaloperations and maintenance costs for the measure. We apply the savings to 20% of the industry.
Optimization of regular equipmentOpportunities often exist to improve operations equipment, such as boilers and paper machines.Future systems, such as smart systems, will be able to increasingly incorporate real-time diagnosticsto improve performance (Hill et al., 1998). DeBeer et al. (1994) estimates that, although most papermachines are already equipped with a process computer, an additional 2% reduction on energydemand can be achieved by the optimization of the control equipment. Williams (1996) noted thatoptimizing the lubrication of bearings to reduce heat loss and wear and tear has achieved savings upto 30% of oil consumption, or 0.7 GJ/t paper at costs of less than $1.1/t paper. And the project alsoreduced plant down time. McNicol (1999) noted a case of several plants that focused on optimizingthe waste treatment systems of pulp and paper mill effluents. Using and optimizing submergedaeration systems for this purpose can save up to 40% of energy use, with an average savings of0.12-0.3 GJ/t paper (McNicol, 1999). We estimate electricity savings of approx. 27 kWh/t paper(De Beer, 1994) and a potential penetration rate of 30%.
Energy-efficient lightingFactory buildings often use high-pressure mercury lamps for lighting. The use of electronic ballastsand flourescent tubes in depots and offices as well as other technologies can result in electricitysavings (deBeer et al., 1994; Maillet, 1992). A detailed 1991 study by Maillet (1992) on lighting inthe paper mills assessed the replacement of existing lighting with high- pressure sodium lamps invarious sections of the paper mill. Maillet found lighting energy savings ranging from 30-75%depending on the retrofit area. We assume savings of 40% of lighting energy use, or 14 kWh/tpaper. Investment costs for this measure are estimated at $1.2/t paper, and a decline of $0.01/t paperin O&M costs is expected (DeBeer et al., 1994). We apply this measure to 20% of the industry.

34
Efficient motor systemsMotors are used throughout the pulp and paper industry to operate equipment such as fans andpump systems. As a percentage of total electricity use, motors in the pulp and paper industry rankthe highest of any U.S. industrial sector (Xenergy, 1998). In addition to motor efficiencyimprovement, motor system improvements include upgrading fan systems, air compressors, andother motor end-uses and adjustable speed drives, too. A recent study by Xenergy (1998) found atotal savings potential of 14% of total motor energy use (13,942 GWh/yr). This results in a 1994energy savings of 171 kWh/t paper. Costs estimate for motor improvements are approximately $6/tpaper based on motor replacement cost given in Motor Master+ software (Washington StateUniversity, 1998) and (Caddett, 1993). We assume a penetration rate of XX%.
Efficient Steam Production and Distribution
Boiler maintenanceA simple maintenance program to ensure that all components of the boiler are operating at peakperformance can result in substantial savings. In the absence of a good maintenance system, theburners and condensate return systems can wear or get out of adjustment. These factors can end upcosting a steam system up to 20-30% of initial efficiency over 2-3 years (OIT, 1998). We estimatea 10% possible energy savings (OIT, 1998) over 20% of all boilers (IAC, 1999). This measure canbe accomplished for an additional operating cost of $0.06/tonne paper with no additional start-upcost14.
Improved process controlUsing flue gas monitors to analyze the composition of exhaust from boiler combustion makes itpossible to maintain optimum flame temperature, and monitor CO, oxygen and smoke. The oxygencontent of the exhaust gas is a combination of excess air (which is deliberately introduced toimprove safety or reduce emissions) and air infiltration (air leaking into the boiler). By combiningan oxygen monitor with an intake airflow monitor, it is possible to detect even small leaks. A small1% air infiltration will result in 20% higher oxygen readings. A higher CO or smoke content in theexhaust gas is a sign that there is insufficient air to complete the fuel burning. Using a combinationof CO and oxygen readings, it is possible to optimize the fuel/air mixture for high flametemperature (and thus the best energy efficiency) and low emissions. We assume that this measurecan easily be applied to most big boilers (50% of total boiler capacity)15 because of its $0.42/tpycapital cost (IAC, 1999), but small boilers will not apply this measure because they will not makeup the initial capital cost as easily. Three percent of boiler fuel use could be saved by this measure(Zeitz, 1997) with an estimated additional operating cost of $0.08/tonne paper.
Flue gas heat recoveryIn this measure, heat from boiler flue gasses can be used to preheat boiler feed water in aneconomizer. While this measure is fairly common in large boilers, there is often still room for moreheat recovery. The limiting factor for flue gas heat recovery is that one must ensure that theeconomizer wall temperature does not drop below the dew point of acids in the flue gas (such assulfuric acid in sulfur containing fossil fuels). Traditionally this has been done by keeping the fluegasses exiting the economizer at a temperature significantly above the acid dew point. In fact, theeconomizer wall temperature is much more dependent on the feed water temperature than flue gastemperature because of the high heat transfer coefficient of water. As a result, it makes more senseto preheat the feed water to close to the acid dew point before it enters the economizer. This allowsthe economizer to be designed so that the flue gas exiting the economizer is just barely above the
14 Unreferenced operating cost changes are based on an industry-wide estimate of maintenance costs as a percentage ofcapital costs.15 All boilers greater than 100MMBtu/hr. Based on GRI, 1996

35
acid dew point. One percent of fuel use is saved for every 25°C reduction in exhaust gastemperature. (Ganapathy, 1994). Since exhaust gas temperatures are already quite low, we assumea 2% savings across half of all boilers, with a capital cost of $0.66/tpy (IAC, 1999). Operatingexpenses are expected to increase by $0.09/tonne paper.
Blowdown steam recoveryWater is periodically blown from the boiler to remove accumulated impurities. When the water isblown from the high pressure boiler tank to remove impurities, the pressure reduction oftenproduces substantial amounts of steam. This steam is low grade, but can be used for space heatingand feed water preheating. We assume that this measure can save 1.3% of boiler fuel use16 acrossall small boilers (41% of total boiler capacity)17 with a capital cost of $0.82/tpy (IAC, 1999).Operating expenses will increase slightly, estimated at $0.11/tonne paper.
Steam trap maintenanceSteam traps have the function of removing condensed steam and non-condensable gases withoutlosing any live steam. As these traps can vent significant amounts of steam if not properlymonitored, a simple inspection and maintenance program can save significant amounts of energyfor very little money. If the steam traps are not regularly monitored, 15-20% of the traps can bemalfunctioning. Energy savings for a regular system of steam trap checks and follow-upmaintenance is conservatively estimated at 10% (OIT, 1998; Jones 1997; Bloss, 1997) with aninitial cost of $1.24/tpy (IAC, 1999). This measure offers a quick payback but is often notimplemented because maintenance and energy costs are separately budgeted. We estimate that thiscan be applied in an additional 50% of steam systems and will cost an additional $0.06/tonne paperto fund the program.
Automatic steam trap monitoringAttaching automated monitors to steam traps in conjunction with a maintenance program can saveeven more energy, without significant added cost. This system is an improvement over steam trapmaintenance alone, because it gives quicker notice of steam trap failure, and can detect when asteam trap is not performing at peak efficiency. Using automatic monitoring is conservativelyestimated to give an additional 5% energy savings over steam trap maintenance alone with a capitalcost of $1.23/tpy18 (Johnston, 1995; Jones, 1997; Climate Wise, 1996). Systems which are able toimplement steam trap maintenance are also likely to be able to implement automatic monitoring, sowe estimate an additional 50% of systems can implement this measure. Maintaining the automaticmonitors is estimated to cost an additional $0.16/tonne paper.
Leak repairAs with steam traps, the distribution pipes themselves often have leaks that go unnoticed without aprogram of regular inspection and maintenance. In addition to saving 3% of energy costs (0.5 GJ/t)having such a program can reduce the likelihood of having to repair major leaks. (OIT, 1998;Climate Wise, 1996). We estimate that this is applicable to an additional 12% of industry19 with aninitial cost of $0.27/tpy (IAC, 1999). Funding an ongoing program is estimated to cost $0.03/tonnepaper.
Condensate returnReusing the hot condensate in the boiler saves energy and reduces the need for treated boiler feedwater. Usually fresh water must be treated to remove solids that might accumulate in the boiler, and
16 Based on the following assumptions: 10% of boiler water is blown down (OIT, 1998) and 13% of the energy can berecovered from this (Johnston, 1995).17 All boilers less than 100MMBtu/hr. Based on GRI, 199618 Calculated based on a UK payback of 0.75 years (accounts for lower U.S. energy prices)19 This estimate is based on the percentage of IAC heat system projects where leak repairs were implemented.

36
returning condensate can substantially reduce the amount of purchased chemical required toaccomplish this treatment. The fact that this measure can save substantial energy costs andpurchased chemicals costs makes building a return piping system attractive. This measure has,however, already been implemented in most of the places where it is easy to accomplish. Weassume a 15% energy savings (OIT, 1998) with a capital cost of $3.77/tpy for an additional 2% ofthe boiler population (IAC, 1999). Maintaining a condensate return system is estimated to cost$0.54/tonne paper.
Other Measures
Increased use of recycled pulp (only included in Case B)The energy and carbon emissions impacts of this measure may vary greatly depending on furnishand final product types. In 1994, 28 Mt of wastepaper pulp was used in the pulp and paper industry(AFPA, 1998). This accounted for 32% of all pulp. In its collaborative research work with the U.S.Department of energy, the U.S. pulp and paper industry has discussed increasing the use of recycledpulp to further reduce energy use associated with virgin pulping processes. Recycled pulp doesproduce sludge that presents a disposal difficulty. Flotation deinking is the current best practice inthis area (McKinney, 1998). In our analysis, we assume that additional technical capacity exists toincrease recycled pulp production to 15% of the existing production mix. Given the existing 1994pulping production mix, this increase would result in energy savings of 13.4 GJ/t steam and 2.06GJ/t electricity. Additional costs for the construction of recycled pulp processing facilities areestimated at $485/t pulp, and depending on the price of waste paper versus virgin pulp this mayresult up to $73.9/t pulp in O&M cost savings (O’Brien, 1996).
Increased combined heat and powerA recent study done by LBNL estimates about 17.8 GW of remaining technical potential forcombined heat and power systems (CHP) installations (Khrushch, et.al., 1999). This potential canresult in about 89-150 TWh/y electricity and 456-767 GJ/y steam generated on-site. This will resultin about 600-1000 GJ/y primary energy savings in comparison to generating the same amount ofelectricity and steam by conventional systems20. Respectively, primary energy savings per tonne ofoutput will be 7-11 GJ/t paper. This will amount to about $24-$53/t of paper of savings onpurchased electricity. The needed capital investments will run between $140-168/t of paper for newinstallations and $103-150/t of paper for retrofit (Khrushch, et al., 1999). We estimate that thismeasure can be applied to about 50% of paper throughput. The combined heat and power systemsusually change the thermal and electric load in pulp and paper facilities. Therefore, we do notinclude this technology in our supply curve.
Advanced TechnologiesThe advanced technologies described below are not included in our assessment of cost effectivepotential, but we include the descriptions for informational purposes.
Alcohol based solvent pulpingAlcohol based solvent pulping offers a potential advantage to traditional Kraft pulping in that it canproduce high yield high quality pulps in shorter cooking times. The process also produces a sulfur-free lignin that is extracted at a much faster rate than the Kraft process. Wood chips and the ethanol-water solution is processed in a batch digester at 200°C and 392 psi (Elahi and Lowitt, 1988). Thecombination of alcohol and high temperature releases about 75% of the lignin; most of the
20 In a conventional system electricity is generated by the utility and than sold to the pulp and paper company, and steam isproduced by industrial boiler on-site.

37
remaining lignin is removed with secondary extraction liquor and recycled alcohol-water. Steamstripping is used to recover residual alcohol from the pulp (Elahi and Lowitt, 1988). Lignin isrecovered from the black liquor in a proprietary process. A drawback is the high cost of solventsthat can be cost prohibitive. One source estimates a small amount of additional fuel inputrequirements of 0.9 GJ/t pulp with electricity savings of 273 kWh/t (Elahi and Lowitt, 1988). A 142ktonne test plant considered in 1994 had an installation cost of $21.1/t (Anonymous, 1994a).
Black liquor gasification with gas turbineBlack liquor gasification is used to produce gas from spent pulping liquor. This gas can be used in atraditional boiler, or may in the future be used in conjunction with gas turbines. There are two majortypes of black liquor gasification: low temperature/solid phase and high temperature/smelt phase.Today, black liquor gasifiers are used as an incremental addition in chemical recovery capacity insituations where the recovery boiler is a process bottleneck. In the future, gasifiers may be able toprovide fuel for gas turbines and lime kilns (Nilsson et al., 1995; Lienhard and Bierbach, 1991) bymeans a standard combined cycle power generation system (the system is made up of gas turbine,heat recovery systems, steam turbine and electricity generators). The success of turbine basedtechnology depends on making a turbine that can use low energy gas (produced by an air blowngasifier) or the creation of a more efficient oxygen blown gasifier. We assume the improved turbineand thus respective fuel savings of 1.6 GJ/t pulp for a complete gasification and combined cyclesystem (Gilbreath, 1995). We expect this technology to cost $320/t production for a turnkeyinstallation. It will also cost $6.9/t pulp more in operation and maintenance costs21. Thistechnology is relatively new. There is one commercially operating mill in New Bern mill, NorthCarolina and one in Sweden though recently shut down (McCubbin, 1996; Finchem, 1997.).According to European sources this technology is expected to interest a wide share of chemicalmills, the expectation is for approx. 80% of the chemical pulp (Atlas, 1996b )
Impulse dryingImpulse drying involves pressing the paper between one very hot rotating roll (150-500°C) and astatic concave press (the nip) with a very short contact time. The pressure is about 10 times higherthan that in press and Condebelt drying (deBeer, 1998; Boerner and Orloff, 1994). Impulse dryingtremendously increases the drying rate of paper although there may be problems with the paperdelaminating or sticking to the roll (Boerner and Orloff, 1994). Energy savings can be significant.DeBeer (1998) assumes potential savings steam consumption of 50-75%. Another description ofimpulse drying claims energy savings of about 18-20% or 2.1 GJ/t paper (Lockie, 1998, CADDETEEproject 1993). Electricity requirements do increase however, by 5-10%. (deBeer, 1998). Jaccard(and Associates, 1996) report an average installation cost of $74/t paper for linerboard. Impulsedrying subjects the paper web to very high temperatures at the press nip in order to drive moistureout of the web. The technology promises to bring reduced capital costs, increased machineproductivity, reduced fibre use, reduced energy use and improved physical properties in the paper.But it is still a technology to be proved on a commercial scale, due to difficulties in controlling thephysical aspects of the web under the intense condition.
Infrared dryingShort-wave infrared drying provides better heat transfer capabilities and compactness(Infrarödteknik, 1999). Infrared drying improves system’s moisture evaporation rate by directingmore of the heat (at higher temperatures) onto the web itself. Along with improved energyefficiency, it increases the drying power output. Infrared dryers are powered by electricity, andrequire about 4.08 GJ of electricity/t paper versus 8.16 GJ of steam/t paper for conventional steamdryers (Jaccard, Willis, 1996). We therefore estimate primary energy savings of 3.3 GJ/t paper.Investment costs for infrared dryer installation are $120/t paper and additional O&M costs 21 The costs and savings are based on a comparison of the following articles: Consonni, et al. July, 1998. Kreutz et al.,1998. Larson et al., 1998a. Larson, et al., 1998b. Lorson, et al., December 1997. Nasholm et al., 1997.

38
requirements are $0.92/t paper (Jaccard, Willis, 1996). As being this technology mostly suitable fordrying high-quality coated paper, we estimate that it can be applied to about 15% of total paperproduced.
Pre-treatment of incoming pulp into drying sectionBoise Cascade and Weyerhauser have combined efforts to explore the potential of pre-soaking thenever dried pulp in a sodium carbonate solution. This solution replaces some of the water in thepulp fiber micropores and thereby reduces drying energy use. Energy savings for this process havebeen estimated at 16% of steam, or 1.7 GJ/t paper (Allan et al.,1997).
Air impingement dryingAir impingement drying involves blowing hot air (300°C) in gas burners at high velocity against thewet paper sheet. This technology can be combined with existing technologies. (deBeer et al., 1998).Heat input requirements have been modelled at 3 MJ/kg evaporated water, or a 10-40% savings insteam requirements. Electricity requirements are expected to increase by 0-5%.
Steam impingement dryingIn steam impingement drying superheated steam (300°C, 1.1 bar) rather than hot air is used as thedrying medium (deBeer, 1998). The steam is blown onto the sheet. Steam requirements areestimated at 4.5 GJ/t paper with additional savings available if the latent heat from the purge steamis captured. (DeBeer, 1998) estimates a savings of 10-15%, with a slightly lower reduction inelectricity requirements (5-10%).
Airless dryingAirless drying uses the latent heat of the evaporated moisture and requires an airtight and well-insulated hood around the drying section of the paper machine. The paper is still dried by steamheated cylinders, as in conventional drying, but the steam is produced by compressing theevaporated water. This condensed water vapor can provide 60-80% of the total amount of thermalenergy needed for drying, achieving a 70-90% reduction in thermal energy requirements (deBeer,1998). Electricity requirements increase (15-20%) due to increased ventilation requirements(deBeer, 1998).
Press dryingIn press drying, the sheet is pressed between two hot surfaces or pressing cylinders at a temperatureof 100-250°C. In most cases these cylinders are installed in between the conventional pressingsection and the drying section of the machine. The drying rate can be 2-10 times faster thanconventional drying (deBeer, 1998). Energy savings have been estimated at 5-30%. This technologyis near commercialization.
VII. ENERGY EFFICIENCY AND CARBON DIOXIDE EMISSIONS REDUCTIONPOTENTIAL FOR PULP AND PAPERMAKING IN THE U.S.
Supply Curve MethodologyIn the 1970s, energy conservation supply curves were developed by energy analysts as a means ofranking energy conservation investments alongside investments in energy supply in order to assessthe least cost approach to meeting energy service needs (Meier et al, 1983). Energy savingtechnologies and measures can be ranked by calculating the Cost of Conserved Energy (CCE),which accounts for both the costs associated with implementing and maintaining a particulartechnology or measure and the energy savings associated with that option over its lifetime (Koomeyet al., 1991). Ranking investments according to supply curve methodology is consistent withmicroeconomic theory which posits that a firm will invest in energy conservation up to the pointwhere the marginal costs equal the marginal benefits, or the value of one unit energy saved or the

39
price of energy. When all options are then ranked according to their cost effectiveness, one candevelop a curve ranking the lowest cost to the highest cost options (Velthuijsen, 1995). The CCE ofa particular measure is calculated as:
Annualized Investment + Annual Change in O&M CostsCCE = Annual Energy Savings (eq. 1)
The Annualized Investment is calculated as:
AI = Capital Cost x d/(1-(1+d)-n) (eq.2)
where d is the discount rate and n is the lifetime of the conservation measure. For this analysis, a30% real discount rate is used, reflecting the capital constraints and preference for short paybackperiods and high internal rates of return in the pulp and paper industry. In order to calculate thecurrent cost of energy, the industry average fuel cost based on energy consumption data and energyprice data for the industry in 1994 is used as reference (U.S. DOE, EIA, 1997).
CCEs are calculated for each measure that can be applied in the pulp and papermaking. The CCEsare plotted in ascending order to create a conservation supply curve. The width of each option ormeasure (plotted on the x-axis) represents the annual energy saved by that option. The height(plotted on the y-axis) shows the option’s CCE. All measures that fall below the average-weightedprice of energy for the pulp and papermaking industry can be defined as cost-effective.22
Similarly, the specific carbon emissions reduction costs – Cost of Avoided Carbon (CAC) –will bedefined as total net annual costs divided by the annual emissions avoided, due to implementedenergy efficiency measures:
Annualized Investment + Annual Change in O&M CostsCAC = Annual Carbon Avoided (eq.3)
Case A: Cost-Effective Energy and Carbon Savings without RecyclingThe energy conservation supply curve shown in Figure 6 is a snapshot of the total annualized costof investment for all of the efficiency measures being considered at that point in time. The technicalpotential for energy savings reflects the total area under the curve represented by all the measuresexamined in this analysis. The total technical potential for energy savings in the industry isapproximately 1013 PJ representing about 31% of the 1994 primary energy consumption in the pulpand paper industry.
22 For examples of conservation supply curves in the buildings, transportation, and industrial sectors, see Meier et al.,1983; Ross, 1987; Ledbetter and Ross, 1989; Difiglio et al., 1990; EPRI, 1990; Ross, 1990; Block et al., 1993;Interlaboratory Working Group, 1997; Koomey et al., 1991; Krause et al., 1995; Rosenfeld et al., 1991; DeBeer et al.,1996; National Academy of Sciences, 1992; Worrell, 1994, Worrell et al., 1999.

40
Figure 6. Case A: Energy Conservation Supply Curve for U.S. Pulp and Paper Industry(Excluding increased recyling of waste paper)
The cost-effective potential reflects those efficiency investments which have a CCE lower than theaverage price of energy ($3/GJ). We identify a cost-effective energy savings potential of 533 PJ, or16% of 1994 primary energy consumption. The actual cost-effective energy savings may be higher,since not all of the energy-saving technologies and measures mentioned are included due to a lackof available data on investment and O&M costs of these technologies.
The calculation of average energy prices was based on data from the U.S. ManufacturingConsumption Survey (U.S. EIA, 1997a). Using different methods of averaging we calculated arange of prices from $2.7/GJ to $3.4/GJ. However, even using the lower and upper bound prices,energy savings are still 13-14% of total primary energy consumption. About 10 PJ of primaryenergy savings can be achieved at negative cost.
Carbon dioxide emission reductions associated with the implementation of all identified measureswas estimated at 7.6 MtC, reducing carbon dioxide emissions from the 1994 level by nearly 25%.Most of the reductions are due to measures that reduce fuel or steam use by the various processes.Some of the largest technical potential savings identified are in chemical pulping (especially newdigester technology), papermaking (new drying technologies) general plant-wide measures, andboiler efficiency measures. As indicated by the term technical potential, not all of the measuresidentified can be achieved cost effectively at the current energy prices.
Following the methodology for the energy conservation supply curve, the authors constructedcarbon dioxide emission reduction supply curve for the pulp and paper industry (see Figure 7).Similar to the conservation supply curve for energy savings, the cost-effective potential for carbondioxide emissions can be determined. The difference between the two curves is determined by thecrabon intensity of the fuel mix. Due to the large share of biomass in the fuel mix, the relative effectof the energy efficiency measures on emission reduction will be lower compared to that for energyuse. Using the average energy prices the cost effective level of carbon dioxide emissions reductionswas where the cost of conserved carbon fell below $0.25/kgC. As figure 7 indicates, 1994 cost-
-50.0
-25.0
0.0
25.0
50.0
75.0
100.0
125.0
150.0
0 2 4 6 8 10 12 14Primary Energy Savings (GJ/t paper)
Co
st o
f C
on
serv
ed E
ner
gy
($/G
J)
Dis
cou
nt
Rat
e =
30%
1994 Weighted Average Primary Fuel Price [$3.0/GJ]
Annual Cost Effective Primary Energy Savings 533 PJ (6.5 GJ/tonne)

41
effective carbon dioxide emissions reductions were estimated at 4.4 MtC. This value is 14% belowthe 1994 baseline emissions of 31.5 MtC (US EIA, 1997). Estimated carbon emissions for the pulpand paper industry in 1990 were 29.1 MtC (28 kg/t paper). The cost effective energy efficiencymeasures would reduce the paper industry’s emissions to 7% below 1990 levels.
Figure 7. Case A: Carbon Dioxide Emission Reduction Supply Curve for U.S. Pulp andPaper Industry
In order to rate the cost effectiveness of the energy efficiency investments, the internal rate ofreturn (IRR) and simple payback period (PBP) of each technology and measure are provided. TheIRR shows the value of the discount rate to make the net benefits cash flows equal to the initialinvestment, while the PBP gives the number of years it takes before the forecasted cash flowsequal the initial investment. Industry executives in making investment decisions commonly usethese indicators. Table 6 provides the list of measures ranked by their cost of conserved energy, andgives their internal-rate-of-return, and simple payback period based on an average fuel cost of$3/GJ.
-5
0
5
10
15
20
25
0 5 10 15 20 25 30 35 40 45 50 55 60 65 70 75 80 85 90 95 100Carbon Dioxide Emissions Reduction (kgC/t paper)
Co
st o
f C
arb
on
Em
issi
on
s ($
/kg
C)
Dis
cou
nt
Rat
e =
30%
Carbon emissions reductions needed to achieve 1990 levels of
emissions for the industry (28 kgC/t paper)
Cost-effective carbon emissions reductions from
energy efficiency (48 kgC/t paper)
(4.4 MtC)

42
Table 6. Case A: Cost of Conserved Energy for Selected Measures in U.S. Pulp and PaperIndustry
PrimaryCCE
PrimaryEnergysavings
Cumulativeprimary
energy savings
$3/GJInternalrate ofreturn
Simplepayback time
CarbonEmissionsReduced
$/GJ GJ/t GJ/t % years kgC/tBar-type chip screens -0.39 0.06 0.06 142% 0.7 0.38Screen out thick chips -0.39 0.06 0.12 -- 0.7 0.38Boiler maintenance 0.04 0.36 0.48 >500% 0.0 2.26Improved Process Control 0.04 0.38 0.86 292% 0.2 2.41Condensate Return 0.14 0.08 0.93 299% 0.3 0.48Automatic Steam Trap Monitoring 0.19 0.63 1.57 152% 0.3 4.02Flue Gas Heat Recovery 0.29 0.18 1.75 324% 0.7 1.13Continuous digester modifications 0.39 0.42 2.16 >500% 0.3 2.63Leak Repair 0.44 0.09 2.25 205% 0.1 0.58Infrared profiling 0.45 0.13 2.38 201% 0.5 0.57Batch digester modifications 0.55 0.41 2.79 111% 0.5 2.59Blowdown Steam Recovery 0.82 0.14 2.92 95% 0.9 0.86Pinch Analysis 0.95 0.51 3.43 >500% 1.0 3.22Steam trap maintenance 1.10 1.27 4.70 63% 0.2 8.04Efficient motors 1.55 1.25 5.95 83% 1.6 19.57Lime kiln modifications 1.63 0.06 6.01 28% 1.8 1.01Reduced air requirements 2.61 0.45 6.46 85% 2.9 3.01Refiner Improvements 3.05 0.01 6.47 17% 3.4 0.20Heat recovery in thermomechanical pulping 3.27 0.05 6.53 23% 4.7 0.27Energy-efficient lighting 3.43 0.02 6.55 15% 3.7 0.33Condebelt drying 3.50 1.21 7.76 82% 3.8 8.37Optimization of regular equipment 4.60 0.07 7.82 -- 0.0 1.02Biopulping 5.16 0.04 7.87 -7% 30.1 0.78Extended nip press (shoe press) 5.96 0.91 8.78 47% 8.1 5.76RTS 6.73 0.02 8.80 -4% 7.4 0.38Continuous digesters 7.02 1.26 10.06 49% 7.7 7.21Washing presses 8.47 0.03 10.09 3% 7.8 0.19Hot Pressing 8.88 0.09 10.18 -2% 9.7 0.55High consistency forming 8.97 0.42 10.60 10% 10.5 3.11Waste heat recovery 9.77 0.21 10.81 12% 34.4 1.35Pressurized groundwood pulping -Super 11.97 0.02 10.83 5% 11.6 0.30Ring style debarker 12.68 0.01 10.84 -- 13.1 0.21Direct drying cylinder firing 23.29 0.08 10.92 -- 35.3 0.47Falling film black liquor evaporation 23.81 0.22 11.14 16% 26.1 1.95Enzyme-assisted debarker 28.43 0.02 11.16 -- 31.3 0.29Gap forming 73.14 0.10 11.26 -- 376.5 1.64Dry sheet forming 81.07 0.84 12.10 26% 88.7 3.18Brownstock washing 120.78 0.01 12.11 -- 18.9 0.08Cradle Debarker 156.05 0.02 12.13 -- 171.6 0.34Ozone bleaching 1968.70 0.00 12.13 -- 72.3 0.03Chip conditioners -- 0.05 12.18 -- -- 0.34Belt conveyors -- 0.02 12.21 -- -- 0.39Fine-slotted wedge wire baskets -- 0.01 12.22 -- -- 0.13LCR -- 0.00 12.22 -- -- 0.03Thermopulp -- 0.01 12.23 -- -- 0.19Improvements in CTMP -- 0.02 12.24 -- -- 0.25Tampella recovery system -- 0.04 12.28 -- -- 0.21

43
Scenario with waste paper recycling: Case B
In Case B, we increased the tonnage throughput of recovered paper in pulp and paper mills, therebylowering the amount of virgin pulp. The authors understand that the economic recovery of fibers isvery product, site and time dependent but felt it important to include as a scenario. This scenariolowers the effective national energy efficiency potential from process conservation measures in thepulping mills since there is less throughput of wood and chemical pulps. However, the energyefficiency potential of the paper sector overall is increased since a larger share of the paperproduction is replaced with recovered paper. (As the energy savings in Table 4 indicates, the energyrequirements to produce paper from recovered or recycled paper are significantly lower than therequirements of producing paper from virgin pulp.) The total technical potential for energy savingsin the industry is approx. 1215 PJ representing about 37% of the 1994 primary energy consumptionin the pulp and paper industry. Carbon dioxide emission reductions associated with the primaryenergy savings are about 9.1 MtC, reducing carbon dioxide emissions from the 1994 level by over29%. We use the same costs energy saving and cost assumptions in both scenarios (see Table 4) butdo vary the throughput of materials at the various process stages to account for an increase inrecovered paper.
Case B: Cost-Effective Energy and Carbon Savings with RecyclingAs in Case A, we identify cost-effective potential as those technologies and measures which have acost of conserved energy (CCE) less than the average price of energy. In Case B, we identify a cost-effective energy savings potential of 520 PJ or 16% of primary energy consumption. The equivalentcarbon dioxide emissions reductions are 4.3 MtC (14% below 1994 levels). While the technicalenergy efficiency potential is greater in the case of increasing recovered paper (37% as compared to31% in scenario A), the cost-effective potential is lower.
The primary reason for the lower cost-effective energy savings is that the recycled paper measure,which has a cost of conserved energy of $3.2/GJ is just slightly above the average price of energy($3.0/GJ) (see Figure 8). While the amount of energy savings in scenario A was not sensitive to therange of average energy prices examined in this analysis (a variation of only 1% primary energysavings) in Case B the sensitivity is greater. In the recycled paper scenario, the savings betweenenergy prices of $2.6/GJ and $3.4/GJ range from 16-22%.
44
Figure 8. Case B: Energy Conservation Supply Curve for U.S. Pulp and Paper Industry(Including increased recycling of waste paper)
The cost effectiveness of the various technologies and measures shown in Table 5 (cost ofconserved energy (CCE), internal rate of return (IRR), payback period) remains the same for bothscenarios. The CCE, IRR, and payback period for increased use of recycled paper are $3.2/GJ, 29%,and 3.4 years respectively.
The total carbon savings of the measures do change in scenario B since the throughput of pulp isreduced to account for increased use of recycled paper. Figure 9 ranks all measures andtechnologies in a carbon reduction supply curve for the pulp and paper industry for scenario B. Thiscurve ranks the measures in terms of the amount of carbon emissions reductions that can beachieved at various investment costs. As the figure indicates, cost-effective carbon dioxidereductions amount to 2.8 MtC (32 kgC/t paper), or 1% below 1990 levels. If the recycled papermeasure were included (as it can be considered cost-effective in certain price regimes), cost-effective carbon dioxide emission reductions would be 7% below 1990 levels.
Including waste paper recycling development
-50.0
-30.0
-10.0
10.0
30.0
50.0
70.0
90.0
110.0
130.0
150.0
170.0
0 2 4 6 8 10 12 14 16 18
Energy Savings (GJ/t paper)
Co
st o
f C
on
serv
ed E
ner
gy
($/G
J)
Dis
cou
nt
Rat
e =
30%
Annual Cost Effective Primary Energy
Savings520 PJ
(6.3 GJ/tonne)
1994 Weighted Average Primary Fuel Price [$3/GJ]

45
Figure 9. Case B: Carbon Dioxide Emission Reduction Supply Curve for U.S. Pulp andPaper Industry
VIII. SUMMARY AND CONCLUSIONSAlthough the U.S. pulp and paper sector has reduced its primary energy intensity by 27% over thepast 25 years (1970-1994), a large technical potential still exists to further reduce energy intensity.This analysis of U.S. pulp and paper industry reviews more than 45 specific energy-efficiencytechnologies and measures, and assesses energy savings, carbon dioxide savings, investments costsand operation and maintenance costs according to two scenarios (with and without development ofthe recycled paper use). Using a conservation supply curve methodology, we identify a total cost-effective reduction of 6.3-6.5 GJ/t of paper. This is equivalent to an achievable energy savings of16% of 1994 U.S. pulp and paper primary energy use and 14% of U.S. pulp and paper carbondioxide emissions (corresponding to a reduction of almost 48-49 kgC/t of paper). If one includes theexpansion of recycled paper production as cost-effective, then potential cost-effective energysavings increase to 22% of primary energy use in 1994. These results are consistent with otherrecent studies that have also examined potentials in the pulp and paper industry (Ruth et al, 2000,
IX. FUTURE AREAS OF RESEARCHThe difference between case A and case B highlights the importance of recycling. The potential forincreased use of recovered fiber is product, site, and time-dependent, and given the complexity ofthe issue, a better assessment of the technical and policy requirements for removing the barriers andidentifying opportunities to increase waste paper recovery and recycling is necessary. As can beseen from the write up in Section V, we derived our cost data and energy savings data primarilyfrom a thorough literature review from existing trade publications. There was, however, limitedinformation on some of the measures. Further refinement and improvement of cost estimates andbenefits of energy efficient investments would be desired. Finally, it is often the case that certainnon-energy, productivity benefits accompany the investment in updated technology. We believethat a careful investigation into this area could further strengthen the case for selected energyefficiency investment in this sector.
X. ACKNOWLEDGEMENTSThis work was supported by the Climate Protection Dvision, Office Office of Air and Radiation,
Including waste paper recycling
-10.0
-7.5
-5.0
-2.5
0.0
2.5
5.0
7.5
10.0
12.5
15.0
17.5
20.0
22.5
25.0
0 10 20 30 40 50 60 70 80 90 100 110 120Carbon Dioxide Emissions Reduction (kgC/t paper)
Co
st o
f C
arb
on
Em
issi
on
s ($
/kg
C)
Dis
cou
nt
Rat
e =
30%
Carbon emissions reductions needed to achieve 1990 level emissions for the
industry (28 kgC/t paper) Cost-effective carbon emissions
reductions from energy efficiency (49.9 kgC/t paper)
(4.3 MtC)

46
U.S. Environmental Protection Agency through the U.S. Department of Energy under Contract No.DE-AC03-76SF00098. We are indebted to the generous review of many paper industry experts whowere kind enough to give their time and expertise in improving earlier versions of this report. Inparticular we would like to thank the input from the staff at National Council of the Paper Industryfor Air and Stream Improvement, Inc. (NCASI) who reviewed the report and generously compiledcomments from the American Forest and Paper Association, Climate Change Options AdvisoryGroup, a collection of industry experts who reviewed the document. Tom King from the U.S.Department of Energy’s Office of Industrial Technologies reviewed an earlier version of this reportas did Denny Hunter, Peter Thorn, and Richard Shenk from Weyerhauser. In addition we wouldlike to thank the help of the staff at the U.S. Forest Products Laboratory in Madison, Wisconsin fortheir support of this document and the review by staff at the U.S. Environmental Protection Agency.
XI REFERENCES
Abrahamsson, K.; Stenstrom, S.; Aly, G. and Jernquist, A. 1997. “Application of Heat Pump Systems forEnergy Conservation in Paper Drying.” International Journal of Energy Research. Vol. 21. Pp.631-642.
Alami, R. 1997. “Impact of refining intensity on energy reduction in commercial refiners: effect of primarystage consistency” TAPPI Journal 80 (1).
Allan, G.; Carroll, J.; Devakula, M.L.P.; Gaw, K.; Joseph, A., and Pichitlamken, J. 1997. “The effect offiller location on the drainage, pressing, and drying of pulp and paper,” TAPPI Journal 8 (80). Pp. 175-179.
American Forest and Paper Association. 1996. Paper, Paperboard & Wood Pulp: Monthly StatisticalSummary. Washington D.C.: AFPA.
American Forest and Paper Association, Climate Change Options Advisory Group, 1999. Personalcommunication.
American Forest and Paper Association. 1998. 1998 Statistics. Washington D.C.: AFPA.
Anonymous, 1993a. “Weyerhaeuser Investing $500 Million for New Fiberlines at Plymouth Mill,” Pulpand Paper Magazine. Miller Freeman Publications Inc.: San Francisco. Web site:http://www.pponline.com/db_area/archive/p_p_mag/1993/9311/93110119.htm
Anonymous, 1993b. "Pope & Talbot Modernizes Halsey Pulp Mill." Pulp and Paper Week. MillerFreeman Publications, San Francisco.
Anonymous. 1994a. “Repap to Build Alcell Plant.” Pulp and Paper Week, Jan 10. Miller FreemanPublications, San Francisco.
Anonymous, 1994b. “Weyerhaeuser Paper Co.: Refocusing Redefines Major Industry Player,” Pulp andPaper Magazine. Miller Freeman Publications Inc.: San Francisco. Web site:http://www.pponline.com/db_area/archive/p_p_mag/1994/9401/94010102.htm
Anonymous. May, 1995a. "Weyerhaeuser's $1-billion, Three-Facility Modernization Program NearCompletion." Pulp and Paper Week. Miller Freeman Publications, San Francisco.
Anonymous. 1995b. “Sludge Disposal a Growing Problem as More Deinking Plants Come Online.” PaperRecycler, May 1, 1995. http://www.pponline.com/db_area/archive/papr_rec/1995/9505/95050102.htm
Anonymous. 1995c. "Woodhandling Focus.” Pulp and Paper International. Miller Freeman Publications,San Francisco. May 1, 1995. http://www.pponline.com/db_area/archive/ppi_mag/1995/9504/95040109.htm

47
Anonymous, 1996a. “Phoenix Rises from the Ashes.” Pulp and Paper International. January. MillerFreeman Publications, San Francisco.
Anonymous, 1996b. “Board gets a boost in demand and technology.” Pulp and Paper International. MillerFreeman Publications.
Anonymous, 1997. “105 million CAD for a 900 tpd new plant in 1995” Pulp and Paper International.Miller Freeman Publications. http://www.pponline.com/db_area/archive/p_p_mag/1997/9706/focus1.htm
Anonymous, 1998 “Sunila invests $35 million at Kotka.” Pulp and Paper International This Week. MillerFreeman Publications. San Francisco.
Atlas, 1996a (?). “Condensing Belt drying”. http://europa.eu.int/en/comm/dg17/atlas/html/ppcbd.html.
Atlas, 1996b (?). “Black Liquor gasification –Introduction to the technology”.http://europa.eu.int/en/comm/dg17/atlas/htmlu/ppblg.html.
Bialkowski, W.L. 1998. “Mill Audits Can Cut Costs by Reducing Contro Loop Variability.” Pulp andPaper Magazine. Miller Freeman Publications Inc.: San Francisco. Web site:http://www.pponline.com/db_area/archive/p_p_mag/1998/9812/focus3.htmBloss, Douglas; Bockwinkel, Richard; Rivers, Norman. “Capturing Energy Savings with Steam Traps.”American Council for an Energy Efficient Economy, Washington DC.
Bergin, J. 2000. Personal communication regarding Consolidated Papers expenditures on ozone bleachingsystems.
Blok K., Worrell E. 1992. “Heat and Electricity Consumption of Large Industrial Energy Users inNetherlands.” Heat Recovery Systems & CHP. Vol. 12, No.5, pp. 407-417.
Boerner, J. and Orloff, D. “Effects of basis weight and freeness on sheet permeabiity and critical impulse-drying temperature,” TAPPI Journal 77(2). Pages: 163-168.
Bruce, Douglas. 1999. H.A. Simons Consulting. Personal communication regarding upcoming report beingprepared for the Canadian Forest service entitled “A Systems Approach to Energy Management in the Pulpand Paper Industry.”
Buehler, E. and Guggemos, A. 1995. “Duoformer CFD – First Production experience with LWC” TAPPIPapermakers Conference Proceedings, 1995. Altanta: TAPPI.
Byrne, M. and Larsen, L.B. 1997. “Energieeinsparung durch Einsatz eines S/P-Schottervorwarmers aneinem Kalkdrehofen,” ZKG International 50 (9).
CADDETT brochure R163, 1993. Project number SE-93-002. http://Www.caddet-ee.org/register/dataee/CCE01935.htm
CADDETT, 1990. Project number SE-94-509. SE-94-509. http://Www.caddet-ee.org/register/dataee/CCE01832.HTM
Cadmus Group, Inc. 1997a. Task 4 Final Report: Analysis and Evaluation of Gasification Technologiesfor the U.S. Pulp and Paper Industry. Cadmus Group, Inc., Waltham, MA.
Cadmus Group, Inc. 1997b. Task 2 Final Report: Evaluation of the Current and Expected Future Role ofCogeneration in the U.S. Pulp and Paper Industry. Cadmus Group, Inc., Waltham, MA.

48
Cannell, E. July, 1999. “Pulp screening advancements reduce shives, boost quality.” Pulp & Paper.http://www.pponline.com/db_area/archive/p_p_mag/1999/9907/focus3.htm
Cannell, E. May, 1999. “Mechanical pulping technologies focus on reducing refining energy.” Pulp &Paper. http://www.pponline.com/db_area/archive/p_p_mag/
Chirat, Christine, and Lachenal, Dominique. February, 1998. "New Chemicals Cause Dramatic Changesin Bleaching Sequences." Pulp and Paper Magazine. Volume 72, Issue 2. Miller Freeman Publications,San Francisco. http://www.pponline.com/db_area/archive/p_p_mag/1998/9802/focus2.htm
Consonni, S; Larson, E.D.; Kreutz, T.G.; Berglin, N. July, 1998. Black Liquor Gasifier/Gas TurbineCogeneration. American Society of Mechanical Engineers.
Dean, Maggie. Fall 1998. “Cluster Rule in Place; Compliance Dates Vary for Mills.” The Mill MonitorNewsletter. Eka Chemicals. http://ekachem.com/mm/mmonitor.htm
De Beer, J.G.; van Wees, M.T.; Worrell, E.; Blok, K., 1994. Icarus-3: The Potential of Energy EfficiencyImprovement in the Netherlands up to 2000 and 2015. Utrecht University, Dept. of Science, Technologyand Society: Utrecht, the Netherlands.
De Beer, J.G., 1998. Potential for Industrial energy efficiency Improvement in the Long Term. PhD Thesis.Utrecht University: Department of Science, Technology, and Society.
Dieter Bryce, Inc. 1999. “Dieter Bryce, Inc. has revolutionized long or random length wood DEBARKINGtechnology with it's NEW "CRADLE" DEBARKER(TM)!”. Dieter Bryce Inc. Engineering Systems.http://www.dieterbryce.com/prod01.htm
Einstein, D. Internal memo for the Environmental Protection Agency on energy use in the chlorineindustry. Lawrence Berkeley National Laboratory.
Miller Freeman. 1998. “1998 Lockwood-Post’s Directory Database of the Pulp, Paper, and Allied Trades.”Milelr Freeman, Inc.
Elaahi, A. and H.E. Lowitt. 1988. The U.S. Pulp and Paper Industry: An Energy Perspective. Washington,D.C.: U.S. Department of Energy.
Elenz, T. and Schaible, T., 1995. “High Efficiency Gapformer for mini mill applications,” TAPPIPapermakiers Conference Proceedings 1995. Atlanta: TAPPI.
Energetics. 1990. Industry Profiles. Energetics, Columbia, MD.
[EPA] Environmental Protection Agency. 1993. “Handbook on Pollution Prevention Opportunities forBleached Kraft Pulp and Paper Mills.” Environmental Protection Agency. 600R93098.
[EPA] Environmental Protection Agency. 1996. Climate Wise. http://www.epa.gov/climatewise/
Eriksson, K. and Adolphson, R.B., 1997. “Pulp Bleaching and Deinking Pilot Plants Use Chlorine-FreeProcess.” TAPPI Journal, June. pp.80-81.
ESI Inc. Newsletter, 1992. “Efficiency improvements at the Bowater mean significant cost savings”.http://www.esitenn.com/energy/spring92_2.htm
Farla, J., K. Blok, and L. Schipper. 1997. “Energy Efficiency Developments in the Pulp and PaperIndustry,” Energy Policy 25 (7-9): 745-758.

49
Finchem, Kirk. February, 1998. "Ozone, Chlorine Dioxide Combination Gains Appeal in BleachingSequences." Pulp and Paper Magazine. Volume 72, Issue 2. Miller Freeman Publications, San Francisco.http://www.pponline.com/db_area/archive/p_p_mag/1998/9802/focus1.htm
Finchem, Kirk. February, 1997. "Mills Explore Capacity Options to Extend Recovery Boiler Life." Pulpand Paper Magazine. Miller Freeman Publications, San Francisco.http://www.pponline.com/db_area/archive/p_p_mag/1997/9702/focus1.htm
Ferguson, Kelly. 1995. "From the Editors." Pulp and Paper Magazine. Miller Freeman Publications, SanFrancisco. http://www.pponline.com/db_area/archive/p_p_mag/1995/9508/95080115.htm
Ferguson, Kelly. 1993. "Union Camp starts ozone-bleaching are." Pulp and PaperInternational. MillerFreeman Publications, San Francisco.http://www.pponline.com/db_area/archive/ppi_mag/1993/9302/93020110.htm
Ferguson, Kelly. 1997. “TMP technologies focus on reducing energy use” Pulp and Paper Magazine.Miller Freeman Publications, San Francisco.http://www.pponline.com/db_area/archive/p_p_mag/1997/97XX10/XXX.htm
Ferguson, Kelly. 1998. “Cluster Rule, Process Efficiency Drives Fiberline Chemical Use,” Pulp and PaperMagazine. Miller Freeman Publications, San Francisco.http://www.pponline.com/db_area/archive/p_p_mag/1998/9810/focus6.htm
Ganapathy, V. December, 1994. "Understand Steam Generator Performance." Chemical EngineeringProgress. American Institute of Chemical Engineers, New York.
Gas Research Institute (GRI). 1996. “Analysis of the Industrial Boiler Population” Prepared byEnvironmental Energy Analysis, Inc.
Germg Ard, Ulf, Norstedt, Asa, and Sjodin, Lars. March 1, 1994. “The future for bleaching: Presses takeover from filters.” Pulp & Paper International.http://www.pponline.com/db_area/archive/ppi_mag/1994/9403/94030108.htm
Giese, Robert D. 1989. Scoping Study: Pulp and Paper Industry. Palo Alto, CA: Electric Power ResearchInstitute.
Giraldo, Luis and Barry Hyman. 1994. Energy Consumption Patterns in the Paper and PaperboardIndustry. Seattle, WA: Department of Mechanical Engineering.
Grant, Roger. September 1993. “R&D Optimizes Enzymes Applications.” Pulp & Paper International.Miller Freeman Publications, San Francisco.http://www.pponline.com/db_area/archive/ppi_mag/1993/9309/93090105.htm
Grant, Roger. August 1998. “Enzymes Come Under the Microscope.” Pulp & Paper International. MillerFreeman Publications, San Francisco.http://www.pponline.com/db_area/archive/ppi_mag/1998/9808/ppi4.htm
Grace, T.M.; Malcom, E.W.; Kocurek, M.J. 1989. Pulp and Paper Manufacture: Volume 5, AlkalinePulping. Joint Textbook Committee of the Paper Industry, Atlanta, GA
Goovaerts, J.; Ratnani, K.; Hendry, B., 1991. “Infrared Applications in Pulp Drying,” Pulp and PaperCanada 92(11). Pages: 24-27
Grossmann H. and Salmen L., 1997, Exploration of new scientific ideas for significant electricity savings inmechanical upgrading of pulp fibers for papermaking,

50
Gustafson, E. and Duchesne, R. 1996. “Forming Update.” Beloit corporation. Beloit, Wisconsin.
Harrison, Andy. November 1, 1994. “O Delig Matures into Key Process Segment at Modern N.A.Fiberlines.” Pulp & Paper Magazine.http://www.pponline.com/db_area/archive/p_p_mag/1994/9411/94110120.htm
Harrison, Andy. November 1, 1995. “Pulp washing and pressing: Emphasis on improved efficiency.” Pulp& Paper Magazine. http://www.pponline.com/db_area/archive/p_p_mag/1995/9511/951132.htm
Headley, Richard L. October, 1996. “Pulp Cooking Developments Focus on Fiber Yield, Lower ChemicalUse.” Pulp & Paper Magazine. http://www.pponline.com/db_area/archive/p_p_mag/1996/9610/961022.htm
Henry, John, and Strakes, George. December 1, 1993. “Glatfelter’s Chip Conditioning Reduces Costs, AidsEfficiency.” Miller Freeman Publications, San Francisco.http://www.pponline.com/db_area/archive/p_p_mag/1993/9312/93120106.htm
Hill G., 1994. “Real-time model-based power plant optimizer significantly reduces energy costs atSoutheast paper,” TAPPI Proceedings, 1994 Engineering Conference, pp. 929-933
Hill G., 1995. “Real-time model-based power plant optimizer significantly reduces energy costs” TAPPIJournal, 1995 Vol.78 No12.
Hill, K.; Martz, W. and Timm, G. “Blue-Sky Dry,” TAPPI Journal 81(4). Pages 75-76.
Hoglund H. et al. 1997. Thermo-pulp a new energy efficient mechanical pulping process. pulp & PaperCanada.98:6
Holmberg, Anna. 1998. “Cluster Rule: ECF and TCF bleaching soon to be law in the U.S.”. Pulp Facts.Gas News for the Pulp and Paper Industry. Number 1.
Hunt, R. 1996. Gap Former Offers Optimal Process for Recycled Board. Pulp and Paper Magazine (June)
Industrial Assessment Center. 1999. “Industrial Assessment Center Database.” http://oipea-www.rutgers.edu/site_docs/dbase.html
Ingruber, O.V.; Kocurek, M.J.; Wong, A., 1985. Pulp and Paper Manufacture: Volume 4, Sulfite Science& Technology. Joint Textbook Committee of the Paper Industry, Atlanta, GA.
Jaccard, M. and Willis Enterprises Associates. 1996. Energy Conservation Potential in Six CanadianIndustries.
Jensen A. S., 1996. “Pressurized steam drying of sludge, bark and wood chips,” Pulp and Paper Canada.97(7).
Johnson, Anthony P. March, 1993. " O2 Delignification Systems Flourish As Mills Push for Lower Kappa
Johnston, Brian. Aug 17, 1995. "5 Ways to Greener Steam." The Chemical Engineer. Institution ofChemical Engineers, London. UK.
Jones, Ted. 1997. “Steam Partnership: Improving Steam Efficiency Through Marketplace Partnerships.”American Council for an Energy Efficient Economy, Washington DC.
Kenny, J. 1998. “Varkaus sets automatic pilot for efficiency gains,” ." Pulp and Paper International.Miller Freeman Publications, San Francisco.http://www.pponline.com/db_area/archive/ppi_mag/1998/9806/ppi1.htm

51
Khrushch, M., Worrell, E.,Price, L.K., Martin, N., Einstein, D. 1999. “Carbon Emissions ReductionPotential in the US Chemicals and Pulp and Paper Industries by Applying CHP Technologies,” inProceedings of the 1999 American Council for an Energy Efficient Economy Summer Study on EnergyEfficiency in Industry.
Kincaid, Janet (Ed.). 1998. 1998 North American Pulp & Paper Fact Book. San Francisco, CA: MillerFreeman Publications, Inc.
Klass, C.P. 1989. Heat pump system can economically recover low pressure steam from TMP. ModernMechanical Pulping in the pulp and paper industry. Miller Freeman Publications, san Francisco, CA.
Kline, James E. 1991. Paper and Paperboard: Manufacturing and Converting Fundamentals. Second ed.San Francisco, CA: Miller Freeman Publications.
Komppa, A. 1993. “Paper adnEnergy a Finnish view”. Energy Efficiency in process Technology. ElsevierApplied Science.
Koomey, J.G., Atkinson, C. Meier, A., McMahon, J.E., Boghosian, S., Atkinson, B., Turiel, I., Levine,M.D., Nordman, B. and Chan, P. 1991. The Potential for Electricity Efficiency Improvements in the U.S.Residential Sector. Berkeley, CA: Lawrence Berkeley National Laboratory (LBL-30477)
Korhonen, Reijo. June 1993. “TCF and the Totally-Closed Cycle.” Pulp and Paper International.http://www.pponline.com/db_area/archive/ppi_mag/1993/9306/93060105.htm
Kreutz, Thomas G.; Larson, Eric D.; Consonni, Stefano. 1998. Performance and Preliminary Economicsof Black Liquor Gasification Combined Cycles for a Range of Kraft Pulp Mill Sizes. Technical Associationof the Pulp and Paper Industry.
Lahner, W.F. and Teretka, D.H. 1989. High TMP refiner consistencies, pressures optimize heat recovery.Modern Mechanical Pulping in the pulp and paper industry. Miller Freeman Publications, san Francisco,CA.
Lamarre, Leslie. July/August 1997. “Ozone in Paper Making.” EPRI Journal. Vol. 22, Number 4. ElectricPower Research Institute. http://www.epri.com/EPRI_Journal/jul_aug97/sidebar.html
Lange, D. and Radtke, M., 1996. “Extended Nip Pressing of Paper Grades: A Technical Summary” BeloitCorporation, Beloit, Wisconsin.
Larson, Eric D; Consonni, Stefano; Kreutz, Thomas. 1998a. Preliminary Economics of Black LiquorGasifier/Gas Turbine Cogeneration at Pulp and Paper Mills. The American Society of MechanicalEngineers, New York. Based on Becthel Work.
Larson, Eric D; Consonni, Stefano; Kreutz, Thomas. 1998a. Preliminary Economics of Black LiquorGasifier/Gas Turbine Cogeneration at Pulp and Paper Mills. The American Society of MechanicalEngineers, New York. Based on Stone & Webster Work.
Larson, Eric D; McDonald, George W.; Yang, Wenrui; Frederick, Wm. James; Iisa, Kristiina; Kreutz,Thomas G.; Malcolm, Earl W.; Brown, Craig A. 1998b. A Cost-Benefit Assessment of Black LiqorGasifier/Combined Cycle Technolgoy Integrated into a Kraft Pulp Mill. Technical Association of the Pulpand Paper Industry, 1998.
Lewko, L. 1996. "Lime Kiln Upgrade Project at Prince Albert." Pulp & Paper Canada, October, 1996:371-4 Levels." Pulp and Paper Magazine. Miller Freeman Publications, San Francisco.http://www.pponline.com/db_area/archive/p_p_mag/1993/9303/93030122.htm

52
Lienhard, H; and Bierbach, B. 1991 "Gasification of Biomass and its Application in the Pulp and PaperIndustry" Energy Engineering and Management in the Pulp and Paper Industry. TAPPI Press, Atlanta,GA.
Lockie, M, 1998. “Pressing forward with new designs,” Pulp and Paper International. December. MillerFreeman Publications, San Francisco.http://www.pponline.com/db_area/archive/ppi_mag/1998/9812/ppi6.htm
Lorson, Heinz; Schingnitz, Manfred; White, Victor; Dean, David. December 1997. Black LiquorRecovery by Pressurized Oxygen-Blown Gasification. Technical Association of the Pulp and PaperIndustry Journal.
McCubbin, Neil., 1996 "Numerous Recovery Options Offer Solutions for Mill Effluent Closure." Pulpand Paper Magazine. March. Miller Freeman Publications, San Francisco.http://www.pponline.com/db_area/archive/p_p_mag/1996/9603/96030131.htm
McCubbin, Neil., June 1997 "Yield Improvements Possible with O2 Delig, Deigester Modifications." Pulpand Paper. Miller Freeman Publications, San Francisco. Volume 71, Issue 6.http://www.pponline.com/db_area/archive/p_p_mag/1996/9603/96030131.htm
McKinney, R. “A better insight could help flotation technology take off,” Pulp and Paper International.Miller Freeman Publications, San Francisco.http://www.pponline.com/db_area/archive/ppi_mag/1998/9806/ppi4.htm
McNicol, B. 1997. “Waste Treatment System Optimization Focuses on Trimming Energy Demand.” Pulpand Paper 71 (9).
Martin , Nathan; Worrell, Ernst; Price, Lynn. 1999. Energy Efficiency and Carbond Dioxide EmissionsReduction Opportunities in the US Cement Industry. Energy Analysis Department, Lawrence Berkeleynational Lab, Berkeley, CA.
Meadow, D. G. 1998. “Improvements add CTMP line to Enso’s Imatra mill” Tappi Journal 81(1).
Meier, A. , Wright J., and Rosenfeld, A.H. 1983. Supplying Energy Through Greater Efficiency: ThePotential for Conservation in California’s Residential Sector. Berkeley: University of California Press.
Minton, Paul E. 1986. Handbook of Evaporation Technology. Noyes Publications, Park Ridge NJ.
Mohta, D., Upadhyaya J.S., Kapoor, S.K., Roy, D.N. 1998. “Oxygen delignification of soda and soda-AQbagasse pulps,” Tappi Journal 81(6).
Morris, K.L. 1998. “Dryer section rebuild at Bowater Calhoun Lowers Steam use, Ups Machine speed."Pulp and Paper Magazine. October. Miller Freeman Publications, San Francisco.http://www.pponline.com/db_area/archive/p_p_mag/1998/9810/feat1.htm
Nasholm, Ann-Sofi; Westermark, Mats. 1997. Energy Studies of Different Cogeneration Systems forBlack Liquor Gasification. Energy Conversion and Management. Elsevier Science Ltd. Great Britain.
Nilsson, Lars; Eric Larson, Kenneth Gilbreath; Ashok Gupta. 1995. Energy Efficiency and the Pulp andPaper Industry. Washington, D.C.: American Council for an Energy-Efficient Economy.
O’Brien, 1996. “Augusta Newsprint – A World Class Recycling Mill,” pamphlet reprinted from Paper Age.
Office of Industrial Technologies. 1998. Steam Challenge. http://www.oit.doe.gov/steam/ (does notcontain all their materials).

53
Parisian, J. “Submerged Drainage: A new concept in dewatering” TAPPI 1995 Papermakers ConferenceProceedings. TAPPI, Atlanta, GA.
Panchapakesan, Bala, Hickman, Ed. September 1, 1995. “Fiberline Advancements Spur PapermakingProcess Changes.” Pulp and Paper Magazine. October. Miller Freeman Publications, San Francisco.http://www.pponline.com/db_area/archive/p_p_mag/1995/9509/95090118.htm
Panchapakesan, Bala, Emmerling, Fred A., Garner, Jerry A. November, 1993. “Performance AuditsIllustrate Areas of Potential Operating Improvements.” Pulp and Paper Magazine. Miller FreemanPublications, San Francisco. http://www.pponline.com/db_area/archive/p_p_mag/1993/9311/93110111.htm
Pantaleo and Wilson, 1995. “Operational Experience with a Concept IV-MH Headbox,” TAPPIPapermakers Conference Proceedings. TAPPI, Atlanta, GA.
Parthasarathy V.R. March 1997. “Shift in Pulping, Bleaching Strategy Yields Better Resource Utilization.”Volume 71, Issue 3.
Patrick, K.L. April 1999. “Bowaterset to start up new TMP line at Calhoun” Pulp and Paper Magazine.http://www.pponline.com/db_area/archive/p_p_mag/1999
Patrick, K.L. May 1999. “Bowater’s East Millinocket Mill to install new TMP refining technology” Pulpand Paper Magazine. http://www.pponline.com/db_area/archive/p_p_mag/1999
Paulapuro, Hannu, 1993. Recent Developments and Future in Paper Technology—Is Paper TechnologyHigh Technology? Appita, V46, No. 5, September. Pp. 375-380.
Pearson, J. and Dion, M. 1999. “Gulf States Improves Lime Kiln Performance with Advanced Controls.”Pulp and Paper Magazine.
Petrecca, 1993. Industrial Energy Management: Principles and Applications. Kluwer Academic Publishers:Boston, MA.
Pulliam, Terry L. September, 1995. “Mills Draw from Growing Number of Non-Chlorine, TEF Options.”Pulp and Paper Magazine. Miller Freeman Publications, San Francisco.http://www.pponline.com/db_area/archive/p_p_mag/1995/9509/95090120.htm
Reinsborough, J. 1996. Electric energy reduction using power conditioners. Pulp and Paper Canada. 97:5
Rockhill, R.G. and Hostetter, D.W. 1989. Evaporator/reboiler recovers steam, turpentine from TMPrefiners. Modern Mechanical Pulping in the pulp and paper industry. Miller Freeman Publications, sanFrancisco, CA.
Ruth, M., Brynhildur, D. and Laitner, S. 2000. “Impacts of market-based climate change policies on the USpulp and paper industry,” Energy Policy, Volume 28.
Saltman, David. 1978. Paper Basics: Forestry, Manufacture, Selection, Purchasing, Mathematics, andMetrics, Recycling. San Francisco, CA: Van Nostrand Reinhold Company.
Scott, G. M. Akhtar, M., Lentz, M.J.,Kirk, K., Swaney, R. 1998. New technology for papermaking:commercializing biopulping. Tappi J. v.81 n.11.
Scott, G. M. and Swaney, R. 1998. New technology for papermaking: biopulping economics. Tappi J. v.81n.12.
Södra economic association. 1998. “Clorine-free or not? The Issue of ECF and TCF”. See web site athttp://www.sodra.se/environment/ecf_tcf.htm

54
Strakes, George. July 1, 1995. “Mills Enhanced Chip Quality With Modern Woodyard Options.” Pulp andPaper Magazine.. Miller Freeman Publications, San Francisco.http://www.pponline.com/db_area/archive/p_p_mag/1995/9507/95070118.htm
Stratton, Stephen C. December 1998. “Estimated CO2 Emissions Resulting from Compliance with U.S.Federal Environmental Regulations in the Forest Products Industry.” National Council for Air and StreamImprovement. Special Report No. 98-02.
Tessier, P. Broderick, G., Desrochers, C., Bussiere, S. “Industrial implementation of motor load andfreeness control of chemimechanical pulp refiners,” Tappi Journal. 80(12). Pages: 135-141.
[Swan] Thomas Swan & Co. Ltd. “Ecozyme Xylanase Technology. Enzymes for Pre-Bleaching ChemicalPulps”. Thomas Swan. http://www.thomas_swan.co.uk/ecozyme/ezpres.htm
Tistad, G. and Asklund, S. 1989. Holmens Bruk Newsprint mill uses three different types of TMP lines.Modern Mechanical Pulping in the pulp and paper industry. Miller Freeman Publications, san Francisco,CA.
Technical Association of the Pulp and Paper Industry. (TAPPI) 1994. Recycled Paper Technology: AnAnthology of Published Papers. Altlanta, GA: TAPPI Press.
U.N. 1998. Food and Agriculture Organization Database on Pulp and Paper (http://apps.fao.org).
U.S. Energy Information Administration, 1997a. Manufacturing Consumption of Energy 1994.Washington, D.C.: U.S. EIA.
U.S. Energy Information Administration, 1997b. Emissions of Greenhouse Gases in the United States.Washington, D.C.: U.S. EIA.
U.S. Energy Information Administration, 1998. http://www.eia.doe.gov. U.S. Congress, Office ofTechnology Assessment, 1993. Washington, D.C.: Industrial Energy Efficiency, Office of TechnologyAssessment, OTA-E-560.
Union Camp. 1998. “Ozone Bleaching Technology.”http://www.unioncamp.com/paper/technology/ozone.html
Valmet Press Release. 1997. “Condebelt drying process to south Korea”.http://www.valmet.com/news/may29-1.htm
Valmet Press Release. 1999. “Condebelt, the new revolutionary drying process successfully started-up atDong Il ”. http://www.valmet.com/news/1999feb3.htm
Van Deventer, 1997. “Feasibility of energy Efficient Steam Drying of Paper and Textile Including ProcessIntegration,” Applied Thermal Engineering 17 (8-10), pp.1035-1041.
Velthuijsen, J.W. 1995. Determinants of Investment in Energy Conservation. Amsterdam: SEO, Foundationfor Economic Research of the University of Amsterdam.
Washington State University Cooperative Extension Energy Program. 1998.Motormaster+ 3.0. WSUCEEP, Olympia, WA.
Williams, D. 1996.”Methods to measure flow efficiency and maintenance savings at paper mills.” TappiJournal. February. Pages: 320-321.

55
World Energy Council. 1995. Energy Efficiency Improvement Utilizing High Technology: An Assessmentof Energy Use in Industry and Buildings. Prepared by M.D. Levine, E. Worrell, N. Martin, and L. Price.London: WEC.
Worrell, E., Martin N., Price L. 1999. Energy Efficiency and Carbon Dioxide Emissions ReductionOpportunities in the U.S. Iron and Stell Sector. LBNL-41724.
Worrell, Ernst; Bode, Jan-Willem; de Beer, Jeroen. 1997. Analysing Research and TechnologyDevelopment Strategies. Department of Science, Technology, and Society, Utrecht University, Utrecht,The Netherlands.
Xenergy, 1998. “Final Report: United States Industrial Electric Motor Systems Market OpportunitiesAssessment.” Prepared for Oak Ridge National Laboratory, Oak Ridge, Tennessee.
Young, Jim. November, 1993. “Pulping and Bleaching Advances Struggle Against Slow Economy.” Pulpand Paper Magazine. Miller Freeman Publications, San Francisco.http://www.pponline.com/db_area/archive/p_p_mag/1993/9311/93110117.htm
Zeitz, Ronald A. ed. 1997. CIBO Energy Efficiency Handbook. Council of Industrial Boiler Owners,Burke, Virginia.

56
APPENDIX A. NATIONAL ENERGY SAVINGS AND CARBON DIOXIDE EMISSIONSREDUCTIONS RESULTS
Table A-1 National Energy Savings And Carbon Dioxide Emissions ReductionsCASE A (Excluding increased use of recycled paper) CASE B (Including incrased use of recylced paper)Throughput Primary Energy
SavingsCarbon Savings Throughput Primary Energy
SavingsCarbon Savings
Mt PJ MtC Mt PJ MtcRaw Materials PreparationRing style debarker 241.5 1.1 0.02 205.2 0.9 0.01Cradle Debarker 241.5 1.8 0.03 205.2 1.5 0.02Enzyme-assisted debarker 241.5 1.5 0.02 205.2 1.3 0.02Bar-type chip screens 49.5 4.9 0.03 42.0 4.2 0.03Chip conditioners 49.5 4.4 0.03 42.0 3.8 0.02Screen out thick chips 49.5 4.9 0.03 42.0 4.2 0.03Belt conveyors 239.4 2.0 0.03 203.5 1.7 0.03Fine-slotted wedge wire baskets 5.3 0.7 0.01 4.5 0.6 0.01Pulping MechanicalRefiner Improvements 3.2 1.1 0.02 2.8 0.9 0.01Biopulping 5.3 3.6 0.06 4.5 3.1 0.05Pulping ThermomechanicalRTS 3.0 2.0 0.03 2.5 1.7 0.03LCR 3.0 0.2 0.00 2.5 0.1 0.00Thermopulp 3.0 1.0 0.02 2.5 0.8 0.01Pressurized groundwood 3.0 1.6 0.02 2.5 1.4 0.02Heat recovery in TMP 3.0 4.4 0.02 2.5 3.8 0.02Improvements in CTMP 3.0 1.3 0.02 2.5 1.1 0.02Pulping ChemicalContinuous digesters 49.5 103.9 0.59 42.0 88.3 0.51Continuous digester modifications 49.5 34.3 0.22 42.0 29.1 0.18Batch digester modifications 49.5 33.8 0.21 42.0 28.7 0.18Chemical RecoveryFalling film black liquor evaporation 53.2 18.2 0.16 45.2 15.5 0.14Tampella recovery system 53.2 3.0 0.02 45.2 2.5 0.01Lime kiln modifications 53.2 4.9 0.08 45.2 4.2 0.07BleachingOzone bleaching 29.6 0.2 0.00 25.1 0.1 0.00Brownstock washing 29.6 0.5 0.01 25.1 0.4 0.01Washing presses 29.6 2.4 0.02 25.1 2.1 0.01PapermakingGap forming 82.5 8.6 0.13 82.5 8.6 0.13High consistency forming 70.6 34.3 0.26 70.6 34.3 0.26Extended nip press (shoe press) 82.5 75.1 0.48 82.5 75.1 0.48Hot Pressing 82.5 7.2 0.05 82.5 7.2 0.05Direct drying cylinder firing 82.5 6.2 0.04 82.5 6.2 0.04Reduced air requirements (closinghoods and optimizing ventilation)
82.5 37.0 0.25 82.5 37.0 0.25
Waste heat recovery 82.5 17.6 0.11 82.5 17.6 0.11Condebelt drying 82.5 100.0 0.69 82.5 100.0 0.69Infrared profiling 82.5 10.4 0.05 82.5 10.4 0.05Dry sheet forming 82.5 69.2 0.26 82.5 69.2 0.26General MeasuresPinch Analysis 82.5 41.9 0.27 82.5 41.9 0.27Optimization of regular equipment 82.5 5.4 0.08 82.5 5.4 0.08Energy-efficient lighting 82.5 1.7 0.03 82.5 1.7 0.03Efficient motors 82.5 103.0 1.61 82.5 103.0 1.61Steam Production and EfficiencyBoiler maintenance 82.5 29.4 0.19 82.5 29.4 0.19Improved Process Control 82.5 31.4 0.20 82.5 31.4 0.20Flue Gas Heat Recovery 82.5 14.7 0.09 82.5 14.7 0.09Blowdown Steam Recovery 82.5 11.2 0.07 82.5 11.2 0.07Steam trap maintenance 82.5 104.7 0.66 82.5 104.7 0.66Automatic Steam Trap Monitoring 82.5 52.4 0.33 82.5 52.4 0.33Leak Repair 82.5 7.5 0.05 82.5 7.5 0.05Condensate Return 82.5 6.3 0.04 82.5 6.3 0.04Fiber SubstitutionIncreased use of recycled paper 60.0 202.0 1.67 60.0 202.0 1.67