Embed Size (px)
Citation preview

OPERATKONAL PLANNING FOP CALIFORNIA WATER SYSTEM
By George W. Barnes Jr.' and Frands I. Chung,' Members, ASCE
#esTRnc~: A detailed river basin simulation model has been developed by the California Department of Water Resources to simulate the combined operation of two major water project systems in California, namely the Central Valley Project (CVP), operated by the U.S. Bureau of Redamation, and the State Water Project (SWP), operated by the California Department of Water Resources. Each agency operates upstream reservoirs in Northern California to serve local water users as well as to provide for exports of water to more arid Central and South- em California regions. Much of this export water flows through the Sacra- mento-San Joaquin Delta, which has become a major focal point for water pol- icy controversy in California. The size and complexity of this combined CVP- SWP system of reservoirs and conveyance fadlitis is such that proposed changes in water use or development of future water project facilities may involve ana- lyzing or changing numerous system or operational constraints. The simulation model developed provides the necessary f lexi i ty to analyze a wide range of assumptions for various pknning alternatives. A major feature of the model is to allow proper sharing of Sacramento-San Jwquin Delta inflows between the CVP and SWP to meet Delta water quality outflow requirements as well as respective project export needs. Many model features are incorporated so the model can be used to analyze the effect of various alternatives of future surface reservoirs, changes in cross Delta transfer proposals, proposed groundwater reservoirs, and many other proposed system changes. The range of model ca- pabilities is d e s a i i along with some example studies.
About 70% of the total streamflow in the State of California originates north of the latitude of Sacramento while 80% of the ultimate water re- quirements lie south of that line (1). In addition, most of the State's runoff occurs during the winter and spring, when needs are minimal. Further, the variation in runoff from year to year causes problems when- ever a sequence of dry years occurs. These contrasts, coupled with en- vironmental considerations and a projected increase in demand for water create the need for effective water resources planning and development in California.
To overcome California's water distriiution problems, two major water projects were constructed, namely the Central Vdey Project (CVP), built first by the US Bureau of Redamation, and the State Water Project (SWP), built later by the State Department of Water Resources. These projects comprise a system of dams, reservoirs, canals, tunneIs, pumping plants, -
'Supervising Engr., Dept. of Water Resources, State of California, Sacramento, CA 95802.
'Systems Analyst, Dept. of Water Resources, State of California, Sacramento, CA 95802.
Note.-Discussion open until June 1,1986. To extend the dosing date one month, a written request must be filed with the ASCE Manager of Journals. The manu- script for this paper was submitted for review and possible publication on No- vember 26, 1984. This paper is part of the Journal of fiater Resources Planning and Manag-t, Vol. 111 No. 1, January, 1986. (ASCE, ISSN 0733-9496/86/ 0001-0071/$01.00. Paper No. 20307.
RG. 1.-Major Features of State Water Project and Central Valley Project
and power plants designed to serve multi-objectives of flood control, recreation, power generation, and water conservation.
Both projects consist of major storage facilities in Northern California, with the principal objective to store winter surplus runoff for summer irrigation in the Sacramento Valley and to provide water for export to central and southern areas of the state. Export water released from northern California project reservoirs flows down to the Sacramento-San Joaquin Delta where CVP and SWP pumping plants receive the water and export it south through the CVP's Delta Mendota Canal and the S W s California Aqueduct. The general locations of the CVP and SWP facilities in California are shown in Fig. 1. The characteristics of the stor- ' age facilities that are operated as part of the simulation model are sum- marized in Table 1.
Although each project operates its upstream reservoirs separately, the releases from the upstream reservoirs are intermixed in the Sacramento River and the Sacramento-San Joaquin Delta (Delta) where southern ex- ports are made by each project. Inflows to the Delta must be shared between the two projects in the Delta. In addition, minimum Delta water quality standards established by the California State Water Resources Control Board must be maintained. To share water for Delta outflow and Delta exports, the two agenaes recently proposed a Coordinated Op- erating Agreement (COA), which is in the final states of negotiation. The

! features of the proposed COA have been incorporated in the model (4). This paper describes the computer simulation model developed for
use in California water resources planning studies by the Department of Water Resources for the operation of the CVP-SWP system. The "'HEC- 3 Reservoir System Analysis for Conservation" model developed by the US Corps of Engineers' Hydrologic Engineering Center (HEC) in Davis, CA has been adopted as a basic tool for reservoir releases and channel routings. The original HEC-3 model has been extensively modified and enhanced to provide more modeling flexibility and features and to ac- count for the special characteristics of the CVP-SWP system. The model accounts for proper sharing of Sacramento River and San Joaquin River
! Delta inflows by the CVP and SWP and provides unique capabilities for conducting studies not possible with the original HEC-3 model. The model developed is now called the DWR Planning Simulation Model and is
I being used for many planning studies by the California Department of Water Resources to test possible future additions or changes to the CVP- SWP system.
-&.&j GENERAL MODEL DESCRIPTION
I I TABLE l.-Major CVP and SWP Storage Facllltles (1)
The DWR Planning Simulation Model is a generalized computer pW- ning model for California's Central Valley and the CVP-SWP project sys- tems. It is a simulation program designed to operate the CVP-SWP sys- tem on a monthly time basis for purposes of water supply, recreation, instream flow augmentation, and hydroelectric power generation. The
1 program is quite flexible in that changes for almost any configuration of surface reservoirs, groundwater reservoirs, river diversions, power gen-
t erating plants, pumping plants, and conveyance facilities can be incor- porated by changes in data entry to the program rather than modifying the model. In addition, various operating criteria such as reservoir o p
I Proid
(1) CVP
I ? SWP f 1 5 I1 I / Joint
W = Water Supply; P = Power; F = Flood Control; R = Recreation; S = Reregulatory Storage.
I Note: 1 TAF = 1.23 x lb m'.
Resetvoir@am) (2)
Shasta Lake - Clair Engle Lake Whiskeytown Lake Folsom Lake New Melones LakeOroville Siiverwood Lake Lake Perris Pyramid Lake Castaic Lake San Luis
capacity CTAF) (3)
4,552 2,448 241
1,010 2,400 3.538 75 132 ln 324
2,039
Purpose (4)
W, P, F, RC W, P, R W, P, R W, P, F, R W, P, F, R W, P, F, R S, R S, R S , P W, S, P, R S, P, R
50-ysar merage annual inflow
(5) (TAF) (5)
5,756 642 255
2,620 1,117 4.429 - - - - -
Year completed
(6)
- 1945 1962 1963 1956 1979 1968 19n 1973 1974 1973 1967

FIG. 2--DWR Planning Slmulatlon Model Network Representatlon
era tin^: rules or Delta outflow requirements can be easily changed by data &try as well.
The DWR Planning Simulation Model represents the actual CVP-SWP svstem bv a network of control points depicting surface reservoirs, -a
gr~undwiter reseivoirs, river .dive&ons, tributary stream inflow points, pumping plants, and power generating plant.. The control points are connected by links representing river and canal reaches. The schematic representation of the CVP-SWP system is shown in Fig. 2.
Inflow Data.-For a typical planning simulation study, the system in- flows to the reservoirs and downstream tributary inflows for the model are based on the historic hydrology for the period 1922-1978. The his- toric hydrology for this period has been adjusted to reflect present or

future land use and "nonproject" reservoir operations. Therefore, stud- ies are based on the historic hydrology that has been modified to reflect conditions at a future level. This adjustment to the historic hydrology is developed using the De-
parhnent8sConsumptive Useand Depletion Study Models (2). In a pres- w
ent level study, historic flows are adjusted to reflect the effect of present land use patterns, and for a future level study such as year 2000, the historic flows would be adjusted for estimated year 2000 land use pat- terns. Thus, a typical planning simulation study would simulate the o p eration of the CVP-SWP system for a continuous 57-yr period using the historic hydrologic inflows adjusted to the desired level of development such as year 2000.
In addition to using adjusted historic inflows, the Department has ap- plied a stochastic hydrology model (3) to provide monthly multi-station synthetic inflows, which are directly compatable for input to the DWR Planning Simulation Model. These generated flows provide different but equally likely sequences of possible future hydrologic inflows for use in certain types of planning studies.
Reservoirs.-The physical characteristics of surface reservoirs are de- fined by data input in terms of elevation versus storage, surface area, and outlet capaaty relationships. Groundwater reservoirs that are o p erated as part of the CVP-SWP system are also treated as simple res- ervoirs. In addition, reservoir power plant characteristics are entered to the model if simulation of power generation or energy consumption is to be included.
Surface reservoirs are operated to make releases to meet various cri- teria such as minimum downstream channel flows and required diver- sions at selected downstream control points. Further additional releases are made to evacuate space for required flood control levels or to satisfy
RESERVOIR B
CONTROL POW C
RIVER FLOW ETURN FLOW
RIVER FLOW
I I
FIG. 3.-Level Allocation of Two Parallel Reservoirs
75

: . sp&fied monthly reservoir power generation requirements. Five "target storage levels" &e used for each monthly time P(!ridd to
define the operating rules for the CVP and SWP reservoirs upstream of the Sacramento-San Joaquin Delta (Delta). The program could easily be changed to allow more target storage levels to be used. These levels permit an integrated operation of CVP and SWP upstream reservoirs to
-
meet commonly served downstream control point demands. Fig. 3 shows how the reservoir target levels work. If both Reservoir
A and Reservoir B start out full at level 5, the program determines the amount of reservoir release to satisfy the demand at She commonly served Control Point C. In this example, there is no space in Reservoir B allo- cated between level 5 and level 4. Therefore, the demand at Control Point C will be met from Reservoir A until Reservoir A reaches level 4. Then both reservoirs will be drawn down equally by percentage of stor- age space remaining between level 4 and level 3. When both reservoirs reach level 3, releases will occur from Reservoir B only until Reservoir B reaches level 2 as there is no space allocated between levels 3 and 2 in Reservoir A. The process is continued until the reservoirs are de- pleted. If desired, one or both of the reservoirs could be set not to meet any demand at Control Point C. It is also important to note that these storage target levels can be changed each month.
Instream Flow Requirements.-Control points that do not represent reservoirs are used to establish instream river or canal demands. At each point a maximum allowable flow and a minimum required flow may be specified. Maximum flow constraints may represent a channel capacity or a pumping plant capacity. Minimum flow requirements may repre- sent minimum fish, water quality, or navigation flows. These maximum and minimum flow requirements can bevaried by month. Releases from the surface reservoirs are controlled either to meet the minimum down- stream requirements or not to exceed maximum downstream criteria.
Diversions.-Reservoir releases are also made so as to meet required downstream river or canal diversions. Diversions are also made at res- ervoirs themselves. Diversions may be varied for each month of the sim- ulation, or they may be set on a 12-month pattern or they may be con- stant each month. A river diversion can also be set as a function of streamflow or reservoir storage. Special model features which allow di- versions to vary depending on the water year type and allow them to increase or decrease with time will be examined later in more detail.
Many diversions represent the lumped irrigation demands along the reach of a river or canal and are specified at a control point. Return flows from irrigation diversions are expressed as a percentage of the irrigation diversion. The percentages can be varied each month on a 12 month pattern. Therefore, the return flow percentages in winter months, for example, could be different than those in summer months. Several spe- cial program features were also added to the model to account for certain unique $versions in the CVP-SWP system, which will be covered later in separate sections.
The simulation model for the CVP-SWP network is unique in that the model must account for the interactive and coordinated operation of the

&IJ and SWP systems. Recently, the B-au of Reclamation and the Departnient of Water Resources developed 'a' proposed Coordinated O p erating Agreement (COA) to govern the operation of the two projects. The COA defines how the Department and the Bureau propose to share responsibility for Delta outflow and determinethe proper share of water available fof each agency for export from ..the Delta. The provisions of -
the proposed COA agreement for sharing Delta surpluses and Delta out- flow requirements have been incorporated into the DWR Planning Sim- ulation Model. CVP-SWP Coordinated Operation.-The joint studies between the
Department and the Bureau, which led to the proposed COA, utilized what has been referred to as a "first-in-time" approach. In order to per- forh simulation studies in which future SWP or CVP facilities are added, it is necessary to determine the effect or adjustment that the new facil- ities would have on the COA Sharing Formula. For example, if a new SWP facility were added to the system, the yield of the CVP system must not be ,adversely affected, and therefore the operational. sharing formula must be adjusted accordingly. The sharing formula must also be adjusted to account for changes in upstream hydrology with time. To accomplish this, it was necessary to develop three versions of the DWR Planning Simulation Model called Model A, Model B, and, Model C.
Delta Oufflow and Consumptive Use.-The CVP-SWP system is o p erated so as to provide minimum Delta outflows and maintain Delta water quality standards specified by the State Water Resources Control Board in D-1485 (6). Many of the D-1485 standards are specified as water qual- ity standards at certain locations in the Delta. The Department has con- ducted separate model studies to determine the minimum flows to meet the required quality standards.
Model C incorporates these standards as minimum required monthly flows (diversion at Control Point 58 in Fig. 2). These standards are based on tables that account for the year type determined by the Four-River Index, the month of the year, the San Joaquin River Inflow, and the previous month inflow. The Four-River Index is the sum of the natural flows in Sacramento, Feather, Yuba and American Rivers.
In addition to minimum outflow, the model determines the camage water (diversion at Control Point 60 in Fig. 2) or additional required Delta outflow that increases in proportion to the amount of export pumping in the Delta.
The Delta consumptive use and Delta channel depletions are based on the cooperative study conducted in 1981 by the Department and the Bu- reau of Reclamation. These values; which are based on estimates of his- toric use, are entered as data for various levels of development.
The Model simulation actually proceeds in two cycles each month. In the first cycle all of the Delta demands below Control Point 54 (Fig. 2) are set to zero. MonthIy inflows tire read by the program and project reservoirs upstream of the Delta are operated to meet minimum local instream demands and to make flood control releases. This establishes the minimum release required by each system reservoir. The program then computes the total flow amving at the Delta (Control Point 54 in Fig. 2) after meeting upstream diversions.
n

Next, the program sums the SWP demands starting at the southern end of the California Aqueduct working up to the Dos Arnigos Pumping Plant (Control Point 120 in Fig. 2). The program calculates the maximum and minimum SWP delivery required at the Dos Amigos Pumping Plant for that-month. The minimum SWP demand at Dos Amigos would k the amount necessary to meet all the monthly delivery demands south and to meet specified minimum monthly target levels in the SWP south- em California reservoirs. The maximum SWP demand at Dos Amigos would be not only the amount necessary to meet all the delivery de- mands, but also that amount required to fill the remaining space in all the SWP southern reservoirs. Maximum deliveries may be constrained by aqueduct pumping plant or chamel capacities.
San Luis Reservoir is a joint facility operated by the CVP and the SWP. Storage space is divided into the CVP San Luis portion and the SWP San Luis portion in the model. This is actually achieved by splitting San Luis into two separate reservoirs. The minimum required SWP Delta Pumping Plant export demand is therefore the sum of the minimum SWP Dos Amigos demand plus any necessary amount to achieve the SWP San Luis target storages plus the amount required to meet the South Bay demand (diversion at Control Point 63 in Fig. 2). The maximum possible Delta Pumping Plant export is the sum of the maximum pos- sible SWP Dos Amigos demand plus the amount necessary to fill the remaining storage space in SWP San Luis plus the South Bay export demand. The Delta Pumping Plant exports may also be limited by canal capacity, the Delta Pumping Plant capacity itself, or by legal constraints such as the May-July export curtailment to meet D-1485.
In the same manner, the program computes the CVP maximum and minimum demands south of the Delta. The maximum CVP Delta export is often limited by the Tracy Pumping Plant capacity or the Delta Men- dota CanaI reach capacity between the Tracy Pumping Plant and O'Neill Forebay. The Tracy Pumping Plant exports may be further limited in May and June as required by D-1W.
At this point, the program enters the COA sharing subroutine. The subroutine is used to determine each agency's share of required Delta outflow to meet D-1485 standards including carriage water, which is the additional outflow required due to Delta export pumping. The subrou- tine will also determine the amount of unstored flow or surplus Delta inflow each agency is entitled to export.
Each project will export its share of surplus Delta flows up to the max- imum desired (i.e., where there is space in San Luis and there is Delta export pumping capacity available). If there is not enough surplus Delta inflow to meet one or both of the agencies minimum required Delta ex- port., then additional upstream reservoir releases will be made by the affected agency in the second simulation cycle.
If an additional SWP release is required from Oroville Reservoir (as determined from the analysis after the first simulation cycle), this amount is added to the Oroville release used in the first simulation cycle. The Oroville release is therefore fixed in the second simulation cycle as the amount necessary to meet SWP share of instream flow requirements (from the first cycle) plus the additional amount necessary to meet the SWP share of Delta outflow and SWP Delta exports. With the SWP Oroville

Reservoir release fixed in the second cycle, it is not operated as a "sys- tem reservoir" to meet downstream control point demands in the second cycle. The CVP reservoirs are left to meet all remaining diversions, Delta outflow requirements, and Delta exports and balance among themselves according to the method shown in Fig. 3. In this manner, the simulatim model is able to operate each project properly €0 meet its share of Delta outflow and its share of Delta exports.
TYPES OF DWR PLANNING SIMULATION STUDIES
There are basically three types of planning studies that can be per- formed with the DWR Planning Simulation Model. The formulation of the study objectives and accompanying assumptions determine how the model is used and the type of study to be performed.
Yield Studies.-Model studies are often run to determine the SWP water supply firm yield with a given set of facilities assuming certain operating criteria at a present or future level of water development. Yield studies are run to demonstrate the system performance through the most severe critical dry period (1928-1935) in recent history (1922-1978) and have been used as a basis for contractual agreements between the De- partment and SWP contractors. For DWR planning studies, firm yield is defined as the maximum SWP water deliveries that can be achieved each year without imposing more than a 50% agricultural defiaency in any one year or more than a 100% agricultuial deficiency in any seven- year period. The calculation of SWP firm yield does not normally include deliveries to the Feather River Service Area. Firm yield studies are run without delivering any surplus water. A SWP delivery level is deter- mined through several trial runs so that about 850 thousand.aae-feet (TAF) of storage remains in Lake Oroville at the end of the aitical pe- riod, which is normally May 1928-October 1934. In addition, there is normally about 530 TAF of combined remaining storage in the SWP San Luis and SWP Southern California terminal reservoirs. Several trial com- puter runs are often required so as to adjust the assumed operating cri- teria to maximize the finn yield. Reservoir target levels or rule m e s for surface storage reservoirs south of the Delta and SWP delivery de- fiaency patterns can often be adjusted so as to minimize Delta outflow to the ocean during the critical period.
Average Annual Delivery Studies.-Recently, there has been inaeas- ing interest in measuring expected future SWP system performance in terms of average annual deliveries. For these types of studies, model simulations are normally performed using the historic 57-yr period from 1922-1978 at an adjusted future level of hydrologic development such as year 2000. Running average annual delivery studies necessitates op- erating the system in a manner which the planner feels would be most realistic or consistent with actual project opertions. The simulation study may be conducted several ways.
For example, once the SWP firm yield is determined for a given set of facilities and operating assumptions, the system may be operated to deliver the firm yield plus various amounts of surplus in years when surplus water is available. With the DWR Simulation Model, this is achieved by first estimating surplus delivery amounts for each water year

type (based on the Four-River Index). The wet year surplus delivery es- timate may be 1 MAF (1.23 X 10⁹ m3) in above normal years it may be 800 TAF (9.84 x 10⁸ m3) in below normal years it may be 500 TAF (6.15 x 10' m3) and in the dry years it might be 200 TAF (2.46 x 10⁸ m3). These amounts become only initial estimates, which are specified in scheduled surplus patterns from March 1-February 28. The monthly-wet year surplus patteri-t plus the firm yield pattern represents the mdmum annual delivery pattern which the system will try to achieve. Ground- water recharge is in addition to surplus deliveries and may have a higher delivery priority. As the hypothetical 57-yr simulation proceeds, the model determines the water year type based on the Four-River Index.
On March 1, the e l u s delivery pattern associated with the water year type is initially selected and the simulation proceeds through September. At the end of September, the model checks the SWP system carryover storage in Oroville, SWP San Luis, and the SWP terminal stor- age reservoirs to determine if the combined storage is within a specified target range. If the carryover storage is within this target range, the sim- ulation continues to a following year. If the SWP carryover storage on September 30 is too high or too low the difference is calculated. The model then goes back to March 1, adjusts the surplus delivery amount, and then simulates the system operation again from March-September thereby delivering more or less surplus or taking larger deficiencies as necessary to achieve a SWP system storage within the target range. The simulation then continues from October 1-February 28 on the revised surplus pattern.
In addition to scheduled surplus deliveries, the model may be set to deliver unscheduled Delta surplus water up to the monthly maximum or wet year pattern of scheduled surplus demands. Unscheduled sur- plus is delivered in a month when: (1) All Delta requirements have been met and there is Delta surplus flow; (2) all scheduled SWP demands including scheduled surplus are met; (3) groundwater recharge demands are met; (4) all reservoirs south of the Delta are full; and (5) Delta Pump- ing Plant capacity and aqueduct conveyance are still available. These unscheduled surplus deliveries will be made only up to the wet year or maximum pattern amount allowed for that month. Using these rules, the SWP operation is such that it is delivering as much surplus every year as possible, up to a maximum pattern (or wet year pattern), while maintaining a target carryover storage in the SWP each year, which would be consist&t w i h a reasonable operation.
Under these assumptions, however, the model may be delivering too much surplus water in years when high local runoff occurs in the South- em California watersheds. Therefore, changes are now being incorpo- rated so that the model will calculate a Southern California wetness in- dex called a Five-River Index based on the natural flows at the San Joaquin, Kings, Kaweah, Tule, and Kern Rivers. The user can then establish de- livery restrictions based on the Five-River Index that will limit SWP de- liveries in wet years. Thus, the Four-River Index will be used as a first estimate to define SWP possible surplus deliveries. However, surplus SWP deliveries may be limited by the Southern California Five-River In- dex in wet years. Downward adjustments to surplus deliveries can also be made to ensure minimum annual target carryover storages in the SWP
Water Available For Delivery (Baaed o n Four River Index)
- /Actual Water Demand
(Based o n F i v e River l n d e i )
(SWP Entitlement Delivery
WET - DRY d CRITICAL
Y E A R TYPE
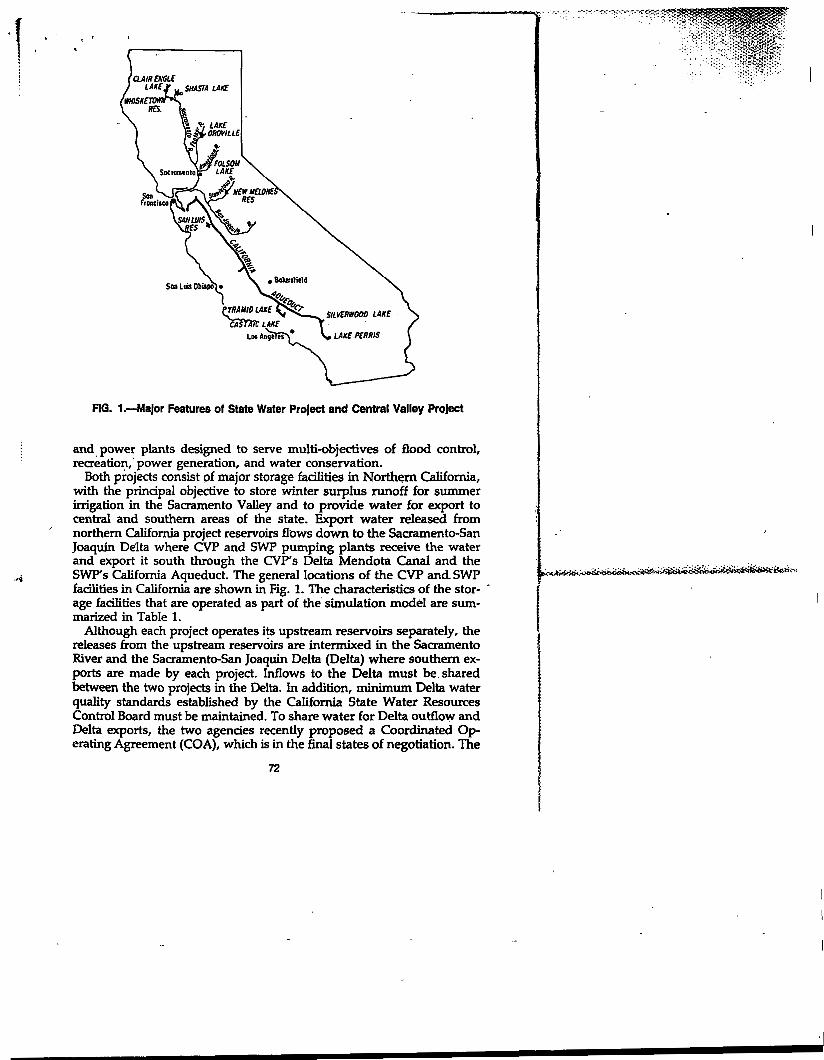
flG. 4.-State Water Project Deliveries versus Water Year Type
surface reservoirs. Fig. 4 represents how SWP deliveries as a function of water year type may be envisioned.
The criteria for SWP target carryover storage requirements may be e a s ily changed. Presently, the SWP is operated to deliver surplus water when the projected SWP September 30 carryover storage is greater than about 3.14 MAF (3.85 x 10⁹ m3), 2.4 MAF (2.95 x 10⁹ m3) in Oroville Reservoir and 740 TAF (9.10 X 10⁸ m3) in project reservoirs south of the Delta. A typical set of SWP target carryover storages used in planning model studies is shown in Table 2. It should be noted that these num- bers are subject to change.
The table shows that in a dry year if the September 30 carryover stor- age falls below 1.6 MAF (1.917 x 10⁹ m3) the model will go back to March 1 and adjust the SWP demands so as to impose a 25% agricultural deficiency from March 1-February 28 of the following year. As indicated further in Table 2, if the SWP carryover storage on September 30 falls below 900 TAF (1.11 x 10⁸ m3), 50% SWP agricultural deficiency will be taken and if below 800 TAF (9.84 X 10⁸ m3), a 60% agricultural plus a 10% municipal and industrial defiaency is taken.
Future studies may demonstrate that other SPL target carryover stor- ages would be more desirable. This may be especially true if more stor- age facilities are added to the SWP system or included in a future level study that could provide carryover storage not presently available.

In many plannihg studies, the future SWP contractor delivery requests exceed the SWP yield with an assumed set of envisioned future facilities. Therefore, these studies are run so as to deliver the SWP yield plus any additional amount up to the level of estimated contractor requests while maintaining specified annual SWP carryover storages. In these studies the "surplus water" deliveries may actually represent delivery of enti- tlement requests.
Dynamic Planning Studies.-Planning study descriptions so far have been confined to simulations using historic hydrology adjusted to a fixed level of future development such as year 2000 or 2020 level. Therefore, in a 50-yr hypothetical simulation, it is assumed that time is held con- stant, and the results of the study depict the expected project perfor- mance at a given level of development over 57 yr of repeated historical sequence.
However, in some instances, it may be desirable to simulate the sys- tem over a planning horizon from the present to a future date such as 2015. During this period, depletions upstream of the Delta will be in-
, creasing each year, thereby reducing Delta inflows with time. In addi- tion, contractor demands south of the-Delta will be inaeasing and de- mands for surplus will vary depending on the wetness of the year. The amount of water available for surplus deliveries will depend on variable
1 unknown future water supplies. In a dynamic planning study, it may *
be necessary to analyze the likely operation of a.groundwater basin south of the Delta from the present to year 2015.
The simulation model can be set to increase upstream depletions and control point diversions representing contractor deliveries each year in a desired pattern. In addition, the model will meet surplus water de- mands depending on: (1) The Fow-River Index; and (2) the SWP system reservoir carryover storage required. Thus, the simulation will proceed where contractor demands will be steadily inaeasing as well as fluc- tuating depending on the wetness of the year while at the same time, upstream depletions will be increasing.
Further, the model has the capability of bringing on line future fadl- ities such as a new reservoir or enlarged pumping plant at a specified
. . . TABLE 2.--SWP Target Cawover Storage Requirements8
Year type (1
Wet Above normal Below normal Dry Critical (25% Ag Def.) Critical (50% Ag Def.) Critical (60% Ag & 10% M&I Def.) Critical (80% Ag & 30% M&I Def.)
'Combined end-of-September carryover storage in Oroville, SWP San Luis, and offstream surface storage reservoirs and in Southern California, not @uding groundwater storage south of the Delta.
Note: 1 TAF = 1.23 x 10⁶ m3.
Maximum TAF (2) 3,100
- 3,100 3,100 3,100 3,100 3,100 3,100 3,100
Minimum TAF (3) 3,050 3,050 3,050 1,600
900 800 600 500

year into the simulation. For example, if a dynamic study was started in 1985, the model could automatically begin operation of a new up- stream reservoir in the tenth year or 1995. The new reservoir would nec- essarily have to go through the process of initial filling just as it would under real time opertion. In fact, the model could be specifically used
- for reservoir filling studies. 1
Dynamic planning studies lend themselves especially well to the use of stochastic hydrologic input. Synthetic inflows can now be generated and used as input to the simulation model. The Department recently applied a stochastic hydrology model for this purpose which can gen- erate multi-site stochastic inflows for the DWR Planning Simulation Model.
As previously mentioned, the historic hydrology for the period 1922 through 1978 is adjusted to a future level of development for most plan- nine: studies. The river diversions and water use u~stream of the Delta arevdetermined from the consumptive use and depGtion studies and are then used as input to the simulation model. Therefore, these upstream diversions are unique each month and are to some extent a fuiction of the rainfall and year type.
EXAMPLES OF DWR PLANNING STUDIES
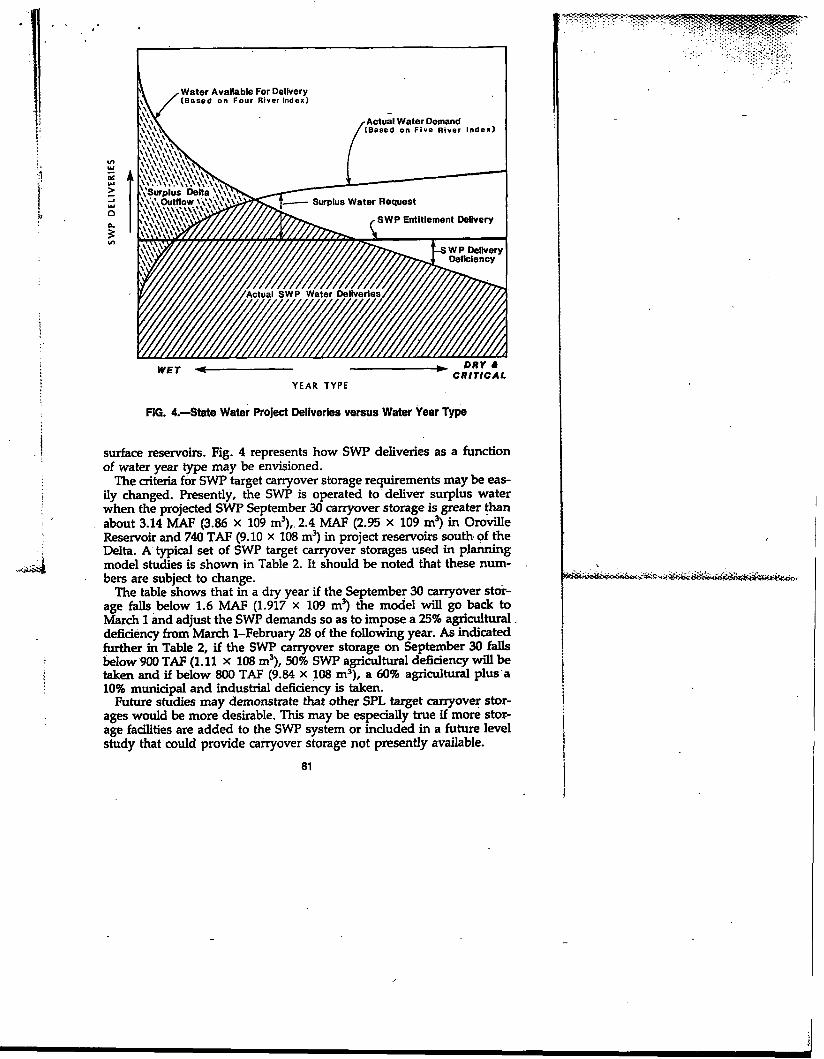
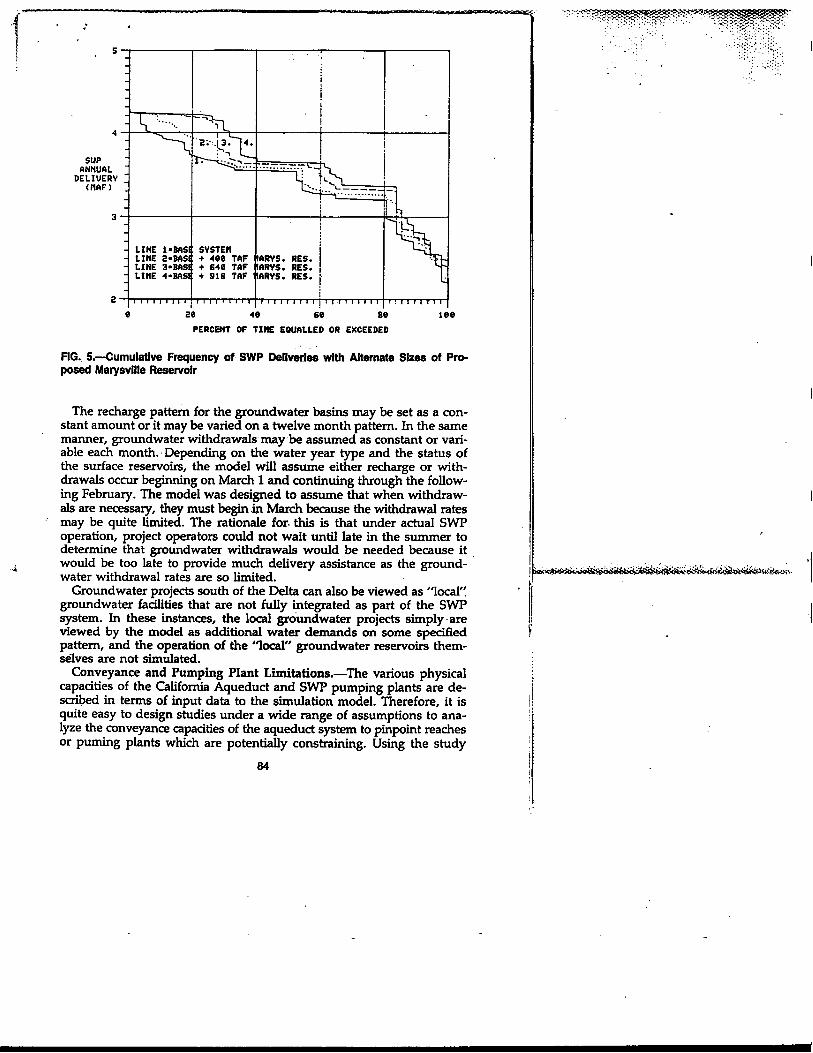
Upstream Storage Reservoirs.-Yields and average annual deliveries of storage facilities have been estimated for proposed future reservoirs in Northern California. They are Cottonwood, enlarged Shasta, Auburn, and Marysville. In case of Marysville, the results can be summarized in Table 3. Fig. 5 displays the cumulative frequency distributions of average annual deliveries for the no project or base condition and three alter- natives.
Offstream Storage and Integrated Groundwater Simulation.-The Department has conducted several studies evaluating various offstream stofages proposed along the California Aqueduct. Various reservoir sizes at Control Points 16 and 22 labeled Enlarged Kellogg and Los Banos Grandes Reservoir are used for these offstream storage studies:
In addition, the simulation model can accommodate the presence of integrated groundwater projects as part of the SWP system south of the Delta. Integrated groundwater projects are treated as simple reservoirs in the model network. The conjunctive operation of the groundwater projects provide that storage releases from Oroville and San Luis Res- ervoirs as well as Delta surpluses are used for recharge. One or more groundwater projects as represented on the network diagram in Fig. 2 may be simulated.
TABLE 3.-Vield and Annual Dellvery for Marysville
Slze of proposed Marysville TAF (m3)
(1) 400 TAF (4.92 X 10⁸) 640 TAF (7.89 x 10⁸) 916 TAF (1.13 x 10⁴
Increment Rrm yield above base system
TAF/Y (m3/y) (2)
68 (8.36 X 10⁴ 155 (1.91 x 10⁸) 218 (2.68 x 10⁸)
Increment average annual delivery above base system
TAF/Y~ (m3/yr) (3)
89 (1.09 x 10⁸) 192 (3.21 x 10⁸) 261 (3.21 x 10⁸)
6 86 46 66 86 166
PERCENT OF TIHE EQUALLED OR EXCEEDED
flG. 5.--Cumulative Frequency of SWP Deliveries with Alternate Slzes of Pro- posed Marysville R e s e ~ o i r
The recharge pattern for the groundwater basins may be set as a con- stant amount or it may be varied on a twelve month pattern. In the same manner, groundwater withdrawals may be assumed as constant or vari- able each month. Depending on the water year type and the status of the surface reservoirs, the model will assume either recharge or with- drawals occur beginning on March 1 and continuing through the follow- ing February. The model was designed to assume that when withdraw- als are necessary, they must begin in March because the withdrawal rates may be quite limited. The rationale for. this is that under actual SWP operation, project operators could not wait until late in the summer to determine that groundwater withdrawals would be needed because it would be too late to provide much delivery assistance as the ground- * water withdrawal rates are so limited. b- -.<.&,&&+&& $,&-
Groundwater projects south of the Delta can also be viewed as "local" groundwater facilities that are not fully integrated as part of the SWP system. In these instances, the local groundwater projects simply are viewed by the model as additional water demands on some specified
1 i pattern, and the operation of the 'local" groundwater reservoirs them- selves are not simulated.
Conveyance and Pumping Plant Limitations.-The various physical capacities of the California Aqueduct and SWP pumping plants are de- scribed in terms of input data to the simulation model. Therefore, it is i ! quite easy to design studies under a wide range of assumptions to ana- lyze the conveyance capacities of the aqueduct system to pinpoint reaches or puming plants which are potentially constraining. Using the study

OCT DEC FEE APR JUN A f f i i
FIG. 6.-Average, Maximum, and Mlnimum How through Pear Blossom Pumping I Plant (1922-1 978)
i output information for each aqueduct control point, supporting pro- grams have been ivritten to graphically display the information. This is shown in Fig. 6 where the average flow, maximum flow, and rrlinimum flow are graphically summarized for each calendar month for the 57-yr simulation period at a particular aqueduct control point (Control Point . 134 in Fig. 2).
SWP Energy Analysis.-The DWR Planning Simulation Model can be '
used for energy use and power generation planning studies. Expected future energy needs and uses can be estimated for future levels of de- velopment and operation through the use of historic flows adjusted for future levels of development, or stochastic inflows.
For surface reservoirs, the power plant characteristics along with rnin- imum monthly energy generation requirements can be readily specified. Based on the releases made to meet downstream flow requirements, the monthly energy generation is computed. If the specified minimum en- ergy generation is not achieved, an additional amount of water is re- leased to ensure the minimum energy generation.
The simulation model accomodates all of the characteristics of the SWP pumping and generating plants along the California Aqueduct from .the Delta to Lake Perris and Castaic Reservoirs. Assuming that each of these plants with the exception of San Luis Reservoir operates at a fixed head, the model computes the monthly energy used or generated at each plant.
Finally, the energy use assodated with groundwater withdrawals can also be computed by supplying the depth to groundwater table or pump lift and the assumed pumping plant characteristics.

As developed, the DWR Simulation Model has been demonstrated to be an effective tool for water resources planning. The detailed monthly simulation model incorporates a complex system of surface and subsur- face reservoirs, rivers, channels, power plants, and aqueducts. A large spectrum of legal, institutional, physical, and operational constraints are readily simulated. The model differentiates the operations of the Bu- reau's Central Valley Project and the Department's State Water Project so that the coordination agreement proposed by both agencies is care- fully followed in the simulation studies. The model is capable of being used for several types of planning studies and may accomodate sto- chastic data inputs. The SWP demands have the flexibility of being ad- justed to reflect wet or dry year effects as well as inaeases with time.
Further works are underway to replace the routing mechanism of the HEC-3 model by a standardized network flow algorithm. This replace- ment will enhance the capability of the model with the additional benefit of faster computer execution of the model.
The writers are grateful to their employer, the California Department of Water Resources, for its permission to publish this paper. Special thanks are due to many individuals, including Terry Erlewine, Paul Dabbs, Sushi1 Arora, Price Schreiner, Dwight Russell, and John Clements for their gen- erous effort on the development and verification of the model.
1. 'The California Water Plan," Bulletin 160-83, Department of Water Resources, State of California, Dec., 1983, p. 8.
2. Barnes, G. W., Jr., "Consurn tive Use Program Documentation," Department of Water Resources, State o?Califomia, Sacramento, CA, Apr., 1979.
3. "A Stochastic Hydrology Model for Water Resources Planning for California," Department of Water Resources, State of California, Sacramento, CA, May, 1984.
4. United States Bureau of Redamation and California Department of Water Re- sources, "Agreement between the USA and the State of California for Co- ordinated Operation of the CVP and the SWP," Dec. 20, 1982.
5. 'Water Conditions in California," Bulletin 120-84, Department of Water Re- sources, State of California, May, 1982, pp. 8-13.
6. "Water Right Decision 1485," State Water Resources Control Board, State of California, Aug., 1978.