Embed Size (px)
Citation preview
AUTHORS
Caroline Coombe Chief Executive, ORIC International
Michael Sicsic Chairman, ORIC International
Tom Ivell Partner, Oliver Wyman
Sean McGuire Partner, Oliver Wyman
This is a joint report from Oliver Wyman and
ORIC International.
ACKNOWLEDGEMENTS
The authors would like to thank the ORIC International
members who participated in this survey for their time
and the thoughtfulness of their contributions.
POINT OF VIEW MARCH 2015
OPERATIONAL RISK MANAGEMENT & MEASUREMENT SURVEY BY ORIC INTERNATIONAL AND OLIVER WYMAN – SUMMARY OF RESULTS
CONFIDENTIALITY
Our clients’ industries are extremely competitive, and
the maintenance of confidentiality with respect to our
clients’ plans and data is critical. ORIC International and
Oliver Wyman rigorously apply internal confidentiality
practices to protect the confidentiality of all
client information.
Similarly, our industry is very competitive. We view our
approaches and insights as proprietary and therefore
look to our clients to protect our interests in our
proposals, presentations, methodologies and analytical
techniques. Under no circumstances should this material
be shared with any third party without the prior written
consent of ORIC International and Oliver Wyman.
© Oliver Wyman
© ORIC International
REPORT QUALIFICATIONS/ASSUMPTIONS AND LIMITING CONDITIONS
Neither ORIC International nor Oliver Wyman shall have
any liability to any third party in respect of this report or
any actions taken or decisions made as a consequence of
the results, advice or recommendations set forth herein.
The opinions expressed herein are valid only for the
purpose stated herein and as of the date hereof.
Information furnished by others, upon which all or
portions of this report are based, is believed to be
reliable but has not been verified. No warranty is
given as to the accuracy of such information. Public
information and industry and statistical data are
from sources ORIC International and Oliver Wyman
deem to be reliable; however, ORIC International
and Oliver Wyman make no representation as to the
accuracy or completeness of such information and has
accepted the information without further verification. No
responsibility is taken for changes in market conditions
or laws or regulations and no obligation is assumed
to revise this report to reflect changes, events or
conditions, which occur subsequent to the date hereof.
Copyright © 2015 Oliver Wyman & ORIC International 2
FOREWORD
We conducted a survey of 30 ORIC International
members to understand their current operational risk
management and measurement practices and priority
areas for future enhancements. Participants covered a
broad representation of the global insurance industry,
including life insurers, general insurers and composites.
This report summarises our findings from the survey.
A more detailed version of the report will be made
available exclusively to the firms that participated in
the survey.
We hope that you find the report useful for
understanding current insurer practices and priority
areas for future development.
CAROLINE COOMBE
ORIC International
Chief Executive
TOM IVELL
Oliver Wyman
Partner
MICHAEL SICSIC
ORIC International
Chairman
SEAN MCGUIRE
Oliver Wyman
Partner
Copyright © 2015 Oliver Wyman & ORIC International 3

TABLE OF CONTENTS
EXECUTIVE SUMMARY 5
1 INTRODUCTION 7
2 STATE OF THE INDUSTRY AND FIRMS’ PRIORITIES FOR 2015 8
3 ORGANISATION AND GOVERNANCE 9
4 CULTURE AND CONDUCT 10
5 RISK IDENTIFICATION AND ASSESSMENT 11
6 RISK EVENT DATA CAPTURE 12
7 INTERNAL CONTROL 13
8 MONITORING 14
9 BUSINESS DECISION MAKING 15
10 BUSINESS RESILIENCY 16
11 RISK MEASUREMENT 17
12 SYSTEMS 18
CONCLUDING REMARKS 19
APPENDIX A – PARTICIPANT PROFILE 20
APPENDIX B – SURVEY PARTICIPANTS 21
Copyright © 2015 Oliver Wyman & ORIC International 4
EXECUTIVE SUMMARY
Over recent years ORIC International members
have made substantial progress in enhancing their
operational risk management and measurement
capabilities. Despite the progress made, there remain
areas of operational risk showing a significant lack of
convergence across the industry. Now is the opportunity
for the industry to act, before regulators act for them.
State of the industry and firms’ priorities for 2015
Across the members surveyed, embedding operational
risk management in decision making is the top
priority for further improvement in the operational risk
space going into 2015. Improving risk measurement
capabilities is also cited as a priority, which should be
seen in the context of the timing of many firms’ internal
model applications, which are imminent or currently
under regulatory review.
Improving the articulation and use of risk tolerance is
an important priority for smaller insurers, who were
also dissatisfied with the effectiveness of their Key Risk
and Control Indicators. Larger institutions state the
enhancement of their risk identification and assessment
approach as a priority for development, highlighting the
complexity of this activity in a large firm.
Organisation and Governance
Firms operate a range of organisational models for
managing and measuring operational risk, including
locating resources almost entirely within business
units, or centralised at group level. We found that, as
firm size increases, incremental resource is more likely
to be added at business unit level than at group. The
role of the 2nd line of defence (Risk Function) expands
significantly with increasing size of firm, while the role
of the 3rd line (Internal Audit) tends to decrease with
size of firm as the 1st and 2nd lines play a stronger role in
assurance activity.
Culture and Conduct
The proportion of participants performing risk culture
assessments is significant and increases with firm size.
In the majority of firms surveyed, the operational risk
framework includes conduct risk (or a link to it).
Risk identification and assessment
Risk and Control Self-Assessments and Scenario
Analysis are the two main tools used across the industry.
There are substantial differences in how the processes
are managed, ranging from purely “bottom-up”
identification of risks to “comply or explain” approaches
tightly managed by the central risk function. There
are also substantial differences in how scenarios
are parameterised.
Risk event data capture
The loss history captured at most institutions is now in
excess of 5 years (6.4 years on average). “Lessons learnt”
processes typically remain informal, however.
Internal controls
A majority of firms identify and (self-assess) the
effectiveness of controls, but often not to a common
standard and/or not well coordinated across business
areas and lines of defence. This area will likely be subject
to further focus going forwards, in light of various new
regulatory requirements coming into force.
Monitoring
Risk monitoring is often perceived as weak especially
among smaller firms. In this context, clearer ownership
of metrics was identified as a development objective.
Copyright © 2015 Oliver Wyman & ORIC International 5

Use of Operational Risk in business decision making
Operational risk is now considered in a broad set of
business processes. It is mostly the 1st line (Business)
providing this input – the 2nd line “independent”
operational risk management teams tend to play a
comparatively minor role in business decisions.
Recognising that the embedding of operational risk
relies both on defined rules and on organisational
culture, compensation linkages to operational risk
performance have been put in place by a majority of
firms. The Board was least likely to see its compensation
tied to operational risk performance, whereas business
and support functions were the most likely. Senior
management were the most likely to see it linked
objectively (rather than more subjectively).
Risk measurement
The capital models in use span a broad range of
approaches. Hybrid models combining Scenario
Analysis with loss event data analysis are the most
popular category, but even within this, designs vary.
Other features also differ across firms, such as the
diversification benefit between operational risk and
other risk types, which ranges between 0% and 79%.
Half of the firms surveyed make deducations for
insurance recoveries.
Systems
Vended systems are common among internal model
firms for housing some operational risk management
processes (e.g. loss data collection, Risk and Control
Self-Assessments); however they are not as widely used
for Scenario Analysis or capital calculations.
Copyright © 2015 Oliver Wyman & ORIC International 6
1. INTRODUCTION
In December 2014, ORIC International and
Oliver Wyman jointly conducted a survey on
operational risk management and measurement. The
97 survey questions were informed by the recent CRO
Forum1 white paper, “Principles of Operational Risk
Management and Measurement” (September 2014)2.
The objective of the survey was to understand the
current practices in operational risk management in
the insurance industry, along with the development
priorities going forward.
The survey was completed by the firms’ Operational
Risk teams and their colleagues. 30 out of 40
ORIC International members from across the globe
participated in the survey.
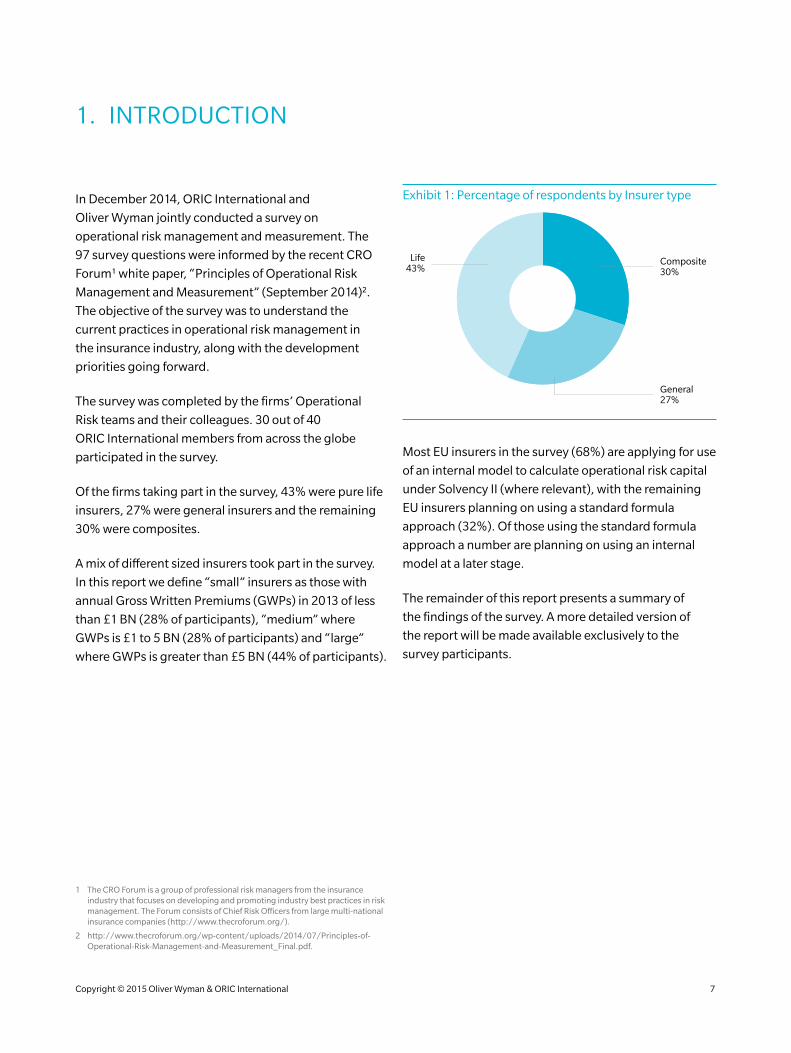
Of the firms taking part in the survey, 43% were pure life
insurers, 27% were general insurers and the remaining
30% were composites.
A mix of different sized insurers took part in the survey.
In this report we define “small” insurers as those with
annual Gross Written Premiums (GWPs) in 2013 of less
than £1 BN (28% of participants), “medium” where
GWPs is £1 to 5 BN (28% of participants) and “large”
where GWPs is greater than £5 BN (44% of participants).
1 The CRO Forum is a group of professional risk managers from the insurance industry that focuses on developing and promoting industry best practices in risk management. The Forum consists of Chief Risk Officers from large multi-national insurance companies (http://www.thecroforum.org/).
2 http://www.thecroforum.org/wp-content/uploads/2014/07/Principles-of-Operational-Risk-Management-and-Measurement_Final.pdf.
Exhibit 1: Percentage of respondents by Insurer type
General27%
Composite30%
Life43%
Most EU insurers in the survey (68%) are applying for use
of an internal model to calculate operational risk capital
under Solvency II (where relevant), with the remaining
EU insurers planning on using a standard formula
approach (32%). Of those using the standard formula
approach a number are planning on using an internal
model at a later stage.
The remainder of this report presents a summary of
the findings of the survey. A more detailed version of
the report will be made available exclusively to the
survey participants.
Copyright © 2015 Oliver Wyman & ORIC International 7
2. STATE OF THE INDUSTRY AND FIRMS’ PRIORITIES FOR 2015
The state of the insurance industry with respect to
operational risk management and measurement
has evolved fast. Many firms subject to the
European Solvency II regime will be undergoing
increased regulatory scrutiny of their frameworks
and measurement approaches this year and much
preparatory work has already taken place.
Unsurprisingly, some firms are further progressed in
their operational risk management and measurement
than others and there is strong positive correlation
between those firms that are most progressed and those
that intend to use an internal model based framework
for their Solvency II operational risk capital calculations
(where relevant). Independently of this, there is also a
broad spectrum of practices in terms of how well the
operational risk framework has been embedded in the
business, both with respect to business decision making
and internal controls, but also conduct and culture.
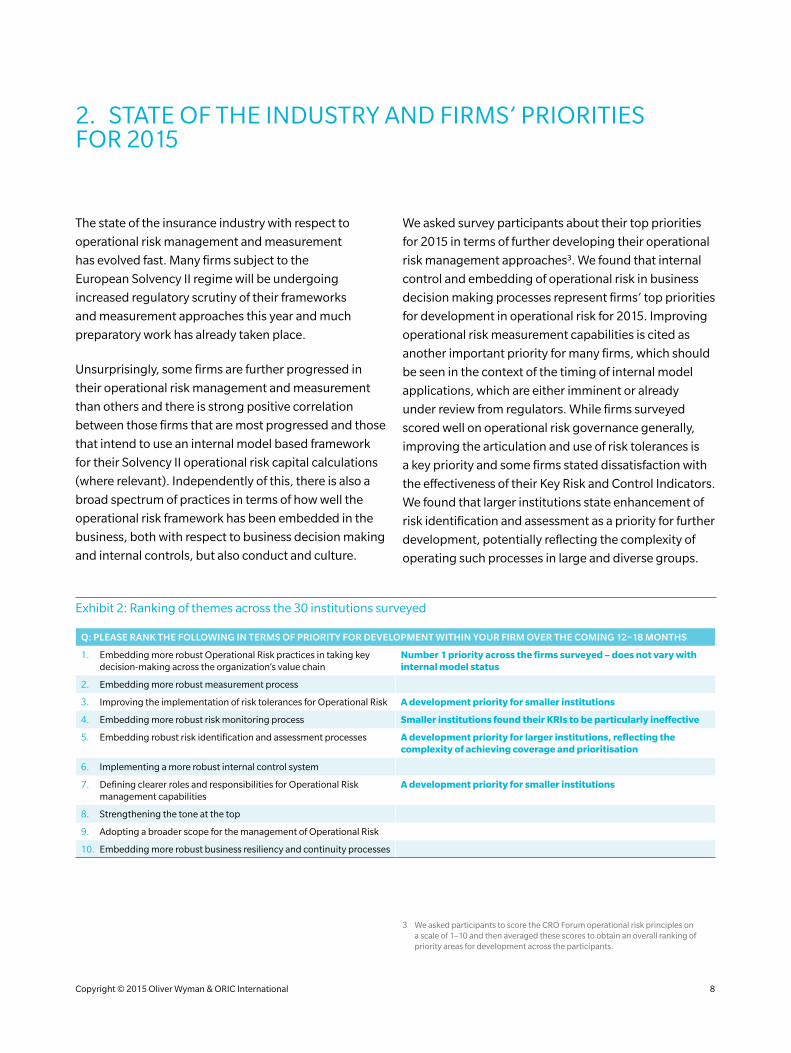
We asked survey participants about their top priorities
for 2015 in terms of further developing their operational
risk management approaches3. We found that internal
control and embedding of operational risk in business
decision making processes represent firms’ top priorities
for development in operational risk for 2015. Improving
operational risk measurement capabilities is cited as
another important priority for many firms, which should
be seen in the context of the timing of internal model
applications, which are either imminent or already
under review from regulators. While firms surveyed
scored well on operational risk governance generally,
improving the articulation and use of risk tolerances is
a key priority and some firms stated dissatisfaction with
the effectiveness of their Key Risk and Control Indicators.
We found that larger institutions state enhancement of
risk identification and assessment as a priority for further
development, potentially reflecting the complexity of
operating such processes in large and diverse groups.
3 We asked participants to score the CRO Forum operational risk principles on a scale of 1–10 and then averaged these scores to obtain an overall ranking of priority areas for development across the participants.
Exhibit 2: Ranking of themes across the 30 institutions surveyed
Q: PLEASE RANK THE FOLLOWING IN TERMS OF PRIORITY FOR DEVELOPMENT WITHIN YOUR FIRM OVER THE COMING 12–18 MONTHS
1. Embedding more robust Operational Risk practices in taking key decision-making across the organization’s value chain
Number 1 priority across the firms surveyed – does not vary with internal model status
2. Embedding more robust measurement process
3. Improving the implementation of risk tolerances for Operational Risk A development priority for smaller institutions
4. Embedding more robust risk monitoring process Smaller institutions found their KRIs to be particularly ineffective
5. Embedding robust risk identification and assessment processes A development priority for larger institutions, reflecting the complexity of achieving coverage and prioritisation
6. Implementing a more robust internal control system
7. Defining clearer roles and responsibilities for Operational Risk management capabilities
A development priority for smaller institutions
8. Strengthening the tone at the top
9. Adopting a broader scope for the management of Operational Risk
10. Embedding more robust business resiliency and continuity processes
Copyright © 2015 Oliver Wyman & ORIC International 8
3. ORGANISATION AND GOVERNANCE
Operational risk resourcing levels continue to vary
significantly both on an absolute basis but also when
adjusted for firm size, e.g. by premiums written or assets
under management. As overall resourcing increases,
incremental resource is more likely to be added at
the business unit than at the central risk function.
Operational risk is explicitly mentioned in the terms of
reference of the board risk committee for a minority
of firms, but is only implicitly captured for almost all
other insurers through the committee’s broader remit,
covering all material risks to the firm. The most senior
dedicated operational risk committee in the majority of
firms is chaired by either the CRO or CEO.
The three lines of defence concept has seen broad
adoption across firms, and there is a fair amount of
consistency in how core operational risk management
activities have been assigned across the three lines of
defence. The mandate of the 2nd line of defence (risk
function) increases with firm size, covering a variety
of tasks including managing the regulatory dialogue
and advising on control design. The role of the 3rd line
(internal audit) also varies with firm size. In addition
to independent framework verification, which all
respondents listed as an activity performed by the
3rd line of defence, smaller firms also reported a strong
role for internal audit in control assurance. There remains
potential for further alignment between the risk function
and internal audit on matters of testing, methodology,
process and timing.
Operational risk appetite (or risk tolerance) statements
continue to be a priority for further development,
especially among smaller firms. Most firms report
having explicit operational risk tolerance statements
in place, often cascaded to the Business Unit or legal
entity level. The dimensions used to express operational
risk tolerance vary considerably, however, with realised
losses being the most popular approach among
participants. Realised internal operational risk loss
events are a “backward-looking” measure of risk and
so insurers are increasingly looking at complementing
such measures with more “forward looking” measures of
operational risk exposure, such as external loss data, Key
Risk Indicators, control testing results and operational
risk capital requirements.
Exhibit 3: What metric(s) are used to express Operational Risk tolerance?
N=30
60 50 40 30 20 10
Realised operation risk losses 53
13
17
23
23
27
30
33
47
Framework adherence
Red, amber, green status of key risk and control Indicators
Relative capital requirements
Risk acceptance process based on results of risk assessment
Control testing results
Unexpected loss
Absolute capital requirements for operational risk
Others
PERCENTAGE OF RESPONDENTS
0
Copyright © 2015 Oliver Wyman & ORIC International 9

4. CULTURE AND CONDUCT
Effective risk management requires formal processes
and controls as well as a “good” risk culture. This is
because pre-defined controls by definition will not
address unknown risks and therefore staff must work in
line with principles and values which guide their actions
and decision making in unforeseen circumstances.
Risk culture is commonly framed through a code of
conduct, which a majority of survey participants have
in place. Only a minority of these explicitly mention the
contribution which operational risk management can
make to good conduct. A majority of participants also
assessed their firm’s risk culture through formal risk
culture surveys.
Operational risk management can be an important
contributor to good conduct. For this purpose it
can be useful to adopt a broad definition of operational
risk. However the majority of institutions surveyed
have preferred to adopt the de facto industry
standard definition as stated in the banking industry’s
Basel II Accord4.
A majority of firms surveyed indicate that their
operational risk framework provides inputs into
conduct management.
4 Basel II Accord defines operational risk as the risk of loss resulting from inadequate or failed internal processes, people and systems or from external events. This definition includes legal risk, but excludes strategic and reputational risk.
Exhibit 4: Is the operational risk framework used in conduct management?
Yes63%
No37%
N=25
Conduct is included in the operational risk register
We combine conduct and operational risk management together in our framework diagram and reporting
Both the corporate top risk assessment and individual divisional Risk and Control Self-Assessments explicitly assess conduct risk and the associated control environment
Fraud and compliance frameworks which are components of our operational risk management framework are used to manage conduct risk
There is a link and close relationship between our operational risk management framework and compliance framework
Copyright © 2015 Oliver Wyman & ORIC International 10
5. RISK IDENTIFICATION AND ASSESSMENT
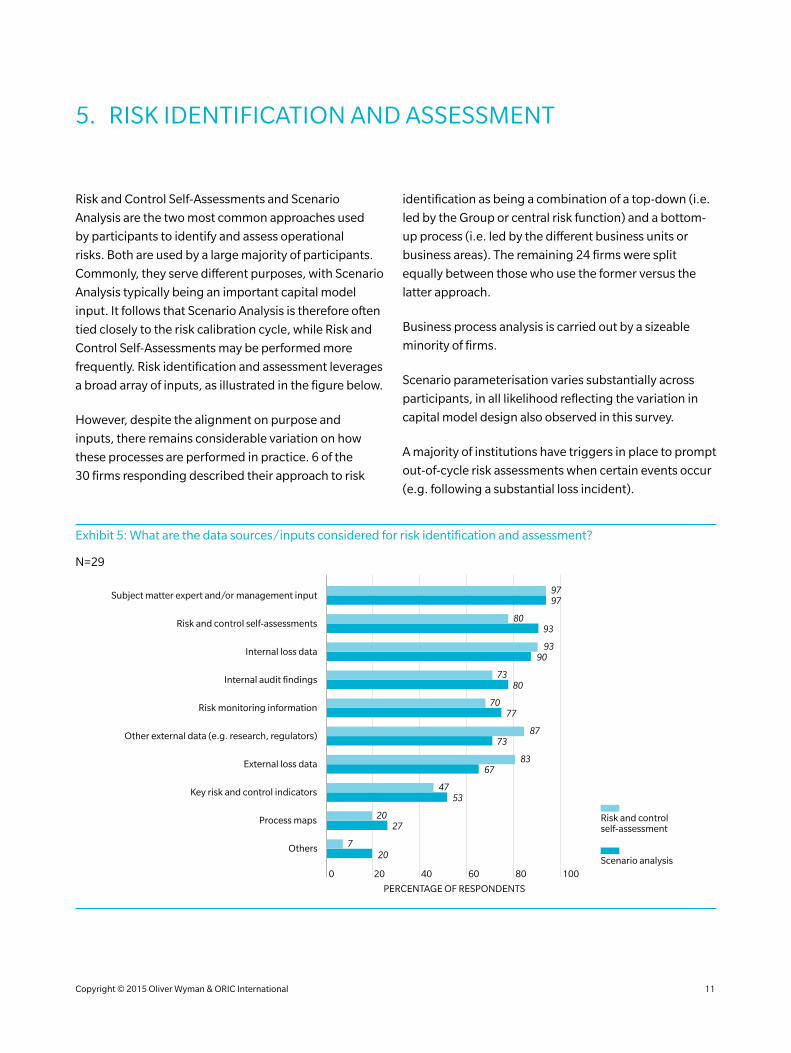
Risk and Control Self-Assessments and Scenario
Analysis are the two most common approaches used
by participants to identify and assess operational
risks. Both are used by a large majority of participants.
Commonly, they serve different purposes, with Scenario
Analysis typically being an important capital model
input. It follows that Scenario Analysis is therefore often
tied closely to the risk calibration cycle, while Risk and
Control Self-Assessments may be performed more
frequently. Risk identification and assessment leverages
a broad array of inputs, as illustrated in the figure below.
However, despite the alignment on purpose and
inputs, there remains considerable variation on how
these processes are performed in practice. 6 of the
30 firms responding described their approach to risk
identification as being a combination of a top-down (i.e.
led by the Group or central risk function) and a bottom-
up process (i.e. led by the different business units or
business areas). The remaining 24 firms were split
equally between those who use the former versus the
latter approach.
Business process analysis is carried out by a sizeable
minority of firms.
Scenario parameterisation varies substantially across
participants, in all likelihood reflecting the variation in
capital model design also observed in this survey.
A majority of institutions have triggers in place to prompt
out-of-cycle risk assessments when certain events occur
(e.g. following a substantial loss incident).
Exhibit 5: What are the data sources/inputs considered for risk identification and assessment?
100 80 60 40 20
Other external data (e.g. research, regulators)
Risk monitoring information
Internal audit findings
Internal loss data
Risk and control self-assessments
Subject matter expert and/or management input
External loss data
Key risk and control indicators
Process maps
Others
0
PERCENTAGE OF RESPONDENTS
Risk and control self-assessment
Scenario analysis
9797
8093
9390
7380
7077
87
8367
53
27
207
20
47
73
N=29
Copyright © 2015 Oliver Wyman & ORIC International 11

6. RISK EVENT DATA CAPTURE
The importance of an accurate and long history of
internal risk event data (i.e. loss events and near misses)
is widely recognised as a crucial source of information
that can inform both internal control enhancements and
also forward looking risk assessment and measurement.
Compared to the banking sector, insurers have long
suffered from a relative lack of internal risk event data.
This has substantially influenced thinking on capital
model design as well as prompting initiatives for industry
loss event and near miss data sharing, such as through
ORIC International.
As our survey shows, the loss event data collected
at many firms now spans in excess of 5 years and in
one case covers 14 years. For reference, 5 years is
the minimum requirement for banks to apply for the
Advanced Measurement Approach under Basel II. It is
likely that as the insurance industry reaches this level of
loss history, additional capital model design options will
open up.
Minimum thresholds are not applied for loss event
data capture at a majority of participants; in addition
many firms continue to report problems in relation
to collecting data on boundary events reliably. Initial
capture is a business responsibility at most firms, while
the risk function assumes a quality control role.
“Lessons learnt” processes are popular in principle, but
formal follow up remains rare, with only a few larger
firms reporting systematic, regular communication
and follow-up.
Exhibit 6: How many number of years have you collected internal loss data?
60
80
20Mean incidentdata length
Incidentdata length
40
NUMBER OF YEARS OF LOSS DATA
0
100
101214 8 6 4 2 0
PERCENTAGE OF RESPONDENTS
N=30
Mean data collection: 6.4 years
Copyright © 2015 Oliver Wyman & ORIC International 12
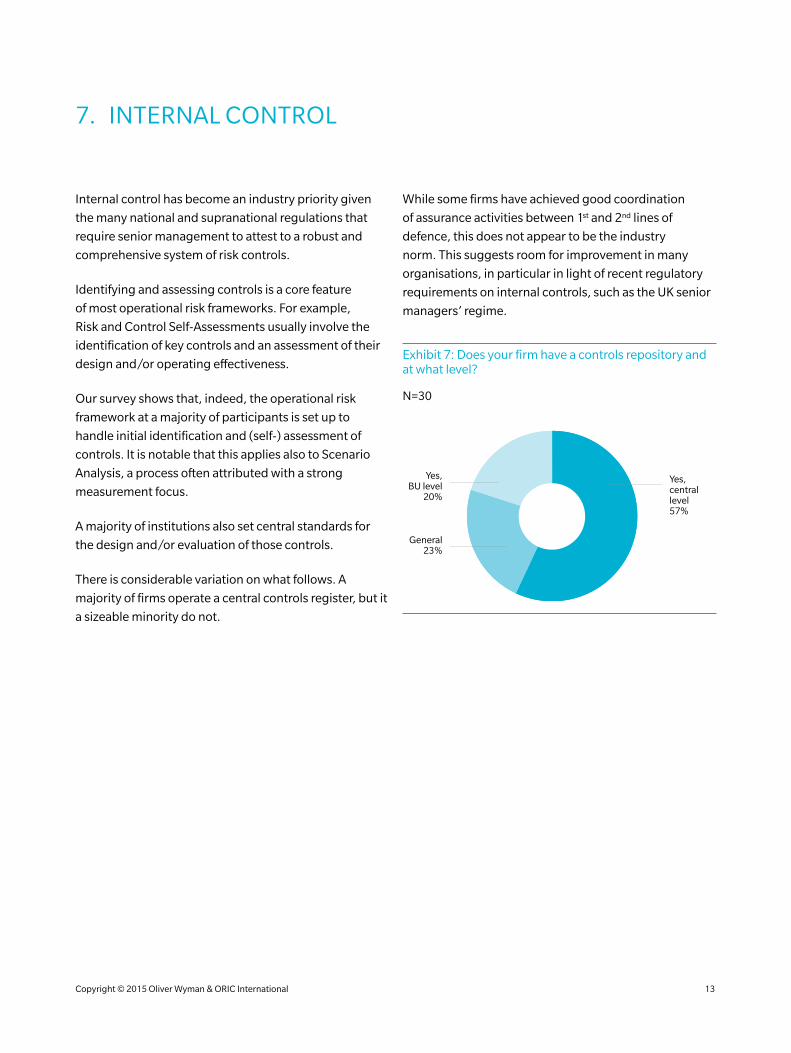
7. INTERNAL CONTROL
Internal control has become an industry priority given
the many national and supranational regulations that
require senior management to attest to a robust and
comprehensive system of risk controls.
Identifying and assessing controls is a core feature
of most operational risk frameworks. For example,
Risk and Control Self-Assessments usually involve the
identification of key controls and an assessment of their
design and/or operating effectiveness.
Our survey shows that, indeed, the operational risk
framework at a majority of participants is set up to
handle initial identification and (self-) assessment of
controls. It is notable that this applies also to Scenario
Analysis, a process often attributed with a strong
measurement focus.
A majority of institutions also set central standards for
the design and/or evaluation of those controls.
There is considerable variation on what follows. A
majority of firms operate a central controls register, but it
a sizeable minority do not.
While some firms have achieved good coordination
of assurance activities between 1st and 2nd lines of
defence, this does not appear to be the industry
norm. This suggests room for improvement in many
organisations, in particular in light of recent regulatory
requirements on internal controls, such as the UK senior
managers’ regime.
Exhibit 7: Does your firm have a controls repository and at what level?
Yes, centrallevel57%
Yes,BU level
20%
N=30
General23%
Copyright © 2015 Oliver Wyman & ORIC International 13

8. MONITORING
A good risk monitoring and control framework enables
a firm to quickly respond to changes in the business, the
market environment and to emerging risks.
However in our survey, a majority of participants
considered their key monitoring indicators (Key Risk
Indicators, Key Control Indicators) to be ineffective. This
was more pronounced in smaller firms and correlates
with smaller firms also wishing to enhance their
approach to operational risk tolerance setting.
A majority of participating firms collect firm-wide Key
Risk and Control Indicators. Larger firms had also
defined ownership for each of their indicators.
A majority of firms had also put in place internal policies
governing threshold breaches on Key Risk and Control
Indicators – however only a minority of firms were able
to articulate pre-defined actions upon breaching such
thresholds. As risk tolerance frameworks become more
developed, we expect to see further enhancements in
the use and governance of risk and control indicators.
Exhibit 8: Do you think KRIs/KCIs in place at your firm are effective indicators of operational risks?
40
20
50
60
Small
13
88
Medium
43
57
Large
Yes
No
0
100
N=30
50
50
PARTICIPANT SIZE
PERCENTAGE OF RESPONDENTS
Copyright © 2015 Oliver Wyman & ORIC International 14

9. BUSINESS DECISION MAKING
Embedding of operational risk management, such that
both the formal framework and its underlying principles
are applied in day to day business decision making is a
key priority for all participating firms in this survey.
Embedding operational risk management in
the business relies on alignment of training and
compensation as well as formal decision making
processes. For the latter, operational risk considerations
are taken into account in most of the business processes
we asked about, by the majority of the firms surveyed,
as shown in the figure below. We note that this is mainly
executed through the 1st Line of Defence (LoD).
Training is equally important to ensure the principles
and aims of the operational risk management framework
are applied by staff appropriately in situations arising
outside of the defined processes listed above. Internal
model firms had progressed significantly further in
tailoring this training to specific audiences.
Finally, remuneration is an important driver of
embedding the operational risk framework. The
majority of participants reflected operational risk in
compensation setting, mostly to reflect adherence to the
operational risk or broader risk management framework.
Exhibit 9: How do you use operational risk in business decisions and responsibilities?
N=30
100 90 80 70 60 50 40 30 20 10
M&A
0
Strategic planning and budgeting process
Product approvals
Outsourcingagreements
Insurancepurchasing
Performancemanagement
Renumeration
Project approvals
1st LoD
2nd LoD
3rd LoD
1423
1729
70 20
63 27
67 20
65 19
59 17
47 21
PERCENTAGE OF RESPONDENTS
2
3
3
Copyright © 2015 Oliver Wyman & ORIC International 15
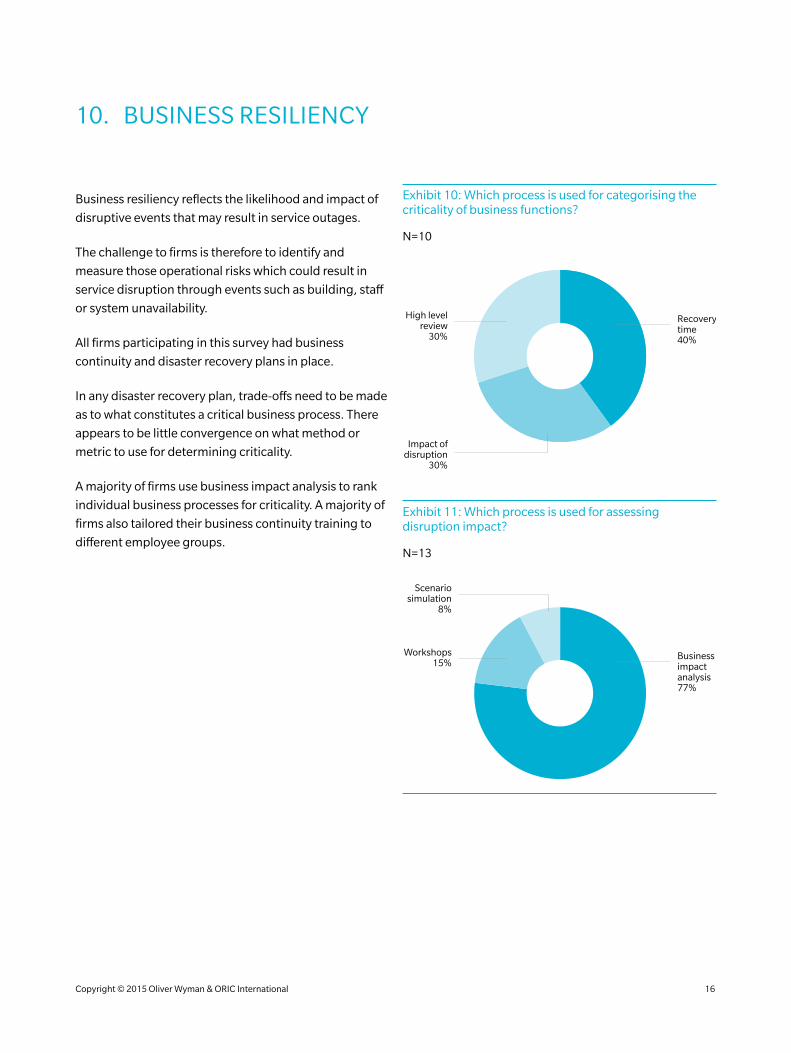
10. BUSINESS RESILIENCY
Business resiliency reflects the likelihood and impact of
disruptive events that may result in service outages.
The challenge to firms is therefore to identify and
measure those operational risks which could result in
service disruption through events such as building, staff
or system unavailability.
All firms participating in this survey had business
continuity and disaster recovery plans in place.
In any disaster recovery plan, trade-offs need to be made
as to what constitutes a critical business process. There
appears to be little convergence on what method or
metric to use for determining criticality.
A majority of firms use business impact analysis to rank
individual business processes for criticality. A majority of
firms also tailored their business continuity training to
different employee groups.
Exhibit 10: Which process is used for categorising the criticality of business functions?
Recoverytime40%
High levelreview
30%
Impact ofdisruption
30%
N=10
Exhibit 11: Which process is used for assessing disruption impact?
Businessimpactanalysis77%
Scenariosimulation
8%
Workshops15%
N=13
Copyright © 2015 Oliver Wyman & ORIC International 16
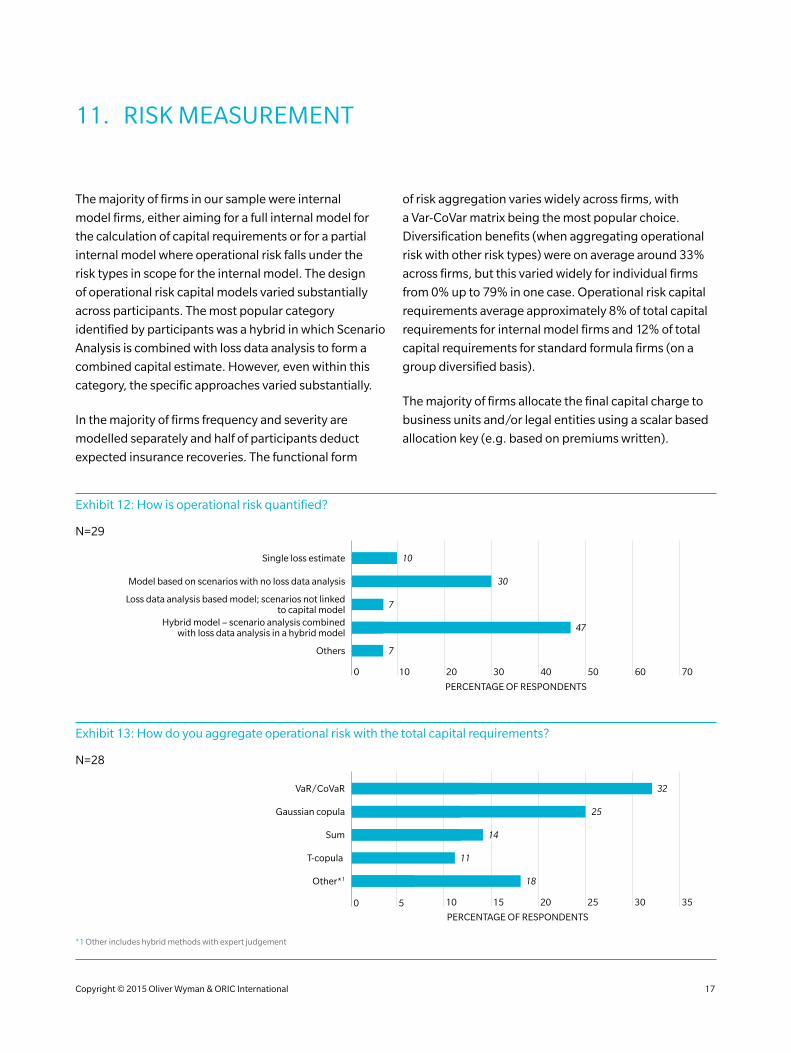
11. RISK MEASUREMENT
The majority of firms in our sample were internal
model firms, either aiming for a full internal model for
the calculation of capital requirements or for a partial
internal model where operational risk falls under the
risk types in scope for the internal model. The design
of operational risk capital models varied substantially
across participants. The most popular category
identified by participants was a hybrid in which Scenario
Analysis is combined with loss data analysis to form a
combined capital estimate. However, even within this
category, the specific approaches varied substantially.
In the majority of firms frequency and severity are
modelled separately and half of participants deduct
expected insurance recoveries. The functional form
of risk aggregation varies widely across firms, with
a Var-CoVar matrix being the most popular choice.
Diversification benefits (when aggregating operational
risk with other risk types) were on average around 33%
across firms, but this varied widely for individual firms
from 0% up to 79% in one case. Operational risk capital
requirements average approximately 8% of total capital
requirements for internal model firms and 12% of total
capital requirements for standard formula firms (on a
group diversified basis).
The majority of firms allocate the final capital charge to
business units and/or legal entities using a scalar based
allocation key (e.g. based on premiums written).
Exhibit 12: How is operational risk quantified?
N=29
60 50 40 30 20 70 10
7
Others
PERCENTAGE OF RESPONDENTS
47
7
7
30
10Single loss estimate
0
Model based on scenarios with no loss data analysis
Loss data analysis based model; scenarios not linkedto capital model
Hybrid model – scenario analysis combinedwith loss data analysis in a hybrid model
Exhibit 13: How do you aggregate operational risk with the total capital requirements?
N=28
30 25 35 20 15 10 5
18
11
14
25
32VaR/CoVaR
Gaussian copula
Sum
T-copula
Other*1
PERCENTAGE OF RESPONDENTS
0
*1 Other includes hybrid methods with expert judgement
Copyright © 2015 Oliver Wyman & ORIC International 17
12. SYSTEMS
Oerational risk systems can aid the consistent capture
of operational risk event data, including internal and
external loss events and near misses, Risk and Control
Self-Assessments, Scenario Analysis, risk and control
indicators and action items. Systems are often built
in-house, but a variety of vended solutions are on offer
that may represent an attractive alternative to lengthy
in-house developments. In our survey, we noted
significantly greater popularity of vended systems
among internal model firms compared to firms intending
to use the standard formula.
Vended systems are most likely used to support
operational risk management, while measurement (i.e.
capital modelling and Scenario Analysis) systems were
more likely to be housed outside of them.
Exhibit 14: Do you use a vendor-based system to support operational risk management?
40
20
80
60
Internal model
84
16
Standard formula
Yes
No
0
100
N=25
33
67
CAPITAL MODEL TYPE
PERCENTAGE OF RESPONDENTS
Exhibit 15: What activities are vendor based systems used for?
N=20
100 80 60 40 20
40
30
85
85
90
100
Workflowmanagement
Loss datacollection
Riskcontrol self
assessments
Reporting
Scenarioanalysis
Capitalmodeling
PERCENTAGE OF RESPONDENTS
0
Copyright © 2015 Oliver Wyman & ORIC International 18
CONCLUDING REMARKS
Operational risk management plays a crucial role in the
success of all financial institutions, including insurers.
The survey results indicate the insurance industry is
making good progress, but many firms are intending
to further enhance their approaches to operational risk
management and measurement.
Several recent events in the broader financial services
industry have brought operational risk, and, in
particular, conduct risk to the forefront of the regulatory
agenda. These events have also shown that the
impact of operational risk can be broader than direct
financial losses, suggesting that practitioners and
risk managers may wish to consider broadening the
definition of operational risk identification, assessment,
measurement and management to include indirect
operational risk losses, for example falls in share price
or opportunity costs. A broader definition could include
all such second order losses beyond the immediate
financial impact of the loss event.
In closing, we would like to draw attention to two key
themes from the survey:
1. Lack of convergence
This survey shows substantial variability in the
methodologies employed for core operational risk tools
such as Scenario Analysis and capital modelling.
Each member firm’s practitioners must be able to explain
the modelling choices, and their relevance to the firm’s
specificities such as products, consumers, operational
complexities (or lack of) as well as regulation that would
mandate or justify the internal model approach taken.
We believe the industry must continue to look to examples
of leading practices amongst peers and continually strive
to converge on these approaches. Otherwise, there may
be a risk that regulators step in and force convergence
to more rigid, simplistic practices – which would end
the healthy competition of new ideas and practices now
observed across participants.
2. Measurement vs. Management
While operational risk measurement continues to
evolve (with diverse approaches), our survey results
show that the management of operational risk needs
considerable attention to remain aligned with upgrades
to measurement approaches. Specific areas of focus for
enhancement include:
Organisation and governance: Those participants
that don’t already should consider explicitly including
operational risk in the terms of reference for
relevant committees.
Internal controls: Centralisation of control repositories
and a defined process for monitoring control
effectiveness would be of benefit to a sizeable portion of
participants, also in light of recent regulatory changes
such as the UK’s senior managers’ regime.
Monitoring: Smaller firms could improve Key Risk and
Control Indicator effectiveness by broadening their
scope, more clearly assigning ownership, and defining
formal policies with escalation paths for breaches.
Business use: Use of the operational risk framework in
business decision making is limited largely to the 1st line
(business), with the 2nd (risk function) and 3rd (internal
audit) lines of defence lacking involvement.
Culture and conduct: Many firms would benefit from
carrying out risk culture assessments and ensuring that
there is a clear integration of conduct risk management
within their broader ORM framework.
As insurers respond to regulatory and competitive
challenges, they will need to continue to set higher
standards and enhance their operational risk
management frameworks and capabilities to meet
heightened regulatory expectations, as well as those of
consumers. In doing so, they should actively support
industry convergence where appropriate.
Copyright © 2015 Oliver Wyman & ORIC International 19
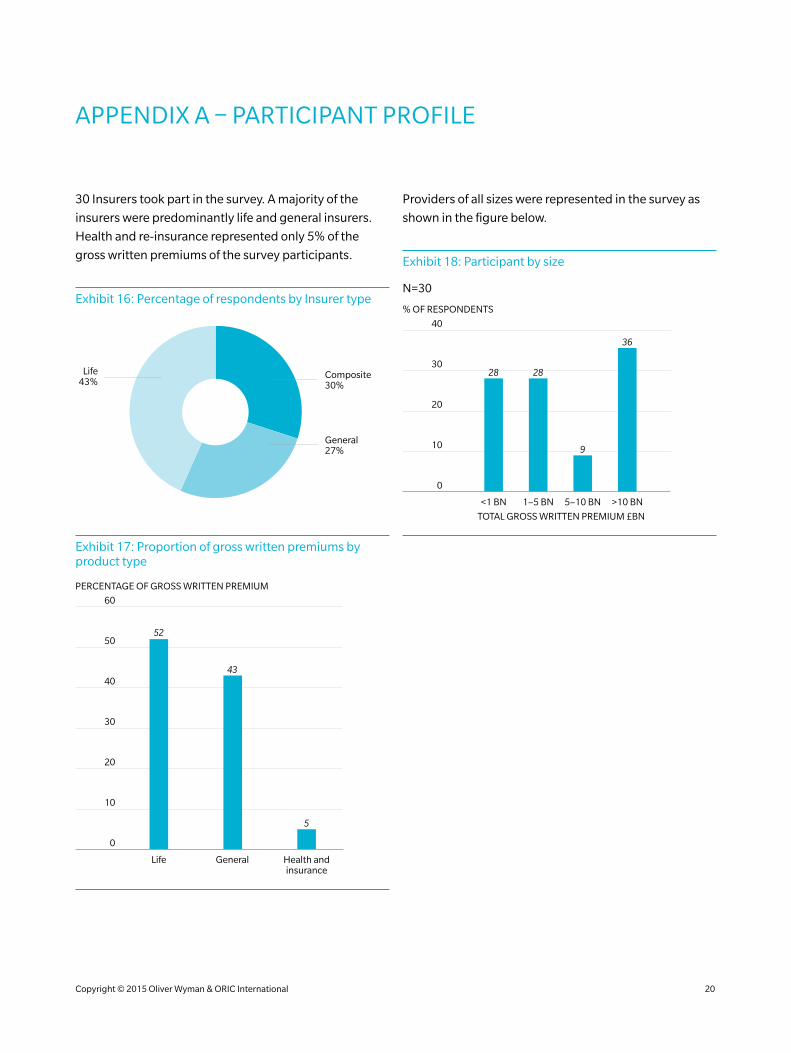
APPENDIX A – PARTICIPANT PROFILE
30 Insurers took part in the survey. A majority of the
insurers were predominantly life and general insurers.
Health and re-insurance represented only 5% of the
gross written premiums of the survey participants.
Exhibit 16: Percentage of respondents by Insurer type
Composite30%
General27%
Life43%
Exhibit 17: Proportion of gross written premiums by product type
30
20
50
40
Life
52
General
43
Health andinsurance
10
0
60
5
PERCENTAGE OF GROSS WRITTEN PREMIUM
Providers of all sizes were represented in the survey as
shown in the figure below.
Exhibit 18: Participant by size
30
20
40
<1 BN 1–5 BN 5–10 BN >10 BN
10
0
9
36
2828
% OF RESPONDENTS
N=30
TOTAL GROSS WRITTEN PREMIUM £BN
Copyright © 2015 Oliver Wyman & ORIC International 20
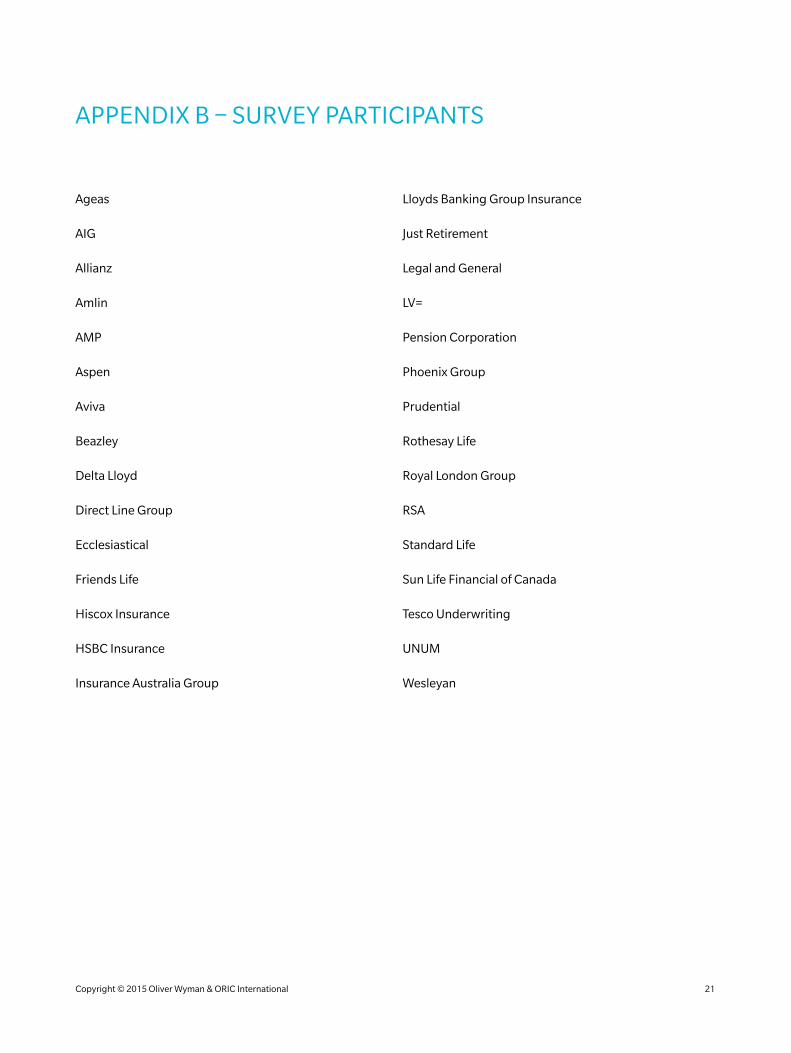
APPENDIX B – SURVEY PARTICIPANTS
Ageas
AIG
Allianz
Amlin
AMP
Aspen
Aviva
Beazley
Delta Lloyd
Direct Line Group
Ecclesiastical
Friends Life
Hiscox Insurance
HSBC Insurance
Insurance Australia Group
Lloyds Banking Group Insurance
Just Retirement
Legal and General
LV=
Pension Corporation
Phoenix Group
Prudential
Rothesay Life
Royal London Group
RSA
Standard Life
Sun Life Financial of Canada
Tesco Underwriting
UNUM
Wesleyan
Copyright © 2015 Oliver Wyman & ORIC International 21
Oliver Wyman is a global leader in management consulting that combines deep industry knowledge with specialised expertise in strategy, operations, risk management, and organisation transformation.
For more information please contact the marketing department by email at [email protected] or by phone at one of the following locations:
EMEA AMERICAS ASIA PACIFIC
+44 20 7333 8333 +1 212 541 8100 +65 6510 9700
www.oliverwyman.com
ABOUT ORIC INTERNATIONAL
Founded in 2005, ORIC International is the leading operational risk consortium for the (re)insurance and asset management sector globally. ORIC International currently has 40 members with accelerating international growth. ORIC International is a not-for-profit organisation dedicated to helping its members enhance the capabilities of their operational risk functions. ORIC International facilitates the anonymised and confidential exchange of operational risk intelligence between member firms; providing a diverse, high-quality pool of quantitative and qualitative information on relevant operational risk exposures. As well as providing operational risk event data, ORIC International also provides industry benchmarks, undertakes leading research, sets trusted standards for operational risk and provides a forum for members to exchange ideas and best practice. Our comprehensive offering is designed to empower operational risk professionals to help the business and their board in the identification, assessment, management/measurement, monitoring and reporting of operational risk.
Enquiries: +44 (0) 207 216 7355 [email protected]
www.oricinternational.com
Copyright © 2015 Oliver Wyman and ORIC International
All rights reserved. This report may not be reproduced or redistributed, in whole or in part, without the written permission of Oliver Wyman and Oliver Wyman accepts no liability whatsoever for the actions of third parties in this respect.
The information and opinions in this report were prepared by Oliver Wyman. This report is not investment advice and should not be relied on for such advice or as a substitute for consultation with professional accountants, tax, legal or financial advisors. Oliver Wyman has made every effort to use reliable, up-to-date and comprehensive information and analysis, but all information is provided without warranty of any kind, express or implied. Oliver Wyman disclaims any responsibility to update the information or conclusions in this report. Oliver Wyman accepts no liability for any loss arising from any action taken or refrained from as a result of information contained in this report or any reports or sources of information referred to herein, or for any consequential, special or similar damages even if advised of the possibility of such damages. The report is not an offer to buy or sell securities or a solicitation of an offer to buy or sell securities. This report may not be sold without the written consent of Oliver Wyman.