Embed Size (px)
Citation preview
Power Curve Working Group #2: (Brande)
Operational Power Curve test in
complex terrain
Daniel Stevens (SSE Renewables)
12 March 2013
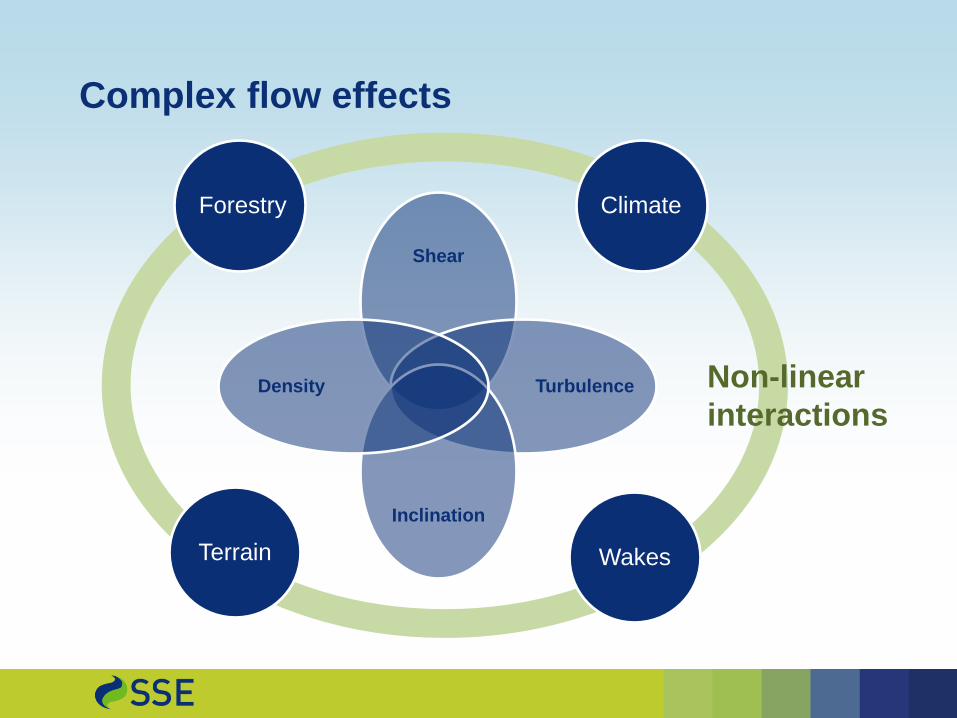
Complex flow effects
Shear
Turbulence
Inclination
Density
Terrain
Climate
Wakes
Forestry
Non-linear
interactions
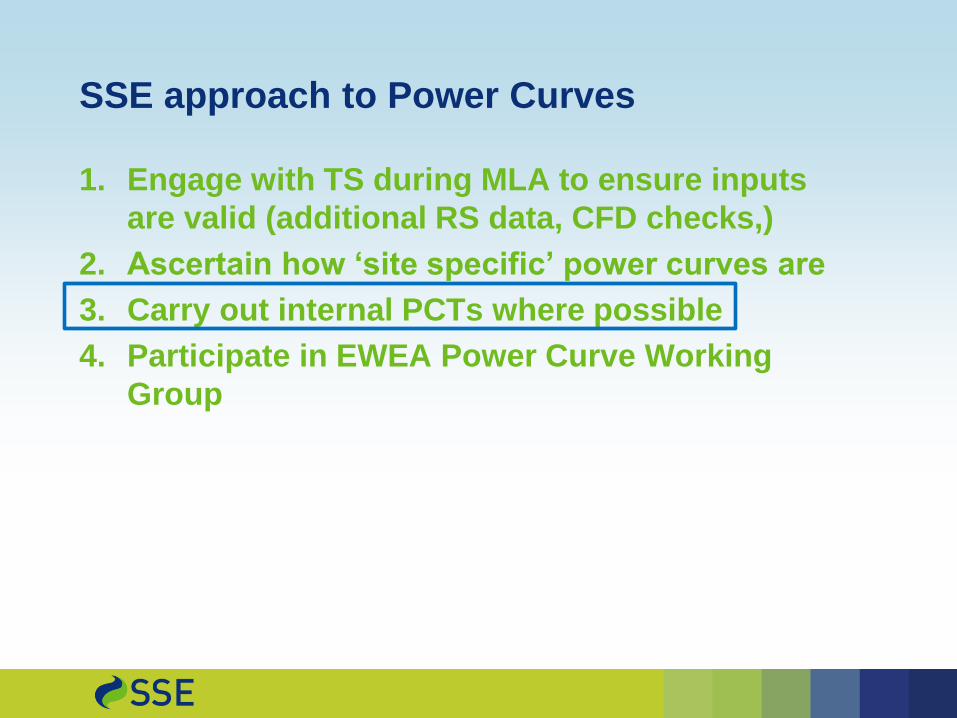
SSE approach to Power Curves
1. Engage with TS during MLA to ensure inputs
are valid (additional RS data, CFD checks,)
2. Ascertain how „site specific‟ power curves are
3. Carry out internal PCTs where possible
4. Participate in EWEA Power Curve Working
Group
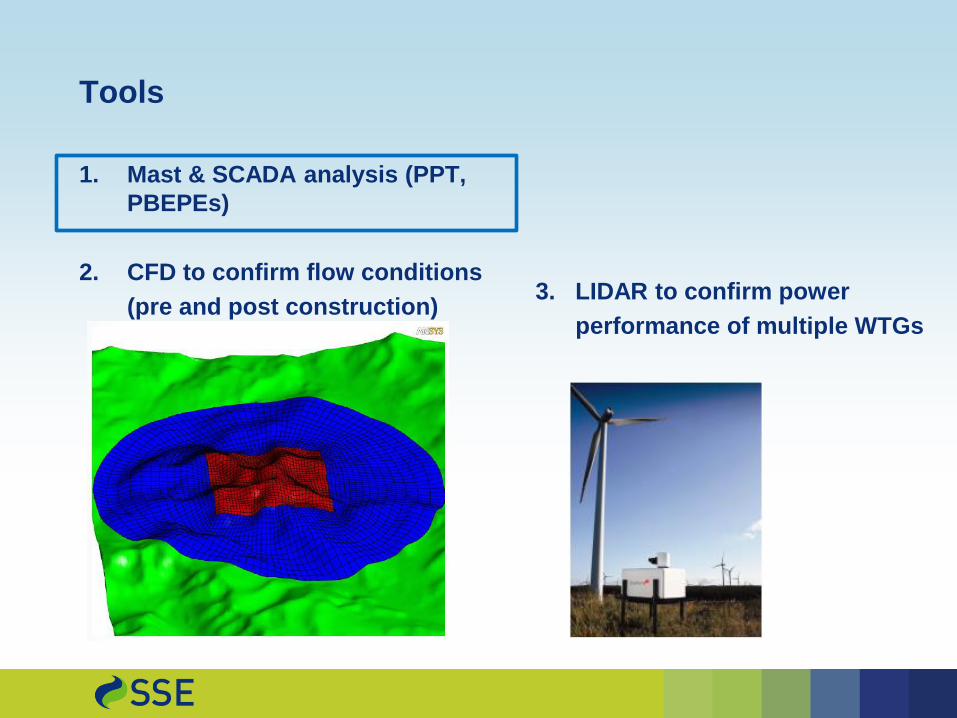
Tools
1. Mast & SCADA analysis (PPT,
PBEPEs)
2. CFD to confirm flow conditions
(pre and post construction) 3. LIDAR to confirm power
performance of multiple WTGs
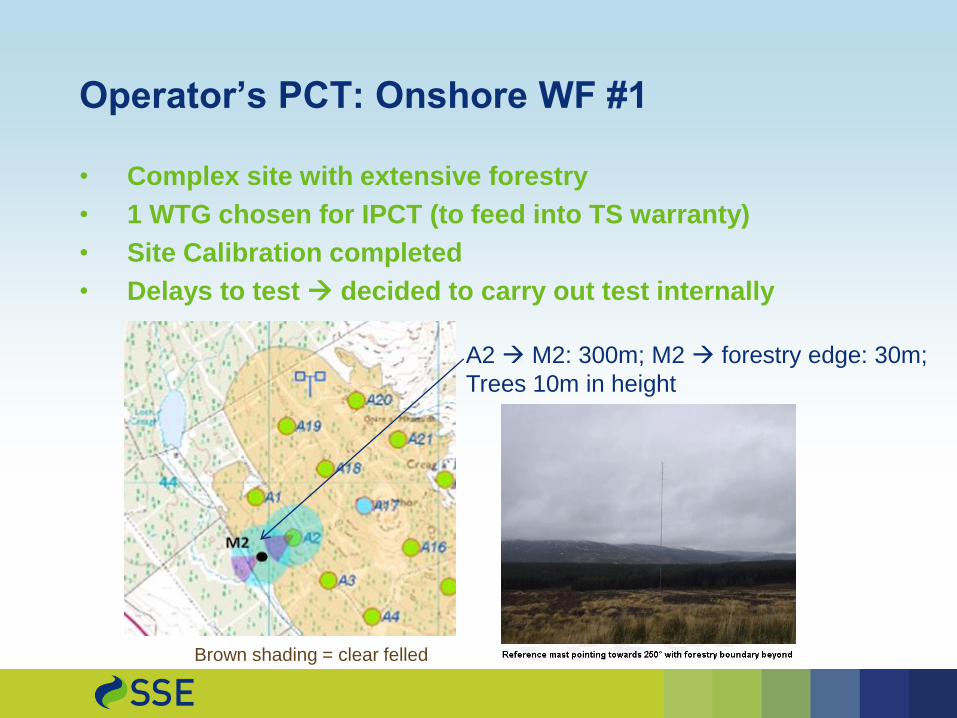
Operator‟s PCT: Onshore WF #1
• Complex site with extensive forestry
• 1 WTG chosen for IPCT (to feed into TS warranty)
• Site Calibration completed
• Delays to test decided to carry out test internally
A2 M2: 300m; M2 forestry edge: 30m;
Trees 10m in height
Brown shading = clear felled
AIMS/Methodology
AIMS
1. To quantify the effects of so called „complex‟ wind conditions
(such as high shear, high turbulence and high vertical wind
speed) on turbine power performance
2. To understand likelihood of IPCT failure
3. To develop methodology for future “OPCTs”
METHOD
1. Site visit to check forestry
2. Compare wind climate at Turbine Base and Test mast
3. Apply speed ups derived during Site Calibration synthesize
Observed power curves based on freestream winds
4. Filter PCs on Shear, TI, flow inclination (from U/sonics)
5. Calculate MAEP
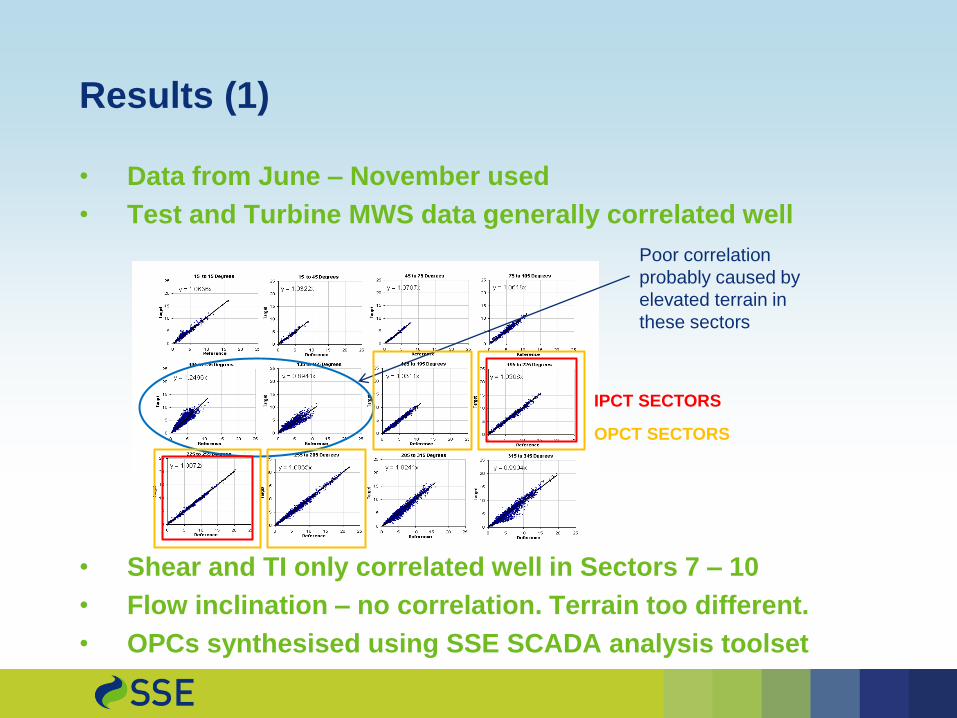
Results (1)
• Data from June – November used
• Test and Turbine MWS data generally correlated well
• Shear and TI only correlated well in Sectors 7 – 10
• Flow inclination – no correlation. Terrain too different.
• OPCs synthesised using SSE SCADA analysis toolset
Poor correlation
probably caused by
elevated terrain in
these sectors
IPCT SECTORS OPCT SECTORS
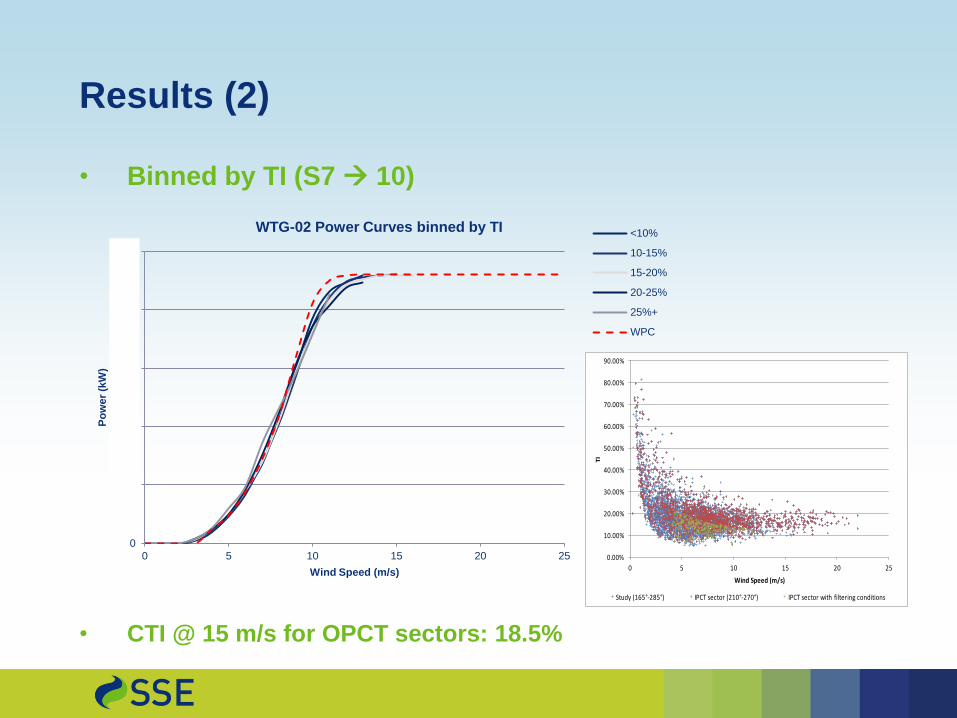
Results (2)
• Binned by TI (S7 10)
• CTI @ 15 m/s for OPCT sectors: 18.5%
0
500
1000
1500
2000
2500
0 5 10 15 20 25
Po
wer
(kW
)
Wind Speed (m/s)
WTG-02 Power Curves binned by TI <10%
10-15%
15-20%
20-25%
25%+
WPC
0.00%
10.00%
20.00%
30.00%
40.00%
50.00%
60.00%
70.00%
80.00%
90.00%
0 5 10 15 20 25
TI
Wind Speed (m/s)
Study (165°-285°) IPCT sector (210°-270°) IPCT sector with filtering conditions
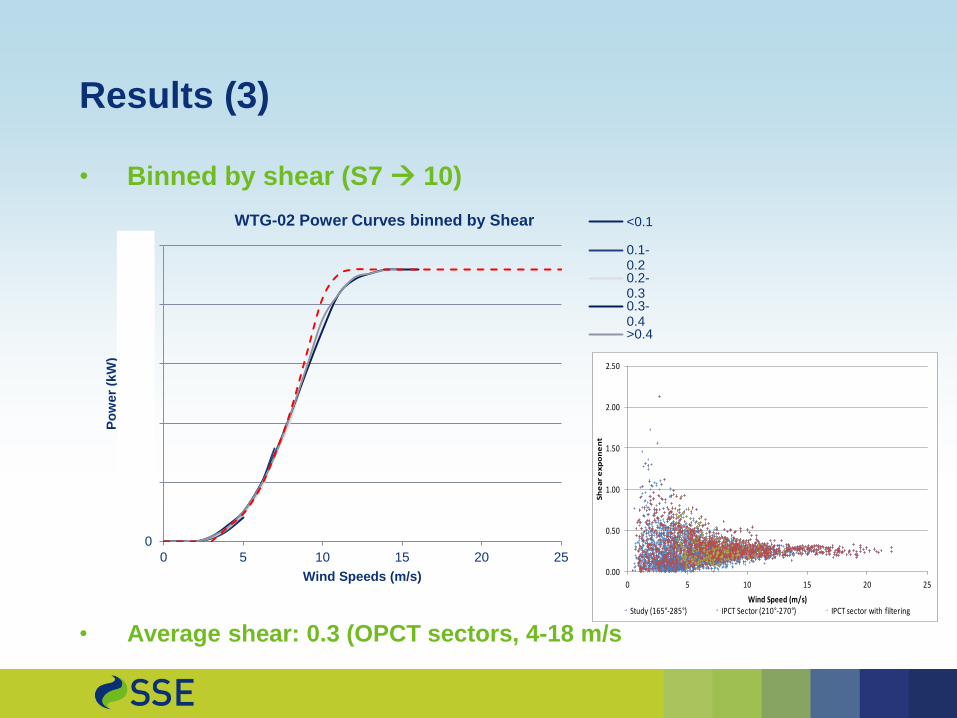
Results (3)
• Binned by shear (S7 10)
• Average shear: 0.3 (OPCT sectors, 4-18 m/s
0
500
1000
1500
2000
2500
0 5 10 15 20 25
Po
wer
(kW
)
Wind Speeds (m/s)
WTG-02 Power Curves binned by Shear <0.1
0.1-0.20.2-0.30.3-0.4>0.4
0.00
0.50
1.00
1.50
2.00
2.50
0 5 10 15 20 25
Sh
ea
r e
xp
on
en
tWind Speed (m/s)
Study (165°-285°) IPCT Sector (210°-270°) IPCT sector with filtering
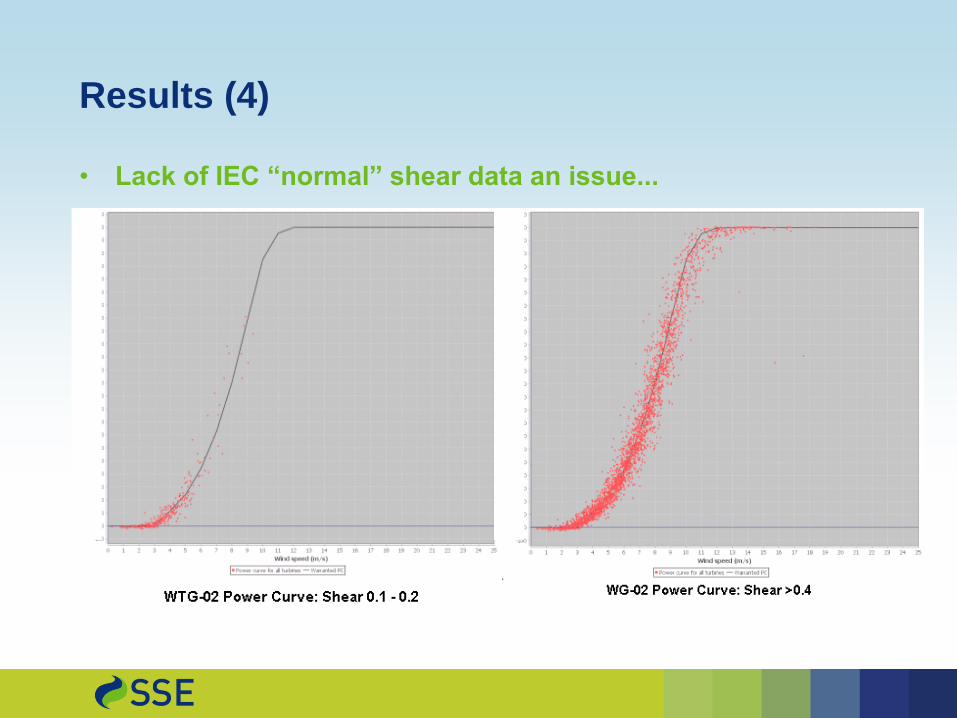
Results (4)
• Lack of IEC “normal” shear data an issue...
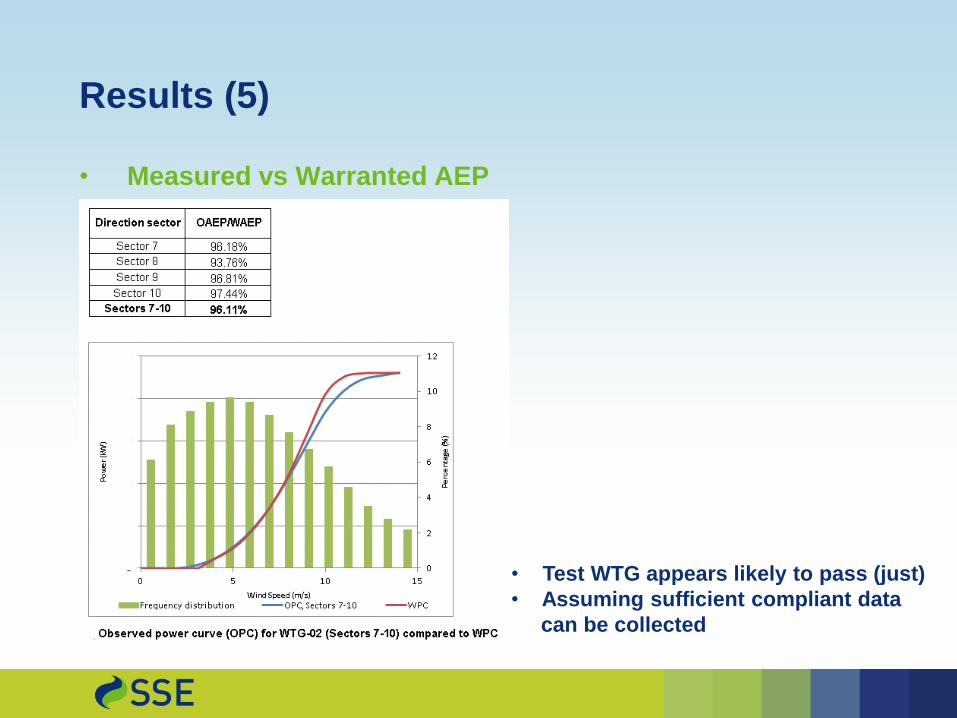
Results (5)
• Measured vs Warranted AEP
• Test WTG appears likely to pass (just)
• Assuming sufficient compliant data
can be collected
Conclusions
• TI reducing power at knee
• Effects of shear less clear, hampered by lack of low shear data (!)
• Overall performance deficit from the WPC above 8m/s is evident
• Mean shear exponent and the characteristic TI significantly
greater than IEC limits due to the close proximity of the forestry
to the west.
• The IPCT as agreed will not give a complete picture of the turbine
operation on the site, if indeed it can capture sufficient data to
complete the test before anemometer calibrations expire.
• Future OPCTs will need larger non-wake affected sectors in order
to draw conclusions on forestry‟s impacts

Galion LiDAR deployment
• Galion to be located at base of PPT WTG to supplement
OPCT and IPCT data
• Two types of scan to be used:
1. Arc scan measurement to coincide with HH anemometer on test
mast (3D upstream of WTG)
2. Range Height Indicator scans to produce cross sections of the inflow
in a vertical plane
• Scan type 1: primarily for verification
• Scan type 2: to derive rotor equivalent wind speeds, shear
to rotor tip, flow inclination
• Power Curves derived from mast and LiDAR to be
compared
• Reports to comply with the requirements of IEC 61400-12-
1:2005 and Annex L of the current draft 2nd edition of IEC
61400-12-1 (reporting requirements for Lidar)