Embed Size (px)
Citation preview

Hong Kong Institute of CPAs
Financial Management Module (printed May 2010) 9 - 1
Operational, Financial and Strategic Measures of Performance
Part A
Suggested References
When studying this topic you should refer to the following resources:
Primary Reference
Garrison, R.H., Noreen, E., and Brewer P. C., Managerial Accounting, 11th edition, Chapters 10,
16 and 17.
Supplementary References
Atkinson, A.A., Banker, R., Kaplan, R.S. and Young, D.W., Management Accounting, 4th edition,
2003, Chapter 9.
Brigham, Eugene F., and Houston, Joel F., Fundamentals of Financial Management, 9th edition,
1999, Chapter3.
Epstein, Marc and Wisner, Priscilla, “Using a Balanced Scorecard to Implement Sustainability”,
Environmental quality Management, Winter 2001 pp. 1-10.
Hansen, Don R., and Mowen, Maryanne M., Management Accounting (8th ed.), South Western
Publishing Co., Cincinnati, Ohio, 2007, Chapter 10 and Chapter 13.
Horngren, C.T., Datar S.M., and Foster, G., Ittner, C. and Rajan, M. Cost Accounting: A
Managerial Emphasis, 13th edition, 2008, Chapter 13.
Hurle, Mike, “Are You Balanced?”, A Plus, September 2005, pp. 29-32
Kimmel, P.D., Carlon, S., Loftus, J., Mladenovic, R., Kieso D.E., and Weygandt J.J., Accounting:
Building Business Skill, John Wiley and Sons, Ltd, Australia, 2003, Chapters 10 & 11.
Robinson, Thomas R., Munter, Paul, Grant, Julia, Financial Statement Analysis: A Global
Perspective, 2004
White, Gwendolen, “How to Report a Company’s Sustainability Activities”, Management
Accounting Quarterly, Fall 2005, pp. 36 – 43.
Bibliographic References
Kaplan, R.S. and D.P. Norton (1992). The Balanced Scorecard - Measures that Drive
Performance. Harvard Business Review, January-February, 71-79.
Kaplan, R.S. and D.P. Norton (1996a). The Balanced Scorecard: Translating Strategy into
Action. Harvard Business School Press, Boston.
Kaplan, R.S. and D.P. Norton (1996b). Using the Balanced Scorecard as a Strategic
Management System. Harvard Business Review, January-February, 71-79.
Kaplan, R.S. and D.P. Norton (1996c). Linking the Balanced Scorecard to Strategy. California
Management Review, Fall, 53-69.
Kaplan, R.S and D.P. Norton (2001a). Transforming the Balanced Scorecard from Performance
Measurement to Strategic Management: Part 1. Accounting Horizons, March, 87-104.
Kaplan, R.S and D.P. Norton (2001b). Transforming the Balanced Scorecard from Performance
Measurement to Strategic Management: Part 2. Accounting Horizons, June, 147-1
Section
9

Hong Kong Institute of CPAs
Financial Management Module (printed May 2010) 9 - 2
Part B
Topic Learning Outcomes
On completion of this module, you should be able to:
i) Calculate financial, strategic and operational performance measures and understand the relationships between them.
ii) Describe the role of cash flow analysis in the evaluation of the organisation’s strategic and operational plan.
iii) Describe the interrelationships between shareholder wealth creation and performance measures aligned to that objective, including agency theory and its relationship to managerial incentive schemes
iv) Identify financial and non-financial measures of business profitability including cash flow measures.
Operational, financial and strategic measures of performance:
• Overall performance measures
• Financial measures
• Profitability
• Economic value added (EVA®)
• Cash flow
• Growth
• Financial and operating ratios
• Non-financial measures
• The balanced scorecard
• The performance pyramid
• Reporting and evaluating sustainability
• Agency theory and managerial incentive schemes
v) Describe measures of entity growth.
vi) List the main steps in translating strategies and plans into goals, recognising their interrelationships.
vii) List the limitations of benchmarking in facilitating organisational change.
viii) Describe the relationships between financial and operating ratios and be able to interpret trends over time and across time.
ix) Explain the key components of the balanced scorecard.
You may choose to complete this topic in a step-by-step way or skip ahead, depending on your
knowledge and assessment of your own competency in relation to the above Learning Outcomes.
Part C
Contents of this Section
9.1 Introduction ........................................................................................................................ 2 9.2 Overall performance measures ......................................................................................... 3 9.3 Financial measures............................................................................................................ 4 9.4 Profitability.......................................................................................................................... 4 9.5 Economic value added (EVA
®) .......................................................................................... 5
9.6 Cash flow ........................................................................................................................... 5 9.7 Growth.............................................................................................................................. 10 9.8 Financial and operating ratios .......................................................................................... 12 9.9 Non-financial measures ................................................................................................... 18 9.10 The balanced scorecard .................................................................................................. 19 9.11 The performance pyramid................................................................................................ 20 9.12 Reporting and evaluating sustainability............................................................................ 21 9.13 Agency theory and managerial incentive schemes.......................................................... 22
9.1 Introduction
In Section 8 we looked at designing and tailoring performance measures to suit the structure of
an organisation. In this section we look at applying performance measures to an organisation to
evaluate its financial, strategic and operational performance. First we consider the differences in
performance measures and how to calculate some of the main types. The links between different
types of measures are also examined. Secondly, cash flow analysis is presented, with a focus on
its relevance to strategic planning and operational planning. Shareholder valuation techniques,
such as EVA®, are shown to be consistent with shareholder value maximisation.

Hong Kong Institute of CPAs
Financial Management Module (printed May 2010) 9 - 3
In the last part we analyse ratios, both in isolation and in conjunction with other ratios.
9.2 Overall Performance Measures
9.2.1 Alignment with Strategic Goals
Most management accounting commentators agree that a mixture of financial and non-financial
measures is the appropriate methodology to judge business or business unit performance. This
is known as the Balanced Scorecard approach (BSC) (Kaplan & Norton 1992). The performance
measures should be aligned with the strategic goals of the organisation, which may be growth,
profitability or survival. Both financial and non-financial performance measures are very
important.
9.2.2 Comparisons and Benchmarking
In order to measure performance, there must be comparisons made:
• To the organisations past performance or budget;
• Between divisions of the organisation; and
• With the organisation’s competitors.
Benchmarking is a continuous and systematic process of evaluating the products, services and
work practices of an organisation against businesses that are considered to be the best
performers in the practice or industry (competitors). It is a continuous process that allows an
organisation to consider its financial and strategic position relative to world’s best practice.
The steps in benchmarking are as follows:
• identify the functions to be benchmarked;
• select benchmark partners;
• collect data and perform analysis to identify performance gaps;
• establish performance goals to narrow performance gap;
• implement plans.
Benchmarking provides the opportunity to compare performance across sites and between
companies to give an indication of current best practice. Potential sources for gathering data are:
• newspaper articles/ business magazines and journals;
• market research;
• inter-firm comparison reports (from government bodies);
• brokers/bankers or market analysts reports;
• exhibitions, trade fairs; and
• hiring of ex-employees.
Accurate and relevant information is often difficult to obtain, as it is likely to be closely guarded by
competitors, yet can be used as a comparative tool.

Hong Kong Institute of CPAs
Financial Management Module (printed May 2010) 9 - 4
9.3 Financial Measures
Financial measures of performance are covered under the following headings:
• Profitability (section 9.4)
• Economic value added (EVA™) (section 9.5)
• Cash flow (section 9.6)
• Growth (section 9.7)
• Financial and operating ratios (section 9.8).
9.4 Profitability
9.4.1 Return on Investment (ROI) and Residual Income (RI)
In section 8 individual divisions were evaluated using ROI and RI. These techniques can also be
applied to the organisation as a whole.
9.4.2 Return on Equity (ROE)
ROE measures the performance of the firm’s management in respect of their ability to invest
shareholder’s funds (equity). The usual calculation of ROE is:
Operating profit
Equity
Example: Assume two firms Company A and Company B with Operating Profit and Equity
balances of:
Company A Company B
Revenue $2,500,000 $9,600,000
Variable Expenses 1,880,000 6,560,000
Fixed Costs 300,000 2,400,000
Operating Profit 320,000 640,000
Total Assets 6,000,000 13,000,000
Total Liabilities 4,800,000 11,400,000
Equity 1,200,000 1,600,000
Company A has ROE of 26.67% ($320,000/$1,200,000) and Company B 40%
($640,000/$1,600,000). ROE would suggest Company B is more profitable but it is important to
consider the level of debt as this affects both the profit and the equity balances. The Du Pont
Formula, introduced by the Du Pont Company in the USA in the 1920s, can be used to further
decompose the ROE into its component parts. For more details, see Section 8.3.2 or any good
Finance Text, such as Brigham and Houston (1999), Chapter 3.

Hong Kong Institute of CPAs
Financial Management Module (printed May 2010) 9 - 5
9.5 Economic Value Added (EVA®
)1
EVA® has become widely used by profit-seeking organisations in recent years. The basic
calculation is as follows:
EVA® =
Net operating profit after tax
(NOPAT) –
[Total assets less current liabilities]
x
Weighted average cost of capital
The cost of capital is the required or minimum rate of return necessary to compensate the firm’s
capital contributors (equity investors and debt issuers) for the risk of the investment. Consider
the following example.
Information $
Sales 3,200,000
Operating expenses 2,000,000
Operating profit before tax 1,200,000
Income tax at 16% 192,000
Operating profit after tax 1,008,000
Total assets less current liabilities 10,000,000
Cost of capital 6%
The EVA® for this period is HK$408,000 because over this period, HK$408,000 of value has been
added to the company’s value. (The charge for the cost of capital was 6% of $10,000,000 or
$600,000). There are some differences in application of the EVA® number. Some commentators
use average capital over the period while others use beginning of the period capital.
It should be noted that there are more sophisticated EVA® models advocated by Stearns and
Stewart, the initial advocates of the method. However these models tend to be variations on the
basic calculations above, and also suffer from the major problem with the calculation i.e. the
numbers are based on accounting book values and do not necessarily reflect “true” economic
value.
9.6 Cash Flow
9.6.1 Overview
The management of cash flow is very important as cash balances must be maintained at a
sufficient level to ensure that enough cash is available to meet the organisation’s short-term cash
disbursement requirements and investment in idle cash balances is reduced to a minimum. The
organisation must be able to maintain inventories or pay for purchases (Just in Time); offer
competitive credit terms, and meet its short-term and long-term operating and financing costs as
they fall due. Failure to meet maturing liabilities on time makes the organisation technically
insolvent. Holding excess reserves of cash is also potentially dangerous as it can result in a loss
in profitability and it may increase the attractiveness of the organisation as a potential takeover.
1 EVA is a registered trademark of the Stern Stewart Corporation.

Hong Kong Institute of CPAs
Financial Management Module (printed May 2010) 9 - 6
9.6.2 Factors Affecting Cash Flows
Organisations experience irregular increases in their cash holdings due to external and internal
factors. External factors affecting cash inflows include sale of securities, such as ordinary shares,
preference shares, bonds and debentures or non-marketable debt contracts, including loans from
commercial banks. These cash flows tend to be irregular because there are usually large sums of
money involved. Other sources of cash arise from internal operations and occur on a more
regular basis. These usually comprise receipts from accounts receivable collections, cash sales
and sales of fixed assets. Decreases in cash arise from the payment of preference and ordinary
dividends, interest and principal repayments on debt, taxation liabilities; acquisition of fixed assets;
and purchases of raw materials and inventories for production.
If excess cash becomes temporarily available, the organisation purchases marketable securities
or where a cash deficit is forecast, a portion of the organisation’s marketable securities portfolio is
liquidated or short term borrowings can be made.
9.6.3 Reasons for Holding Cash
There are three reasons for holding cash: First to pay transactions arising in the ordinary course
of business. Secondly, for precautionary reasons as a buffer to satisfy potential cash needs.
Thirdly, for speculative purposes in order to take advantage of potential profit making situations.
9.6.4 Cash Flows and Performance
Managing the organisation’s cash flow involves simultaneous and interrelated decisions regarding
investments in current and non-current assets and the use of current liabilities. Cash flow
measures indicate the dividend or debt-paying ability of the firm, the ability of the firm to provide
for future growth opportunities and the general solvency of the firm.
a) Marginal Cash Flow
Marginal cash flow shows the net of the variable cash inflows generated by operations after
financing the variable working capital used by these operations. Marginal cash flow is the
difference between the margin of a product and the marginal working capital required to support
the sale of the product which includes trade debtors and inventory, less trade creditors required
for the next unit of product or service. It helps to indicate what is likely to happen to cash flow in
the future if these fundamental relationships are maintained. The marginal cash flow (MCF)
calculation is:
MCF = contribution margin - change in working capital where the change in working capital is an
increase in working capital.
b) Operating Cash Flow
Operating cash flow measures the cash generated from operations, less the cash invested to
fund operations and indicates whether the business’ ongoing ordinary operations are providing
cash towards paying interest, tax, dividends, etc. If operating cash flow is negative there is not
necessarily a problem. The business may be investing in fixed assets for future growth.
Operating cash outflows are funded by increased borrowings or equity.
The operating cash flow (OCF) calculation is:
OCF = EBIT - change in net operating assets

Hong Kong Institute of CPAs
Financial Management Module (printed May 2010) 9 - 7
c) Net Cash Flow
Net cash flow is the real cash flow, the change in borrowings for the year. Depreciation and other
non-cash items are included in the determination of retained income and in the change in net
assets. Net cash flow is the operating cash flow less interest, tax, dividends and extraordinary
items (if applicable) and changes in equity, provision for tax and provision for dividend (if
applicable).
Example 1: Cash Flows
The following information relates to Ling Industrial Ltd.
Ling Industrial Limited: Balance Sheet as at 31 December 2009
Note 2009 2008 2007
$ $ $
Current assets
Accounts receivable 2,732,315 2,442,357 1,833,349
Inventory 1 1,412,935 1,256,225 1,107,726
Sundry debtors 189,700 170,540 102,300
4,334,950 3,869,122 3,043,375
Non-current assets
Fixed assets 4,599,772 4,385,123 3,980,421
Total assets 8,934,722 8,254,245 7,023,796
Current liabilities
Bank overdraft 2,224,053 2,075,421 1,567,820
Accounts payable 684,426 1,261,348 897,931
Other current liabilities 133,900 62,500 39,420
3,042,379 3,399,269 2,505,171
Non-current liabilities
Commercial bill 3,500,000 2,500,000 2,000,000
Total liabilities 6,542,379 5,899,269 4,505,171
Net assets 2,392,343 2,354,976 2,518,625
Shareholders equity
Share capital 1,000,000 1,000,000 1,000,000
Retained profits 1,392,343 1,354,976 1,518,625
2,392,343 2,354,976 2,518,625
Note 1: Inventory
Raw materials 320,649 298,851 270,511
WIP 274,943 173,752 120,344
Finished goods 817,343 783,622 716,871
1,412,935 1,256,225 1,107,726

Hong Kong Institute of CPAs
Financial Management Module (printed May 2010) 9 - 8
Ling Industrial Limited: Profit and Loss Account for the year ended 31 December 2009
2009 2008
$ $
Sales 10,259,006 10,456,640
Cost of sales
Direct materials 3,276,495 3,439,624
Direct labour 1,919,093 2,051,656
Production o/heads variable 404,258 424,150
Production o/heads fixed 1,063,775 1,131,185
6,663,621 7,046,615
Gross profit 3,595,385 3,410,025
Overhead expenses
Admin salaries 838,572 881,010
Overhead expenses 2,160,977 2,225,549
2,999,549 3,106,559
Profit before interest and tax 595,836 303,466
Interest expense 551,429 467,115
Tax 7,040 -
Net profit after tax 37,367 (163,649)
Ling Industrial Limited: Statement of Cash Flows for the year ended 31 December 2009
Note 2009 $000
inflows (outflows)
2008 $000
inflows (outflows)
Cash flows from operating activities
Receipts from customers 9,950 9,779
Payments to suppliers and employees (9,887) (9,516)
Interest paid (551) (467)
Net cash used in operating activities 2 (488) (204)
Cash flows from investing activities
Payment for property, plant and equipment (669) (803)
Net cash used in investing activities (669) (803)
Cash flows from financing activities
Proceeds from borrowings 1,000 500
Net cash provided by financing activities 1,000 500
Net increase (decrease) in cash held (157) (507)
Cash at beginning of period (2,075) (1,568)
Cash at end of period (2,232) (2,075)
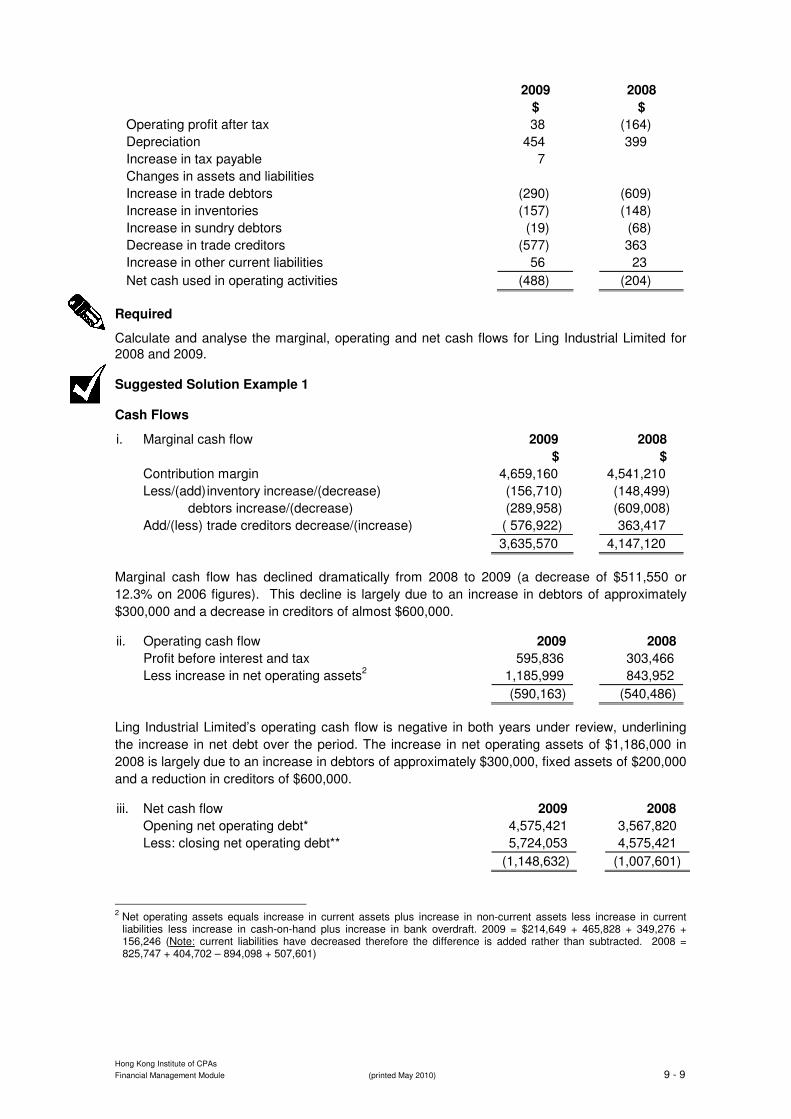
Note 2: Reconciliation of net cash used in operating activities to operating profit after tax
Hong Kong Institute of CPAs
Financial Management Module (printed May 2010) 9 - 9
2009 2008
$ $
Operating profit after tax 38 (164)
Depreciation 454 399
Increase in tax payable 7
Changes in assets and liabilities
Increase in trade debtors (290) (609)
Increase in inventories (157) (148)
Increase in sundry debtors (19) (68)
Decrease in trade creditors (577) 363
Increase in other current liabilities 56 23
Net cash used in operating activities (488) (204)
Required
Calculate and analyse the marginal, operating and net cash flows for Ling Industrial Limited for 2008 and 2009.
Suggested Solution Example 1
Cash Flows
i. Marginal cash flow 2009 2008
$ $
Contribution margin 4,659,160 4,541,210
Less/(add) inventory increase/(decrease) (156,710) (148,499)
debtors increase/(decrease) (289,958) (609,008)
Add/(less) trade creditors decrease/(increase) ( 576,922) 363,417
3,635,570 4,147,120
Marginal cash flow has declined dramatically from 2008 to 2009 (a decrease of $511,550 or
12.3% on 2006 figures). This decline is largely due to an increase in debtors of approximately
$300,000 and a decrease in creditors of almost $600,000.
ii. Operating cash flow 2009 2008
Profit before interest and tax 595,836 303,466
Less increase in net operating assets2 1,185,999 843,952
(590,163) (540,486)
Ling Industrial Limited’s operating cash flow is negative in both years under review, underlining
the increase in net debt over the period. The increase in net operating assets of $1,186,000 in
2008 is largely due to an increase in debtors of approximately $300,000, fixed assets of $200,000
and a reduction in creditors of $600,000.
iii. Net cash flow 2009 2008
Opening net operating debt* 4,575,421 3,567,820
Less: closing net operating debt** 5,724,053 4,575,421
(1,148,632) (1,007,601)
2 Net operating assets equals increase in current assets plus increase in non-current assets less increase in current
liabilities less increase in cash-on-hand plus increase in bank overdraft. 2009 = $214,649 + 465,828 + 349,276 + 156,246 (Note: current liabilities have decreased therefore the difference is added rather than subtracted. 2008 = 825,747 + 404,702 – 894,098 + 507,601)

Hong Kong Institute of CPAs
Financial Management Module (printed May 2010) 9 - 10
*Opening net debt 2009 2008
Total liabilities 5,899,269 4,505,171
less a/c payable 1,261,348 897,931
less other liabilities 62,500 39,420
net debt 4,575,421 3,567,820
**Closing net debt 2009 2008
Total liabilities 6,542,379 5,899,269
less a/c payable 684,426 1,261,348
less other liabilities 133,900 62,500
net debt 5,724,053 4,575,421
Net Cash Flow
The cash flow or change in net debt can also be calculated for 2009 as follows:
Net profit after tax for the year ended 31 December 2009 37,367
Less: Increase in net operating assets 1,185,999
Net cash outflow (1,148,632)
Net cash flow can be reconciled to operating cash flow in 2009 as follows:
Operating cash flow (590,163)
Less: interest (551,429)
Less: tax (7,040)
Net cash outflow (1,148,632)
9.7 Growth
9.7.1 Overview
Short term financial growth measures include percentage changes in: gross sales revenue, net
profit and earnings per share.
9.7.2 Percentage Change in Gross Sales Revenue
This is used to indicate growth at either the strategic level (i.e. organisation-wide) or at the
business unit (operational) level. Reasons for changes should be carefully scrutinised relying on
trends and comparisons with competitors.
9.7.3 Percentage Change in Net Profit
Net profit can also change for a number of reasons, including changes to cost structures,
changes to selling prices and external changes such as new accounting standards.
9.7.4 Percentage Change in Earnings Per Share
Brokers, analysts and other capital market participants frequently use EPS and EPS changes in
determining firm performance and growth prospects. The specific changes in EPS should be
determined because many “non-operating change type” factors influence changes in EPS such
as, non-payment of dividends, buying back ordinary shares, increasing debt level, and
acquisitions and divestitures of companies with different price-to-earnings ratios and/or different
capital structures.

Hong Kong Institute of CPAs
Financial Management Module (printed May 2010) 9 - 11
9.7.5 Sustainable Growth
Organisational growth is normally a strategic objective yet a firm must be able to fund its growth.
Future expansion requires the generation of funds sufficient to maintain the current or required
capital structure. The sustainable growth concept is used by businesses to manage the financial
performance of their organisation so that the longer-term growth requirements can be achieved.
The level of growth depends on such factors as market size, demand, and ability to deliver the
quantity of products/services necessary to achieve the desired growth rate.
Sustainable growth is measured by the relationship between retained income and opening
funding, as follows:
Retained income Sustainable growth % =
Opening equity x (1 - dividend payout ratio)
3
where dividend payout ratio is
Cash dividends Divided payout ratio =
Net profit
The sustainable growth rate highlights the level of growth capable of being funded from retained
income and existing debt. The measure helps management plan future expansion by highlighting
the fact that while growth opportunities are unlimited, the resources to fund growth are not.
Using the data from the previous example, we can calculate the sustainable growth rate for Ling
Industrial Limited for 2008 and 2009.
Sustainable growth = retained income/opening equity as follows:
2008 2009
$ $
Retained income (163,649) 37,367
Opening equity 2,518,625 2,354,976
=( 6.50%) = 1.58%
A negative ratio cannot be compared with a positive ratio value. The measure must be compared
to sales growth projections, after taking into account changes in the operating structure of the
business. Examples of changes in operating structure could be changes in the debt to equity
structure; changes in gross profit percentage; purchases or sales of fixed assets, etc.
3 When the entity pays no cash dividends for the period this calculation reduces to:
Retained income Sustainable growth % =
Opening equity

Hong Kong Institute of CPAs
Financial Management Module (printed May 2010) 9 - 12
9.8 Financial and Operating Ratios
9.8.1 Financial Ratios
i) Liquidity Ratios – Short Term
The current ratio and quick ratio are used to assess liquidity and the formulae should be familiar.
The current ratio is calculated by dividing current assets by current liabilities. The quick ratio is
calculated by dividing current assets (except for inventory) by current liabilities. As they become
larger, these ratios indicate better liquidity but it is important to analyse trends, industry
comparisons and the mix of current assets. Consider the following simple example.
2009 2008 Trend
$ $ $
Inventory 5,800,000 1,000,000
Cash 100,000 1,000,000
Bank accepted bills 100,000 1,000,000
Total current assets 6,000,000 3,000,000
Current liabilities 3,000,000 3,000,000
Current ratio 2.00 1.00 Improving
Quick ratio 0.06 0.67 Worsening
The working capital turnover ratio is calculated by dividing sales by working capital. Working
capital is defined as total current assets less total current liabilities. Year-end, beginning-of-the-
year or average-for-the-year working capital numbers can be used. This ratio provides a number
that indicates the length of the firm’s operating cycle, i.e. the time from purchase of inventory to
receipt of cash from sale of that inventory. This can also be calculated by dividing 365 (days) by
the working capital turnover ratio. Consider the following example: Chang Ltd has the following
information for the past four years:
Year 2009 2008 2007 2006
Sales ($000) 3,500 2,800 1,950 1,500
Current assets ($000) 500 490 400 320
Current liabilities ($000) 200 200 190 150
Working capital (average working capital)
11.9 (3,500/295
4)
11.2 (2,800/250)
10.3 (1,950/190)
Working capital (ending working capital)
11.7 (3,500/300)
9.7 (2,800/290)
9.3 (1,950/210)
8.8 (1,500/170)
Days working capital turned over (ending working capital ratio)
31.1 days (365/11.7)
37.6 days (365/9.7)
39.3 days (365/9.3)
41.4 days (365/8.8)
4 (Opening balance + closing balance)/2 = (290+300)/2 = 295

Hong Kong Institute of CPAs
Financial Management Module (printed May 2010) 9 - 13
The trend in these ratios is favourable, indicating that working capital is turning over more quickly
each year. The usual reason would be that sales are increasing at a faster rate than the
inventory, but other factors can increase this ratio. For instance, increases in creditors (ceteris
paribus) lower the denominator, increasing the working capital ratio and reducing the days
working capital turned over, yet this may also indicate liquidity problems for the firm (paying
creditors late).
ii) Liquidity Ratios – Long Term
The debt to total funds ratio total debt divided by total funds (total debt plus total equity). The
debt to equity ratio is calculated as total debt divided by total equity. Both ratios provide an
indication of the financial viability of an organisation, the lower the ratio, the better the financial
viability. Changes occur to the ratio when the financial structure of the entity is altered.
The long-term debt to equity ratio indicates the solvency for the long term. Future expectations
about a downturn in the economy, for example, might suggest that firms with high numbers for
this ratio will suffer solvency problems and/or incur higher interest rates.
The interest coverage ratio is calculated by dividing (net profit before income tax plus interest
expense) by interest expense. This ratio is called interest coverage because the resulting
number shows how many times the interest expense for a period is covered by the profit before
interest and tax. Higher coverage numbers are better. The number can change due to changes
in the debt structure and poor sales, increasing operating expenses, or both.
Non-current Assets to Equity:
A high level for this ratio might indicate that investment in non-current assets is too great. It
should be compared with industry averages or with a number of competitors. A lower ratio
suggests that some working capital is funded by equity, which is expected because a firm cannot
operate with non-current assets alone.
9.8.2 Operating Ratios
Net profit to net sales indicates the amount of net profit that one dollar of sales generates.
Gross profit to net sales indicates the ability of the organisation to cover other operating and
non-operating expenses. Factors affecting both these ratios include increased competition,
changes to sales revenue due to quantity and/or price changes.
9.8.3 Financial and Operating Ratio Relationships
Sales to accounts receivable is also called the debtors or accounts receivable turnover ratio
because it indicates the number of times that the amount of money equal to current debtors has
been received during the period. Low ratios can be due to inadequate credit collection policies
and procedures, bad debt write-offs, or credit terms for poor-paying customers. It is also possible
to calculate the average number of days that debtors have been outstanding by dividing 365
(days) by the accounts receivable turnover ratio. The ratios should be compared with prior
periods and industry averages. Industry averages are important because the nature of the
business will affect this ratio.

Hong Kong Institute of CPAs
Financial Management Module (printed May 2010) 9 - 14
9.8.4 Stock (Inventory) Ratios
The stock turnover ratio is calculated as cost of goods sold divided by average stock. The ratio
should be as high as possible. Possible reasons for changes include having too much or too little
stock in anticipation of a price rise or fall respectively.
The cost of sales to sales ratio indicates the number of dollars of cost of goods sold to each
dollar of sales revenue for the period. The lower the ratio the better. It can also be expressed as
days inventory held by dividing 365 days by the stock turnover ratio. A lowering trend is desirable.
Increasing days inventory held numbers usually indicates stock is becoming obsolete and is
becoming more difficult to sell. Take the following example.
XZY Ltd has the following information for the past six years:
2009 2008 2007 2006 2005 2004
Sales ($000’s) 7,800 7,900 8,000 5,000 2,500 1,000
Cost of sales ($000’s) 3,900 5,100 5,000 3,200 1,700 600
Average stock ($000’s) 1,600 2,100 2,000 1,200 600 150
Stock turnover (times)
Days Inventory held
2.4 (3,900/
1,600)
1525
2.4 (5,100/
2,100)
152
2.5 (5,000/
2,000)
146
2.7 (3,200/
1,200)
135
2.8 (1,700/
600)
130
4.0 (600/
150)
91
Both the declining turnover ratio and the days’ inventory held indicate that inventory is moving
more slowly. Further investigation would be needed to identify the specific cause. Additionally,
there may be other inter-related effects of lower inventory turnover. For example, there may be an
adverse effect on profitability.
5 = 365/2.4
To calculate the percentages in the table above we divide each number by the total sales for the company. E.g. the
gross profit percentage for Company C is: $200,000 / $800,000 x 100 = 25%.

Hong Kong Institute of CPAs
Financial Management Module (printed May 2010) 9 - 15
9.8.5 Trends
Analysing ratios over time can give valuable insights into a firm’s performance. Common size
analysis can be used to compare or benchmark financial performance against other firms within
the same industry; and to get a different picture about trends for one firm. Using this approach
each line item in the Profit and Loss Account (or Balance Sheet) is expressed as a percentage of
sales (or total assets).
Consider the following Profit and Loss Accounts and common size Profit and Loss Accounts for
three firms in the electronics industry6.
Company A Company B Company C
$(000’s) % $(000’s) % $(000’s) %
Sales 900.0 100.0% 600.0 100.00% 800.0 100.0%
Cost of sales 579.6 64.4% 319.8 53.3% 600.0 75.0%
Gross profit 320.4 35.6% 280.2 46.7% 200.0 25.0%
R & D 53.1 5.9% 48.0 8.0% 15.2 1.9%
Sales & admin. 162.0 18.0% 114.0 19.0% 79.2 9.9%
Other expenses 1.8 0.2% 9.6 1.6% 7.2 0.9%
Total expenses 216.9 24.1% 171.6 28.6% 101.6 12.7%
Profit before tax 103.5 11.5% 108.6 18.1% 98.4 12.3%
Income tax 16.5 1.8% 17.4 2.9% 15.7 2.0%
Net profit 87.0 9.7% 91.2 15.2% 82.7 10.3%
Company B has the highest gross and net profit percentages of the three companies indicating
better profitability. To see if these percentages are due to better efficiency, better strategy, some
other reason or a combination of these, further investigation is necessary. To establish a starting
point to answer these questions more fully, we could review the notes in the published financial
reports. Often, such reports can be obtained from the Internet in spreadsheet format so that
analyses can be carried out easily.
6 To calculate the percentages in the table we divide each number by the total sales for the company. E.g. the gross
profit percentage for Company C is: $200,000 / $800,000 x 100 = 25%.

Hong Kong Institute of CPAs
Financial Management Module (printed May 2010) 9 - 16
Common size analysis can also be used for within-company comparisons as shown in the table
below:
Zhou Company Inc
2007 2008 2009
Amount ($000’s)
% Amount ($000’s)
% Amount ($000’s)
%
Cash 45 0.88%7 115 1.94% 310 4.08%
Debtors 1,515 29.65% 1,700 28.66% 2,315 30.49%
Stock 1,655 32.38% 1,819 30.67% 2,267 29.85%
Other 145 2.84% 138 2.33% 141 1.86%
Total current assets 3,360 65.75% 3,772 63.60% 5,033 66.28%
Plant and equipment 1,600 31.31% 2,000 33.72% 2,400 31.60%
Other 150 2.94% 159 2.68% 161 2.12%
Total non-current assets 1,750 34.25% 2,159 36.40% 2,561 33.72%
Total assets 5,110 100.00% 5,931 100.00% 7,594 100.00%
Creditors 750 14.68% 1,265 21.33% 1,505 19.82%
Short-term loan 500 9.79% 420 7.08% 420 5.53%
Other 200 3.91% 210 3.54% 215 2.83%
Total current liabilities 1,450 28.38% 1,895 31.95% 2,140 28.18%
Long-term loan 1,000 19.57% 1,100 18.55% 1,300 17.12%
Total non-current liabilities 1,000 19.57% 1,100 18.55% 1,300 17.12%
Paid up capital 2,360 46.18% 2,560 43.16% 3,693 48.63%
Retained profits 300 5.87% 376 6.34% 461 6.07%
Total equity 2,660 52.05% 2,936 49.50% 4,154 54.70%
Total liabilities & equity 5,110 100.00% 5,931 100.00% 7,594 100.00%
The best way to start this analysis is to look at the trends in the subtotals and the totals. For
example, we see that non-current assets percentages have decreased from 2008 to 2009 and we
see that current assets percentages have increased. We would then look to the individual
accounts to determine the main reasons for this pattern. Cash has increased over the three-year
period, and debtors fell for the first year and then increased. A decline in accounts receivable
may be good news unless it has been caused by writing off bad debts or a decline in current-
period sales or some combination of these.
Stock also decreased slightly relative to total assets - good news as stock earns no return sitting
in a warehouse, yet some stock levels need to be maintained in order to satisfy customer
demand (unless the firm uses a JIT system and are very confident that our suppliers can deliver -
but this is not always the case, especially in Hong Kong). Other current assets have remained
relatively stable over the three-year period, while investment in non-current assets has decreased
relative to total assets from 2008 to 2009. This may be due to accounting or to real economic
reasons or both. Further investigation is required.
7 To calculate the common size balance sheet numbers we just divide each number by total assets. So, for example,
the percentage for plant and equipment for 2008 is 33.72% (2,000/5,931 × 100 = 33.72%).

Hong Kong Institute of CPAs
Financial Management Module (printed May 2010) 9 - 17
The mix of how the assets are funded can be seen in the total liabilities and equity section. Total
debt (short and long-term debt) has fallen as a percentage of total assets, with some of this being
taken up by paid up capital. This means less of a future cash burden on the company because
paid up capital represents funding which does not attract a requirement to pay a regular cash
payment. This is because dividends are paid at the discretion of the directors. Debt, on the other
hand means the company must pay interest (and principal) each period regardless of how the
company is performing. Zhou Company also seems to be making much better use of its
accounts payable funding. Accounts payable is (usually), interest free so the longer the payment
can be deferred the better. However, relationships with suppliers are very important and they
must be nurtured and maintained at a good level so the company can carry out its operations and
satisfy its own customers. A balance needs to be achieved.
Index Analysis
We can also perform an index analysis when looking at trends. Index analysis expresses the
amounts of a particular profit and loss or balance sheet item as a percentage of the amounts of
that same item in the base year. The base year is selected by the analyst as the starting point for
the trend analysis. With index analysis we see how an item has changed over time relative to
itself. For example it may be seen from the index analysis below, that the cash balance in 2009
is 6.89 times the balance of cash in 2007 i.e. 310 / 45.
Index Analysis
2007 2008 2009
Amount (HK$000)
Index Amount (HK$000)
Index Amount (HK$000)
Index
Cash 45 1.00 115 2.56 310 6.89
Debtors 1,515 1.00 1,700 1.12 2,315 1.53
Stock 1,655 1.00 1,819 1.10 2,267 1.37
Other 145 1.00 138 0.95 141 0.97
Total current assets 3,360 1.00 3,772 1.12 5,033 1.50
Plant & equipment 1,600 1.00 2,000 1.25 2,400 1.50
Other 150 1.00 159 1.06 161 1.07
Total non-current assets 1,750 1.00 2,159 1.23 2,561 1.46
Total assets 5,110 1.00 5,931 1.16 7,594 1.49
Creditors 750 1.00 1,265 1.69 1,505 2.01
Short-term loan 500 1.00 420 0.84 420 0.84
Other 200 1.00 210 1.05 215 1.08
Total current liabilities 1,450 1.00 1,895 1.31 2,140 1.48
Long-term loan 1,000 1.00 1,100 1.10 1,300 1.30
Total non-current liabilities 1,000 1.00 1,100 1.10 1,300 1.30
Paid up capital 2,360 1.00 2,560 1.08 3,693 1.56
Retained profits 300 1.00 376 1.25 461 1.54
Total equity 2,660 1.00 2,936 1.10 4,154 1.56
Total liabilities & equity 5,110 1.00 5931 1.16 7,594 1.49

Hong Kong Institute of CPAs
Financial Management Module (printed May 2010) 9 - 18
While the cash balance has increased significantly relative to itself over the three-year period, its
amount is not material when compared with total current assets. Of more interest are the index
changes for debtors and for stock. Based on the common size analysis percentages in the
previous table, the trends in these accounts did not appear to stand out (both remained at around
30% of total assets). The 2009 balance for debtors is about 1.5 times the balance in 2007 and
for stock it is about 1.4 times. Further analysis of debtors could include inspection of an aged trial
balance (if possible), to determine if the build up is due to an increase in cash collection times or
changes in credit sales over the period. The stock change is consistent with sales growth
explaining the change because stock would be expected to increase if sales and accounts
receivable are also increasing, yet other factors need to be considered. The increase in plant and
equipment seems to have been funded mainly from the increase in retained profits and paid up
capital (total equity).
Common size and index analysis complement one another yet the presentation of the information
in different ways makes certain relationships easier to see.
9.9 Non-financial Measures
9.9.1 Common Non-financial Measures
It is now commonly recognised that a balanced scorecard (BSC) should be used to measure
performance. The BSC requires the use of both financial and non-financial measures. Common
non-financial measures include:
• customer satisfaction;
• percentage of on-time deliveries;
• delivery response time;
• internal efficiency;
• cycle time;
• good output per employee;
• sales per employee;
• creativity;
• time for product to reach market from initial idea;
• time between new product and a competitor’s new product; and
• percentage of new products reaching the market before competitors’ products.

Hong Kong Institute of CPAs
Financial Management Module (printed May 2010) 9 - 19
Organisation’s Vision and Strategy
Learning and Growth Perspective
Employee Training Employee Satisfaction Strategic Investment Decisions
Internal Business Perspective
Production Flexibility % of Sales for New Products Product Quality After Sales Service
Financial Perspective
Return on Investment Operating Income Return on Equity Cash flow
Customer Perspective
Customer Satisfaction Surveys
Customer Retention Market Share New Customer Acquisition
9.10 The Balanced Scorecard
9.10.1 Description
“The BSC provides an organisation with a comprehensive framework that translates the
organisation's vision and strategy into a coherent set of performance measures” (Kaplan and
Norton, 1996a, p.24). Kaplan and Norton (1992) brought the BSC into prominence and it has
evolved from a performance measurement system to a core management system that is now
widely used across many sectors, including service, government, not for profit and for profit. The
performance measures in the BSC are organised under four perspectives: financial, customer,
internal business processes and learning and growth. Each perspective has a short term goal
with one or more critical success factors identified with that goal. The general BSC model is
illustrated in Figure One.
Figure 1: The Balanced Scorecard (Examples of Measures) Adapted from Kaplan and Norton (1992).
9.10.2 Benefits of the Balanced Scorecard
The balanced scorecard approach can lead to consensus on organisational priorities, clear
specification of goals, rigorous planning and improvement processes, alignment of strategic goals
with shorter term actions, clearer communication, team working and knowledge sharing and
clearer accountability for results.
Hong Kong Institute of CPAs
Financial Management Module (printed May 2010) 9 - 20
9.10.3 Potential Problems
Although the method may assist in highlighting organisational issues, it cannot always resolve
them easily. For example, some measures in the scorecard will conflict and difficult choices must
be made to resolve these issues (e.g. R & D investment versus short term profitability);
organisational culture may over-emphasise some measures and ignore others (e.g. an
organisation with a strong sales culture may ignore underlying profitability). Top management
commitment to the balanced scorecard approach is necessary for it to succeed. The BSC leads
to a better basis for managers’ performance bonuses. However, all performance measures are
open to manipulation by managers.
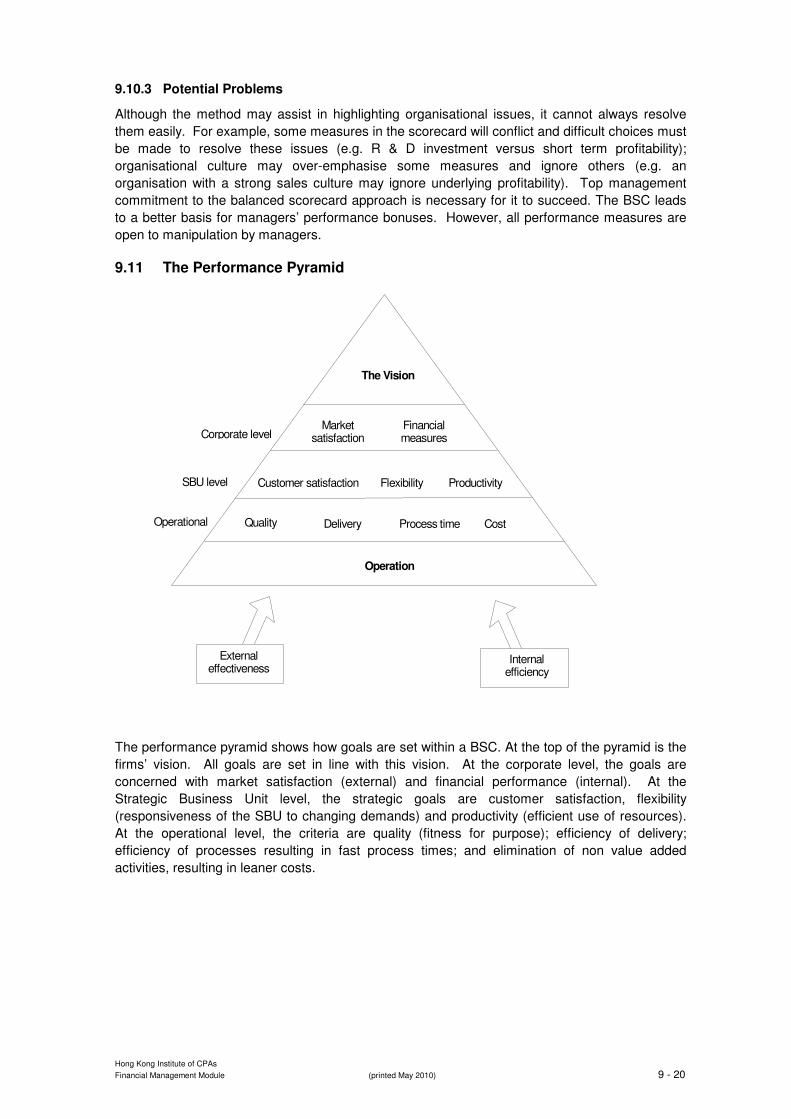
9.11 The Performance Pyramid
The performance pyramid shows how goals are set within a BSC. At the top of the pyramid is the
firms’ vision. All goals are set in line with this vision. At the corporate level, the goals are
concerned with market satisfaction (external) and financial performance (internal). At the
Strategic Business Unit level, the strategic goals are customer satisfaction, flexibility
(responsiveness of the SBU to changing demands) and productivity (efficient use of resources).
At the operational level, the criteria are quality (fitness for purpose); efficiency of delivery;
efficiency of processes resulting in fast process times; and elimination of non value added
activities, resulting in leaner costs.
Market satisfaction
Financial measures
Customer satisfaction Flexibility Productivity
Quality Delivery Process time Cost
The Vision
Operation
External effectiveness
Internal efficiency
Corporate level
SBU level
Operational

Hong Kong Institute of CPAs
Financial Management Module (printed May 2010) 9 - 21
9.12 Reporting and Evaluating Sustainability
Many firms are recognising the benefits of operating in a sustainable manner. These benefits
include; keeping the environment clean, treating people with respect and operating profitably.
Firms that implement a BSC can extend this to monitor and measure their sustainability efforts
and link corporate sustainability objectives with appropriate corporate actions and performance
outcomes. When appropriate strategic measures are included in a firm’s BSC, sustainability can
be improved. For example toxic emissions are a lag measure of a firm’s process efficiency and
also a lead indicator of future environmental costs.
When choosing sustainability measures consideration should be given to ensuring the measures
are:
• quantifiable, either in absolute or percentage terms
• complete, in that the measure sums up in one number multiple measures of
performance e.g. profit is a summary measure of revenue generation and cost
control.
• Controllable, in that employees can influence improvement
Some firms choose to integrate sustainability measures into the existing perspective of the BSC.
Sustainability is typically included in the Internal business process perspective, however research
shows that sustainability measures can be incorporated into any of the four perspectives of the
BSC. Incorporation into an existing BSC can help to show the interrelationships between the
measures and other areas of the firm to fulfil corporate strategy. Other firms add a fifth
perspective to the BSC. By including social and environmental performance indicators that link
the other four perspectives the importance of social and environmental responsibilities is
highlighted as a corporate objective.
Benefits of firms including sustainability measures into a BSC include:
• Increased employee satisfaction
• Lower operational and administrative costs
• Improved productivity
• Enhanced image and reputation
• Increased market opportunities
• Improved shareholder relationships
• Share market premiums

Hong Kong Institute of CPAs
Financial Management Module (printed May 2010) 9 - 22
9.13 Agency Theory and Managerial Incentive Schemes
An agency relationship exists whenever one party (the principal) hires another party (the agent) to
perform some service, and this service requires the principal to delegate some decision making
authority to the agent. Two types of principal-agent relationships arise in connection with
managerial incentive schemes. First, the organization’s owners or shareholders, acting as the
principal (usually through the board of directors), hire the chief executive group to be their agents
in managing the firm in their best interests. In the second principal - agent relationship, the firm’s
chief executive group acts as the principal and hires division managers as agents to manage sub-
units of the organization.
Agency theory assumes that all individuals - principals and agents - care not only about financial
compensation but also about such properties as attractive working conditions and flexibility in
hours worked. Managers are assumed to prefer leisure to hard or routine work, although for
some top management an aversion to work may not be a realistic assumption. Nevertheless, the
argument goes that agents require incentives to minimize the net costs of the divergence of
interests between them and the principal. Among other things, the agency model argues that if
top executives of the company are compensated only by straight salary, they may not be
motivated to take actions that increase the value of the firm to the shareholders. They may over-
consume in such areas as leisure, attractive working conditions, and company perquisites, or will
not spend enough time and effort to increase shareholder wealth.
If the firm’s owners knew what actions were optimal for the firm and could observe without cost
the actions of the top managers, they could direct the managers to implement these optimal
actions, with the threat of withholding compensation or dismissal if these actions were not carried
out. However, a dispersed group of owners will probably have inadequate information and will
find monitoring costly. Accordingly, the owners are unlikely either to know what the optimal
actions should be or to be able to direct and monitor the actions of the top executives. Therefore,
to encourage managers to take actions that are in the firm’s best interests, the owners may
introduce incentive compensation plans that enable the managers to share in the firm’s increased
wealth. These schemes can take a variety of forms, including merit raises, bonuses based on
reported performance, and various types of share ownership plans.
Executive incentive compensation bonus plans are designed to create a commonality of interest
between the owners (principal) and the executives (agents). However, some divergence of
interest will always exist between the principal and the agents. This is due to differences in risk
attitudes, the existence of private information (managers always know more about the firm than
shareholders), and limited or costly observability. The principal will usually attempt to limit this
divergence by establishing appropriate incentives for the agents, and by incurring monitoring
costs designed to limit actions that increase the agents’ welfare at the expense of the principal.
Annual audited financial statements are an excellent example of costly monitoring of managerial
behaviour.

Hong Kong Institute of CPAs
Financial Management Module (printed May 2010) 9 - 23
Part D
Practice Question 1 [30 Marks]
Financial information for Chang Inc is provided below for 2009 and 2010:
Chang Inc Corporation
Income Statement and Statement of Retained Earnings
For the Year Ended June 30, 2010
(in thousands)
Revenue:
Net sales $480,000
Other 36,000
Total revenue 516,000
Expenses:
Cost of goods sold 324,000
Selling and administrative 93,000
Depreciation 15,000
Interest 12,000
Total expenses 444,000
Income before income taxes 72,000
Income taxes (assumed 15%) 10,800
Net income 61,200
Less: Dividends 15,300
Net income added to retained earnings 45,900
Retained earnings, 1/7/2008 68,400
Retained earnings, 30/06/2009 $114,300

Hong Kong Institute of CPAs
Financial Management Module (printed May 2010) 9 - 24
Chang Inc
Comparative Balance Sheets June 30, 2010 and 2009 ($ thousands)
Assets 2010 2009
Current assets:
Cash and marketable securities $28,700 $12,600
Net Receivables $28,800 $30,000
Inventories $39,000 $37,200
Other current assets $3,000 $1,800
Total current assets $99,500 $81,600
Investments $79,600 $68,400
Property, plant, and equipment:
Land $7,200 $7,200
Buildings and equipment $160,800 $148,800
Total property, plant, and equipment. $168,000 $156,000
Total assets $347,100 $306,000
Liabilities and Shareholders' Equity 2010 2009
Current liabilities:
Bank Overdraft $13,200 $14,400
Accounts payable $43,200 $42,600
Salaries payable $15,600 $16,200
Total current liabilities $72,000 $73,200
Long-term debt. $96,000 $102,600
Total liabilities $168,000 $175,800
Shareholders' equity:
Share capital $64,800 $61,800
Retained earnings $114,300 $68,400
Total shareholders' equity $179,100 $130,200
Total liabilities and shareholders' equity $347,100 $306,000
The following industry ratios apply:
1. Net profit as a percentage of sales 10% 2. Return on assets 15% 3. Return on equity 22% 4. Current ratio 1.7 5. Quick ratio .75 6. Debt-equity ratio 1.35 7. Interest coverage 6.75 8. Dividend payout ratio 35%
Required
a) Calculate the ratios listed below for Chang Inc for 2010:
1. Net profit as a percentage of sales.
2. Return on assets.
3. Return on equity.
4. Current ratio.
5. Quick ratio.
6. Debt-equity ratio.
7. Interest coverage.
8. Dividend payout ratio.
b) Analyse Chang Inc’s performance using two years of data where appropriate and the industry ratios provided.

Hong Kong Institute of CPAs
Financial Management Module (printed May 2010) 9 - 25
Suggested Solution
Practice Question 1 [30 Marks]
Timing (minutes) Part a) 30 minutes
b) 15 minutes
Total time spent on this question 45 minutes
a) The financial ratios are calculated as follows:
net profit 1. Net profit as a percentage of sales =
net sales
$61,200 =
$480,000 = 12.75%
net income before interest (net of taxes) 2. Return on assets =
average total assets
$61,200 + ($12,000 x .85) =
(347,100 + $306,000)/2 = 22% (rounded)
Operating Profit 3. Return on equity =
Equity
$61,200 =
($179,100 + $130,200)/2 = 40% rounded
current assets 4. (i) Current ratio (2010) =
current liabilities
$99,500 =
$72,000 = 1.38
current assets 4. (ii) Current ratio (2009) =
current liabilities
$81,600 =
$73,200 = 1.11

Hong Kong Institute of CPAs
Financial Management Module (printed May 2010) 9 - 26
quick assets 5. (i) Quick ratio (2010) =
current liabilities
= $28,700 + $28,800
72,000
= 0.80 (rounded)
quick assets 5. (ii) Quick ratio (2009) =
current liabilities = $12,600 + $30,000
73,200
= 0.58 (rounded)
total liabilities* 6. (i) Debt/equity ratio 2010 =
total shareholders equity
$168,000 =
$179,100
= 0.94
total liabilities* 6. (ii) Debt/equity ratio 2009 =
total shareholders equity
$175,800 =
$130,200
= 1.35
operating income 7. Interest coverage =
interest expense
($72,000 + $12,000)* =
$12,000
= 7 times
*Income before taxes + Interest expense
cash dividends
8. Dividend payout ratio = net profit
= 15,300/61,200
= 25%
* Some literature uses total interest-bearing debt for these ratios. In that case, both
accounts payable and salaries payable would be excluded.
Hong Kong Institute of CPAs
Financial Management Module (printed May 2010) 9 - 27
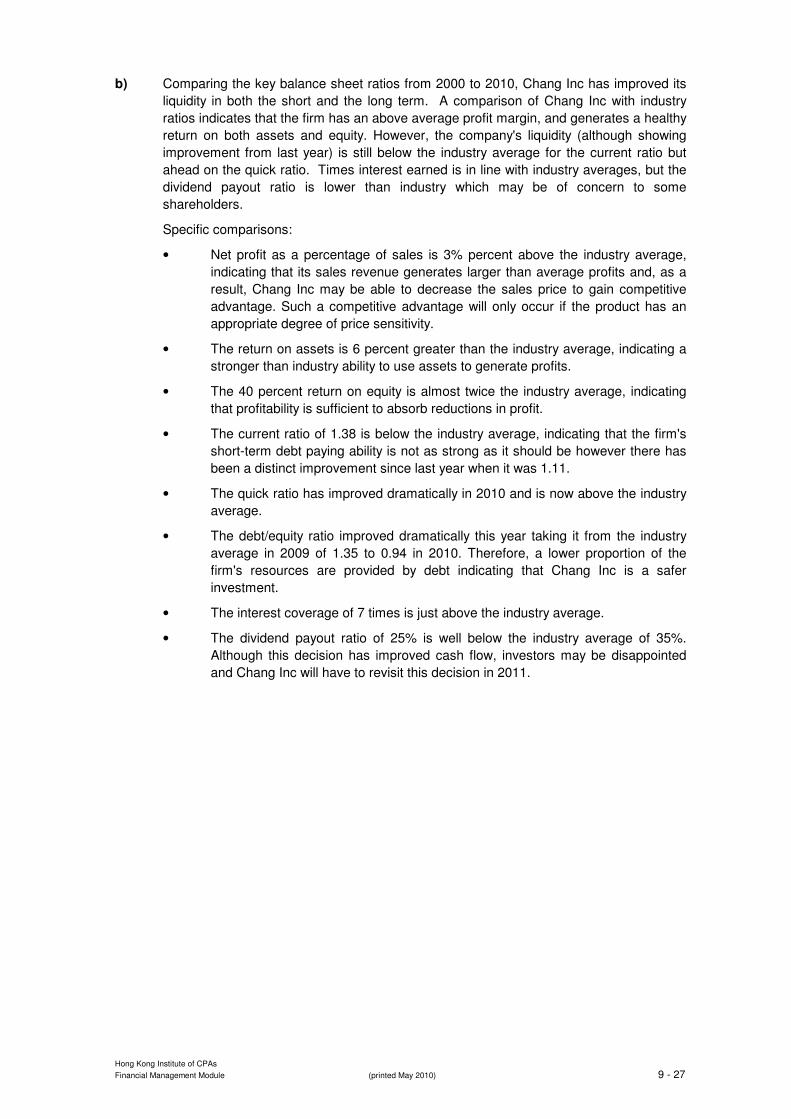
b) Comparing the key balance sheet ratios from 2000 to 2010, Chang Inc has improved its
liquidity in both the short and the long term. A comparison of Chang Inc with industry
ratios indicates that the firm has an above average profit margin, and generates a healthy
return on both assets and equity. However, the company's liquidity (although showing
improvement from last year) is still below the industry average for the current ratio but
ahead on the quick ratio. Times interest earned is in line with industry averages, but the
dividend payout ratio is lower than industry which may be of concern to some
shareholders.
Specific comparisons:
• Net profit as a percentage of sales is 3% percent above the industry average,
indicating that its sales revenue generates larger than average profits and, as a
result, Chang Inc may be able to decrease the sales price to gain competitive
advantage. Such a competitive advantage will only occur if the product has an
appropriate degree of price sensitivity.
• The return on assets is 6 percent greater than the industry average, indicating a
stronger than industry ability to use assets to generate profits.
• The 40 percent return on equity is almost twice the industry average, indicating
that profitability is sufficient to absorb reductions in profit.
• The current ratio of 1.38 is below the industry average, indicating that the firm's
short-term debt paying ability is not as strong as it should be however there has
been a distinct improvement since last year when it was 1.11.
• The quick ratio has improved dramatically in 2010 and is now above the industry
average.
• The debt/equity ratio improved dramatically this year taking it from the industry
average in 2009 of 1.35 to 0.94 in 2010. Therefore, a lower proportion of the
firm's resources are provided by debt indicating that Chang Inc is a safer
investment.
• The interest coverage of 7 times is just above the industry average.
• The dividend payout ratio of 25% is well below the industry average of 35%.
Although this decision has improved cash flow, investors may be disappointed
and Chang Inc will have to revisit this decision in 2011.

Hong Kong Institute of CPAs
Financial Management Module (printed May 2010) 9 - 28
Practice Question 2 [20 Marks]
Condensed financial data of Wong Manufacturing appear below:
WONG MANUFACTURING
Comparative Balance Sheets 30 June
2010 2009 (000s) (000s)
Cash $144,000 $70,000
Accounts receivable $170,000 $106,000
Inventories $240,000 $264,000
Prepaid expenses $38,000 $50,000
Investments $180,000 $150,000
Plant assets $620,000 $500,000
Accumulated depreciation ($130,000) ($120,000)
Total $1,262,000 $1,020,000
Liabilities and Shareholders' Equity
Accounts payable $186,000 $150,000
Accrued expenses payable $58,000 $48,000
Notes payable $260,000 $320,000
Ordinary shares $490,000 $340,000
Retained earnings $268,000 $162,000
Total $1,262,000 $1,020,000
WONG MANUFACTURING
Income Statement
for the year ended 30 June 2010 ($ 000s)
Sales $960,000
Less:
Cost of goods sold $580,000
Operating expenses (excluding depreciation) $120,000
Depreciation expense $34,000
Income taxes $30,000
Interest expense $36,000
Loss on sale of plant assets $6,000 806,000
Net income $154,000
Additional information:
1. New plant assets costing $170,000,000 were purchased for cash in 2010.
2. Old plant assets costing $50,000,000 were sold for $20,000,000 cash when book value
was $26,000,000.
3. Notes with a face value of $60,000,000 were converted into $60,000,000 of ordinary
shares.
4. A cash dividend of $48,000,000 was declared and paid during the year.
5. Accounts payable pertain to merchandise purchases.
Required
a) Prepare a cash flow statement for the year ended 30 June 2010.
b) Reconcile operating profit to net cash from operating activities.
Hong Kong Institute of CPAs
Financial Management Module (printed May 2010) 9 - 29
Suggested Solution
Practice Question 2 [20 Marks]
Timing (minutes) Part a) 20 minutes
b) 10 minutes
Total time spent on this question 30 minutes
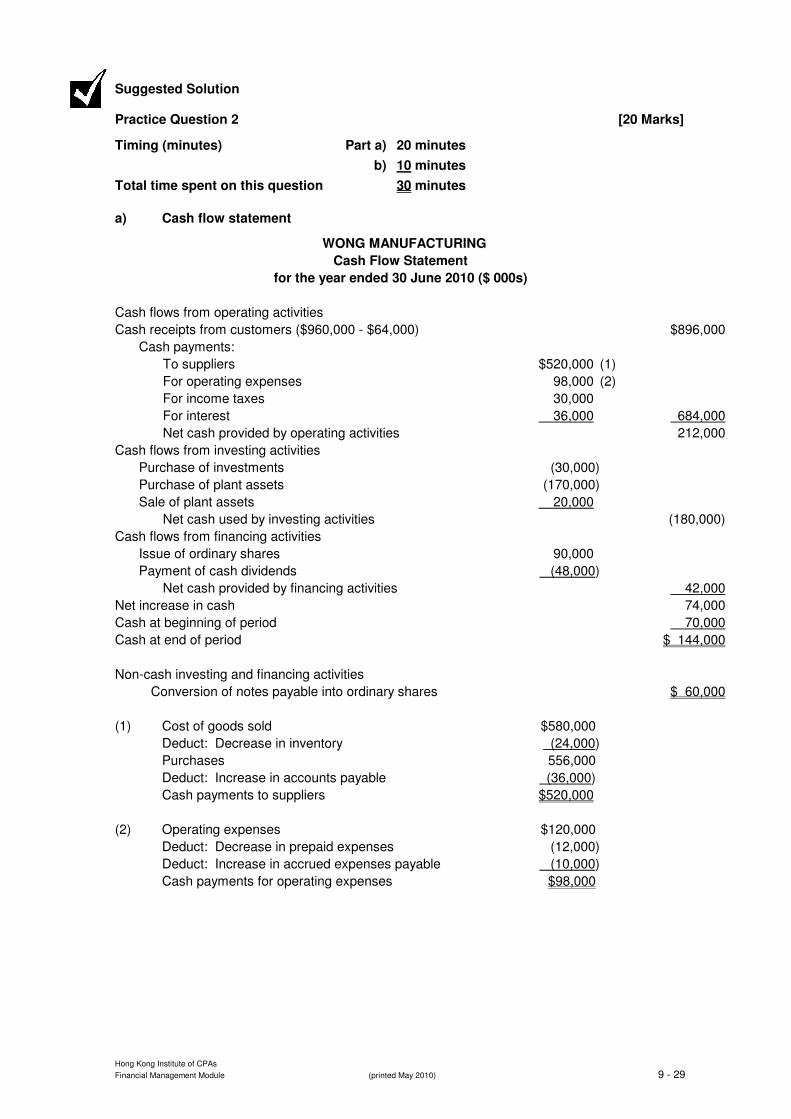
a) Cash flow statement
WONG MANUFACTURING
Cash Flow Statement
for the year ended 30 June 2010 ($ 000s)
Cash flows from operating activities
Cash receipts from customers ($960,000 - $64,000) $896,000
Cash payments:
To suppliers $520,000 (1)
For operating expenses 98,000 (2)
For income taxes 30,000
For interest 36,000 684,000
Net cash provided by operating activities 212,000
Cash flows from investing activities
Purchase of investments (30,000)
Purchase of plant assets (170,000)
Sale of plant assets 20,000
Net cash used by investing activities (180,000)
Cash flows from financing activities
Issue of ordinary shares 90,000
Payment of cash dividends (48,000)
Net cash provided by financing activities 42,000
Net increase in cash 74,000
Cash at beginning of period 70,000
Cash at end of period $ 144,000
Non-cash investing and financing activities
Conversion of notes payable into ordinary shares $ 60,000
(1) Cost of goods sold $580,000
Deduct: Decrease in inventory (24,000)
Purchases 556,000
Deduct: Increase in accounts payable (36,000)
Cash payments to suppliers $520,000
(2) Operating expenses $120,000
Deduct: Decrease in prepaid expenses (12,000)
Deduct: Increase in accrued expenses payable (10,000)
Cash payments for operating expenses $98,000

Hong Kong Institute of CPAs
Financial Management Module (printed May 2010) 9 - 30
b) Reconciliation of net profit after tax with cash flows from operating activities
NOPAT $154,000
Non-cash items:
Depreciation $34,000
Loss on sale $6,000
Deferrals & Accruals:
Increase in accounts receivable (64,000)
Decrease in Inventory 24,000
Decrease in Prepaid expenses 12,000
Increase in Accounts Payable 36,000
Increase in Accrued expenses 10,000
Net cash from operating activities 212,000
Practice Question 3 [15 Marks]
The Balanced Scorecard (BSC) encourages firms to develop performance measures along four
perspectives. These are introduced above and are also discussed in detail in the readings.
Required:
a) Give a brief description of the four components of the balance scorecard.
b) Below is a list of performance measures for Ling Electronics Ltd. Produce a balanced
scorecard by placing these measures in the appropriate perspectives.
• Employee effectiveness
• Delivery time
• Number of new products
• Number of repairs under warranty
• Sales $
• Profit
• Throughput
• Return on Investment
• Sales to new customers
• Manufacturing cycle time
• Employee empowerment
• Customer satisfaction
• EVA™
• Employee turnover
• Number of new patents
• Customer retention
• Cost of scrap
• Lost sales
• Employee efficiency.

Hong Kong Institute of CPAs
Financial Management Module (printed May 2010) 9 - 31
Suggested Solution
Practice Question 3 [15 Marks]
Timing (minutes) Part a) 7 minutes
b) 13 minutes
Total time spent on this question 20 minutes
a) The four components of the BSC include financial, customer, internal business process
and learning and growth. The financial perspective guides the firm on value creation for
stakeholders. The customer perspective ensures that the company understands how its
customers view the firm. In the internal business process perspective, the firm focuses
on improving efficiency across all aspects of the firms’ value chain. Finally the learning
and growth perspective focuses on three aspects: the efficiency and effectiveness of
employees; increasing information systems capabilities and product innovation.
b) Balanced Scorecard for Ling Electronics Limited.
Perspective Measures
Financial Sales $
Profit
Return on Investment
EVA™
Customer Lost sales
Sales to new customers
Customer retention
Customer satisfaction
Delivery time*
Number of repairs under warranty
Internal Business Process Throughput
Manufacturing cycle time
Cost of scrap
Learning and Growth Employee efficiency
Employee turnover
Employee empowerment
Employee effectiveness
Number of new patents
Number of new products
* Delivery time might also be classified as an Internal Business Process

Hong Kong Institute of CPAs
Financial Management Module (printed May 2010) 9 - 32
Part E
How do I know I have succeeded in this topic?
Can I:
Aft
er
wo
rkin
g th
rou
gh
th
is
Sectio
n
Aft
er
my W
ork
sh
op
Aft
er
talk
ing
to
my
Wo
rksh
op
Facili
tato
r
Aft
er
my e
xam
inatio
n
pre
para
tio
n
Sh
ou
ld I
do
mo
re r
esearc
h
Calculate financial, strategic and operational performance measures and understand the relationships between them.
Describe the role of cash flow analysis in the evaluation of the organisation’s strategic and operational plan.
Describe the interrelationships between shareholder wealth creation and performance measures aligned to that objective, including agency theory and its relationship to managerial incentive schemes.
Identify financial and non-financial measures of business profitability including cash flow measures.
Describe measures of entity growth.
List the main steps in translating strategies and plans into goals, recognising their interrelationships.
List the limitations of benchmarking in facilitating organisational change.
Describe the relationships between financial and operating ratios and be able to interpret trends over time and across time.
Explain the key components of the balanced scorecard.