Embed Size (px)
Citation preview

OPERATIONAL CONSIDERATIONS FOR CO DIGESTION OPERATIONAL CONSIDERATIONS FOR CO DIGESTION CO-DIGESTION
California Water Environment Association
CO-DIGESTION
California Water Environment AssociationCalifornia Water Environment AssociationSARBS Seminar on Math, Operations and Maintenance for Biosolids Systems
California Water Environment AssociationSARBS Seminar on Math, Operations and Maintenance for Biosolids SystemsMaintenance for Biosolids SystemsSeptember 2011Maintenance for Biosolids SystemsSeptember 2011
F d S hi P EF d S hi P EFred Soroushian, P.E.CH2M HILL Fred Soroushian, P.E.CH2M HILL

PRESENTATION OVERVIEWPRESENTATION OVERVIEWPRESENTATION OVERVIEWPRESENTATION OVERVIEW
Co-digestion overview
C di i f d kCo-digestion feedstock
Bench scale testing
Co-digestion implementation and business model
CWEA 2011

CO DIGESTION OVERVIEWCO DIGESTION OVERVIEWCO-DIGESTION OVERVIEWCO-DIGESTION OVERVIEW
CWEA 2011
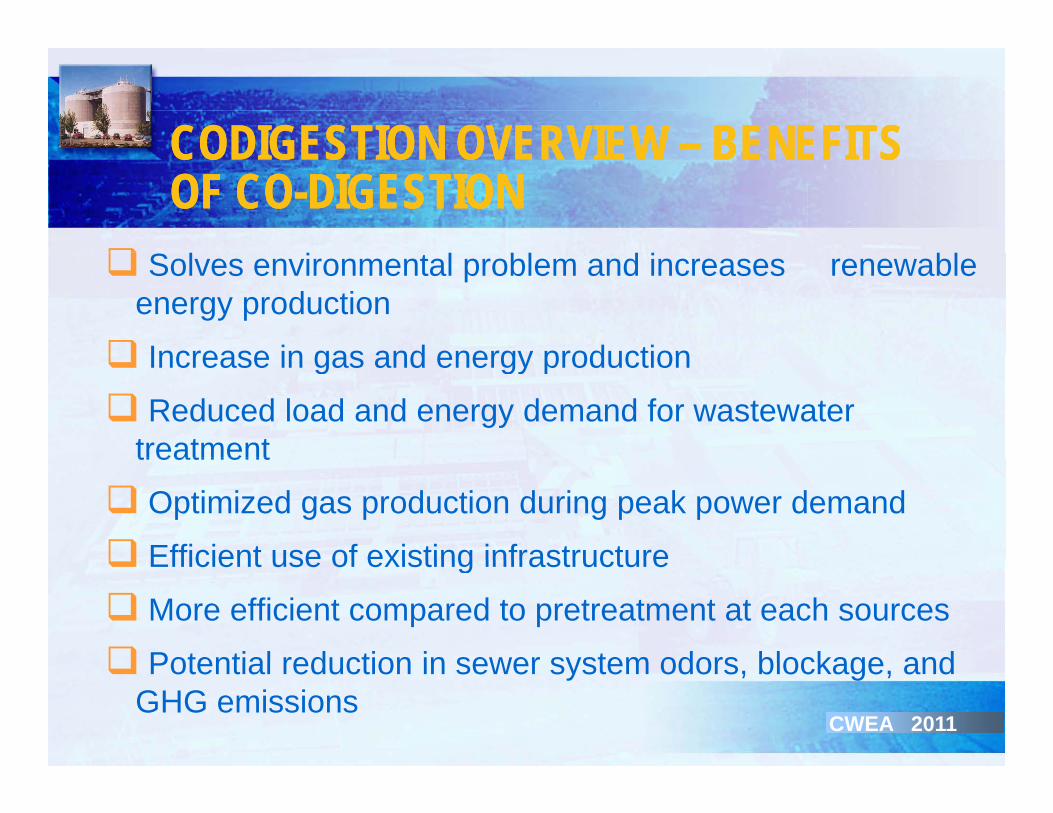
CODIGESTION OVERVIEW – BENEFITS CODIGESTION OVERVIEW – BENEFITS CODIGESTION OVERVIEW BENEFITS OF CO-DIGESTIONCODIGESTION OVERVIEW BENEFITS OF CO-DIGESTION
S l i l bl d i bl Solves environmental problem and increases renewable energy production
Increase in gas and energy production Increase in gas and energy production
Reduced load and energy demand for wastewater treatmenttreatment
Optimized gas production during peak power demand
Efficient use of existing infrastructure Efficient use of existing infrastructure
More efficient compared to pretreatment at each sources
Potential reduction in sewer system odors blockage and Potential reduction in sewer system odors, blockage, and GHG emissions
CWEA 2011
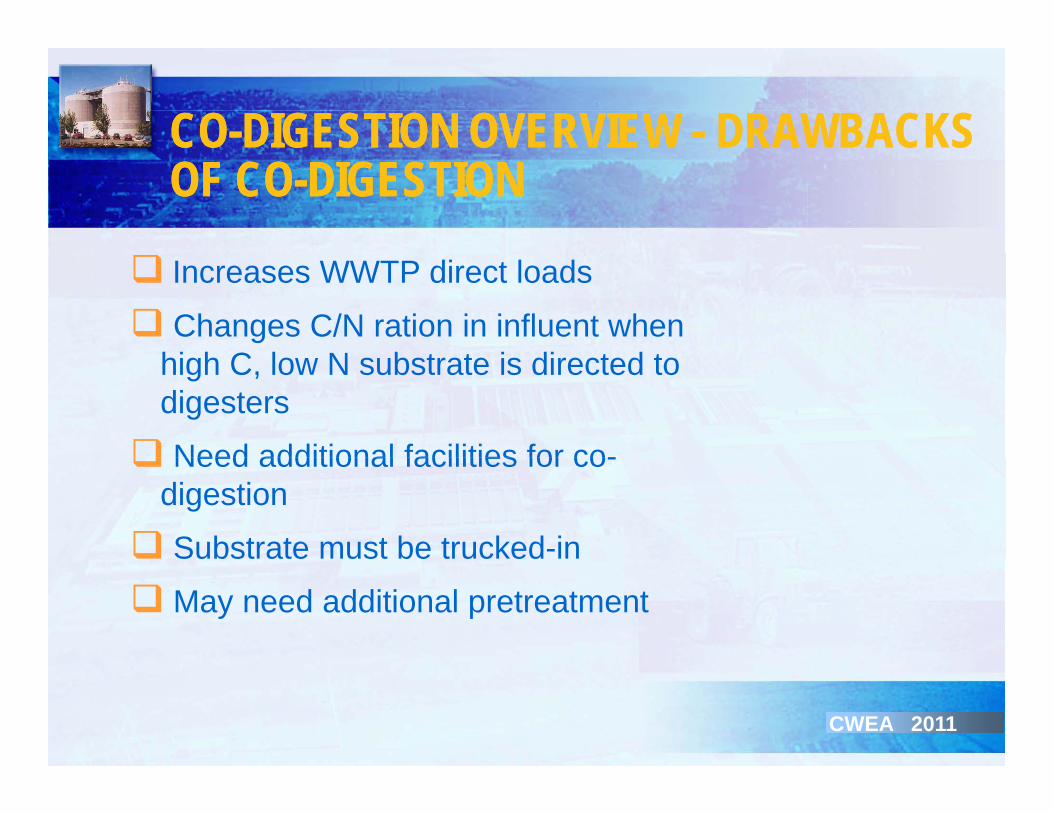
CO-DIGESTION OVERVIEW - DRAWBACKS CO-DIGESTION OVERVIEW - DRAWBACKS OF CO-DIGESTIONOF CO-DIGESTION
Increases WWTP direct loads
Changes C/N ration in influent when hi h C l N b t t i di t d thigh C, low N substrate is directed to digesters
Need additional facilities for co- Need additional facilities for co-digestion
Substrate must be trucked-in
May need additional pretreatment
CWEA 2011

CO-DIGESTION POTENTIAL IN CACO-DIGESTION POTENTIAL IN CACO DIGESTION POTENTIAL IN CACO DIGESTION POTENTIAL IN CA
Scenario
Biogas(million cf/d)
Electricity (MW)
without C
with C
without C
with CCo-
digestionCo-
digestionCo-
digestionCo-
digestion
Scenario 1 98 155 223 352(all 312 STPs)
Scenario 2 45 71 102 161(114 STPs with ADs)
Biosolids : Food Waste = 80 : 20 by volume for coBiosolids : Food Waste = 80 : 20 by volume for co-digestion Biogas can be increased by 58% with co-digestion 60 MW increase
CWEA 2011
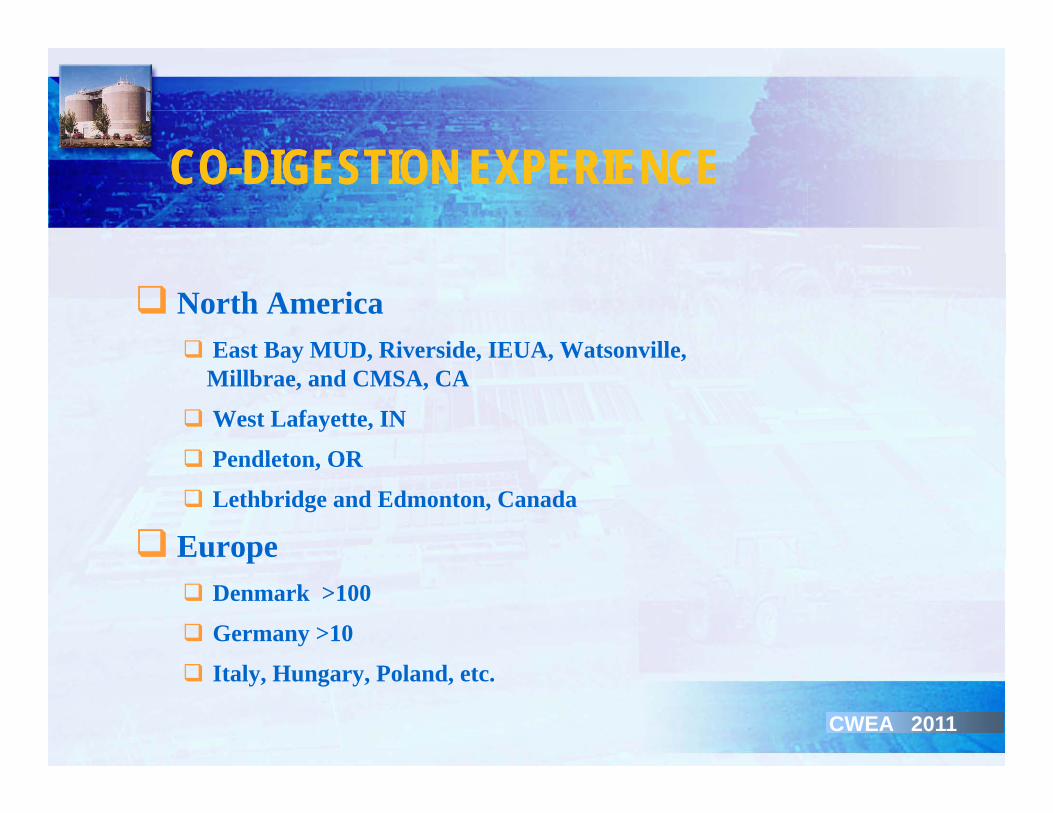
CO DIGESTION EXPERIENCECO DIGESTION EXPERIENCECO-DIGESTION EXPERIENCECO-DIGESTION EXPERIENCE
North America East Bay MUD, Riverside, IEUA, Watsonville, East Bay MUD, Riverside, IEUA, Watsonville,
Millbrae, and CMSA, CA
West Lafayette, IN
Pendleton OR Pendleton, OR
Lethbridge and Edmonton, Canada
Europep Denmark >100
Germany >10
Italy, Hungary, Poland, etc.
CWEA 2011
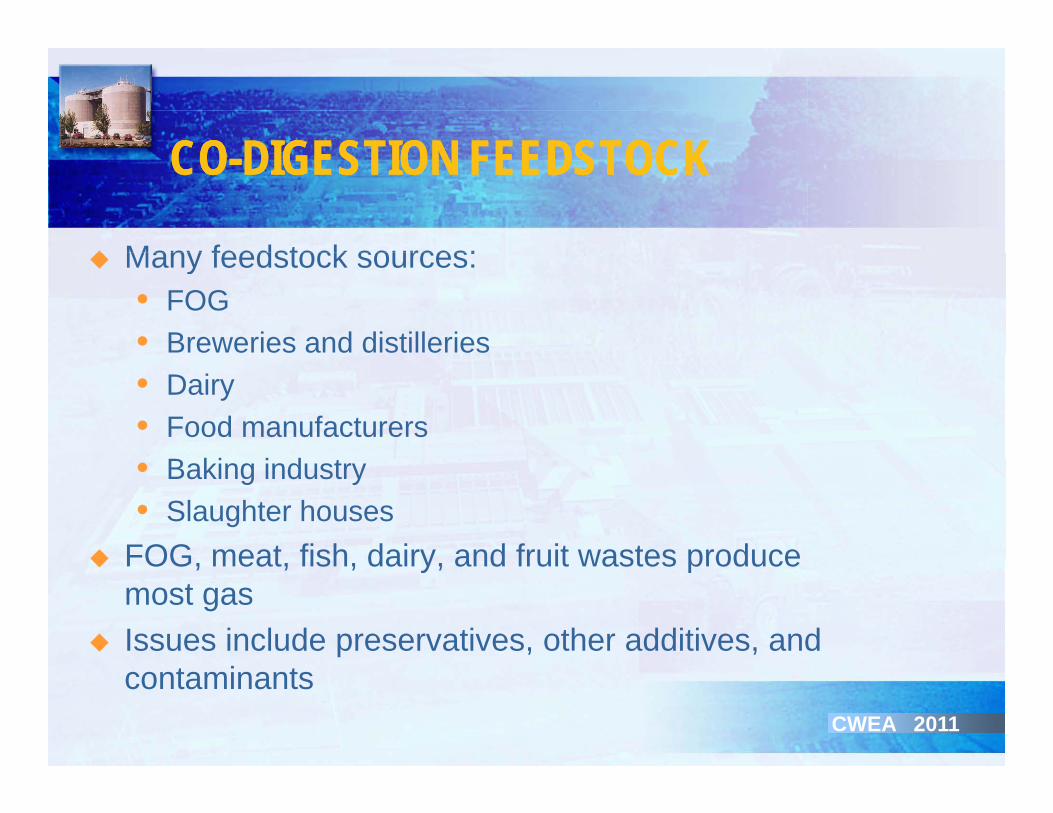
CO DIGESTION FEEDSTOCKCO DIGESTION FEEDSTOCKCO-DIGESTION FEEDSTOCKCO-DIGESTION FEEDSTOCK
Many feedstock sources: Many feedstock sources: • FOG• Breweries and distilleries• Dairy• Food manufacturers
B ki i d• Baking industry• Slaughter houses
FOG meat fish dairy and fruit wastes produce FOG, meat, fish, dairy, and fruit wastes produce most gas
Issues include preservatives, other additives, and contaminants
CWEA 2011

CO DIGESTION FEEDSTOCKCO DIGESTION FEEDSTOCKCO-DIGESTION FEEDSTOCKCO-DIGESTION FEEDSTOCK
S i f di ti i t ll k Science of co-digestion is not well known
Limited available data
C k l d i i ifi d f Current knowledge is site-specific and often not transferable to other facilities
Bench scale testing allows different food wastes to be Bench scale testing allows different food wastes to be evaluated for co-digestionCo-digestion operationg pBlend ratiosDewaterabilityDewatering filtrate qualityDewatering filtrate quality
CWEA 2011
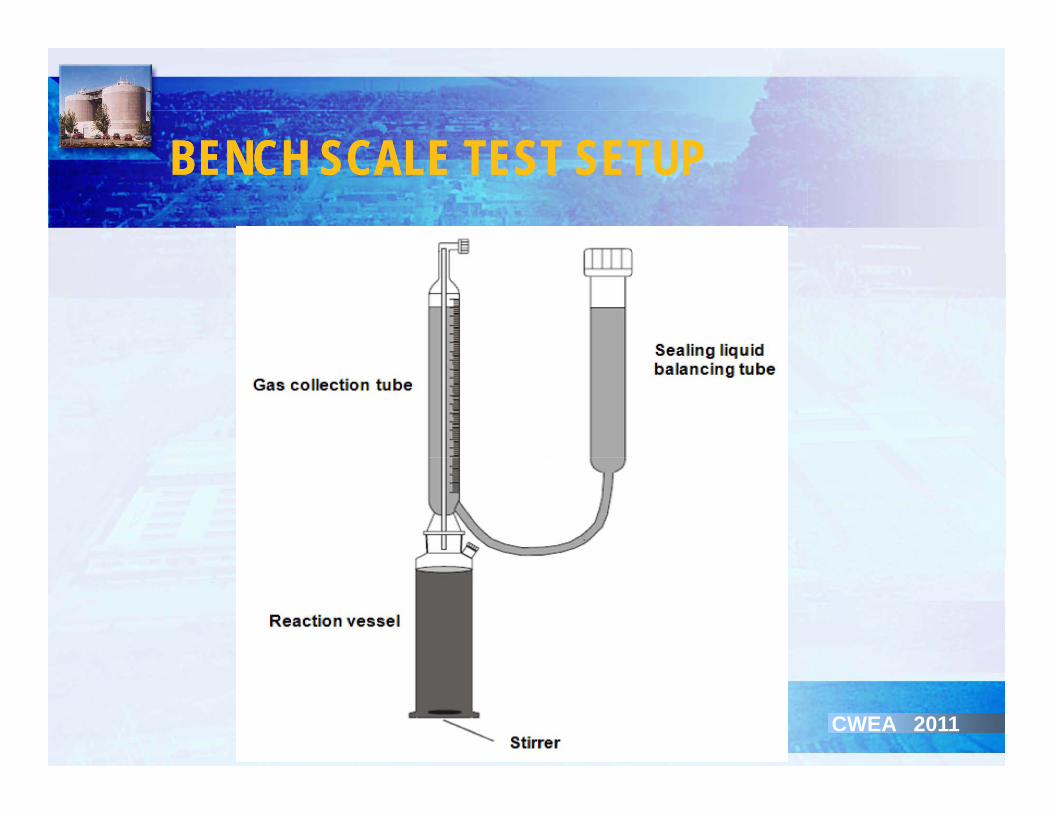
BENCH SCALE TEST SETUPBENCH SCALE TEST SETUPBENCH SCALE TEST SETUPBENCH SCALE TEST SETUP
CWEA 2011

BENCH SCALE TEST SETUPBENCH SCALE TEST SETUPBENCH SCALE TEST SETUPBENCH SCALE TEST SETUP
Source: Jörg Krampe, SA Water Corporation, 2011CWEA 2011
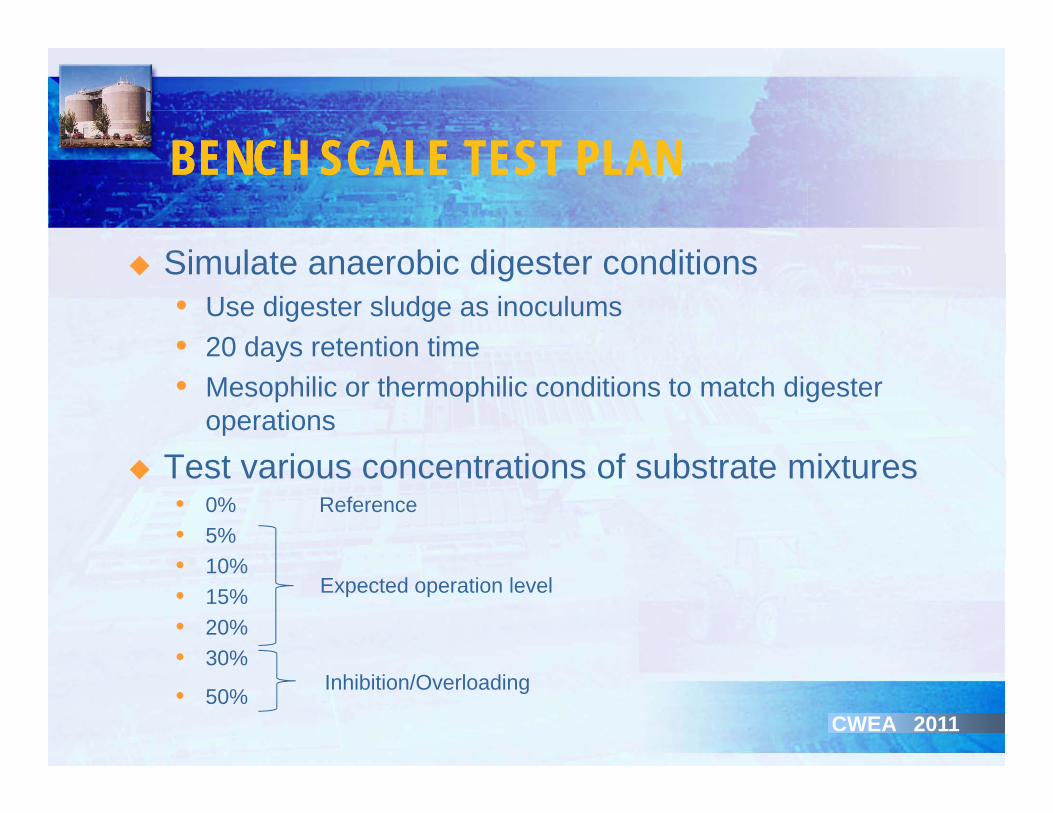
BENCH SCALE TEST PLANBENCH SCALE TEST PLANBENCH SCALE TEST PLANBENCH SCALE TEST PLAN
Si l t bi di t diti Simulate anaerobic digester conditions• Use digester sludge as inoculums• 20 days retention time20 days retention time• Mesophilic or thermophilic conditions to match digester
operations
T t i t ti f b t t i t Test various concentrations of substrate mixtures• 0% Reference• 5%
10%• 10%• 15%• 20%• 30%
Expected operation level
30%
• 50%Inhibition/Overloading
CWEA 2011

BENCH SCALE TEST GAS PRODUCTIONBENCH SCALE TEST GAS PRODUCTIONBENCH SCALE TEST GAS PRODUCTIONBENCH SCALE TEST GAS PRODUCTION
Source: Jörg Krampe, SA Water Corporation, 2011

BENCH SCALE TEST GAS PRODUCTIONBENCH SCALE TEST GAS PRODUCTION
Mesophilic Digestability Tests
BENCH SCALE TEST GAS PRODUCTIONBENCH SCALE TEST GAS PRODUCTION
50:50 blend digestibility testing Mesophilic2000
2500
3000
ctio
n (m
L)
ControlTomato
Thermophilic
0
500
1000
1500
Gas
Pro
duc Tomato
Salad DressingCheese
01 3 5 7 9 11 13 15 17 19 21 23 25 27
Day of Test
Thermophilic Digestability Tests
3000
3500
4000
mL)
1000
1500
2000
2500
3000
Gas
Pro
duct
ion
(m
ControlTomato Salad DressingCheese
0
500
0 1 2 3 4 5 6 7 8 9 10 11 12 13 14 15
Day of Test
G

CO DIGESTION IMPLEMENTATIONCO DIGESTION IMPLEMENTATIONCO-DIGESTION IMPLEMENTATIONCO-DIGESTION IMPLEMENTATION
Food waste sources identification Bench scale digestion testing Digester Loading
• Typically limit to 20 to 30% of digester VS feedC ti f d if ibl• Continuous feed if possible
• Optimum C:N ratio of 20-30 Receiving station Receiving station
• Screens• blending/Mixing• Heating
CWEA 2011

CO DIGESTION IMPLEMENTATIONCO DIGESTION IMPLEMENTATIONCO-DIGESTION IMPLEMENTATIONCO-DIGESTION IMPLEMENTATION
Digestion system process modifications/ improvements
f• Food waste flow distribution and measurement• Gas collection, treatment and co-generation infrastructure
improvementsimprovements
Solids handling systems assessment• Dewatering system operatione a e g sys e ope a o• Recycle management
CWEA 2011

POTENTIAL BUSINESS MODELPOTENTIAL BUSINESS MODELPOTENTIAL BUSINESS MODELPOTENTIAL BUSINESS MODEL

CO DIGESTION COST BENEFIT ANALYSISCO DIGESTION COST BENEFIT ANALYSISCO-DIGESTION COST - BENEFIT ANALYSISCO-DIGESTION COST - BENEFIT ANALYSIS
Substrate Total cost of addition of 1 kL
substrate ($)
Total benefit of addition of 1 kL
substrate ($)
Total profit per kL added ($)
Sweet Whey 2.14 6.36 4.22Salty Whey 4.36 7.82 3.47y yChicken blood 37.00 14.37 -22.63Brewery 1.08 3.63 2.55Cola based 0 26 27 23 26 97Cola based alcoholic beverage waste
0.26 27.23 26.97
Source: Jörg Krampe SA Water Corporation 2011Source: Jörg Krampe, SA Water Corporation, 2011
CWEA 2011

CO DIGESTION IMPLEMENTATIONCO DIGESTION IMPLEMENTATIONCO-DIGESTION IMPLEMENTATIONCO-DIGESTION IMPLEMENTATION
Food Waste Receiving, Storage and Feed System
CWEA 2011

CO DIGESTION IMPLEMENTATIONCO DIGESTION IMPLEMENTATIONCO-DIGESTION IMPLEMENTATIONCO-DIGESTION IMPLEMENTATION
Food Waste Receiving, Storage and Feed System
CWEA 2011
System

CO DIGESTION PERFORMANCECO DIGESTION PERFORMANCECO-DIGESTION PERFORMANCECO-DIGESTION PERFORMANCE
RP-1 Digester 4 Volatile Solids Reduction 15-day Running Average
70%
80%Baseline Operation Manure Foodwaste Codigestion
40%
50%
60%
VS
R
11% Points
10%
20%
30%% 11% Points Improvement
0%11/29/2004 1/18/2005 3/9/2005 4/28/2005 6/17/2005 8/6/2005 9/25/2005 11/14/2005 1/3/2006
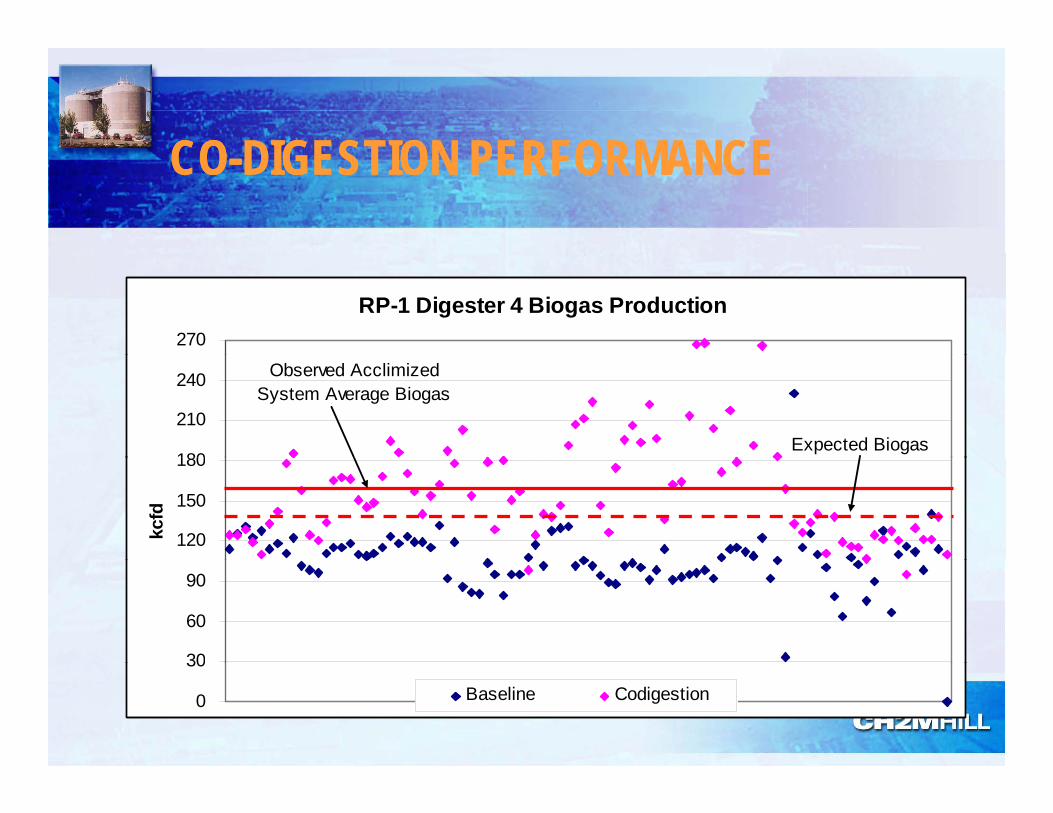
CO DIGESTION PERFORMANCECO DIGESTION PERFORMANCECO-DIGESTION PERFORMANCECO-DIGESTION PERFORMANCE
RP-1 Digester 4 Biogas Production
270
180
210
240
Expected Biogas
Observed Acclimized System Average Biogas
120
150
180
kcfd
30
60
90
0
30
Baseline Codigestion

CO-DIGESTION IMPLEMENTATIONCO-DIGESTION IMPLEMENTATION
Sl f di f di t t d d
CO DIGESTION IMPLEMENTATIONCO DIGESTION IMPLEMENTATION
Slug feeding of digesters not recommended
Monitor delivered waste pH and %TS
Mesophilic conditions appears to be less sensitive to feed fluctuations; high activity in thermophilic can result in sour conditions more rapidly
Need to consider SRT in digester – maximize digestion time while allowing capacity for food waste
Sludge dewaterability, gas quality and filtrate quality need to be monitored at full-scale
CWEA 2011

QUESTIONSQUESTIONS ?QUESTIONSQUESTIONS ?
Thanks !
WEFTECH 2005CWEA 2011