Embed Size (px)
Citation preview
University of Southern Queensland
Faculty of Health, Engineering & Sciences
Operating Temperature of Current Carrying
Copper Busbar Conductors
A dissertation submitted by
Roland Barrett
in fulfilment of the requirements of
Courses ENG4111 and 4112 Research Project
towards the degree of
Bachelor of Engineering (Electrical and Electronic)
Submitted: October, 2013
Page ii
Abstract
Copper busbar conductors are an integral part of any high current switchboard. A
suitable switchboard design must be capable of withstanding the mechanical, electrical
and thermal stresses which are likely to be encountered in normal service. The aim of
the project is to simulate and model, in Matlab, the operating temperature of various
current carrying copper busbar conductor arrangements in a specific bus zone and to
assist with design selection to Australian Standards.
The project objectives, detailed in the dissertation, list several milestones to achieve the
project aim. The objectives can be summarised into three categories:
1. Research
2. Matlab Script Development
3. Testing
Although three distinct categories, a continuous cycle of all three was implemented
throughout the project to generate acceptable results.
The developed Matlab Script is able to produce plots that contain operating temperature
curves for a given current and ambient temperature. This provides another method for
switchboard manufactures to determine busbar current carrying capacities within the
specific enclosure. The accuracy of the curves are within ±8% when compared with the
AS 3000:1991 method, which is also an approximation, and within 1% error when
compared with the real test results (Type Tested) for the specified enclosure at a single
point.
Page iii
Limitation of Use
The Council of the University of Southern Queensland, its Faculty of Health,
Engineering & Sciences, and the staff of the University of Southern Queensland, do not
accept any responsibility for the truth, accuracy or completeness of material contained
within or associated with this dissertation.
Persons using all or any part of this material do so at their own risk, and not at the risk
of the Council of the University of Southern Queensland, its Faculty of Health,
Engineering & Sciences or the staff of the University of Southern Queensland.
This dissertation reports and educational exercise and has no purpose or validity beyond
this exercise. The sole purpose of the course pair entitled “Research Project” is to
contribute to the overall education within the student’s chosen degree program. This
document, the associated hardware, software, drawings, and other material set out in the
associated appendices should not be used for any other purpose: if they are so used, it is
entirely at the risk of the user.
Page iv
Certification
I certify that the ideas, designs and experimental work, results, analyses and conclusions
set out in this dissertation are entirely my own effort, except where otherwise indicated
and acknowledged.
I further certify that the work is original and has not been previously submitted for
assessment in any other course or institution, except where specifically stated.
Roland Barrett
Student Number: 0050070099
Date: 21 / 10 / 2013
Page v
Acknowledgements
I would like to express my appreciation to my project supervisor Dr Tony Ahfock,
whose contribution in suggestions and advice helped me in executing this project.
Furthermore I would also like to acknowledge J. & P. Richardson Industries Pty Ltd,
who gave the permission to use their standard busbar zone design and Type Test reports
for verification of my results.
Page vi
Table of Contents
Abstract ............................................................................................................................. ii
Acknowledgements ........................................................................................................... v
Table of Contents ............................................................................................................. vi
List of Figures ................................................................................................................... x
List of Tables.................................................................................................................... xi
Glossary of Terms ........................................................................................................... xii
1 Introduction ............................................................................................................... 1
1.1 Outline of the Project ......................................................................................... 1
1.2 Introduction ........................................................................................................ 1
1.3 The Problem ....................................................................................................... 2
1.4 Project Objectives ............................................................................................... 2
1.5 Overview ............................................................................................................ 5
1.6 Project Outcomes ............................................................................................... 6
2 Background ............................................................................................................... 7
2.1 Introduction ........................................................................................................ 7
2.2 Standards Literature Review .............................................................................. 7
2.2.1 AS/NZS 3000:2007 Electrical Installations ................................................ 7
Page vii
2.2.2 AS/NZS 3439.1:2002 Low-voltage switchgear and controlgear assemblies
- Type-tested and partially type-tested assemblies.................................................... 9
2.2.3 AS 60890:2009 A method of temperature-rise assessment by extrapolation
for Partially Type-Test Assemblies (PTTA) of low-voltage switchgear and
controlgear............................................................................................................... 12
2.3 Commercial Switchboard Manufacturing Workshop Review ......................... 13
2.4 Mathematical Methods of Temperature Calculation ........................................ 15
2.5 Other Published Papers .................................................................................... 16
2.6 Conclusions ...................................................................................................... 17
3 Methodology ........................................................................................................... 18
3.1 Introduction ...................................................................................................... 18
3.2 Specific Bus Zone System ................................................................................ 19
3.2.1 Bus Zone Specifics .................................................................................... 19
3.3 Assumptions ..................................................................................................... 24
3.4 Mathematical Methods of Temperature Calculation ........................................ 25
3.4.1 Heat Generated by Busbars ....................................................................... 25
3.4.2 Heat Dissipated by Busbars ...................................................................... 26
3.4.3 Heat Absorbed by Enclosure ..................................................................... 30
3.4.4 Heat Conduction through Enclosure Wall ................................................ 33
3.4.5 Heat Dissipated by Enclosure ................................................................... 34
3.4.6 Thermal Circuit of the Bus Zone System .................................................. 37
3.5 Matlab Script .................................................................................................... 39
Page viii
3.6 Alternate Methods ............................................................................................ 42
3.6.1 AS 3000:1991 Method .............................................................................. 42
3.6.2 AS 60890:2009 Method ............................................................................ 44
4 Results ..................................................................................................................... 46
4.1 Introduction ...................................................................................................... 46
4.2 Matlab Script Results ....................................................................................... 47
4.3 Type Test Certificate Results ........................................................................... 59
4.4 AS 3000:1991 Results ...................................................................................... 62
4.5 AS 60890:2009 Results .................................................................................... 64
5 Analysis and Discussion ......................................................................................... 67
5.1 Introduction ...................................................................................................... 67
5.2 Matlab Script vs. Type Test Results ................................................................. 68
5.3 Matlab Script vs. AS 3000:1991 Results .......................................................... 70
5.4 Matlab Script vs. AS 60890:2009 Results ........................................................ 72
5.5 Matlab Script .................................................................................................... 74
5.5.1 Accuracy of Model .................................................................................... 74
5.5.2 Assumption Relaxation ............................................................................. 75
6 Conclusions ............................................................................................................. 78
6.1 Potential Future Work ...................................................................................... 80
7 Appendix A ............................................................................................................. 82
7.1 Project Specification ......................................................................................... 82
8 Appendix B ............................................................................................................. 86
Page ix
8.1 Matlab Script .................................................................................................... 86
9 Appendix C ............................................................................................................. 93
9.1 AS 3000:1991 Method Calculations ................................................................ 93
10 Appendix D ............................................................................................................. 96
10.1 AS 60890:2009 Method Calculations ........................................................... 96
11 Appendix E ............................................................................................................. 98
11.1 Bus Zone General Arrangement Drawings ................................................... 98
12 References ............................................................................................................. 103
Page x
List of Figures
Figure 3.1 Front View of Bus Zone ................................................................................ 20
Figure 3.2 Plan View of Bus Zone .................................................................................. 21
Figure 3.3 Sectional View of Bus Zone with Busbar Locations Dimensioned .............. 22
Figure 3.4 Sectional View of Bus Zone with Busbar Supports Shown .......................... 23
Figure 3.5 Convection Heat Loss from a Busbar Section ............................................... 28
Figure 3.6 Radiation Heat Loss from a Busbar Section .................................................. 29
Figure 3.7 Thermal Circuit .............................................................................................. 38
Figure 3.8 Matlab Script Functional Flow Chart ............................................................ 40
Figure 4.1 Operating Temperature of Busbars for a given Current at 40°C Ambient
Temperature .................................................................................................................... 51
Figure 4.2 Operating Temperature of Busbars for a given Current at 35°C Ambient
Temperature .................................................................................................................... 52
Figure 4.3 Operating Temperature of Busbars for a given Current at 30°C Ambient
Temperature .................................................................................................................... 53
Figure 4.4 Operating Temperature of Busbars for a given Current at 25°C Ambient
Temperature .................................................................................................................... 54
Figure 4.5 Operating Temperature of Busbars for a given Current at 20°C Ambient
Temperature .................................................................................................................... 55
Figure 4.6 Type Test Temperature Rise Test Thermocouple Locations ......................... 61
Figure 4.7 Intersection of Extrapolated and Calculated Current Ratings. ...................... 64
Figure 4.8 Enclosure Temperature Characteristic Curve ................................................ 65
Figure 5.1 Potential Solution Scenario............................................................................ 75
Page xi
List of Tables
Table 2.1 Extract from AS3439.1 Table 2 - Temperature-rise limits ............................. 10
Table 4.1 3 by 125x6.3mm copper busbars Test Conditions .......................................... 47
Table 4.2 Matlab Script Results of Estimated Current Carrying Capacities for the
Specified Enclosure. ........................................................................................................ 50
Table 4.3 Temperature of Busbars at Nominal Switch Sizes and 40°C Ambient .......... 56
Table 4.4 Temperature of Busbars at Nominal Switch Sizes and 35°C Ambient .......... 57
Table 4.5 Temperature of Busbars at Nominal Switch Sizes and 30°C Ambient .......... 57
Table 4.6 Temperature of Busbars at Nominal Switch Sizes and 25°C Ambient .......... 58
Table 4.7 Temperature of Busbars at Nominal Switch Sizes and 20°C Ambient .......... 58
Table 4.8 Test Conditions ............................................................................................... 59
Table 4.9 Results of Type Test Temperature Rise Test on Busbar Enclosure. ............... 60
Table 4.10 AS3000:1991 Results of Estimated Current Carrying Capacities for the
Specified Enclosure. ........................................................................................................ 63
Table 4.11 Results of AS 60890 for 3 by 125x6.3mm copper busbars per phase. ......... 66
Table 5.1 Matlab Script vs. Type Test Certificate Results ............................................. 68
Table 5.2 Current Carrying Capacity Differential of Matlab Script vs. AS3000 methods.
......................................................................................................................................... 70
Table 5.3 Percentage Error of Matlab Script vs. AS3000 Calculated Current Carrying
Capacities with AS3000 as the Base. .............................................................................. 71
Table 5.4 Matlab Script vs. AS60890 Results ................................................................ 72
Page xii
Glossary of Terms
Assembly is a combination of one or more low voltage switching devices assembled by
a manufacturer (e.g. a switchboard).
Australian Standard (AS) is a published document setting out specifications and
procedures.
Busbar is a low impedance conductor to which several electric circuits can be
separately connected.
Current Carrying Capacity (CCC) is the maximum rated current a conductor can
carry during normal operating conditions.
High current is defined where the rated current is equal to or exceeds 800 Amps.
Low voltage is defined where the rated voltage does not exceed 1000 V a.c. at
frequencies not exceeding 1000 Hz, or 1500 V d.c.
New Zealand Standard (NZS) is a published document setting out specifications and
procedures.

Page xiii
Partially Type Tested low voltage switchgear and control gear Assembly (PTTA) is
a low voltage switchgear and controlgear Assembly, containing both Type Tested and
non-Type Tested arrangements, provided that the latter are derived (e.g. by calculation)
from Type Tested arrangements which have complied with the relevant tests.
Page 1
1 Introduction
1.1 Outline of the Project
The need to determine the operating temperature of current carrying copper busbar
conductors was identified by a commercial switchboard manufacture contracting
company using superseded Australian Standards for their busbar conductor selection in
high current switchboards. The purpose and scope of this project is detailed in
Section 1.4, Project Objectives.
1.2 Introduction
Copper busbar conductors are an integral part of any high current switchboard.
AS/NZS3008.1.1:2009 provides a method for electrical cable selection for various
common installations, however busbar selection is not provided with the same level of
detailed guidance. A suitable switchboard design must be capable of withstanding the
mechanical, electrical and thermal stresses which are likely to be encountered in normal
service. The Australian Standards provide limits for the maximum temperatures that a
busbar conductor can operate within during normal operation, which influences
conductor design selection and current carrying capacities.
Page 2
1.3 The Problem
Despite the Australian Standards providing operational limits, they do not provide a
detailed method for busbar conductor selection. As busbar arrangements are generally
uninsulated within a switchboard enclosure, the operating temperature greatly depends
on the busbar surroundings and air flow. Switchboard designs can vary greatly from
board to board due to their application, and therefore busbar zones and conductor
selection vary with this.
Type Tested switchboards are extensively tested to certify that their busbar operating
temperature remains within allowable limits, however, Type Testing every switchboard
is expensive and not commercially viable. Alternatively, verification of operating
temperature of the busbars can be calculated by extrapolation of known data.
1.4 Project Objectives
The aim of this project was to simulate and model in Matlab the operating temperature
of various current carrying copper busbar conductor arrangements in a specific bus zone
of a low voltage switchboard to determine if the conductor selection meets Australian
Standards.
Page 3
The project addresses the following key objectives, tailored to meet the project aim.
1. Review of the current requirements in Australia for calculating Current Carrying
Capacity of busbar in switchboards. This includes making references to
Australian Standards such as:
AS/NZS 3000:2007 Electrical Installations
AS/NZS 3439.1:2002 Low-voltage switchgear and controlgear
assemblies - Type-tested and partially type-tested assemblies
AS 60890:2009 A method of temperature-rise assessment by
extrapolation for partially type-test assemblies (PTTA) of low-voltage
switchgear and controlgear
2. Review of the current methods of calculating Current Carrying Capacity of
busbar arrangements in one commercial switchboard manufacturing factory.
3. Collation of some mathematical methods for the calculation of temperature of
copper busbars carrying current with natural heat loss convection. State
mathematical methods for the calculation of temperature loss of the switchboard
cubical material incorporating effects caused by material finish.
4. Simulate and model in Matlab the temperature of copper busbars carrying
2500A in the specific bus zone and busbar arrangement.
Page 4
5. Compare the Matlab simulation to real Type Test results for the specific bus
zone and busbar arrangement.
6. Simulate and model in Matlab the temperature of copper busbars carrying
various currents in a specific bus zone and with varying busbar arrangements.
Varying currents would be of nominal switch sizes such as:
630A
800A
1000A
1250A
1600A
2000A
3200A
Busbar arrangements were varied in bar width and number of conductors in
parallel per phase. Copper bar widths are of common commercially available
sizes.
Page 5
1.5 Overview
To achieve the aim of this project, Chapter 2 addresses Project Objectives 1, 2 and 3,
reviewing literature, both public and private, to establish the background on what
information is available for busbar design selection.
After establishing the background information, Chapter 3 will establish the specific bus
zone system, its dimensions and assumptions made. Addressing Project Objectives 3, 4
and 6, this Chapter details the methodologies behind each method of calculating the
operating temperature of current carrying copper busbars.
Implementing the methodologies detailed in Chapter 3, Chapter 4 presents the results of
the four methods for calculating busbar operating temperatures or current carrying
capacities detailed in the previous Chapter. This Chapter addresses Project Objectives 4
and 6.
Following the results, Chapter 5 presents an analysis and discussion of the developed
Matlab Script’s results verses the other three methods of calculating busbar operating
temperatures or current carrying capacities, as describe in the Chapter 3. This Chapter
addresses Project Objective 5.
Concluding the project, Chapter 6 summarises the project and the key discussions. This
Chapter additionally discusses potential further work expanding on the findings of this
project.
Page 6
1.6 Project Outcomes
The outcomes of this project provide another method for switchboard manufactures to
determine busbar current carrying capacities within the specific enclosure. The
outcomes provide documentation that the design selection complies with Australian
Standards.
Page 7
2 Background
2.1 Introduction
This Chapter addresses Project Objectives 1, 2 and 3, reviewing literature, both public
and private, to establish the background on what information is available for busbar
design selection.
2.2 Standards Literature Review
2.2.1 AS/NZS 3000:2007 Electrical Installations
AS/NZS 3000:2007 Electrical Installations (AS 3000) is an Australian Standard that
‘sets out requirements for the design, construction and verification of electrical
installations, including the selection and installation of electrical equipment forming
part of such electrical installations’ (AS/NZS 3000:2007, p21). Clause 3.4.1 of AS 3000
states that ‘every conductor shall have a current-carrying capacity, in accordance with
AS/NZS 3008.1’ (AS/NZS 3000:2007, p126). However, note 4 of this clause states that
‘current-carrying capacities for busbars should be obtained from the manufacturer’
(AS/NZS 3000:2007, p126), and also that AS 4388 provides a guide to this calculation.
The manufacturer is the entity that designs and manufactures the switchboard.
AS 4388:1996, A method of temperature-rise assessment by extrapolation for partially

Page 8
type-tested assemblies (PTTA) of low-voltage switchgear and controlgear was
superseded by AS 60890:2009 of the same title in 2009.
Section 2.9.1 of AS 3000 relates to the construction of switchboards, and in addition to
the calculation of current carrying capacities of busbars, AS 3000 states,
Clause 2.9.3.2 Suitability. Switchboards shall be suitable to withstand the
mechanical, electrical and thermal stresses that are likely to occur in service.
Switchboards complying with the relevant requirements of the AS/NZS 3439
series of Standards are considered to meet the requirements of this clause 2.9.3
(AS/NZS 3000:2007, p115).
Summarising AS 3000, it states that the responsibility for the calculation of current
carrying capacities of busbars lies with the manufacturer and AS 60890:2009 can be
used as a guide. Additionally the construction of the switchboard is to comply with the
relevant sections of AS/NZS 3439 with regards to thermal stresses that are likely to
occur in service.
Page 9
2.2.2 AS/NZS 3439.1:2002 Low-voltage switchgear and controlgear assemblies -
Type-tested and partially type-tested assemblies
AS/NZS 3439.1:2002 (AS 3439) is an Australian Standard whose objective ‘is to lay
down the definitions and to state the service conditions, construction requirements,
technical characteristics and tests for low-voltage switchgear and control gear
Assemblies’ (AS/NZS 3439.1:2002, p1).
AS 3439 states in its Preface that ‘Information regarding the current carrying capacity
for copper busbars can be found in AS 4388:1996’ (AS/NZS 3439.1:2002, pii), which
reiterates the statement made by AS 3000. As stated in Section 2.2.1 of this project,
AS 4388:1996 was superseded by AS 60890:2009 of the same title in 2009.
Clause 7.8.2 of AS 3439 also reiterates the statement made by AS 3000 that the
responsibility for the calculation of current carrying capacities of busbars lies with the
manufacturer.
Clause 7.8.2 Dimensions and rating of busbars and insulated conductors. The
choice of the cross-sections of conductors inside the Assembly is the
responsibility of the manufacturer. (AS/NZS 3439.1:2002, p48)
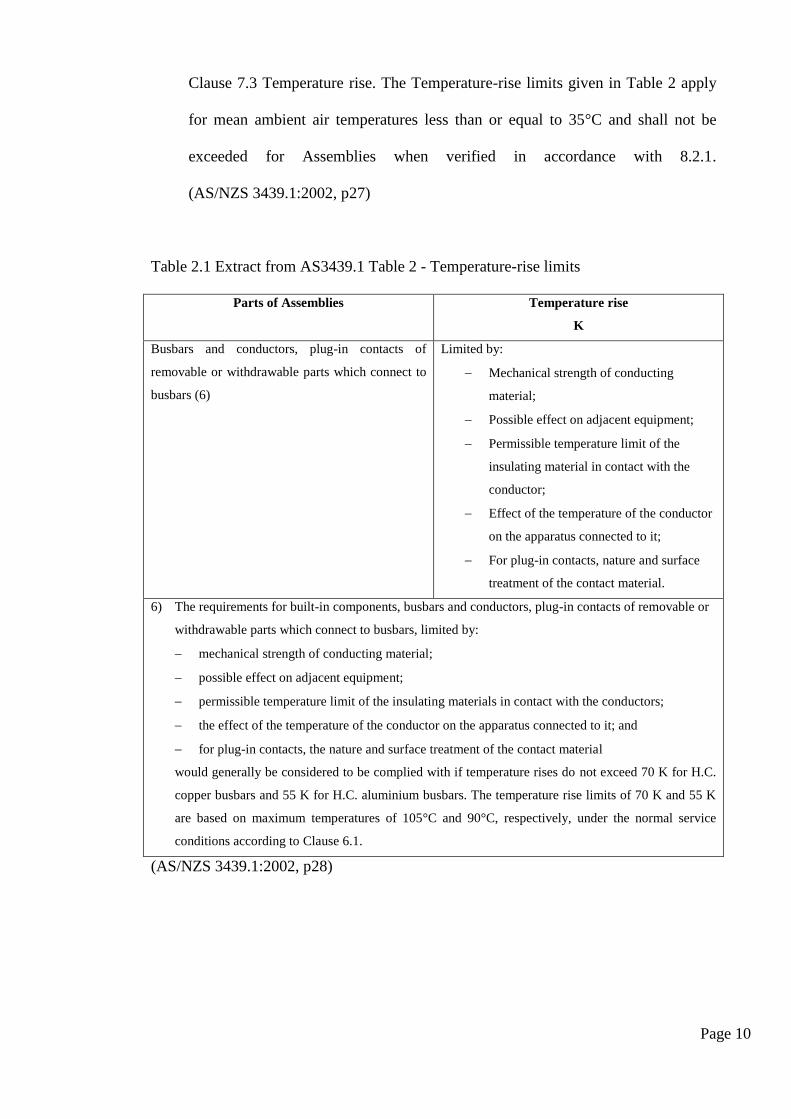
Clause 7.3 of AS 3439 defines the temperature rise limits in Table 2 of AS3439. Clause
7.3 and an extract of Table 2 relating only to the busbar components are shown in
Table 2.1 on the following page. As stated in Table 2.1, the maximum copper busbar
operational temperature under normal service conditions is 105°C.
Page 10
Clause 7.3 Temperature rise. The Temperature-rise limits given in Table 2 apply
for mean ambient air temperatures less than or equal to 35°C and shall not be
exceeded for Assemblies when verified in accordance with 8.2.1.
(AS/NZS 3439.1:2002, p27)
Table 2.1 Extract from AS3439.1 Table 2 - Temperature-rise limits
Parts of Assemblies Temperature rise
K
Busbars and conductors, plug-in contacts of
removable or withdrawable parts which connect to
busbars (6)
Limited by:
Mechanical strength of conducting
material;
Possible effect on adjacent equipment;
Permissible temperature limit of the
insulating material in contact with the
conductor;
Effect of the temperature of the conductor
on the apparatus connected to it;
For plug-in contacts, nature and surface
treatment of the contact material.
6) The requirements for built-in components, busbars and conductors, plug-in contacts of removable or
withdrawable parts which connect to busbars, limited by:
mechanical strength of conducting material;
possible effect on adjacent equipment;
permissible temperature limit of the insulating materials in contact with the conductors;
the effect of the temperature of the conductor on the apparatus connected to it; and
for plug-in contacts, the nature and surface treatment of the contact material
would generally be considered to be complied with if temperature rises do not exceed 70 K for H.C.
copper busbars and 55 K for H.C. aluminium busbars. The temperature rise limits of 70 K and 55 K
are based on maximum temperatures of 105°C and 90°C, respectively, under the normal service
conditions according to Clause 6.1.
(AS/NZS 3439.1:2002, p28)
Page 11
Clause 7.3 states that the temperature rise needs to be verified in accordance with
Clause 8.2.1. Sub-clause 8.2.1.1 (below) states that verification of temperature rise
limits shall be made either by test or by extrapolation.
Clause 8.2.1.1 Verification of temperature rise.
The Temperature-rise test is designed to verify that the temperature-rise limits
specified in 7.3 for the different parts of the Assembly are not exceeded…
… The verification of temperature-rise limits for PTTA shall be made
By test in accordance with 8.2.1, or
By extrapolation, for example in accordance with IEC 60890.
(AS/NZS 3439.1:2002, p27)
AS 60890:2009 is a reproduction of the IEC 60890 standard, and is therefore the
equivalent when referred to in AS 3439.
Summarising AS 3439, it states that the responsibility for the calculation of current
carrying capacities of busbars lies with the manufacturer, and AS 60890:2009 can be
used as a guide. Additionally, the maximum copper busbar operational temperature,
under normal service conditions, is 105°C.
Page 12
2.2.3 AS 60890:2009 A method of temperature-rise assessment by extrapolation
for Partially Type-Test Assemblies (PTTA) of low-voltage switchgear and
controlgear
AS/NZS 60890:2009 (AS 60890) is an Australian Standard whose objective is to
provide one possible method to determine the temperature rise and prove compliance
with the requirements of sub-clauses 8.2.1 of AS/NZS 3439.1:2002. Where the
temperature rise is verified through calculation of extrapolated data, the Assembly is
considered a Partially Type Tested Assembly (PTTA).
The scope of AS 60890 also defines the ambient air temperature as,
Unless otherwise specified, the ambient air temperature outside the PTTA is the
air temperature indicated for indoor installation of the PTTA (average value over
24 h) of 35°C. If the ambient air temperature outside the PTTA at the place of use
exceeds 35°C, this higher temperature is deemed to be the ambient air temperature
of the PTTA. (AS/NZS 60890:2009, p1)
AS 60890 provides a calculation procedure for one method of calculating the
temperature rise of the air inside an enclosure. This method will be explored in Section
3.6.2.
Page 13
2.3 Commercial Switchboard Manufacturing Workshop Review
Both AS/NZS 3000:2007 and AS/NZS 3439.1:2002 states that the responsibility for the
calculation of current carrying capacities of busbars lies with the manufacturer.
Therefore, a review of the current methods of calculating current carrying capacity of
busbar arrangements in a commercial switchboard manufacturing workshop was
conducted.
The review was performed on a company which has established its switchboard
manufacturing facility over 45 years. They have their own engineering and design
department that produces switchboard designs which are required to meet Australian
Standards. The facility also incorporates a sheetmetal manufacturing workshop for the
construction of metal clad switchboards, with its own paint shop for powder coating.
The electrical manufacturing workshop facilitates the assembly and testing of the
switchboards. It is essentially an all-in-one facility with little need for out sourcing of
any manufacturing processes. Additionally, the company owns the Intellectual Property
of a Motor Control Center Switchboard with Type Test certificates which documents
compliance with the requirements of sub-clauses 8.2.1 of AS/NZS 3439.1:2002.
The aim of the project, as stated in Section 1.4, Project Objectives, is to simulate and
model in Matlab the operating temperature of various current carrying copper busbar
conductor arrangements in a specific bus zone. The specific bus zone is the horizontal
bus zone which is used in the company reviewed’s Type Tested Motor Control Center
Switchboard. The details of specific bus zone can be found in Section 3.2.1, Bus Zone
Specifics.
Page 14
The commercial switchboard manufacturing workshop’s method for calculation of
current carrying capacities of busbars is to use a guide that was provided in
AS 3000:1991 SAA Wiring Rules. Appendix C of AS 3000:1991 provides a method for
the calculation of current carrying capacities which was removed from the 2000 and
2007 editions of AS 3000.
The method proposed in AS 3000:1991 is not a method for calculating the operating
temperature of the busbars. This method assumes the bars are at their maximum
possible rating of 105°C, this although gives a point of comparison between
AS3000:1991 and AS 60890:2009 method. Therefore, this method will be explored in
Section 3.6.1 AS 3000:1991 Method, please refer to this section for further details.
Page 15
2.4 Mathematical Methods of Temperature Calculation
The law of conservation of energy states that the total energy of an isolated system
cannot change. Energy can be neither created nor destroyed, but can change form.
Energy can be transferred by interactions of a system and its surroundings, which is the
case with the busbar system. Electrical energy enters the system, however, not all of the
electrical energy leaves the system due to the resistance of the busbar conductors and
Ohms Law. The remainder of the energy is dissipated as heat from the busbars into its
surroundings.
‘Copper for Busbars’ is a publication maintained by the Copper Development
Association in the United Kingdom. The publication itself is out of print, however, is
maintained in a web based form and last updated in 1996. The preface states that the
publication has long been accepted as the standard reference work on busbar design.
This publication contains formulas for the calculation of convection, radiation and
conduction heat loss from busbars which are further detailed in Section 3.4.
The free-convection flow phenomenon inside an enclosed space, although random,
some very good generalisations can be made to determine average temperatures and
heat flow. ‘Fundamentals of Heat and Mass Transfer’ by Incropera contains formulas
for the calculation of heat transfer via convection, radiation and conduction in a range of
scenarios, which is further detailed in Section 3.4.
The specified enclosure is a complex system of heat dissipation, absorption and
conduction calculations, and the formulas used from the above publications and how
they are inter-connected is detailed in Section 3.4.
Page 16
2.5 Other Published Papers
Several other publications were assessed under the literature review for previous works
relating to calculating the operating temperature of busbars within an enclosure. Two
publications that relate to this project’s aim were,
1. Calculations of Eddy Current, Fluid, and Thermal Fields in an Air Insulated Bus
Duct System by Ho S., Li Y., Lin X. and Lo E. (2006), and
2. Temperature Rise Prediction in 3-Phase Busbar System at 20°C Ambient
Temperature by Tebal N. and Pinang P. (2012).
Both of these publications are an analysis of a 3 phase bus duct system, which is similar
in characteristics to a bus zone of a switchboard. They both used Finite Element Method
(FEM) to model the temperature rise of the system. The Ho, Li, Lin and Lo method was
developed in Fortran whilst the Tebal and Pinang method was modelled in Opera 2D.
Neither publication provided details of methodology or workings as they were
essentially extended abstracts as part of conferences. Due to this lack of information,
neither of these publications were used as sources of information for developing the
Matlab Script of this project.
Page 17
2.6 Conclusions
The review of the Australian Standards for high current switchboards identifies that the
responsibility for the calculation of current carrying capacities of busbars lies with the
manufacturer. AS 60890:2009 is stated as a method for the calculation of current
carrying capacities of busbars and is further investigated in Section 3.6.2.
The manufacturer reviewed in this project does not use the AS 60890:2009 method
referred to within AS/NZS 3439.1:2002 and AS/NZS 3000:2007. The use of a
superseded version of AS3000:1991 and reliance on their Type Test certificate is used
for their evidence of compliance with AS 3439. Additionally, AS 60890 does state that
it is only one possible method to determine the temperature rise. The manufacture’s
method of AS 3000:1991 will be further investigated in Section 3.6.1.
Two publications have been identified as providing sufficient formulas for the
calculation of the operating temperature of the busbars in the specific enclosure. The
details of which are presented in Section 3.4, Mathematical Methods of Temperature
Calculation.
It is also apparent that, because switchboard design can be fairly custom and designed
on a board by board basis, it is difficult to write rules or methods that apply to all
Assemblies. This is further evidenced by the statement that the responsibility of the
calculation of current carrying capacities of busbars lies with the manufacturer.
Page 18
3 Methodology
3.1 Introduction
This Chapter addresses Project Objectives 3, 4 and 6. A summary of these objectives
are listed below:
3. Collation of mathematical methods for the calculation of temperature of copper
busbars carrying current with natural heat loss convection.
4. Simulate and model in Matlab the temperature of copper busbars carrying
2500A in the specific bus zone and busbar arrangement.
6. Simulate and model in Matlab the temperature of copper busbars carrying
various currents in a specific bus zone and with varying busbar arrangements.
This chapter also establishes the specific bus zone system, including its dimensions,
assumptions and methodologies behind each method of calculating the operating
temperature of current carrying copper busbars.
Page 19
3.2 Specific Bus Zone System
3.2.1 Bus Zone Specifics
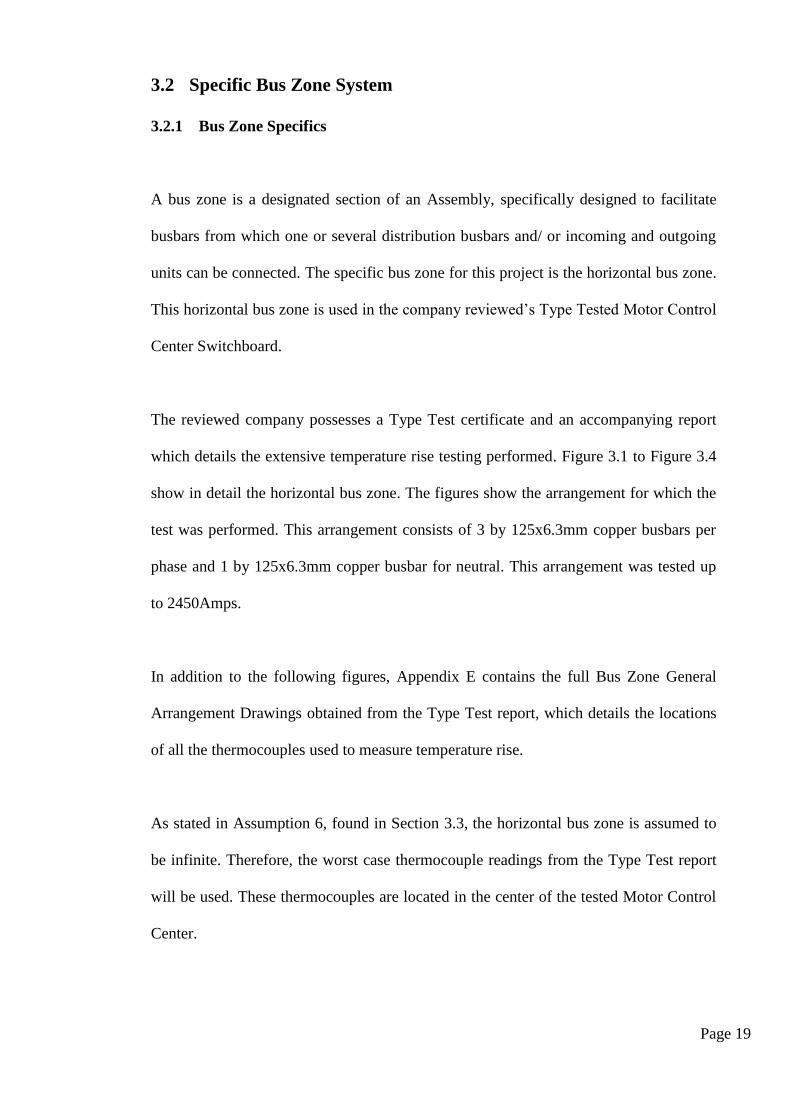
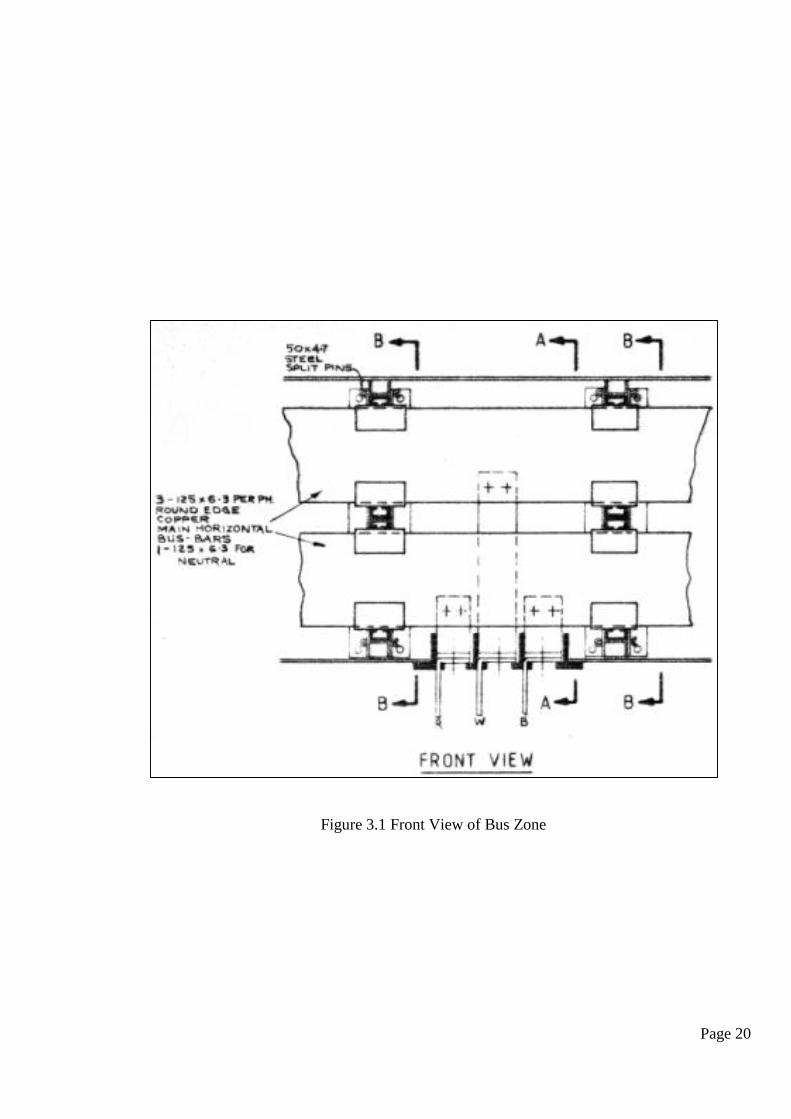
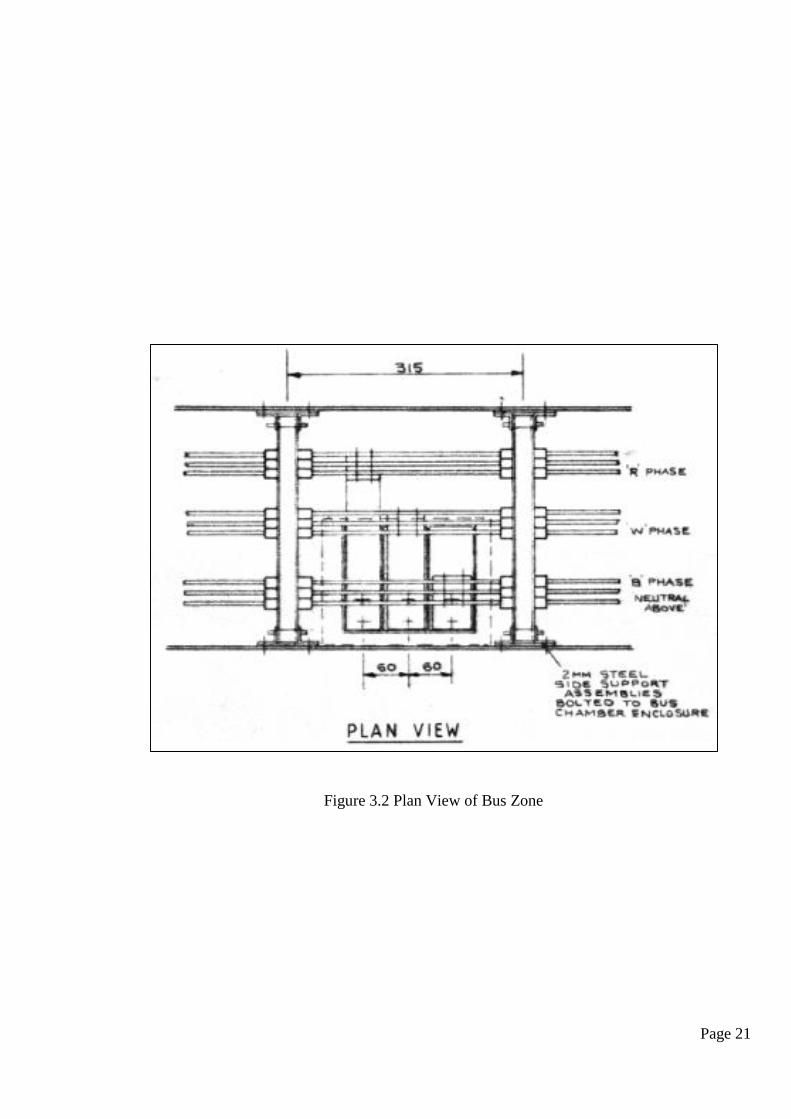
A bus zone is a designated section of an Assembly, specifically designed to facilitate
busbars from which one or several distribution busbars and/ or incoming and outgoing
units can be connected. The specific bus zone for this project is the horizontal bus zone.
This horizontal bus zone is used in the company reviewed’s Type Tested Motor Control
Center Switchboard.
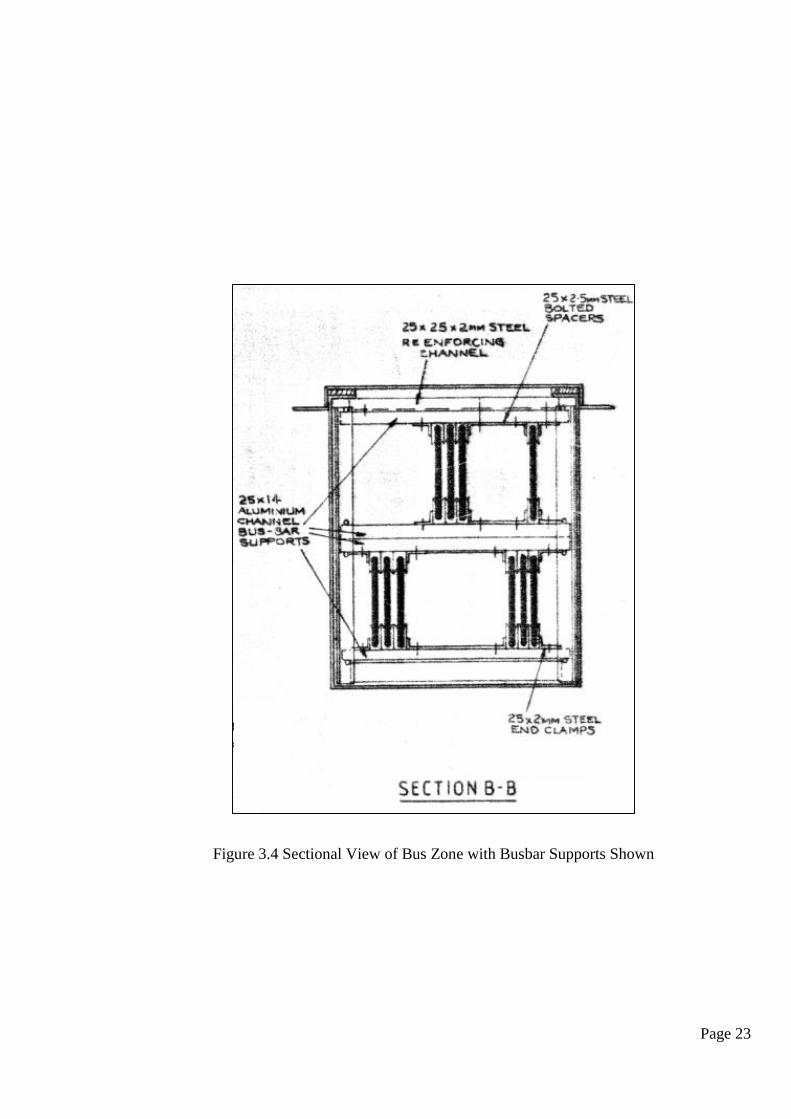
The reviewed company possesses a Type Test certificate and an accompanying report
which details the extensive temperature rise testing performed. Figure 3.1 to Figure 3.4
show in detail the horizontal bus zone. The figures show the arrangement for which the
test was performed. This arrangement consists of 3 by 125x6.3mm copper busbars per
phase and 1 by 125x6.3mm copper busbar for neutral. This arrangement was tested up
to 2450Amps.
In addition to the following figures, Appendix E contains the full Bus Zone General
Arrangement Drawings obtained from the Type Test report, which details the locations
of all the thermocouples used to measure temperature rise.
As stated in Assumption 6, found in Section 3.3, the horizontal bus zone is assumed to
be infinite. Therefore, the worst case thermocouple readings from the Type Test report
will be used. These thermocouples are located in the center of the tested Motor Control
Center.
Page 20
Figure 3.1 Front View of Bus Zone
Page 21
Figure 3.2 Plan View of Bus Zone
Page 22
Figure 3.3 Sectional View of Bus Zone with Busbar Locations Dimensioned
Page 23
Figure 3.4 Sectional View of Bus Zone with Busbar Supports Shown
Page 24
3.3 Assumptions
The following assumptions have been made in regards to the calculation of the
operating temperature of various current carrying copper busbar conductor
arrangements in a specific bus zone.
1. Assume all heat produced by the system is absorbed by the surrounding air.
2. Assume no heat loss through the bottom of the bus zone.
3. Assume busbars located below the bus zone do not contribute to heat generation.
4. Assume bight metal oxidize condition of busbars with emissivity of 0.1.
5. Assume the room temperature is held constant at ambient, and that heat transfer
from the bus zone will have no effect on this temperature.
6. Assume the horizontal bus zone is infinite and current flow is constant along its
length, so there is no transfer in the z-axis. i.e. section A-A = section B-B.
7. Assume the average air temperature within the enclosure is distributed equally
and the busbar conductors are the same temperature.
8. Assume a balance 3 phase system with no negative or zero sequence voltages.
9. Assume still air within and outside the bus zone. i.e. no forced ventilation.
Page 25
3.4 Mathematical Methods of Temperature Calculation
Energy can be transferred by interactions of a system and its surroundings, which is the
case with the busbar system. Electrical energy enters the system, however, not all of the
electrical energy leaves the system due to the resistance of the busbar conductors and
Ohms Law. The remainder of the energy is dissipated as heat from the busbars into its
surroundings.
The specified enclosure is a complex system of heat dissipation, absorption and
conduction calculations, and the formulas used and their inter-connections are detailed
within the following sections.
3.4.1 Heat Generated by Busbars
The rate at which electrical power is generated per unit length of busbar is the product
of 𝐼2𝑅 as described in Equation 3.1 below.
𝑃 = 𝐼2 × 𝑅 (3.1)
where 𝑃 = power dissipated per unit length, W
𝐼 = current in the conductor, A
R = 415AC resistance per unit length of the conductor, Ω
Page 26
3.4.2 Heat Dissipated by Busbars
Heat generated within a busbar can only be dissipated via the following methods:
1. Convection,
2. Radiation and
3. Conduction.
Heat dissipation via conduction depends on sections of the busbar system being at a
lower temperature and acting like a heat sink. For the purpose of this report, heat
dissipation via conduction will not be considered when determining the operating
temperature of the busbar conductor arrangements. The rate at which heat is dissipated
per unit length of busbar is equal to the rate at which electrical power is generated per
unit length of busbar and is described in Equation 3.2 and 3.3 below.
𝑃 = 𝑞𝑐𝑜𝑛𝑣1 + 𝑞𝑟𝑎𝑑1 (3.2)
𝑃 = 𝑊𝐶𝐴𝐶 + 𝑊𝑅𝐴𝑅 (3.3)
where 𝑞𝑐𝑜𝑛𝑣1 = heat dissipated from busbars due to convection, W
𝑞𝑟𝑎𝑑1 = heat dissipated from busbars due to radiation, W
𝑊𝐶 = heat dissipated per square meter due to convection, W/m2
𝑊𝑅 = heat dissipated per square meter due to radiation, W/m2
𝐴𝐶 = surface area of conductor, m2 (convection)
𝐴𝑅 = surface area of conductor, m2 (radiation)
Page 27
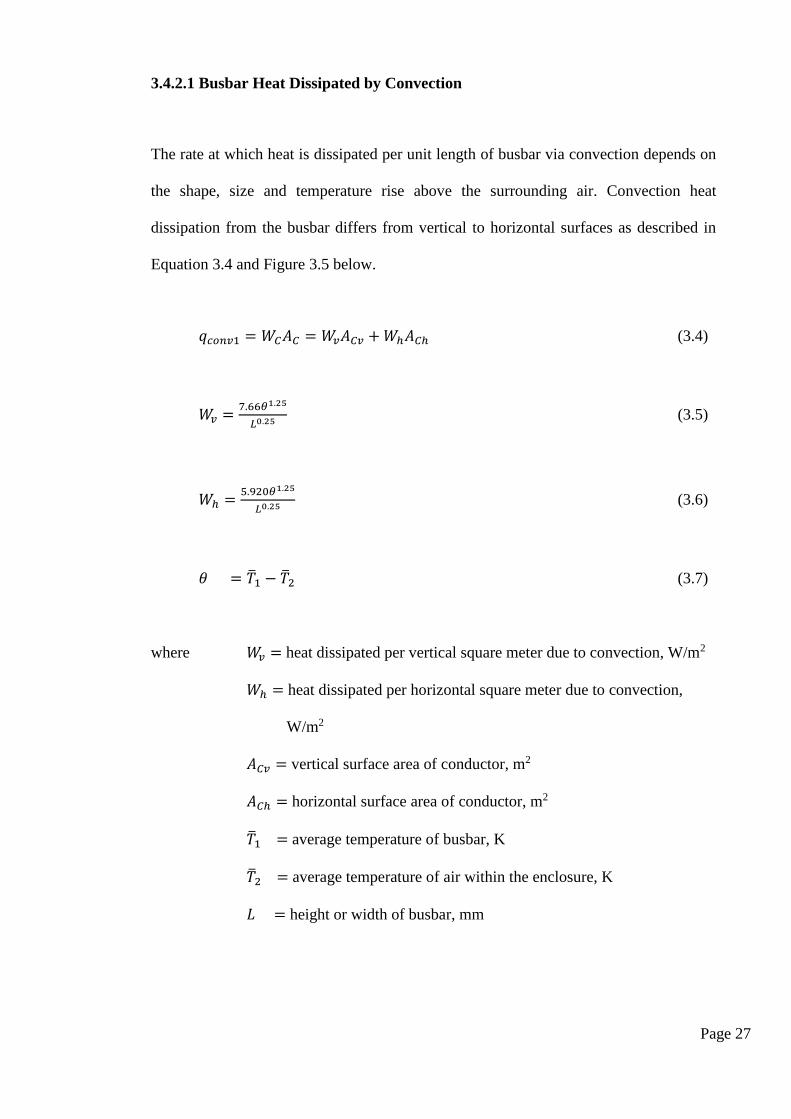
3.4.2.1 Busbar Heat Dissipated by Convection
The rate at which heat is dissipated per unit length of busbar via convection depends on
the shape, size and temperature rise above the surrounding air. Convection heat
dissipation from the busbar differs from vertical to horizontal surfaces as described in
Equation 3.4 and Figure 3.5 below.
𝑞𝑐𝑜𝑛𝑣1 = 𝑊𝐶𝐴𝐶 = 𝑊𝑣𝐴𝐶𝑣 + 𝑊ℎ𝐴𝐶ℎ (3.4)
𝑊𝑣 =7.66𝜃1.25
𝐿0.25 (3.5)
𝑊ℎ =5.920𝜃1.25
𝐿0.25 (3.6)
𝜃 = 1 − 2 (3.7)
where 𝑊𝑣 = heat dissipated per vertical square meter due to convection, W/m2
𝑊ℎ = heat dissipated per horizontal square meter due to convection,
W/m2
𝐴𝐶𝑣 = vertical surface area of conductor, m2
𝐴𝐶ℎ = horizontal surface area of conductor, m2
1 = average temperature of busbar, K
2 = average temperature of air within the enclosure, K
𝐿 = height or width of busbar, mm
Page 28
Figure 3.5 Convection Heat Loss from a Busbar Section
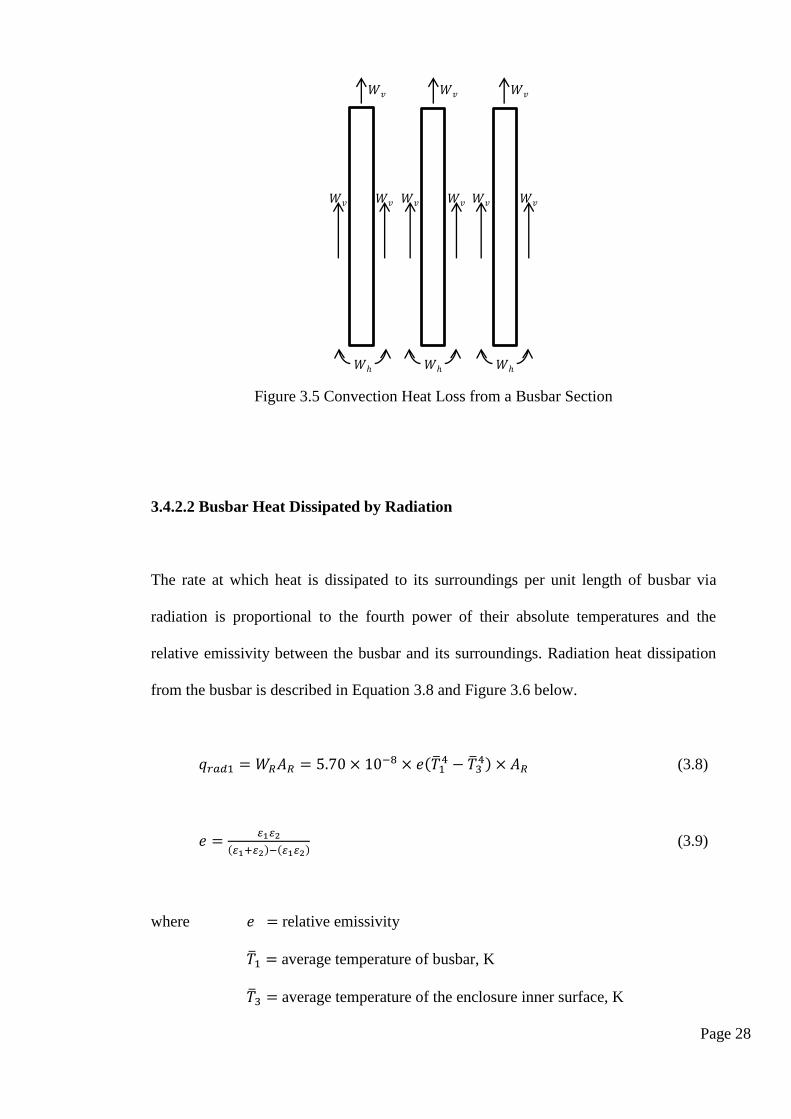
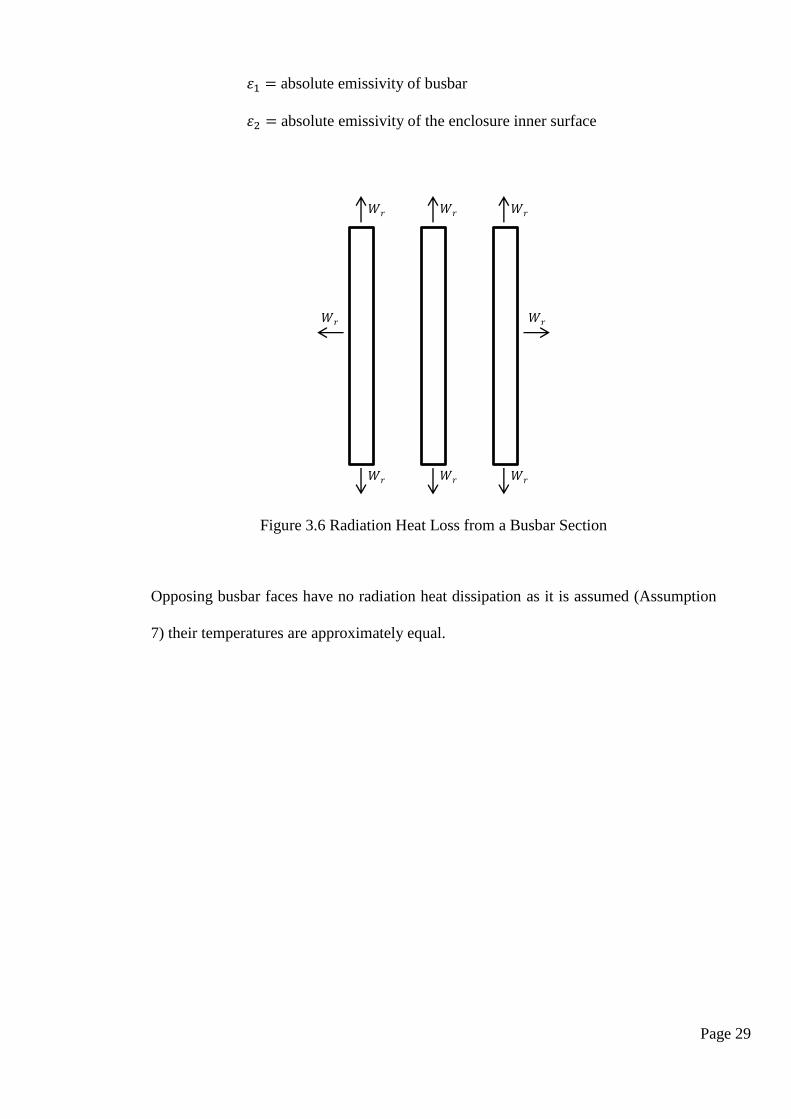
3.4.2.2 Busbar Heat Dissipated by Radiation
The rate at which heat is dissipated to its surroundings per unit length of busbar via
radiation is proportional to the fourth power of their absolute temperatures and the
relative emissivity between the busbar and its surroundings. Radiation heat dissipation
from the busbar is described in Equation 3.8 and Figure 3.6 below.
𝑞𝑟𝑎𝑑1 = 𝑊𝑅𝐴𝑅 = 5.70 × 10⁻⁸ × 𝑒(14 − 3
4) × 𝐴𝑅 (3.8)
𝑒 =𝜀1𝜀2
(𝜀1+𝜀2)−(𝜀1𝜀2) (3.9)
where 𝑒 = relative emissivity
1 = average temperature of busbar, K
3 = average temperature of the enclosure inner surface, K
𝑊𝑣 𝑊𝑣 𝑊𝑣 𝑊𝑣 𝑊𝑣
𝑊ℎ 𝑊ℎ 𝑊ℎ
𝑊𝑣 𝑊𝑣 𝑊𝑣
𝑊𝑣
Page 29
𝜀1 = absolute emissivity of busbar
𝜀2 = absolute emissivity of the enclosure inner surface
Figure 3.6 Radiation Heat Loss from a Busbar Section
Opposing busbar faces have no radiation heat dissipation as it is assumed (Assumption
7) their temperatures are approximately equal.
𝑊𝑟 𝑊𝑟 𝑊𝑟
𝑊𝑟 𝑊𝑟 𝑊𝑟
𝑊𝑟 𝑊𝑟
Page 30
3.4.3 Heat Absorbed by Enclosure
Heat generated by the busbars is absorbed by the enclosure via the following methods:
1. Convection and
2. Radiation.
The rate at which heat is absorbed by the enclosure is equal to the rate at which
electrical power is generated by the busbars, and is described in Equation 3.10 below.
𝑃 = 𝑞𝑐𝑜𝑛𝑣1 + 𝑞𝑟𝑎𝑑1 (3.10)
where 𝑃 = power dissipated per unit length of busbar, W
𝑞𝑐𝑜𝑛𝑣1 = heat dissipated due to convection, W
𝑞𝑟𝑎𝑑1 = heat dissipated due to radiation, W
3.4.3.1 Enclosure Heat Absorbed by Convection
The rate at which heat is transferred via convection within a cavity (dissipated by the
busbars, absorbed via the enclosure) depends on the shape, size and temperature
difference between surfaces. Convection heat absorbed by the enclosure differs from
vertical to horizontal surfaces, as described in Equation 3.11 below.
𝑞𝑐𝑜𝑛𝑣1 = ℎ𝑣1𝐴𝑣 + ℎ𝑡1𝐴𝑡 (3.11)
Page 31
where ℎ𝑣1 = average vertical convection heat transfer coefficient, W/m2.K
ℎ𝑡1 = average top convection heat transfer coefficient, W/m2.K
𝐴𝑣 = vertical surface area of enclosure, m2
𝐴𝑡 = top surface area of enclosure, m2
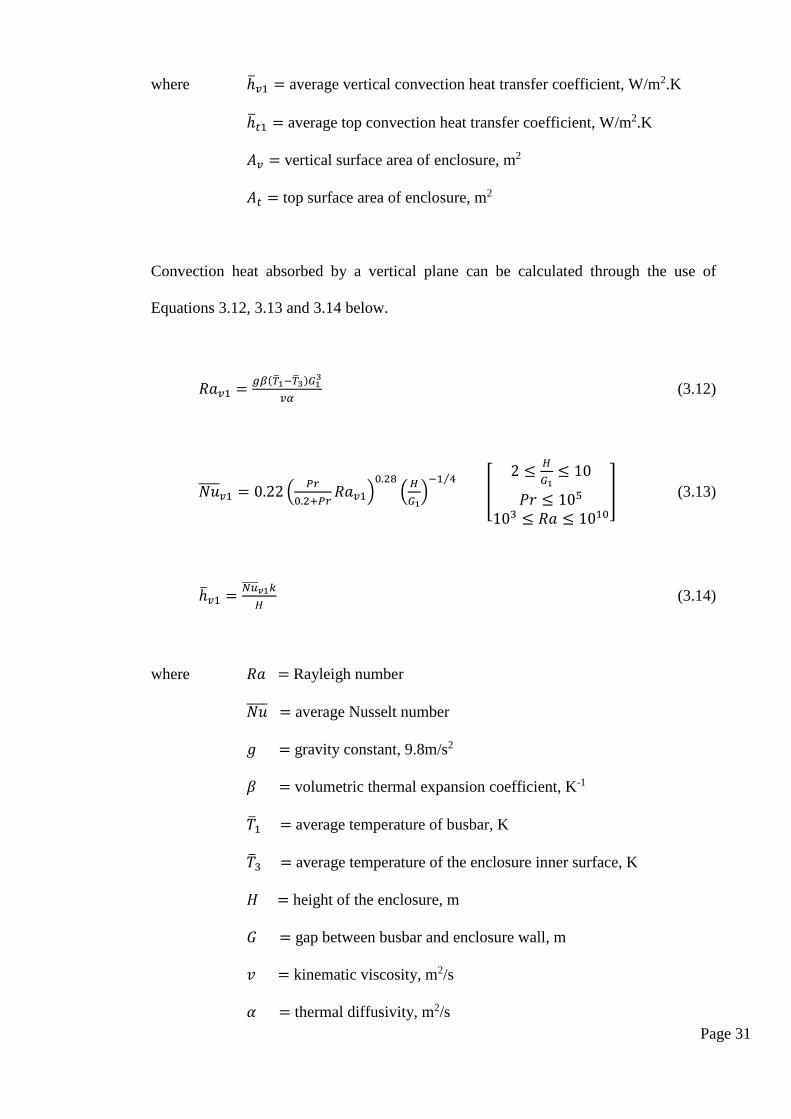
Convection heat absorbed by a vertical plane can be calculated through the use of
Equations 3.12, 3.13 and 3.14 below.
𝑅𝑎𝑣1 =𝑔𝛽(1−3)𝐺1
3
𝑣𝛼 (3.12)
𝑁𝑢 𝑣1 = 0.22 (
𝑃𝑟
0.2+𝑃𝑟𝑅𝑎𝑣1)
0.28
(𝐻
𝐺1)
−1 4⁄
[
2 ≤𝐻
𝐺1≤ 10
𝑃𝑟 ≤ 105
103 ≤ 𝑅𝑎 ≤ 1010
] (3.13)
ℎ𝑣1 =𝑁𝑢 𝑣1𝑘
𝐻 (3.14)
where 𝑅𝑎 = Rayleigh number
𝑁𝑢 = average Nusselt number
𝑔 = gravity constant, 9.8m/s2
𝛽 = volumetric thermal expansion coefficient, K-1
1 = average temperature of busbar, K
3 = average temperature of the enclosure inner surface, K
𝐻 = height of the enclosure, m
𝐺 = gap between busbar and enclosure wall, m
𝑣 = kinematic viscosity, m2/s
𝛼 = thermal diffusivity, m2/s
Page 32
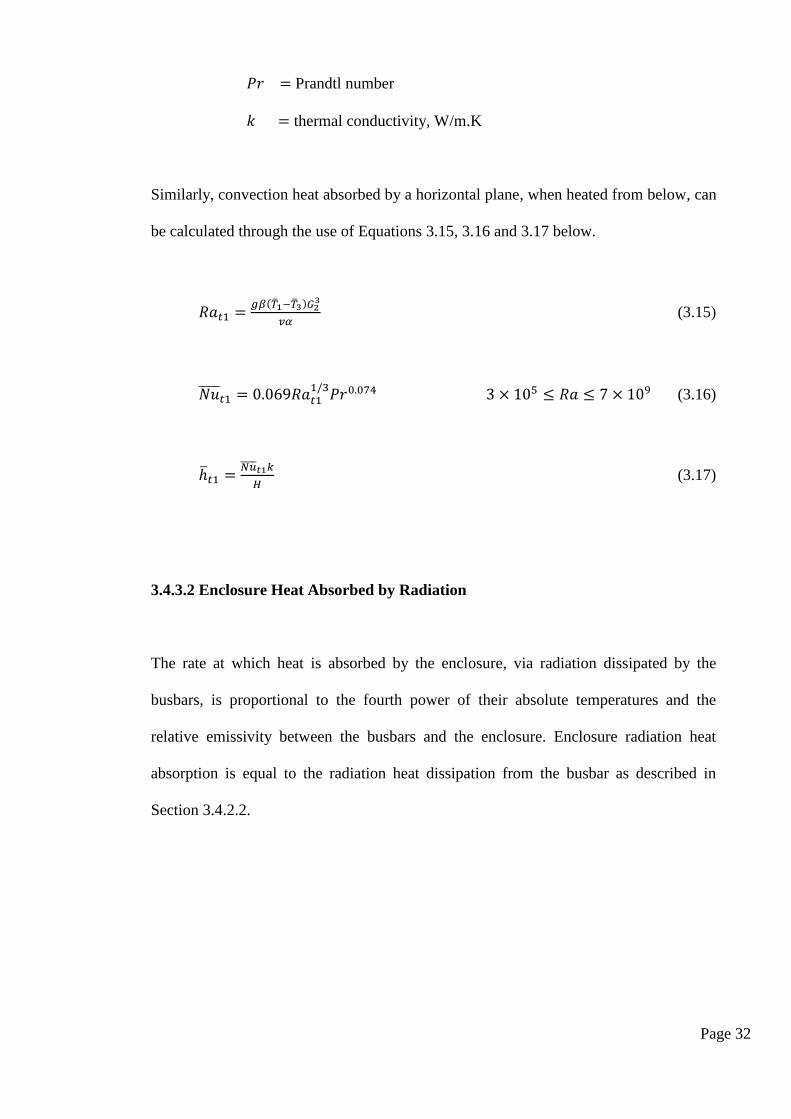
𝑃𝑟 = Prandtl number
𝑘 = thermal conductivity, W/m.K
Similarly, convection heat absorbed by a horizontal plane, when heated from below, can
be calculated through the use of Equations 3.15, 3.16 and 3.17 below.
𝑅𝑎𝑡1 =𝑔𝛽(1−3)𝐺2
3
𝑣𝛼 (3.15)
𝑁𝑢 𝑡1 = 0.069𝑅𝑎𝑡1
1/3𝑃𝑟0.074 3 × 10⁵ ≤ 𝑅𝑎 ≤ 7 × 10⁹ (3.16)
ℎ𝑡1 =𝑁𝑢 𝑡1𝑘
𝐻 (3.17)
3.4.3.2 Enclosure Heat Absorbed by Radiation
The rate at which heat is absorbed by the enclosure, via radiation dissipated by the
busbars, is proportional to the fourth power of their absolute temperatures and the
relative emissivity between the busbars and the enclosure. Enclosure radiation heat
absorption is equal to the radiation heat dissipation from the busbar as described in
Section 3.4.2.2.
Page 33
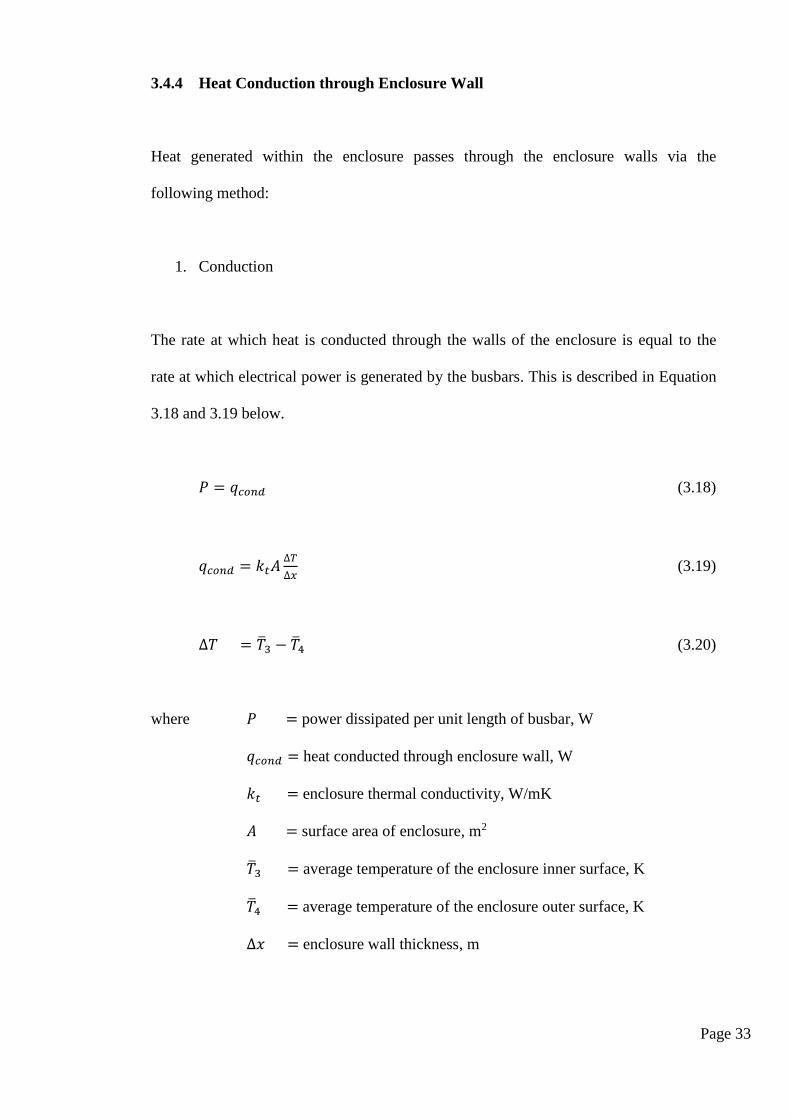
3.4.4 Heat Conduction through Enclosure Wall
Heat generated within the enclosure passes through the enclosure walls via the
following method:
1. Conduction
The rate at which heat is conducted through the walls of the enclosure is equal to the
rate at which electrical power is generated by the busbars. This is described in Equation
3.18 and 3.19 below.
𝑃 = 𝑞𝑐𝑜𝑛𝑑 (3.18)
𝑞𝑐𝑜𝑛𝑑 = 𝑘𝑡𝐴∆𝑇
∆𝑥 (3.19)
∆𝑇 = 3 − 4 (3.20)
where 𝑃 = power dissipated per unit length of busbar, W
𝑞𝑐𝑜𝑛𝑑 = heat conducted through enclosure wall, W
𝑘𝑡 = enclosure thermal conductivity, W/mK
𝐴 = surface area of enclosure, m2
3 = average temperature of the enclosure inner surface, K
4 = average temperature of the enclosure outer surface, K
∆𝑥 = enclosure wall thickness, m
Page 34
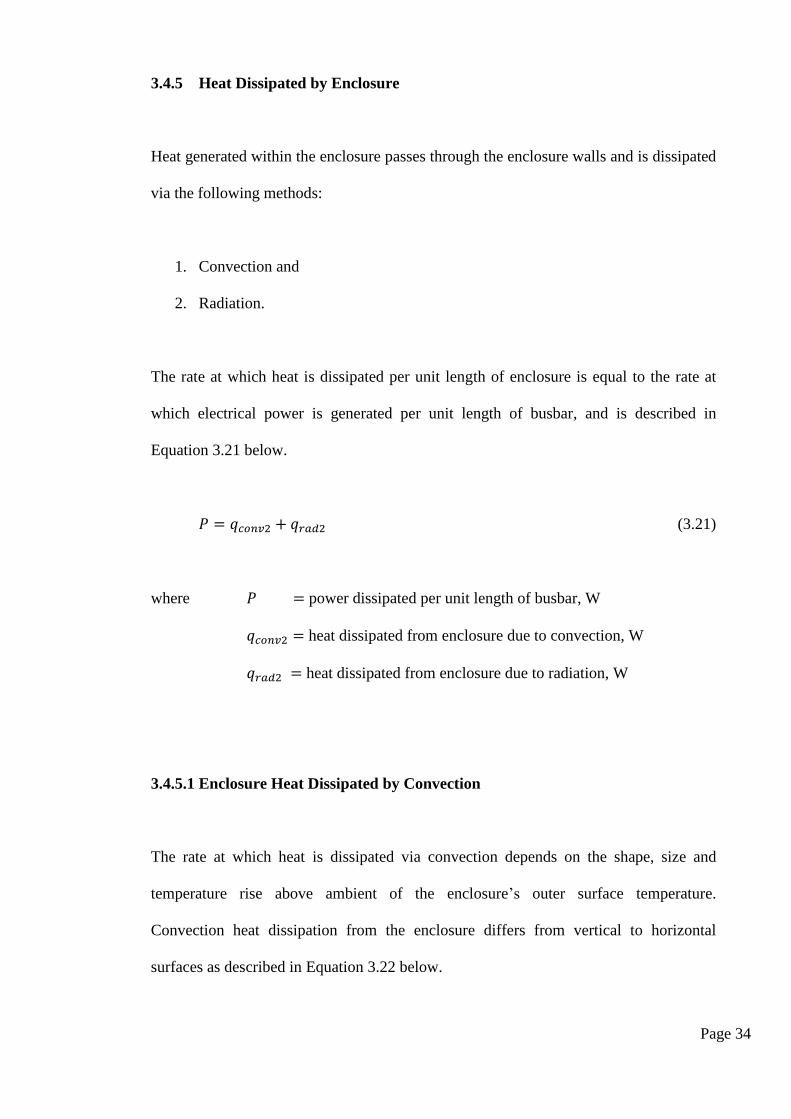
3.4.5 Heat Dissipated by Enclosure
Heat generated within the enclosure passes through the enclosure walls and is dissipated
via the following methods:
1. Convection and
2. Radiation.
The rate at which heat is dissipated per unit length of enclosure is equal to the rate at
which electrical power is generated per unit length of busbar, and is described in
Equation 3.21 below.
𝑃 = 𝑞𝑐𝑜𝑛𝑣2 + 𝑞𝑟𝑎𝑑2 (3.21)
where 𝑃 = power dissipated per unit length of busbar, W
𝑞𝑐𝑜𝑛𝑣2 = heat dissipated from enclosure due to convection, W
𝑞𝑟𝑎𝑑2 = heat dissipated from enclosure due to radiation, W
3.4.5.1 Enclosure Heat Dissipated by Convection
The rate at which heat is dissipated via convection depends on the shape, size and
temperature rise above ambient of the enclosure’s outer surface temperature.
Convection heat dissipation from the enclosure differs from vertical to horizontal
surfaces as described in Equation 3.22 below.
Page 35
𝑞𝑐𝑜𝑛𝑣2 = ℎ𝑣2𝐴𝑣 + ℎ𝑡2𝐴𝑡 (3.22)
where ℎ𝑣2 = vertical average convection heat transfer coefficient, W/m2.K
ℎ𝑡2 = top average convection heat transfer coefficient, W/m2.K
𝐴𝑣 = vertical surface area of enclosure, m2
𝐴𝑡 = top surface area of enclosure, m2
Convection heat dissipation from a vertical plane can be calculated through the use of
Equations 3.23, 3.24 and 3.25 below.
𝑅𝑎𝑣2 =𝑔𝛽(4−𝑇5)𝐻3
𝑣𝛼 (3.23)
𝑁𝑢 𝑣2 = 0.68 +
0.670𝑅𝑎𝑣21/4
[1+(0.492/𝑃𝑟)9/16]4/9 𝑅𝑎𝑣2 ≤ 109 (3.24)
ℎ𝑣2 =𝑁𝑢 𝑣2𝑘
𝐻 (3.25)
where 𝑅𝑎 = Rayleigh number
𝑁𝑢 = average Nusselt number
𝑔 = gravity constant, 9.8m/s2
𝛽 = volumetric thermal expansion coefficient, K-1
4 = average temperature of the enclosure outer surface, K
𝑇5 = temperature of the enclosure surroundings, K
𝐻 = height of the enclosure, m
𝑣 = kinematic viscosity, m2/s
Page 36
𝛼 = thermal diffusivity, m2/s
𝑃𝑟 = Prandtl number
𝑘 = thermal conductivity, W/m.K
Similarly, convection heat dissipation from the top surface of a horizontal plane can be
calculated through the use of Equations 3.26 below.
𝑁𝑢 𝑡2 =
ℎ𝑡2𝐿𝑐
𝑘= 0.54𝑅𝑎𝑡2
1/4 (3.26)
𝐿𝑐 = 𝐴𝑡 𝑃⁄ (3.27)
where 𝐿𝑐 = horizontal plane Nusselt correlation number
𝑃 = enclosure top surface area perimeter, m
3.4.5.2 Enclosure Heat Dissipated by Radiation
The rate at which the enclosure’s heat is dissipated into its surroundings via radiation is
proportional to the temperature difference between the enclosure and its surroundings,
as described in Equation 3.28 and 3.29 below.
𝑞𝑟𝑎𝑑2 = ℎ𝑟𝑎𝑑𝐴 (3.28)
ℎ𝑟𝑎𝑑2 = 𝜀𝜎(4 + 𝑇5)(42 + 𝑇5
2) (3.29)
Page 37
where ℎ𝑟𝑎𝑑2 = average radiation heat transfer coefficient, W/m2.K
𝐴 = surface area of enclosure, m2
𝜀 = enclosure surface emissivity
𝜎 = Stefan-Boltzmann constant, 5.67x10⁻⁸W/m2.K4
4 = average temperature of the enclosure outer surface, K
𝑇5 = temperature of the enclosure surroundings, K
The enclosure surface emissivity is determined by the enclosure surface finish. A
surface finish emissivity closer to that of a black body will dissipate more heat via
radiation into its surroundings.
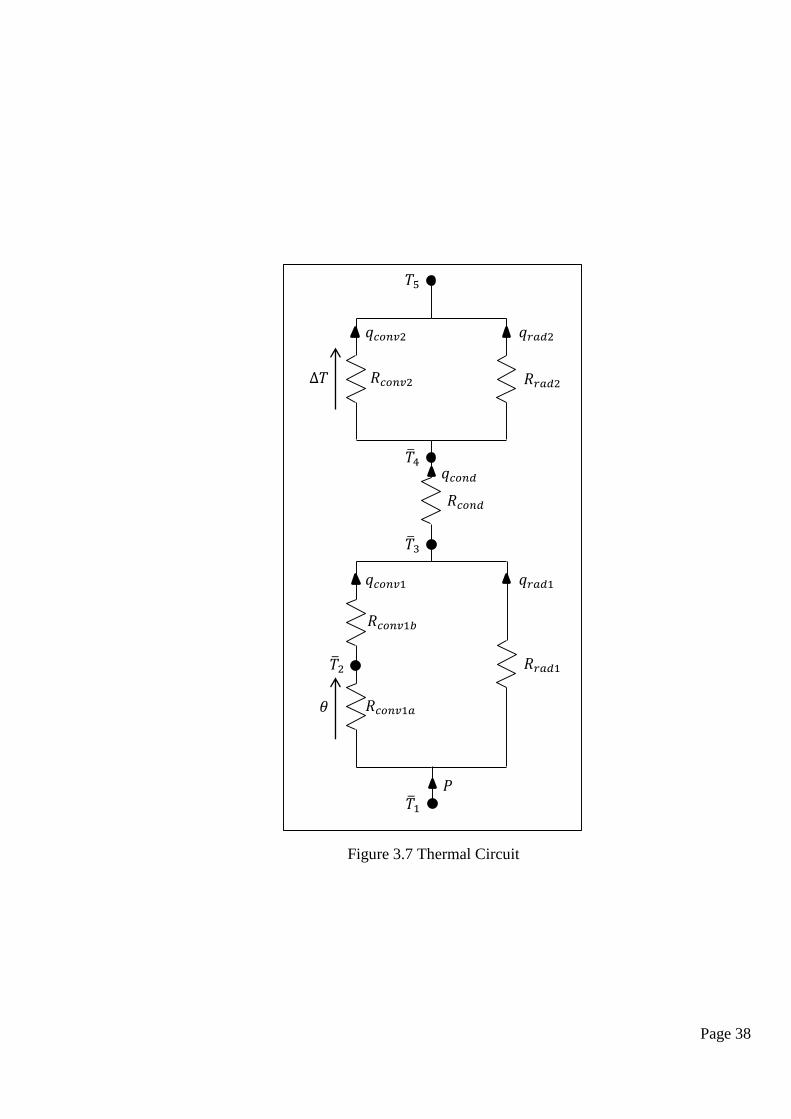
3.4.6 Thermal Circuit of the Bus Zone System
Thermal resistances are the reciprocal multiplication of the heat transfer coefficient and
the relative surface area, as shown in Equation 3.30 and 3.31. The convection
components of the system consist of vertical and horizontal components which are in
parallel, as shown in Equation 3.32. Combining Equations 3.01 to 3.32, a thermal circuit
of the entire bus zone system can be developed, as depicted in Figure 3.7.
𝑅𝑐𝑜𝑛𝑣2𝑣 = 1 ℎ𝑣2𝐴𝑣⁄ (3.30)
𝑅𝑐𝑜𝑛𝑣2𝑡 = 1 ℎ𝑡2𝐴𝑡⁄ (3.31)
𝑅𝑐𝑜𝑛𝑣2 = 𝑅𝑐𝑜𝑛𝑣2𝑣//𝑅𝑐𝑜𝑛𝑣2𝑡 (3.32)
Page 38
𝑞𝑐𝑜𝑛𝑣1
𝑞𝑐𝑜𝑛𝑣2
𝑞𝑟𝑎𝑑1
𝑞𝑟𝑎𝑑2
𝑞𝑐𝑜𝑛𝑑 4
𝑇5
3
2
1
∆𝑇
𝜃
𝑃
𝑅𝑐𝑜𝑛𝑣2
𝑅𝑐𝑜𝑛𝑣1𝑏
𝑅𝑟𝑎𝑑1
𝑅𝑐𝑜𝑛𝑑
𝑅𝑟𝑎𝑑2
𝑅𝑐𝑜𝑛𝑣1𝑎
Figure 3.7 Thermal Circuit
Page 39
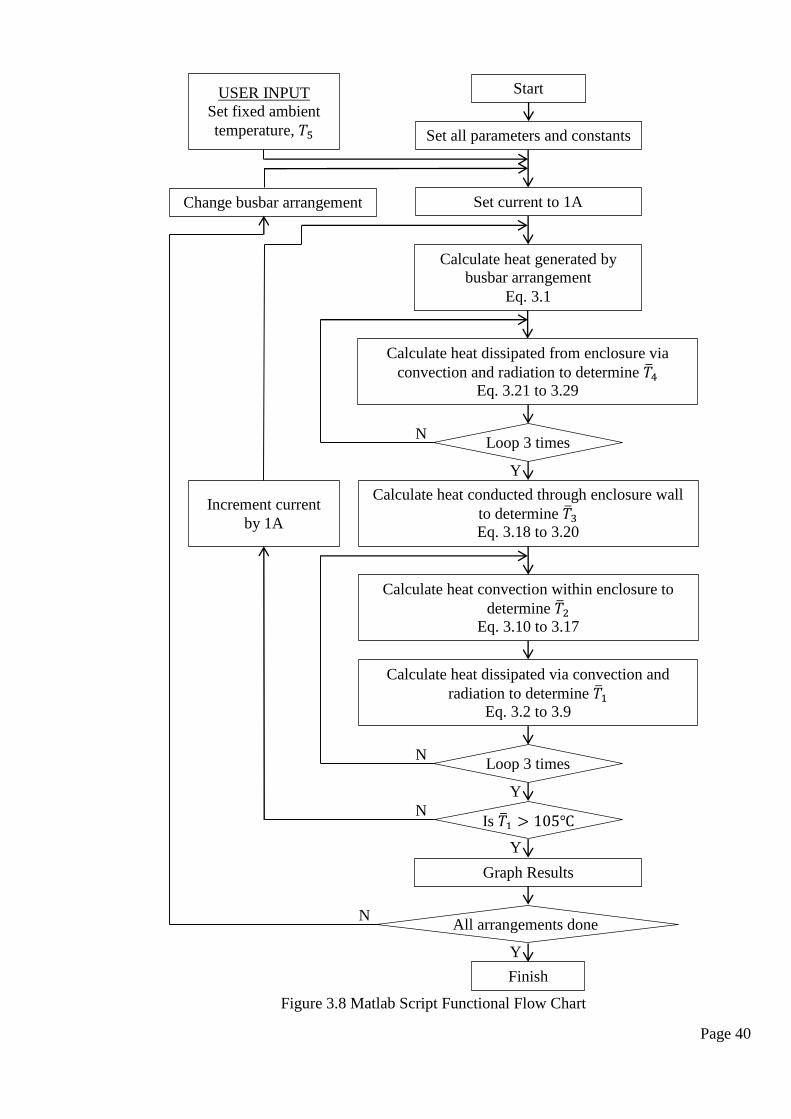
3.5 Matlab Script
The Matlab Script program is designed to simulate and model the operating temperature
of current carrying copper busbar conductors in the specified bus zone enclosure
detailed in Section 3.2. The Matlab Script is written in functional blocks with the
temperature and heat energy as the main inputs and outputs. The functional blocks are
in line with the sub-sections of Section 3.4, Mathematical Methods of Temperature
Calculation:
1. Heat Generated by Busbars
2. Heat Dissipated by Enclosure
3. Heat Conduction through Enclosure Wall
4. Heat Absorbed by Enclosure
5. Heat Dissipated by Busbars
A function flow chart in Figure 3.8 illustrates how each functional block interacts with
each other. Looping is introduced around functional blocks due to approximations made
on the first pass through. Program looping allows for large amounts of data to be
generated automatically, without the need for user input for current settings or busbar
arrangements. A full copy of the Matlab Script can be found in Appendix B.
All constants were gained from the ‘Fundamentals of Heat and Mass Transfer’ by
Incropera publication and the resistances of the busbars were provided in
AS 600890:2009. Parameters are specific to the enclosure or busbar dimensions
determined from Section 3.2.
Page 40
Start
Set all parameters and constants
Set current to 1A
USER INPUT
Set fixed ambient
temperature, 𝑇5
Calculate heat generated by
busbar arrangement
Eq. 3.1
Calculate heat dissipated from enclosure via
convection and radiation to determine 4
Eq. 3.21 to 3.29
Calculate heat conducted through enclosure wall
to determine 3
Eq. 3.18 to 3.20
Calculate heat convection within enclosure to
determine 2
Eq. 3.10 to 3.17
Calculate heat dissipated via convection and
radiation to determine 1
Eq. 3.2 to 3.9
Loop 3 times
Is 1 > 105
All arrangements done
Change busbar arrangement
Increment current
by 1A
Loop 3 times
Graph Results
Finish
N
N
N
N
Y
Y
Y
Y
Figure 3.8 Matlab Script Functional Flow Chart
Page 41
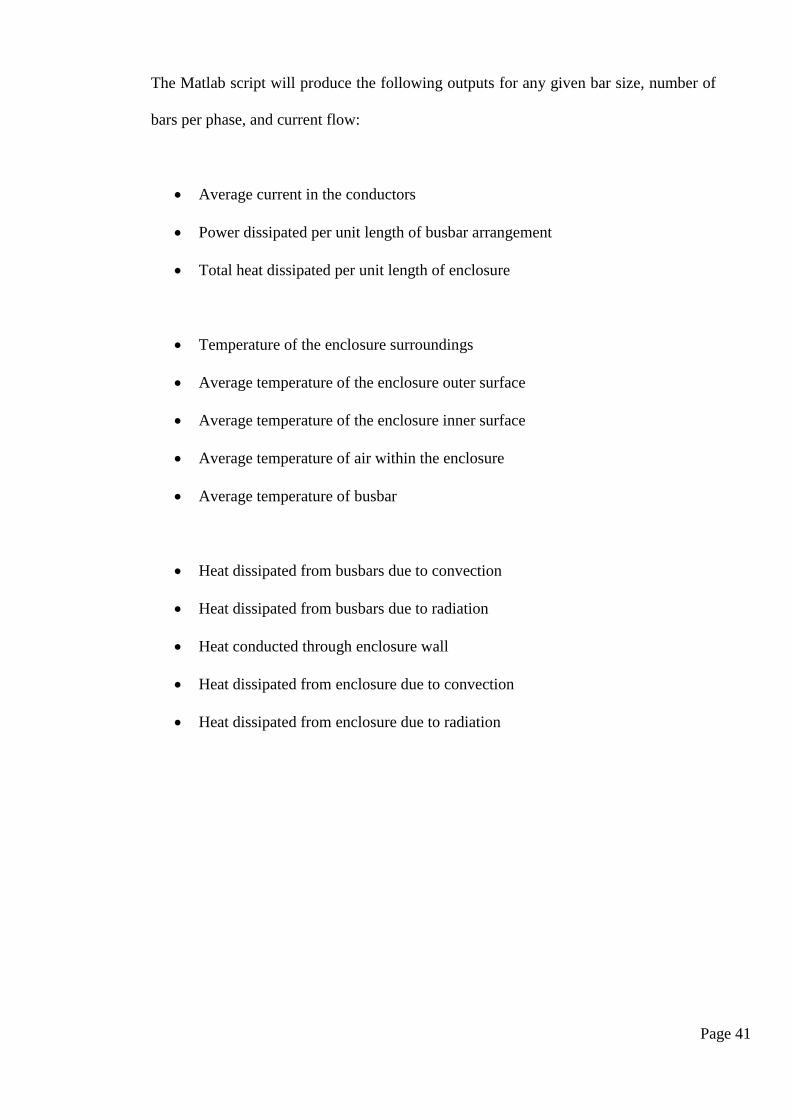
The Matlab script will produce the following outputs for any given bar size, number of
bars per phase, and current flow:
Average current in the conductors
Power dissipated per unit length of busbar arrangement
Total heat dissipated per unit length of enclosure
Temperature of the enclosure surroundings
Average temperature of the enclosure outer surface
Average temperature of the enclosure inner surface
Average temperature of air within the enclosure
Average temperature of busbar
Heat dissipated from busbars due to convection
Heat dissipated from busbars due to radiation
Heat conducted through enclosure wall
Heat dissipated from enclosure due to convection
Heat dissipated from enclosure due to radiation
Page 42
3.6 Alternate Methods
The following methods will be utilised to produce results in the analysis of accuracy of
the Matlab Script developed for this project.
3.6.1 AS 3000:1991 Method
AS/NZS 3000:1991 SAA Wiring Rules (AS 3000:1991) is a superseded Australian
Standard that provides a means to calculate the current carrying capacity of copper and
aluminium busbars. AS 3000:1991 provides a table of current carrying capacities of
single and multiple busbars in a freely exposed, draught-free environment. The standard
also provides tables of de-rating factors to be applied to the current carrying capacity of
a selected busbar based on:
1. Ambient Temperature,
2. Temperature Rise and
3. (Busbar cross sectional area / enclosure cross sectional area) Ratio.
This method was removed by subsequent editions of AS3000 in 2000 and 2007.
The method provided in AS 3000:1991 is not a method for calculating the temperature
of the busbars, which is the aim of this project. This method assumes the bars are at a
specified operating temperature with a given ambient temperature, and provides an
estimated maximum current carrying capacity of the busbar arrangement. However, the
estimated current carrying capacity determined from the AS3000:1991 method for a
Page 43
given temperate can be compared with the calculated currents at the same temperatures
determined by the Matlab Script.
The following procedure is followed to determine a busbar arrangement current
carrying capacity using the AS3000:1991 method.
1. Select a busbar arrangement (e.g. 3 by 125x6.3mm copper busbars per phase and
1 by 125x6.3mm copper busbar for neutral)
2. Calculate the busbar cross sectional area (Busbar CSA).
3. Calculate the enclosure cross sectional area (Enclosure CSA).
4. Calculate the (Busbar CSA/ Enclosure CSA) ratio.
5. Determine the de-rating factor (read from Table C3 of AS 3000:1991) using the
above Busbar CSA/ Enclosure CSA ratio.
6. Determine the de-rating factor for a given ambient temperature and desired
temperature rise from Table C4 of AS 3000:1991.
7. Determine the free air current carrying capacity of the selected busbar
arrangement from Table C1 of AS 3000:1991.
8. Multiply the free air current carrying capacity by the two de-rating factors, to
determine the estimated current carrying capacity for the enclosure.
Page 44
3.6.2 AS 60890:2009 Method
AS/NZS 60890:2009 (AS 60890) is an Australian Standard whose objective is to
provide one possible method to determine the temperature rise of current carrying
copper busbar conductors. Where the temperature rise is verified through calculation of
extrapolated data, the Assembly is considered a Partially Type Tested Assembly
(PTTA).
AS 60890 provides tables detailing the maximum operating current and its power loss
for maximum temperature of the busbars and air temperature in the enclosure adjacent
to the bars. The standard also provides tables and figures containing variables to be
applied to the above values, to determine system compliance.
The following procedure is followed to determine a busbar arrangement current
carrying capacity using the AS 60890 method:
1. Select a busbar arrangement (e.g. 3 by 125x6.3mm copper busbars per phase and
1 by 125x6.3mm copper busbar for neutral).
2. Calculate the enclosure effective cooling surface area.
3. Determine enclosure distribution factor and constants from Table I to V and
Figures 3 to 8 of AS 60890.
4. Calculate the desired current carrying capacity and heat loss for the arrangement.
Page 45
5. Calculate the internal temperature rise of the air at mid-height of the enclosure.
6. Calculate the internal temperature rise of the air at the top of the enclosure.
7. Produce a characteristic curve graph showing the temperature rise of air inside
the enclosure.
8. Analyse if the temperature rises satisfy the requirements of AS 60890. If this is
not so, change the parameters and repeat the calculation.
Page 46
4 Results
4.1 Introduction
This Chapter presents the results for the four methods of calculating busbar operating
temperatures or current carrying capacities as describe in the previous Chapter. These
four methods are:
1. Matlab Script,
2. Type Test Certificate,
3. AS 3000:1991, and
4. AS 60890:2009.
This Chapter addresses Project Objectives 4 and 6. A summary of these objectives are
listed below:
4. Simulate and model in Matlab the temperature of copper busbars carrying
2500A in the specific bus zone and busbar arrangement.
6. Simulate and model in Matlab the temperature of copper busbars carrying
various currents in a specific bus zone, and with varying busbar arrangements.
Page 47
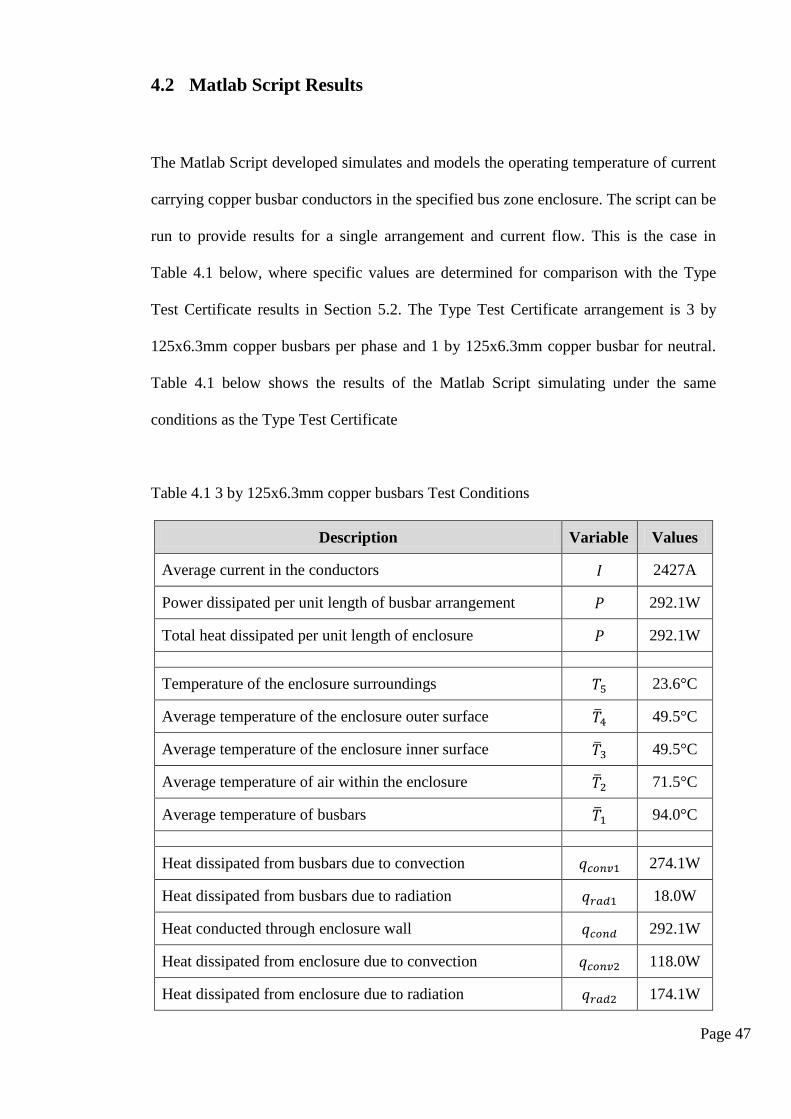
4.2 Matlab Script Results
The Matlab Script developed simulates and models the operating temperature of current
carrying copper busbar conductors in the specified bus zone enclosure. The script can be
run to provide results for a single arrangement and current flow. This is the case in
Table 4.1 below, where specific values are determined for comparison with the Type
Test Certificate results in Section 5.2. The Type Test Certificate arrangement is 3 by
125x6.3mm copper busbars per phase and 1 by 125x6.3mm copper busbar for neutral.
Table 4.1 below shows the results of the Matlab Script simulating under the same
conditions as the Type Test Certificate
Table 4.1 3 by 125x6.3mm copper busbars Test Conditions
Description Variable Values
Average current in the conductors 𝐼 2427A
Power dissipated per unit length of busbar arrangement 𝑃 292.1W
Total heat dissipated per unit length of enclosure 𝑃 292.1W
Temperature of the enclosure surroundings 𝑇5 23.6°C
Average temperature of the enclosure outer surface 4 49.5°C
Average temperature of the enclosure inner surface 3 49.5°C
Average temperature of air within the enclosure 2 71.5°C
Average temperature of busbars 1 94.0°C
Heat dissipated from busbars due to convection 𝑞𝑐𝑜𝑛𝑣1 274.1W
Heat dissipated from busbars due to radiation 𝑞𝑟𝑎𝑑1 18.0W
Heat conducted through enclosure wall 𝑞𝑐𝑜𝑛𝑑 292.1W
Heat dissipated from enclosure due to convection 𝑞𝑐𝑜𝑛𝑣2 118.0W
Heat dissipated from enclosure due to radiation 𝑞𝑟𝑎𝑑2 174.1W
Page 48
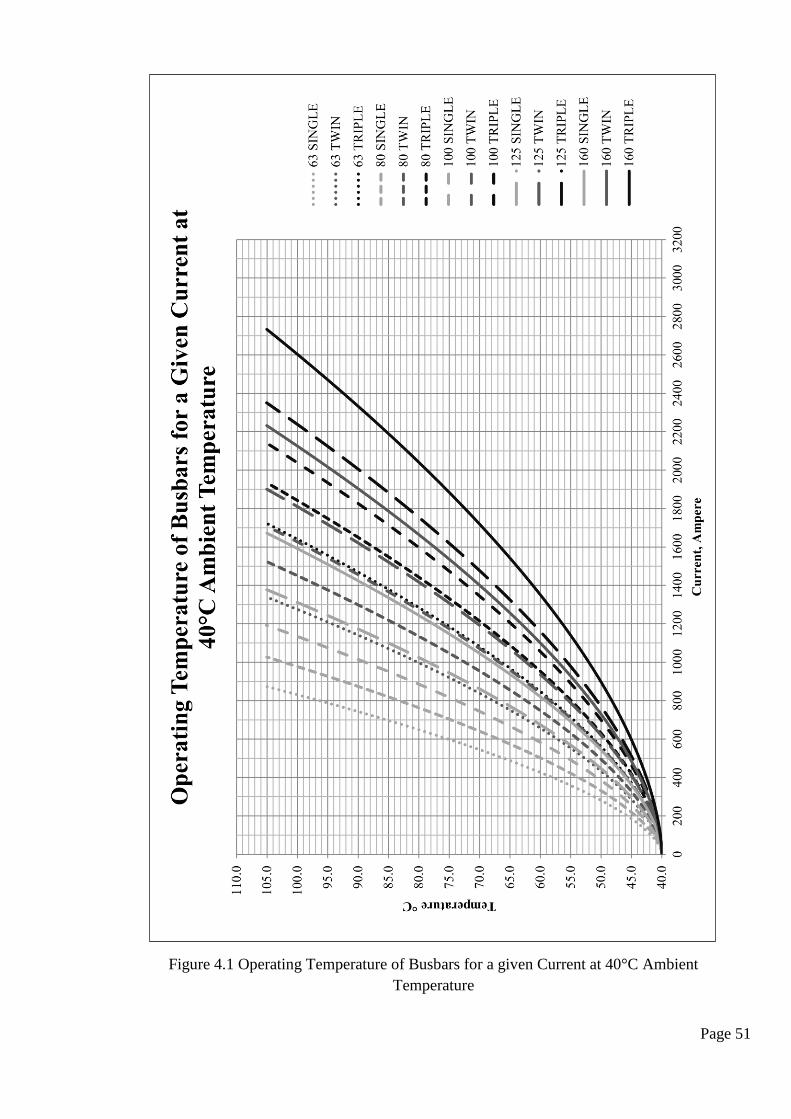
The script was run to provide the operating temperature of busbar arrangements for a
given ambient temperature and incrementing current flow. Current flow was
incremented by one ampere per iteration until the operating temperature exceeded
105°C. The procedure was then repeated for all of the following busbar arrangements:
Single, double and Triple by 63x6.3mm copper busbars per phase
Single, double and Triple by 80x6.3mm copper busbars per phase
Single, double and Triple by 100x6.3mm copper busbars per phase
Single, double and Triple by 125x6.3mm copper busbars per phase
Single, double and Triple by 160x6.3mm copper busbars per phase
For the following ambient temperatures:
40°C
35°C
30°C
25°C
20°C
Tables detailing the operating temperature of a busbar arrangement for a given current
and ambient temperature can be generated by using the Matlab Script in Appendix B.
Page 49
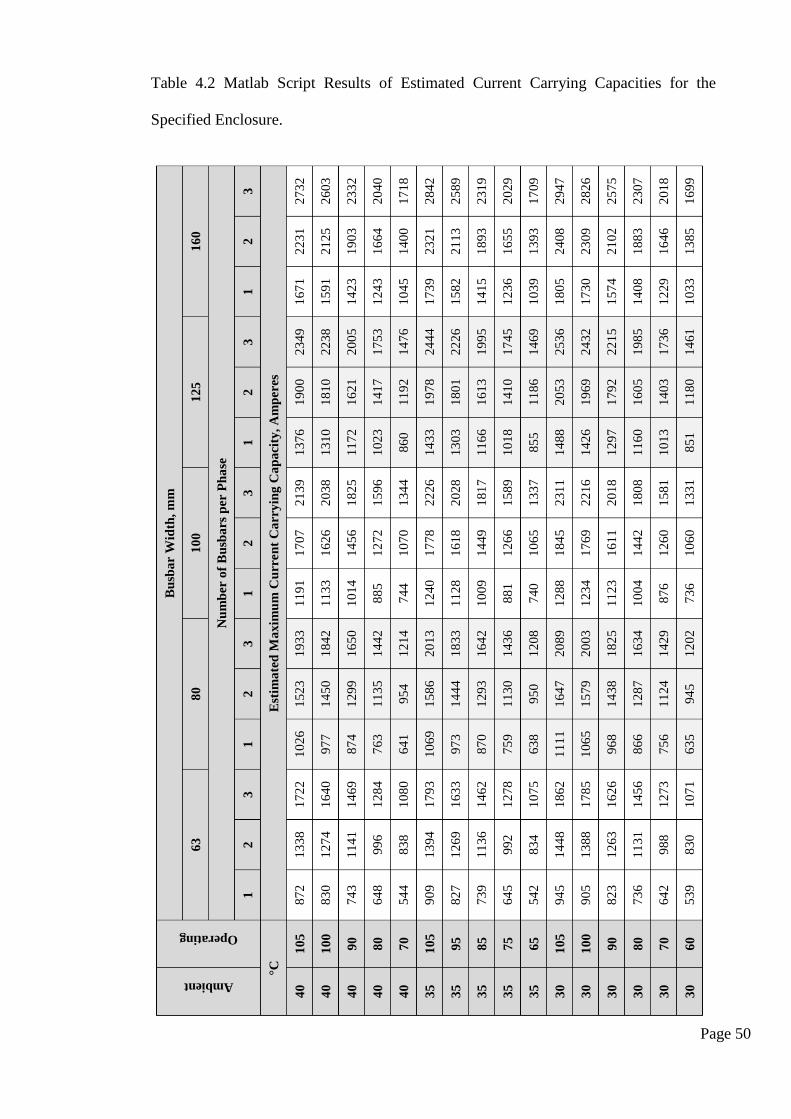
Switchboards are designed to current carrying capacities at specific ambient and
operating temperatures as determined by the manufacture. Table 4.2 below provides a
summary of the Matlab Script calculated current carrying capacities for a variety of
ambient and operating temperatures conditions.
The ambient and operating temperatures chosen in the table are the same combinations
available for calculation using the AS 3000:1991 method. A comparison between the
Matlab Script and the AS 3000:1991 method results is detailed is Section 5.3.
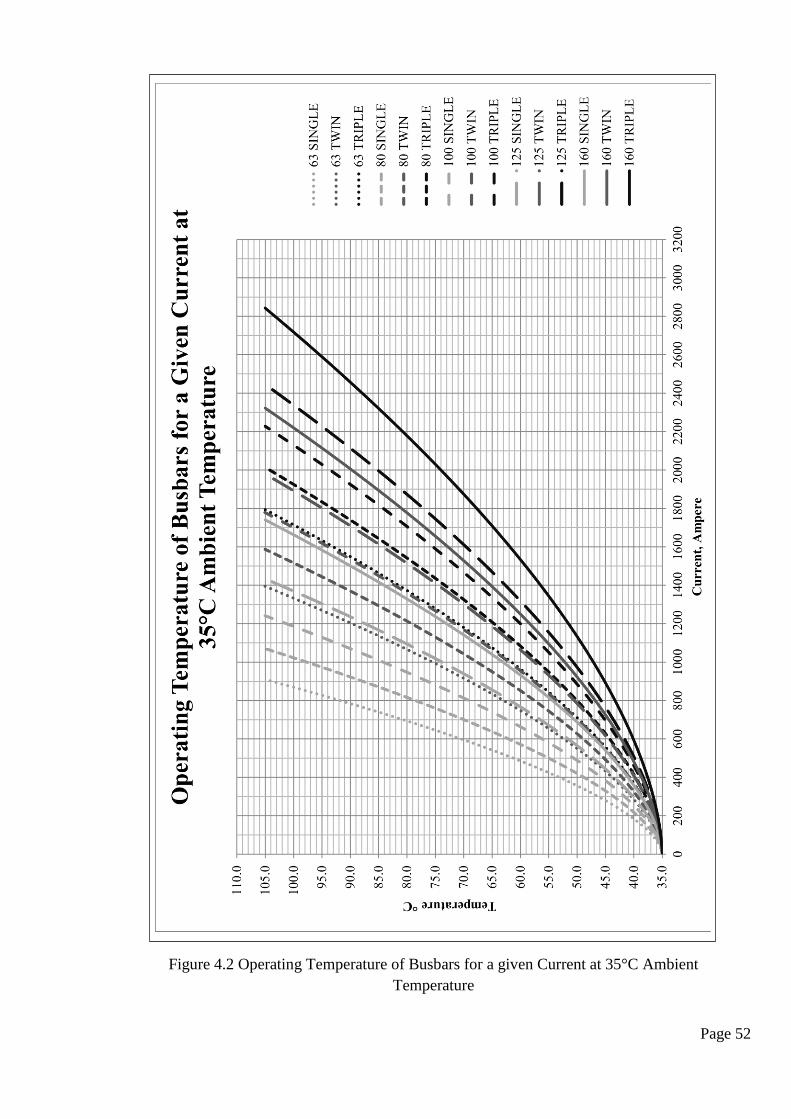
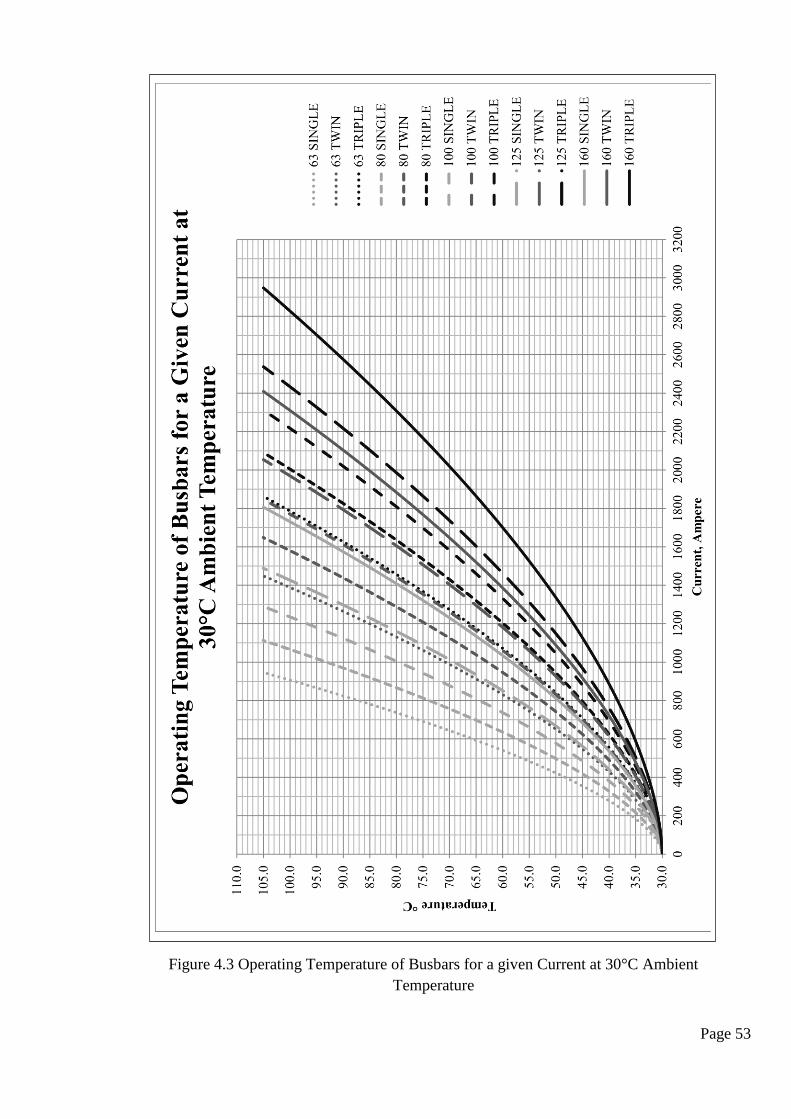
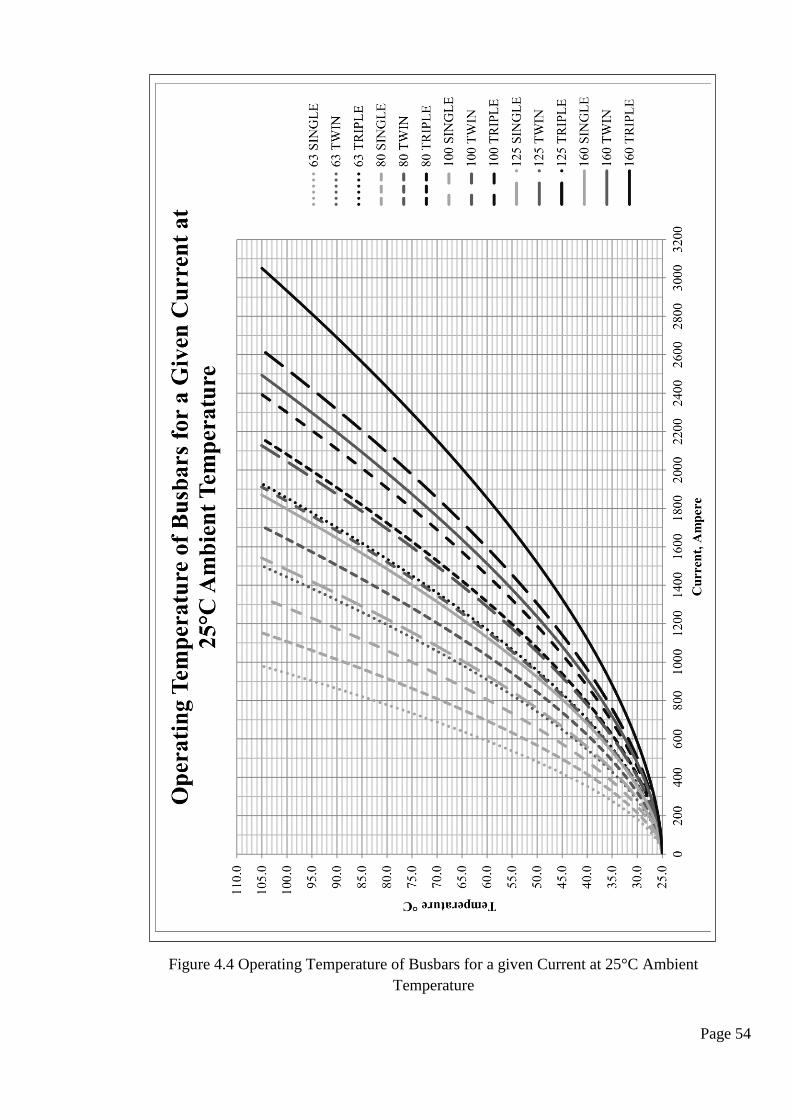
Following Table 4.2, Figure 4.1 to Figure 4.5 graphs the operating temperature of
busbar arrangements for a given current and ambient temperature up to a maximum
operating temperature of 105°C.
Page 50
Table 4.2 Matlab Script Results of Estimated Current Carrying Capacities for the
Specified Enclosure.
Ambient
Operating B
usb
ar
Wid
th,
mm
63
80
10
0
12
5
16
0
Nu
mb
er o
f B
usb
ars
per
Ph
ase
1
2
3
1
2
3
1
2
3
1
2
3
1
2
3
°C
Est
ima
ted
Ma
xim
um
Cu
rren
t C
arr
yin
g C
ap
aci
ty,
Am
pere
s
40
10
5
87
2
13
38
17
22
10
26
15
23
19
33
11
91
17
07
21
39
13
76
19
00
23
49
16
71
22
31
27
32
40
10
0
83
0
12
74
16
40
97
7
14
50
18
42
11
33
16
26
20
38
13
10
18
10
22
38
15
91
21
25
26
03
40
90
74
3
11
41
14
69
87
4
12
99
16
50
10
14
14
56
18
25
11
72
16
21
20
05
14
23
19
03
23
32
40
80
64
8
99
6
12
84
76
3
11
35
14
42
88
5
12
72
15
96
10
23
14
17
17
53
12
43
16
64
20
40
40
70
54
4
83
8
10
80
64
1
95
4
12
14
74
4
10
70
13
44
86
0
11
92
14
76
10
45
14
00
17
18
35
10
5
90
9
13
94
17
93
10
69
15
86
20
13
12
40
17
78
22
26
14
33
19
78
24
44
17
39
23
21
28
42
35
95
82
7
12
69
16
33
97
3
14
44
18
33
11
28
16
18
20
28
13
03
18
01
22
26
15
82
21
13
25
89
35
85
73
9
11
36
14
62
87
0
12
93
16
42
10
09
14
49
18
17
11
66
16
13
19
95
14
15
18
93
23
19
35
75
64
5
99
2
12
78
75
9
11
30
14
36
88
1
12
66
15
89
10
18
14
10
17
45
12
36
16
55
20
29
35
65
54
2
83
4
10
75
63
8
95
0
12
08
74
0
10
65
13
37
85
5
11
86
14
69
10
39
13
93
17
09
30
10
5
94
5
14
48
18
62
11
11
16
47
20
89
12
88
18
45
23
11
14
88
20
53
25
36
18
05
24
08
29
47
30
10
0
90
5
13
88
17
85
10
65
15
79
20
03
12
34
17
69
22
16
14
26
19
69
24
32
17
30
23
09
28
26
30
90
82
3
12
63
16
26
96
8
14
38
18
25
11
23
16
11
20
18
12
97
17
92
22
15
15
74
21
02
25
75
30
80
73
6
11
31
14
56
86
6
12
87
16
34
10
04
14
42
18
08
11
60
16
05
19
85
14
08
18
83
23
07
30
70
64
2
98
8
12
73
75
6
11
24
14
29
87
6
12
60
15
81
10
13
14
03
17
36
12
29
16
46
20
18
30
60
53
9
83
0
10
71
63
5
94
5
12
02
73
6
10
60
13
31
85
1
11
80
14
61
10
33
13
85
16
99
Page 51
Figure 4.1 Operating Temperature of Busbars for a given Current at 40°C Ambient
Temperature
Page 52
Figure 4.2 Operating Temperature of Busbars for a given Current at 35°C Ambient
Temperature
Page 53
Figure 4.3 Operating Temperature of Busbars for a given Current at 30°C Ambient
Temperature
Page 54
Figure 4.4 Operating Temperature of Busbars for a given Current at 25°C Ambient
Temperature
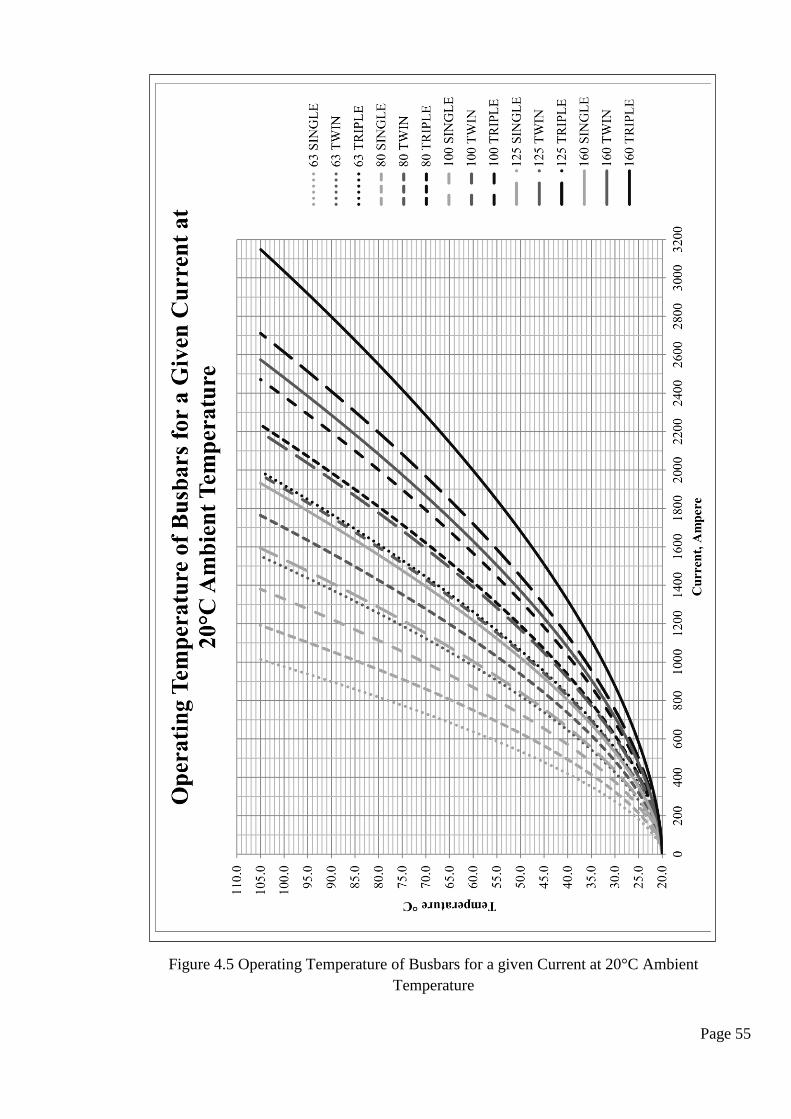
Page 55
Figure 4.5 Operating Temperature of Busbars for a given Current at 20°C Ambient
Temperature
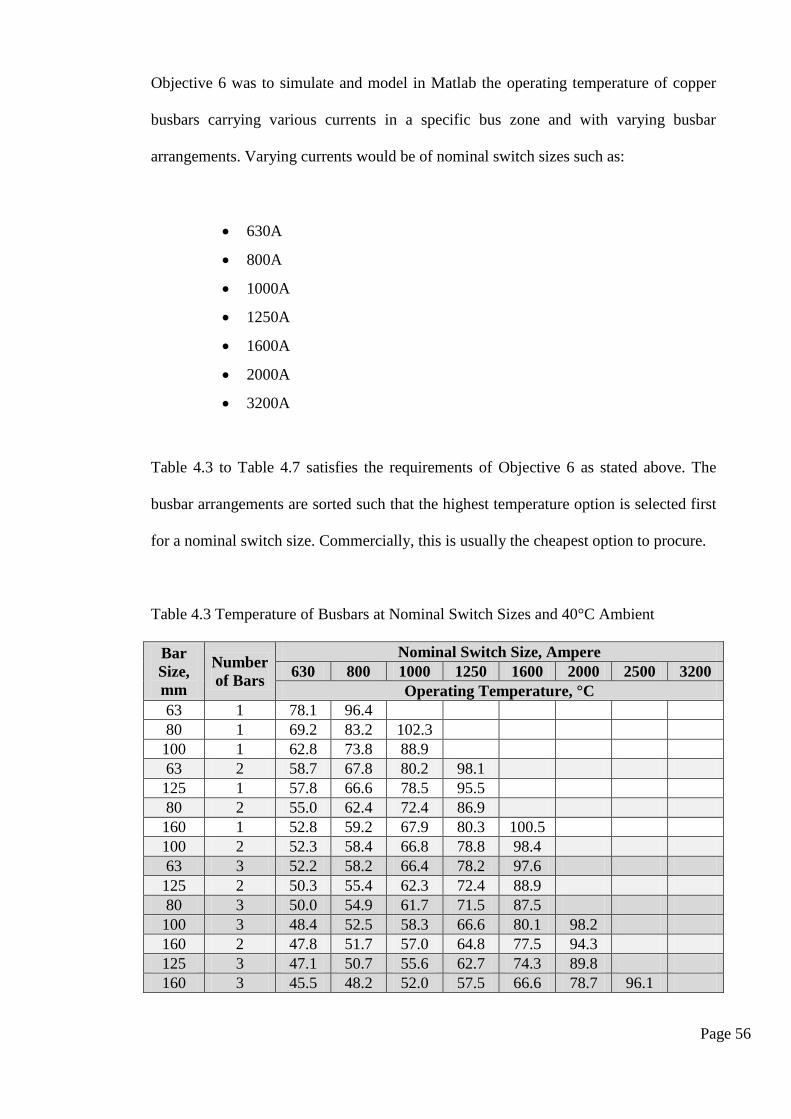
Page 56
Objective 6 was to simulate and model in Matlab the operating temperature of copper
busbars carrying various currents in a specific bus zone and with varying busbar
arrangements. Varying currents would be of nominal switch sizes such as:
630A
800A
1000A
1250A
1600A
2000A
3200A
Table 4.3 to Table 4.7 satisfies the requirements of Objective 6 as stated above. The
busbar arrangements are sorted such that the highest temperature option is selected first
for a nominal switch size. Commercially, this is usually the cheapest option to procure.
Table 4.3 Temperature of Busbars at Nominal Switch Sizes and 40°C Ambient
Bar
Size,
mm
Number
of Bars
Nominal Switch Size, Ampere
630 800 1000 1250 1600 2000 2500 3200
Operating Temperature, °C
63 1 78.1 96.4
80 1 69.2 83.2 102.3
100 1 62.8 73.8 88.9
63 2 58.7 67.8 80.2 98.1
125 1 57.8 66.6 78.5 95.5
80 2 55.0 62.4 72.4 86.9
160 1 52.8 59.2 67.9 80.3 100.5
100 2 52.3 58.4 66.8 78.8 98.4
63 3 52.2 58.2 66.4 78.2 97.6
125 2 50.3 55.4 62.3 72.4 88.9
80 3 50.0 54.9 61.7 71.5 87.5
100 3 48.4 52.5 58.3 66.6 80.1 98.2
160 2 47.8 51.7 57.0 64.8 77.5 94.3
125 3 47.1 50.7 55.6 62.7 74.3 89.8
160 3 45.5 48.2 52.0 57.5 66.6 78.7 96.1
Page 57
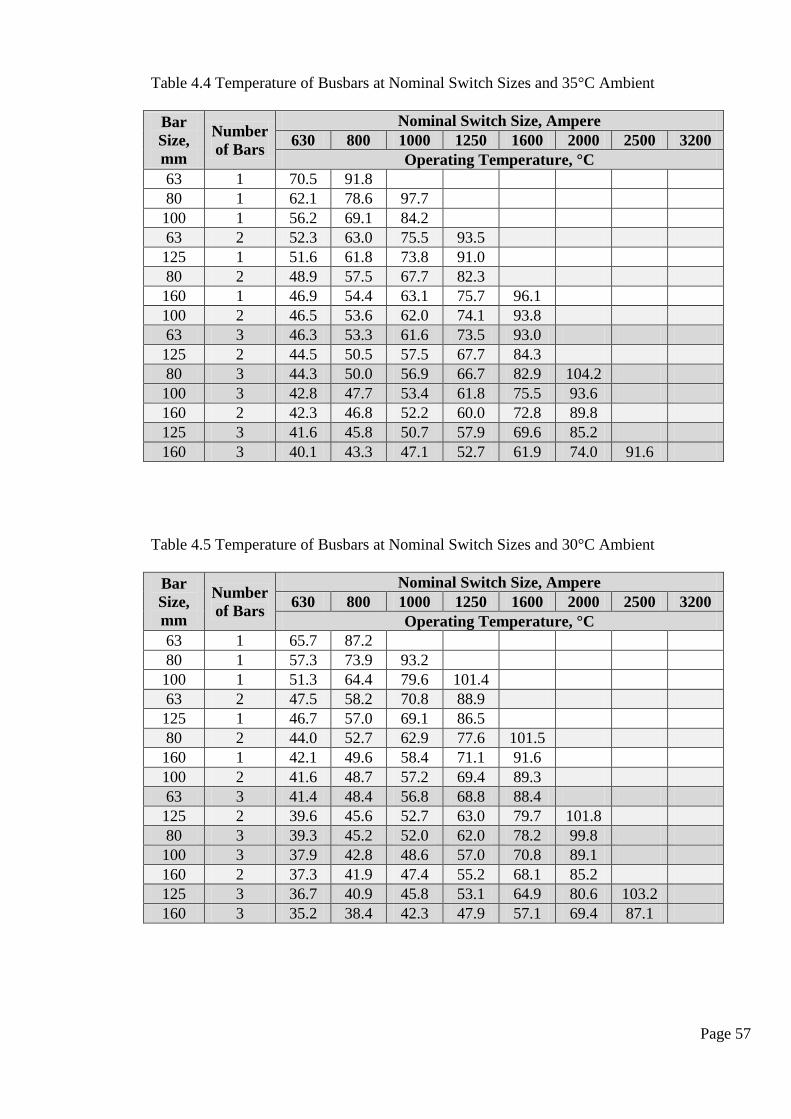
Table 4.4 Temperature of Busbars at Nominal Switch Sizes and 35°C Ambient
Bar
Size,
mm
Number
of Bars
Nominal Switch Size, Ampere
630 800 1000 1250 1600 2000 2500 3200
Operating Temperature, °C
63 1 70.5 91.8
80 1 62.1 78.6 97.7
100 1 56.2 69.1 84.2
63 2 52.3 63.0 75.5 93.5
125 1 51.6 61.8 73.8 91.0
80 2 48.9 57.5 67.7 82.3
160 1 46.9 54.4 63.1 75.7 96.1
100 2 46.5 53.6 62.0 74.1 93.8
63 3 46.3 53.3 61.6 73.5 93.0
125 2 44.5 50.5 57.5 67.7 84.3
80 3 44.3 50.0 56.9 66.7 82.9 104.2
100 3 42.8 47.7 53.4 61.8 75.5 93.6
160 2 42.3 46.8 52.2 60.0 72.8 89.8
125 3 41.6 45.8 50.7 57.9 69.6 85.2
160 3 40.1 43.3 47.1 52.7 61.9 74.0 91.6
Table 4.5 Temperature of Busbars at Nominal Switch Sizes and 30°C Ambient
Bar
Size,
mm
Number
of Bars
Nominal Switch Size, Ampere
630 800 1000 1250 1600 2000 2500 3200
Operating Temperature, °C
63 1 65.7 87.2
80 1 57.3 73.9 93.2
100 1 51.3 64.4 79.6 101.4
63 2 47.5 58.2 70.8 88.9
125 1 46.7 57.0 69.1 86.5
80 2 44.0 52.7 62.9 77.6 101.5
160 1 42.1 49.6 58.4 71.1 91.6
100 2 41.6 48.7 57.2 69.4 89.3
63 3 41.4 48.4 56.8 68.8 88.4
125 2 39.6 45.6 52.7 63.0 79.7 101.8
80 3 39.3 45.2 52.0 62.0 78.2 99.8
100 3 37.9 42.8 48.6 57.0 70.8 89.1
160 2 37.3 41.9 47.4 55.2 68.1 85.2
125 3 36.7 40.9 45.8 53.1 64.9 80.6 103.2
160 3 35.2 38.4 42.3 47.9 57.1 69.4 87.1
Page 58
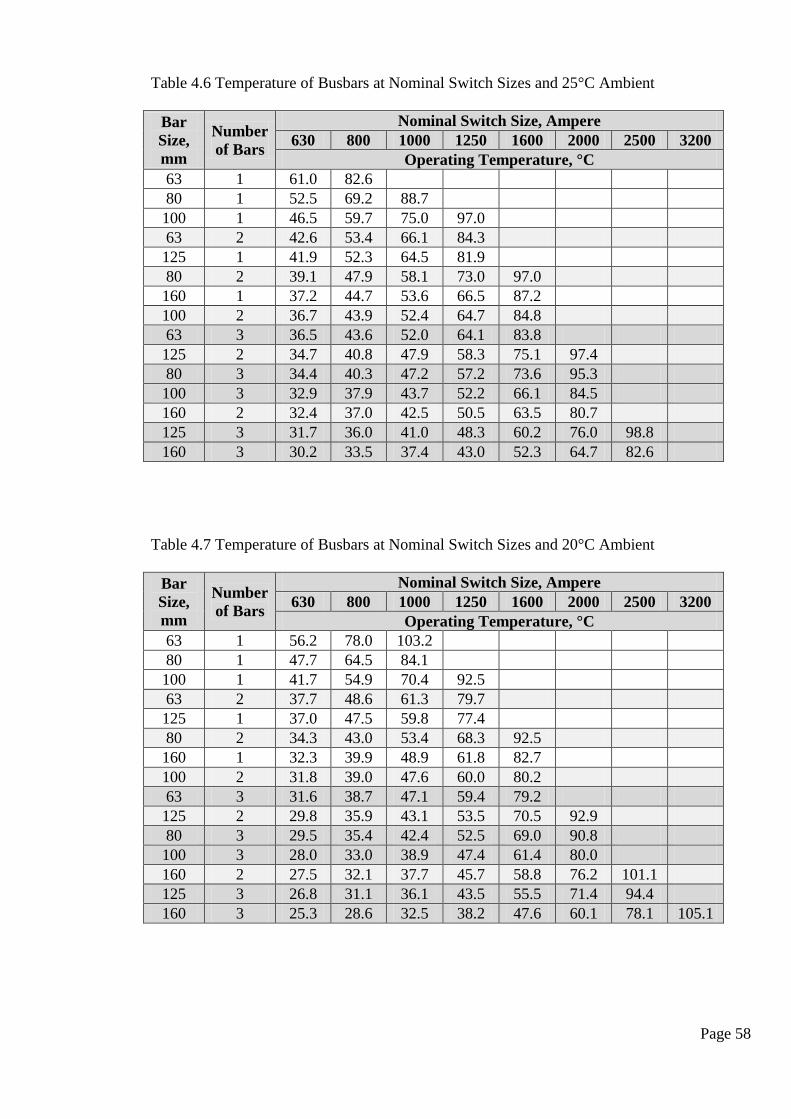
Table 4.6 Temperature of Busbars at Nominal Switch Sizes and 25°C Ambient
Bar
Size,
mm
Number
of Bars
Nominal Switch Size, Ampere
630 800 1000 1250 1600 2000 2500 3200
Operating Temperature, °C
63 1 61.0 82.6
80 1 52.5 69.2 88.7
100 1 46.5 59.7 75.0 97.0
63 2 42.6 53.4 66.1 84.3
125 1 41.9 52.3 64.5 81.9
80 2 39.1 47.9 58.1 73.0 97.0
160 1 37.2 44.7 53.6 66.5 87.2
100 2 36.7 43.9 52.4 64.7 84.8
63 3 36.5 43.6 52.0 64.1 83.8
125 2 34.7 40.8 47.9 58.3 75.1 97.4
80 3 34.4 40.3 47.2 57.2 73.6 95.3
100 3 32.9 37.9 43.7 52.2 66.1 84.5
160 2 32.4 37.0 42.5 50.5 63.5 80.7
125 3 31.7 36.0 41.0 48.3 60.2 76.0 98.8
160 3 30.2 33.5 37.4 43.0 52.3 64.7 82.6
Table 4.7 Temperature of Busbars at Nominal Switch Sizes and 20°C Ambient
Bar
Size,
mm
Number
of Bars
Nominal Switch Size, Ampere
630 800 1000 1250 1600 2000 2500 3200
Operating Temperature, °C
63 1 56.2 78.0 103.2
80 1 47.7 64.5 84.1
100 1 41.7 54.9 70.4 92.5
63 2 37.7 48.6 61.3 79.7
125 1 37.0 47.5 59.8 77.4
80 2 34.3 43.0 53.4 68.3 92.5
160 1 32.3 39.9 48.9 61.8 82.7
100 2 31.8 39.0 47.6 60.0 80.2
63 3 31.6 38.7 47.1 59.4 79.2
125 2 29.8 35.9 43.1 53.5 70.5 92.9
80 3 29.5 35.4 42.4 52.5 69.0 90.8
100 3 28.0 33.0 38.9 47.4 61.4 80.0
160 2 27.5 32.1 37.7 45.7 58.8 76.2 101.1
125 3 26.8 31.1 36.1 43.5 55.5 71.4 94.4
160 3 25.3 28.6 32.5 38.2 47.6 60.1 78.1 105.1
Page 59
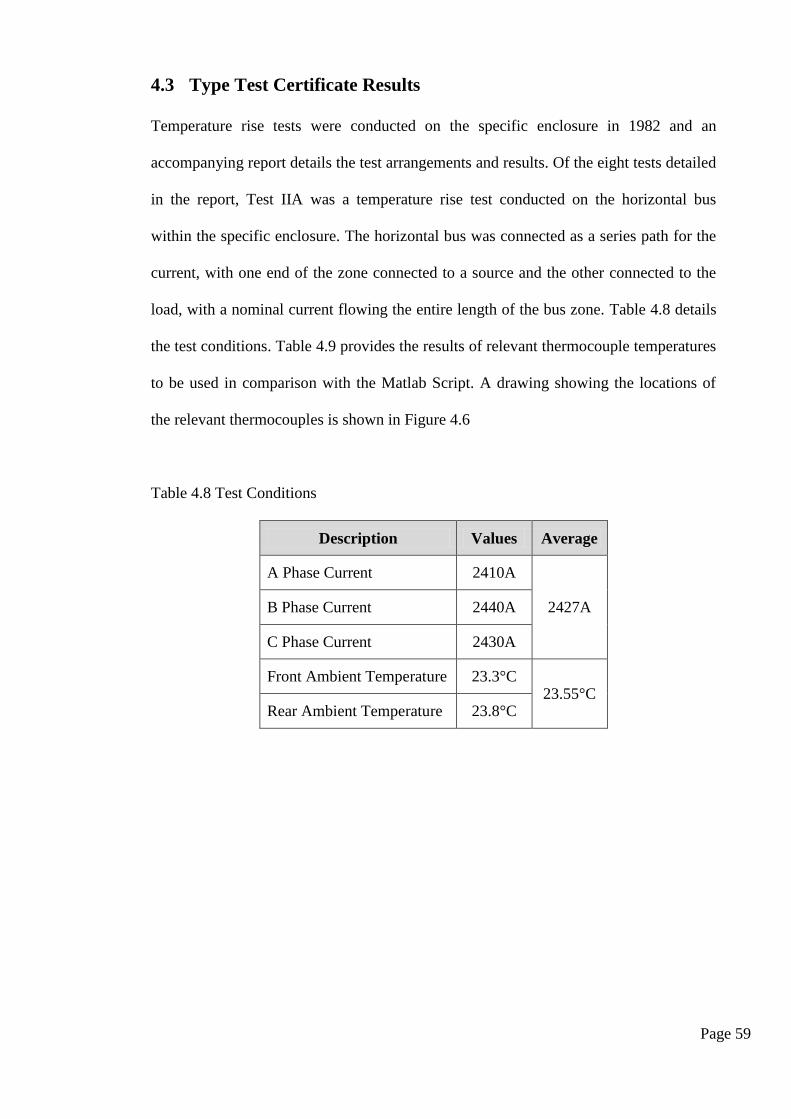
4.3 Type Test Certificate Results
Temperature rise tests were conducted on the specific enclosure in 1982 and an
accompanying report details the test arrangements and results. Of the eight tests detailed
in the report, Test IIA was a temperature rise test conducted on the horizontal bus
within the specific enclosure. The horizontal bus was connected as a series path for the
current, with one end of the zone connected to a source and the other connected to the
load, with a nominal current flowing the entire length of the bus zone. Table 4.8 details
the test conditions. Table 4.9 provides the results of relevant thermocouple temperatures
to be used in comparison with the Matlab Script. A drawing showing the locations of
the relevant thermocouples is shown in Figure 4.6
Table 4.8 Test Conditions
Description Values Average
A Phase Current 2410A
2427A B Phase Current 2440A
C Phase Current 2430A
Front Ambient Temperature 23.3°C 23.55°C
Rear Ambient Temperature 23.8°C
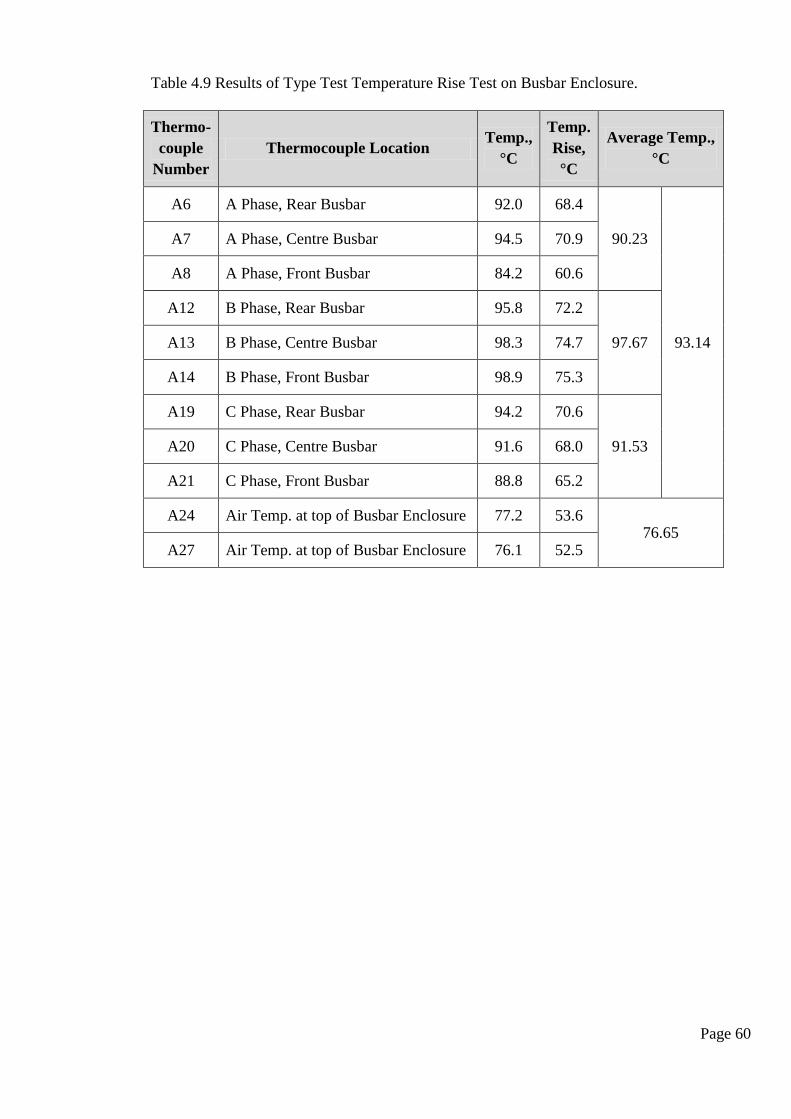
Page 60
Table 4.9 Results of Type Test Temperature Rise Test on Busbar Enclosure.
Thermo-
couple
Number
Thermocouple Location Temp.,
°C
Temp.
Rise,
°C
Average Temp.,
°C
A6 A Phase, Rear Busbar 92.0 68.4
90.23
93.14
A7 A Phase, Centre Busbar 94.5 70.9
A8 A Phase, Front Busbar 84.2 60.6
A12 B Phase, Rear Busbar 95.8 72.2
97.67 A13 B Phase, Centre Busbar 98.3 74.7
A14 B Phase, Front Busbar 98.9 75.3
A19 C Phase, Rear Busbar 94.2 70.6
91.53 A20 C Phase, Centre Busbar 91.6 68.0
A21 C Phase, Front Busbar 88.8 65.2
A24 Air Temp. at top of Busbar Enclosure 77.2 53.6 76.65
A27 Air Temp. at top of Busbar Enclosure 76.1 52.5
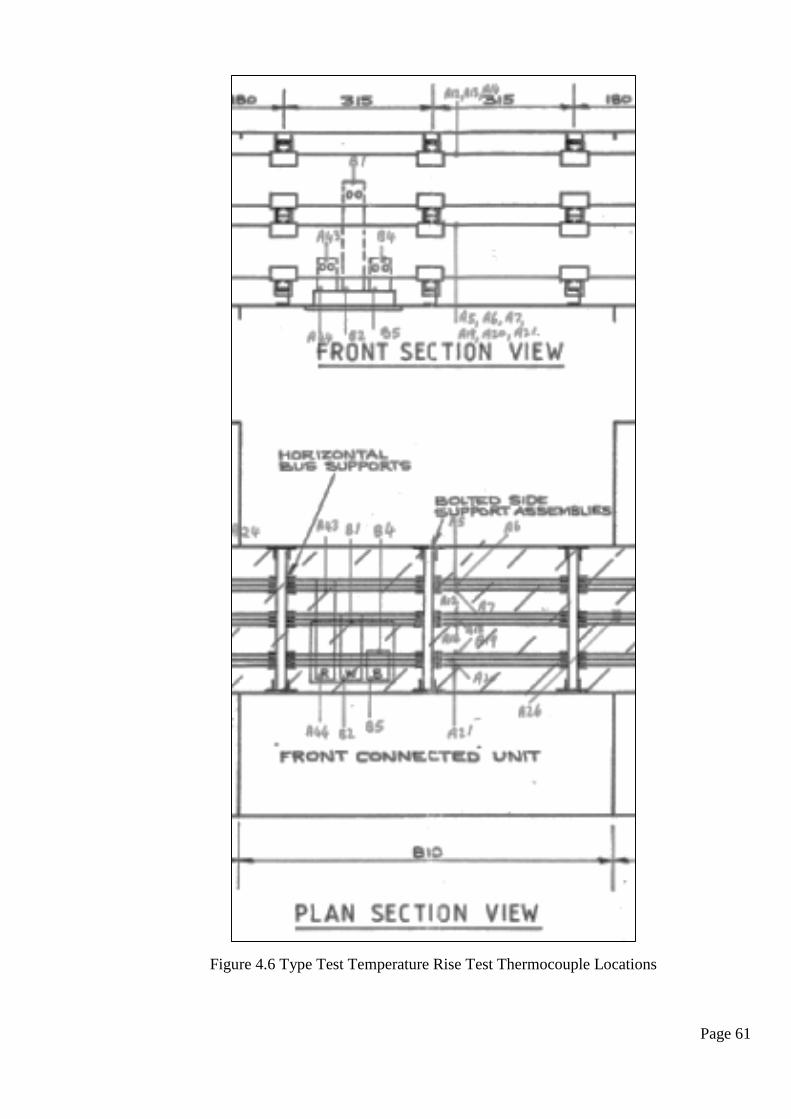
Page 61
Figure 4.6 Type Test Temperature Rise Test Thermocouple Locations

Page 62
4.4 AS 3000:1991 Results
The AS 3000:1991 method assumes that the busbars are at a specified operating
temperature, with a given ambient temperature, and provides an estimated maximum
current carrying capacity of the busbar arrangement.
The results of the estimated maximum current carrying capacities determined by the
AS 3000:1991 method is shown in Table 4.10. The workings for all the combinations
calculated with the AS 3000:1991 method can be found in Appendix C.

Page 63
Table 4.10 AS3000:1991 Results of Estimated Current Carrying Capacities for the
Specified Enclosure.
Ambient
Operating B
usb
ar
Wid
th,
mm
63
80
10
0
12
5
16
0
Nu
mb
er o
f B
usb
ars
per
Ph
ase
1
2
3
1
2
3
1
2
3
1
2
3
1
2
3
°C
Est
ima
ted
Ma
xim
um
Cu
rren
t C
arr
yin
g C
ap
aci
ty,
Am
pere
s
40
10
5
82
7
13
53
17
62
95
9
15
91
20
13
11
73
18
20
22
77
13
40
19
91
25
05
16
52
23
57
28
74
40
10
0
78
6
12
86
16
73
91
1
15
12
19
12
11
14
17
29
21
63
12
73
18
91
23
80
15
70
22
40
27
30
40
90
70
3
11
50
14
97
81
5
13
53
17
11
99
7
15
47
19
36
11
39
16
92
21
29
14
05
20
04
24
43
40
80
61
2
10
01
13
04
71
0
11
78
14
90
86
8
13
47
16
85
99
1
14
73
18
54
12
23
17
44
21
27
40
70
51
3
83
9
10
92
59
5
98
7
12
48
72
7
11
28
14
12
83
1
12
34
15
53
10
24
14
62
17
82
35
10
5
86
0
14
07
18
32
99
7
16
55
20
93
12
20
18
93
23
68
13
93
20
70
26
05
17
18
24
52
29
89
35
95
78
6
12
86
16
73
91
1
15
12
19
12
11
14
17
29
21
63
12
73
18
91
23
80
15
70
22
40
27
30
35
85
70
3
11
50
14
97
81
5
13
53
17
11
99
7
15
47
19
36
11
39
16
92
21
29
14
05
20
04
24
43
35
75
61
2
10
01
13
04
71
0
11
78
14
90
86
8
13
47
16
85
99
1
14
73
18
54
12
23
17
44
21
27
35
65
51
3
83
9
10
92
59
5
98
7
12
48
72
7
11
28
14
12
83
1
12
34
15
53
10
24
14
62
17
82
30
10
5
90
2
14
75
19
20
10
45
17
34
21
94
12
79
19
84
24
82
14
60
21
70
27
31
18
01
25
70
31
33
30
10
0
86
0
14
07
18
32
99
7
16
55
20
93
12
20
18
93
23
68
13
93
20
70
26
05
17
18
24
52
29
89
30
90
78
6
12
86
16
73
91
1
15
12
19
12
11
14
17
29
21
63
12
73
18
91
23
80
15
70
22
40
27
30
30
80
70
3
11
50
14
97
81
5
13
53
17
11
99
7
15
47
19
36
11
39
16
92
21
29
14
05
20
04
24
43
30
70
61
2
10
01
13
04
71
0
11
78
14
90
86
8
13
47
16
85
99
1
14
73
18
54
12
23
17
44
21
27
30
60
51
3
83
9
10
92
59
5
98
7
12
48
72
7
11
28
14
12
83
1
12
34
15
53
10
24
14
62
17
82

Page 64
4.5 AS 60890:2009 Results
AS 60890 provides tables of current carrying capacities for busbars with specific air
temperatures adjacent to the bars. With less current flowing through the conductors, the
difference between air temperature adjacent to the busbars and the busbar operating
temperature can be reduced. Figure 4.7 plots the extrapolated maximum operating
current for an air temperature adjacent to the busbars when the operating temperature is
105°C. Figure 4.7 also plots the calculated air temperature adjacent to the busbars for a
given current flow. The intersection of these two lines is the maximum operating
current for the arrangement. The plots show in Figure 4.7 is for a 3 by 125x6.3mm
copper busbars per phase arrangement with a conductor operating temperature of
105°C.
Figure 4.7 Intersection of Extrapolated and Calculated Current Ratings.
2300
2400
2500
76 78 80 82 84 86 88 90
Cu
rren
t, A
mp
ere
Air Temperature Adjacent to Busbars, °C
Intersection of Extrapolated and
Calculated Current Ratings
Extrapolated Max.
Current for Max.
Operating Temp.
Calculated Air
Temp for Specific
Current
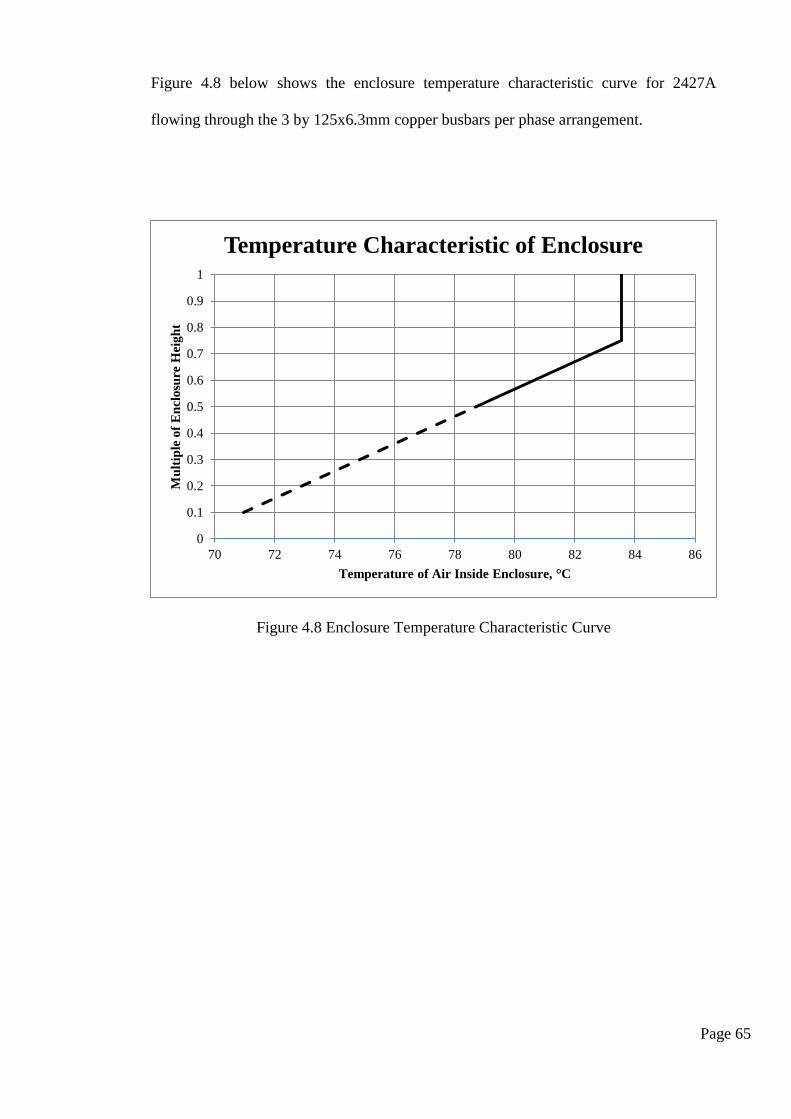
Page 65
Figure 4.8 below shows the enclosure temperature characteristic curve for 2427A
flowing through the 3 by 125x6.3mm copper busbars per phase arrangement.
Figure 4.8 Enclosure Temperature Characteristic Curve
0
0.1
0.2
0.3
0.4
0.5
0.6
0.7
0.8
0.9
1
70 72 74 76 78 80 82 84 86
Mu
ltip
le o
f E
ncl
osu
re H
eig
ht
Temperature of Air Inside Enclosure, °C
Temperature Characteristic of Enclosure
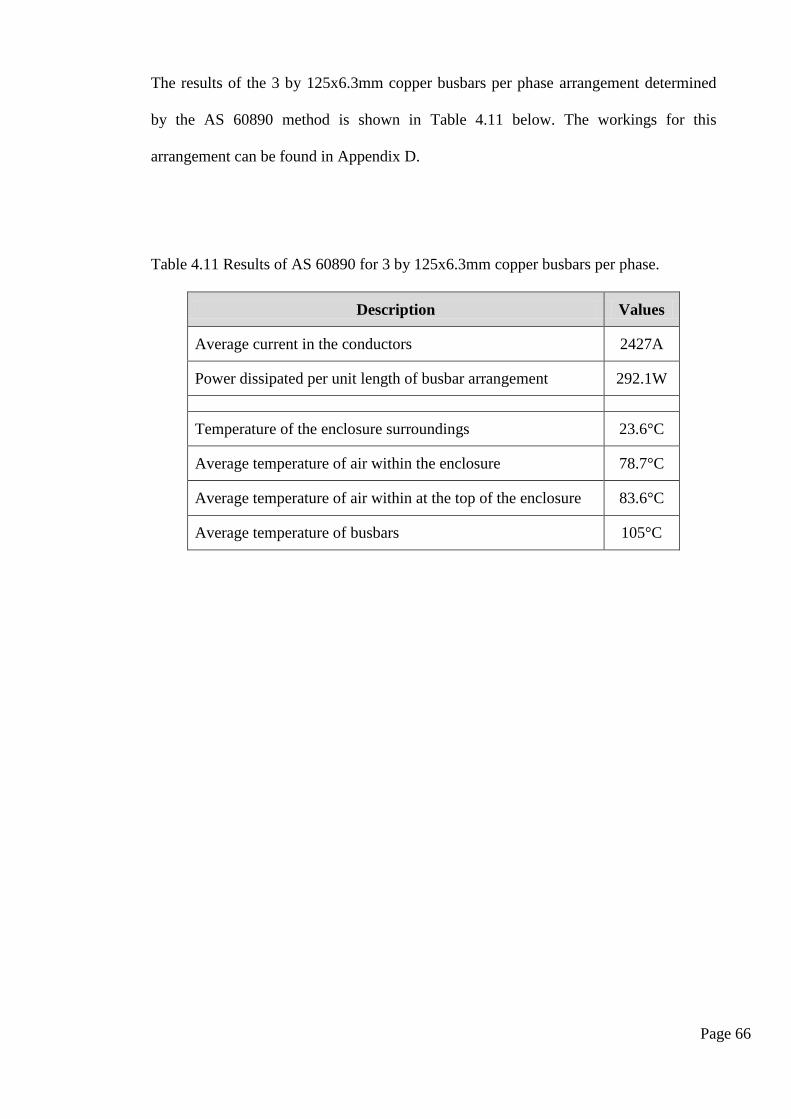
Page 66
The results of the 3 by 125x6.3mm copper busbars per phase arrangement determined
by the AS 60890 method is shown in Table 4.11 below. The workings for this
arrangement can be found in Appendix D.
Table 4.11 Results of AS 60890 for 3 by 125x6.3mm copper busbars per phase.
Description Values
Average current in the conductors 2427A
Power dissipated per unit length of busbar arrangement 292.1W
Temperature of the enclosure surroundings 23.6°C
Average temperature of air within the enclosure 78.7°C
Average temperature of air within at the top of the enclosure 83.6°C
Average temperature of busbars 105°C
Page 67
5 Analysis and Discussion
5.1 Introduction
This Chapter presents an analysis and discussion of the Matlab Script results verses the
other three methods of calculating busbar operating temperatures or current carrying
capacities as describe in the Chapter 3. These comparisons are:
1. Matlab Script vs. Type Test Certificate
2. Matlab Script vs. AS 3000:1991
3. Matlab Script vs. AS 60890:2009
This chapter addresses Project Objective 5 and is summarised below:
5. Compare the Matlab simulation to real Type Test results for the specific bus
zone and busbar arrangement.
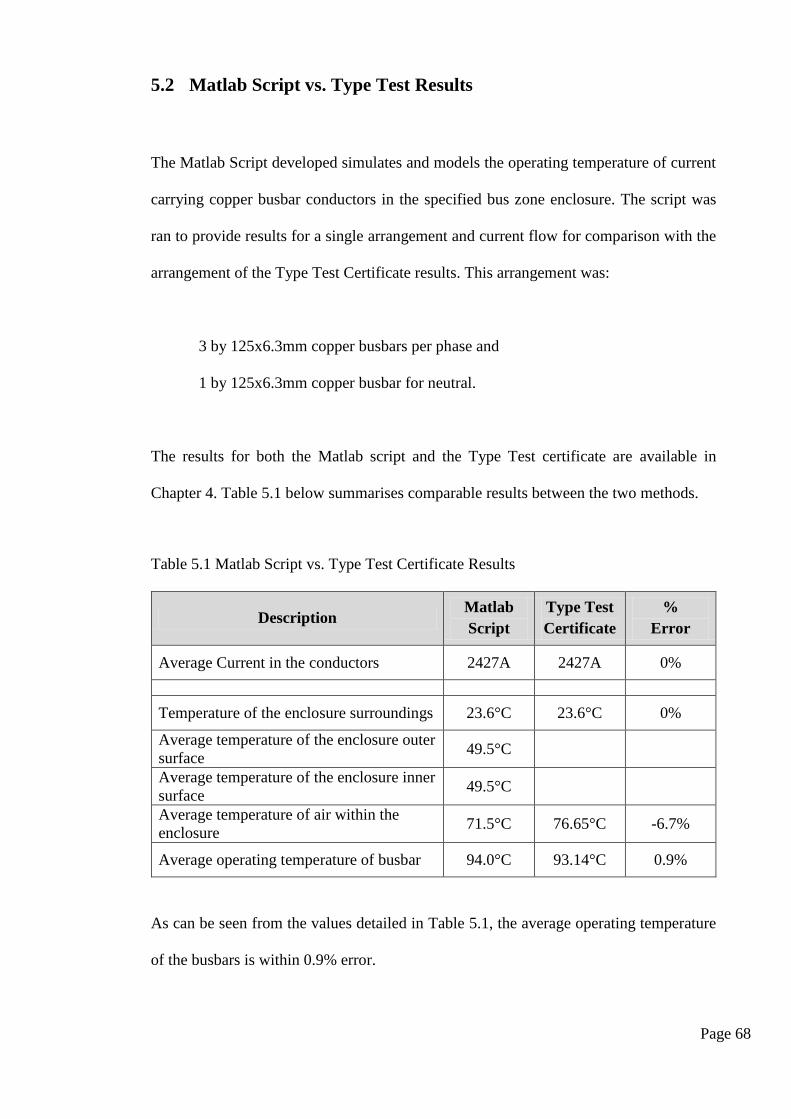
Page 68
5.2 Matlab Script vs. Type Test Results
The Matlab Script developed simulates and models the operating temperature of current
carrying copper busbar conductors in the specified bus zone enclosure. The script was
ran to provide results for a single arrangement and current flow for comparison with the
arrangement of the Type Test Certificate results. This arrangement was:
3 by 125x6.3mm copper busbars per phase and
1 by 125x6.3mm copper busbar for neutral.
The results for both the Matlab script and the Type Test certificate are available in
Chapter 4. Table 5.1 below summarises comparable results between the two methods.
Table 5.1 Matlab Script vs. Type Test Certificate Results
Description Matlab
Script
Type Test
Certificate
%
Error
Average Current in the conductors 2427A 2427A 0%
Temperature of the enclosure surroundings 23.6°C 23.6°C 0%
Average temperature of the enclosure outer
surface 49.5°C
Average temperature of the enclosure inner
surface 49.5°C
Average temperature of air within the
enclosure 71.5°C 76.65°C -6.7%
Average operating temperature of busbar 94.0°C 93.14°C 0.9%
As can be seen from the values detailed in Table 5.1, the average operating temperature
of the busbars is within 0.9% error.
Page 69
A percentage error value of 6.7% was obtained for the average temperature of the air
within the enclosure. Although the error is a comparably large value in comparison to
the operating temperature error, the physical location of the Type Test thermocouple
may account for this. In the Type Test certificate testing, the air temperature within the
enclosure was obtained by thermocouples that were soldered to small squares of copper
plate suspended at the top of the bus zone, within the enclosure. Due to being located in
the upper quadrant of the enclosure, it is expected that these thermocouples would have
a higher temperature than the average for the air within the enclosure which was
calculated by the Matlab script.
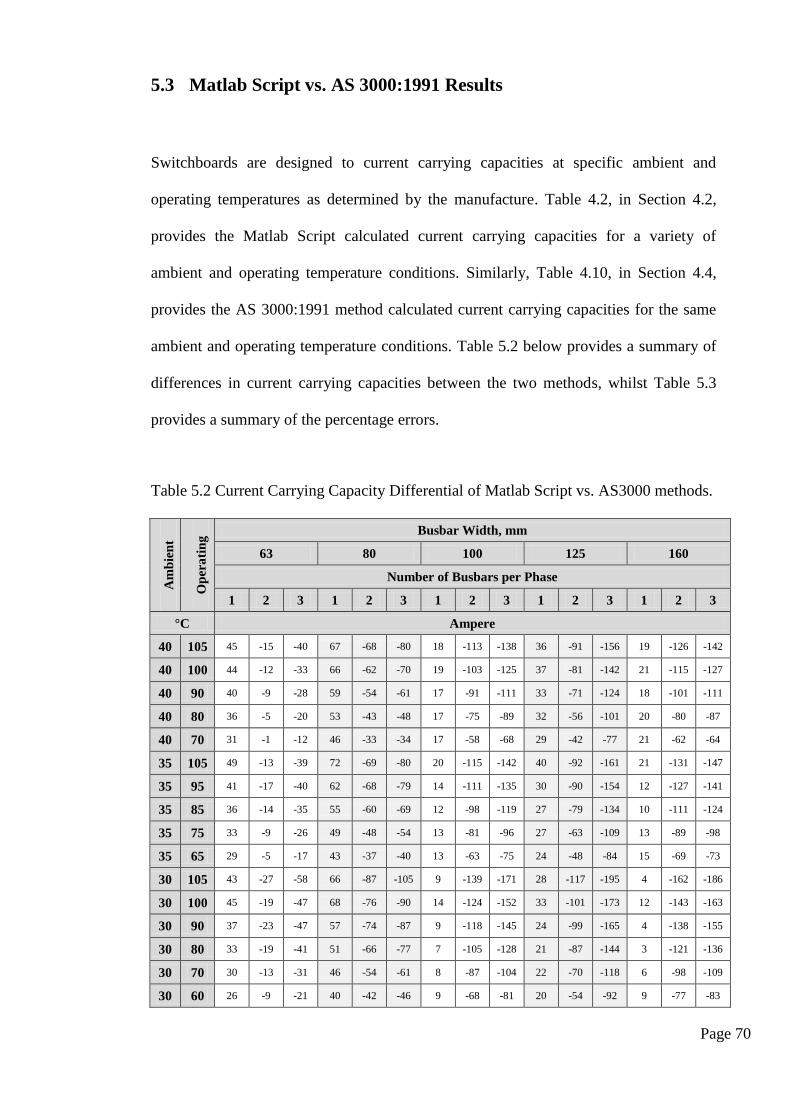
Page 70
5.3 Matlab Script vs. AS 3000:1991 Results
Switchboards are designed to current carrying capacities at specific ambient and
operating temperatures as determined by the manufacture. Table 4.2, in Section 4.2,
provides the Matlab Script calculated current carrying capacities for a variety of
ambient and operating temperature conditions. Similarly, Table 4.10, in Section 4.4,
provides the AS 3000:1991 method calculated current carrying capacities for the same
ambient and operating temperature conditions. Table 5.2 below provides a summary of
differences in current carrying capacities between the two methods, whilst Table 5.3
provides a summary of the percentage errors.
Table 5.2 Current Carrying Capacity Differential of Matlab Script vs. AS3000 methods.
Am
bie
nt
Op
era
tin
g Busbar Width, mm
63 80 100 125 160
Number of Busbars per Phase
1 2 3 1 2 3 1 2 3 1 2 3 1 2 3
°C Ampere
40 105 45 -15 -40 67 -68 -80 18 -113 -138 36 -91 -156 19 -126 -142
40 100 44 -12 -33 66 -62 -70 19 -103 -125 37 -81 -142 21 -115 -127
40 90 40 -9 -28 59 -54 -61 17 -91 -111 33 -71 -124 18 -101 -111
40 80 36 -5 -20 53 -43 -48 17 -75 -89 32 -56 -101 20 -80 -87
40 70 31 -1 -12 46 -33 -34 17 -58 -68 29 -42 -77 21 -62 -64
35 105 49 -13 -39 72 -69 -80 20 -115 -142 40 -92 -161 21 -131 -147
35 95 41 -17 -40 62 -68 -79 14 -111 -135 30 -90 -154 12 -127 -141
35 85 36 -14 -35 55 -60 -69 12 -98 -119 27 -79 -134 10 -111 -124
35 75 33 -9 -26 49 -48 -54 13 -81 -96 27 -63 -109 13 -89 -98
35 65 29 -5 -17 43 -37 -40 13 -63 -75 24 -48 -84 15 -69 -73
30 105 43 -27 -58 66 -87 -105 9 -139 -171 28 -117 -195 4 -162 -186
30 100 45 -19 -47 68 -76 -90 14 -124 -152 33 -101 -173 12 -143 -163
30 90 37 -23 -47 57 -74 -87 9 -118 -145 24 -99 -165 4 -138 -155
30 80 33 -19 -41 51 -66 -77 7 -105 -128 21 -87 -144 3 -121 -136
30 70 30 -13 -31 46 -54 -61 8 -87 -104 22 -70 -118 6 -98 -109
30 60 26 -9 -21 40 -42 -46 9 -68 -81 20 -54 -92 9 -77 -83
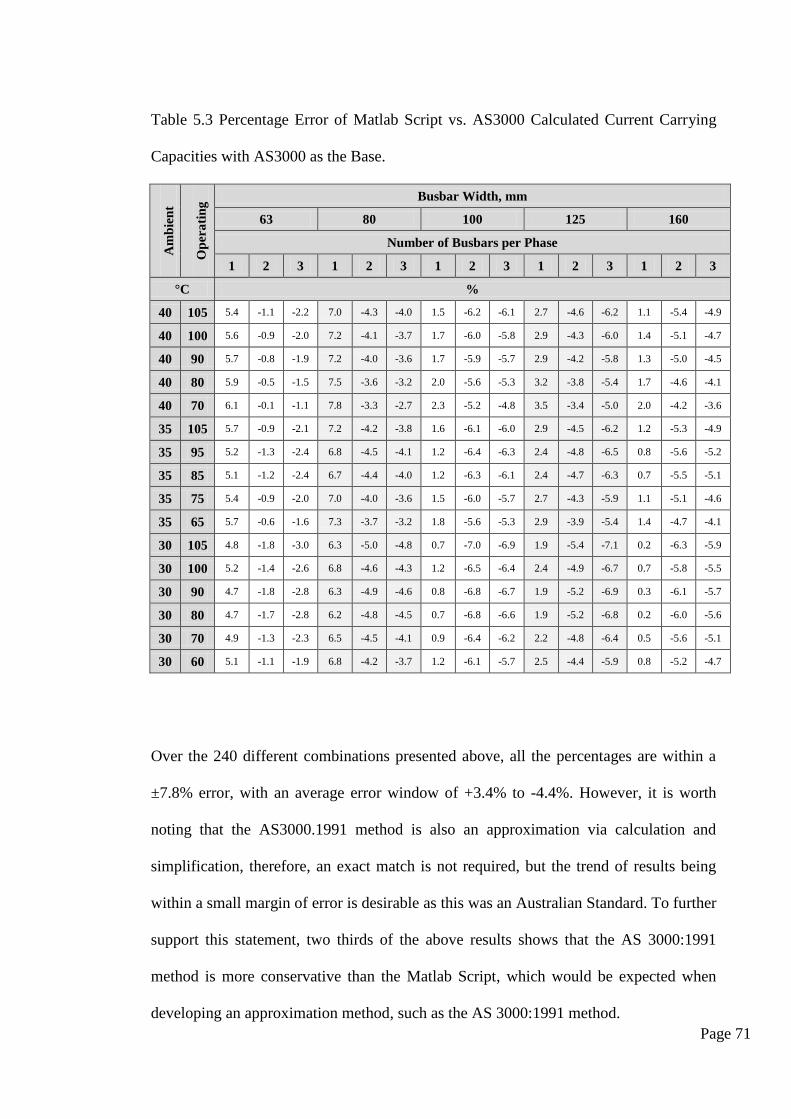
Page 71
Table 5.3 Percentage Error of Matlab Script vs. AS3000 Calculated Current Carrying
Capacities with AS3000 as the Base. A
mb
ien
t
Op
era
tin
g Busbar Width, mm
63 80 100 125 160
Number of Busbars per Phase
1 2 3 1 2 3 1 2 3 1 2 3 1 2 3
°C %
40 105 5.4 -1.1 -2.2 7.0 -4.3 -4.0 1.5 -6.2 -6.1 2.7 -4.6 -6.2 1.1 -5.4 -4.9
40 100 5.6 -0.9 -2.0 7.2 -4.1 -3.7 1.7 -6.0 -5.8 2.9 -4.3 -6.0 1.4 -5.1 -4.7
40 90 5.7 -0.8 -1.9 7.2 -4.0 -3.6 1.7 -5.9 -5.7 2.9 -4.2 -5.8 1.3 -5.0 -4.5
40 80 5.9 -0.5 -1.5 7.5 -3.6 -3.2 2.0 -5.6 -5.3 3.2 -3.8 -5.4 1.7 -4.6 -4.1
40 70 6.1 -0.1 -1.1 7.8 -3.3 -2.7 2.3 -5.2 -4.8 3.5 -3.4 -5.0 2.0 -4.2 -3.6
35 105 5.7 -0.9 -2.1 7.2 -4.2 -3.8 1.6 -6.1 -6.0 2.9 -4.5 -6.2 1.2 -5.3 -4.9
35 95 5.2 -1.3 -2.4 6.8 -4.5 -4.1 1.2 -6.4 -6.3 2.4 -4.8 -6.5 0.8 -5.6 -5.2
35 85 5.1 -1.2 -2.4 6.7 -4.4 -4.0 1.2 -6.3 -6.1 2.4 -4.7 -6.3 0.7 -5.5 -5.1
35 75 5.4 -0.9 -2.0 7.0 -4.0 -3.6 1.5 -6.0 -5.7 2.7 -4.3 -5.9 1.1 -5.1 -4.6
35 65 5.7 -0.6 -1.6 7.3 -3.7 -3.2 1.8 -5.6 -5.3 2.9 -3.9 -5.4 1.4 -4.7 -4.1
30 105 4.8 -1.8 -3.0 6.3 -5.0 -4.8 0.7 -7.0 -6.9 1.9 -5.4 -7.1 0.2 -6.3 -5.9
30 100 5.2 -1.4 -2.6 6.8 -4.6 -4.3 1.2 -6.5 -6.4 2.4 -4.9 -6.7 0.7 -5.8 -5.5
30 90 4.7 -1.8 -2.8 6.3 -4.9 -4.6 0.8 -6.8 -6.7 1.9 -5.2 -6.9 0.3 -6.1 -5.7
30 80 4.7 -1.7 -2.8 6.2 -4.8 -4.5 0.7 -6.8 -6.6 1.9 -5.2 -6.8 0.2 -6.0 -5.6
30 70 4.9 -1.3 -2.3 6.5 -4.5 -4.1 0.9 -6.4 -6.2 2.2 -4.8 -6.4 0.5 -5.6 -5.1
30 60 5.1 -1.1 -1.9 6.8 -4.2 -3.7 1.2 -6.1 -5.7 2.5 -4.4 -5.9 0.8 -5.2 -4.7
Over the 240 different combinations presented above, all the percentages are within a
±7.8% error, with an average error window of +3.4% to -4.4%. However, it is worth
noting that the AS3000.1991 method is also an approximation via calculation and
simplification, therefore, an exact match is not required, but the trend of results being
within a small margin of error is desirable as this was an Australian Standard. To further
support this statement, two thirds of the above results shows that the AS 3000:1991
method is more conservative than the Matlab Script, which would be expected when
developing an approximation method, such as the AS 3000:1991 method.
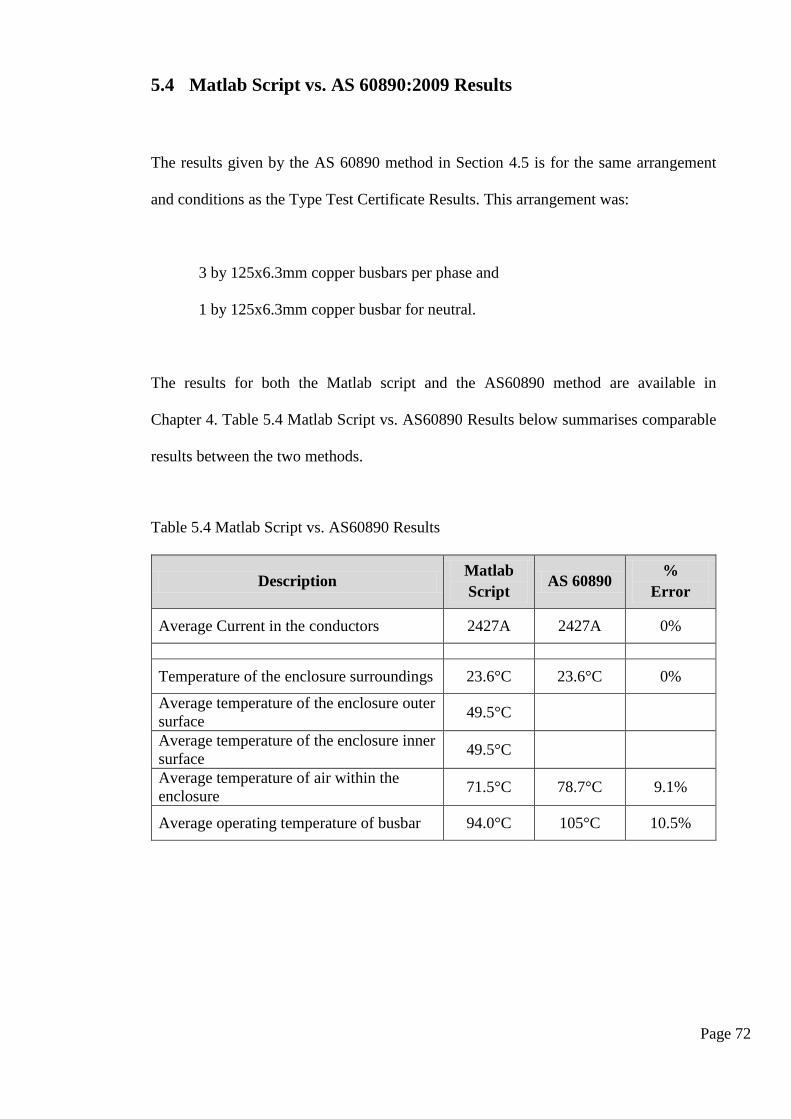
Page 72
5.4 Matlab Script vs. AS 60890:2009 Results
The results given by the AS 60890 method in Section 4.5 is for the same arrangement
and conditions as the Type Test Certificate Results. This arrangement was:
3 by 125x6.3mm copper busbars per phase and
1 by 125x6.3mm copper busbar for neutral.
The results for both the Matlab script and the AS60890 method are available in
Chapter 4. Table 5.4 Matlab Script vs. AS60890 Results below summarises comparable
results between the two methods.
Table 5.4 Matlab Script vs. AS60890 Results
Description Matlab
Script AS 60890
%
Error
Average Current in the conductors 2427A 2427A 0%
Temperature of the enclosure surroundings 23.6°C 23.6°C 0%
Average temperature of the enclosure outer
surface 49.5°C
Average temperature of the enclosure inner
surface 49.5°C
Average temperature of air within the
enclosure 71.5°C 78.7°C 9.1%
Average operating temperature of busbar 94.0°C 105°C 10.5%
Page 73
As can be seen from the values detailed in Table 5.1, the average operating temperature
of the busbars has an error difference of 10.5% and the average temperature of the air
within the enclosure error of 9.1%. Similarly to the AS 3000:1991 method, the AS
60890 method is also an approximation via calculation and simplification, and the
values obtained are more conservative than that of the Matlab script.
As detailed in Section 5.2, the Matlab Script is within 1% error of the real Type Test
Certificate results, and therefore, relatively accurate. As the AS 60890 method is over
10% in error with the Matlab Script, it will not be analysed any further.
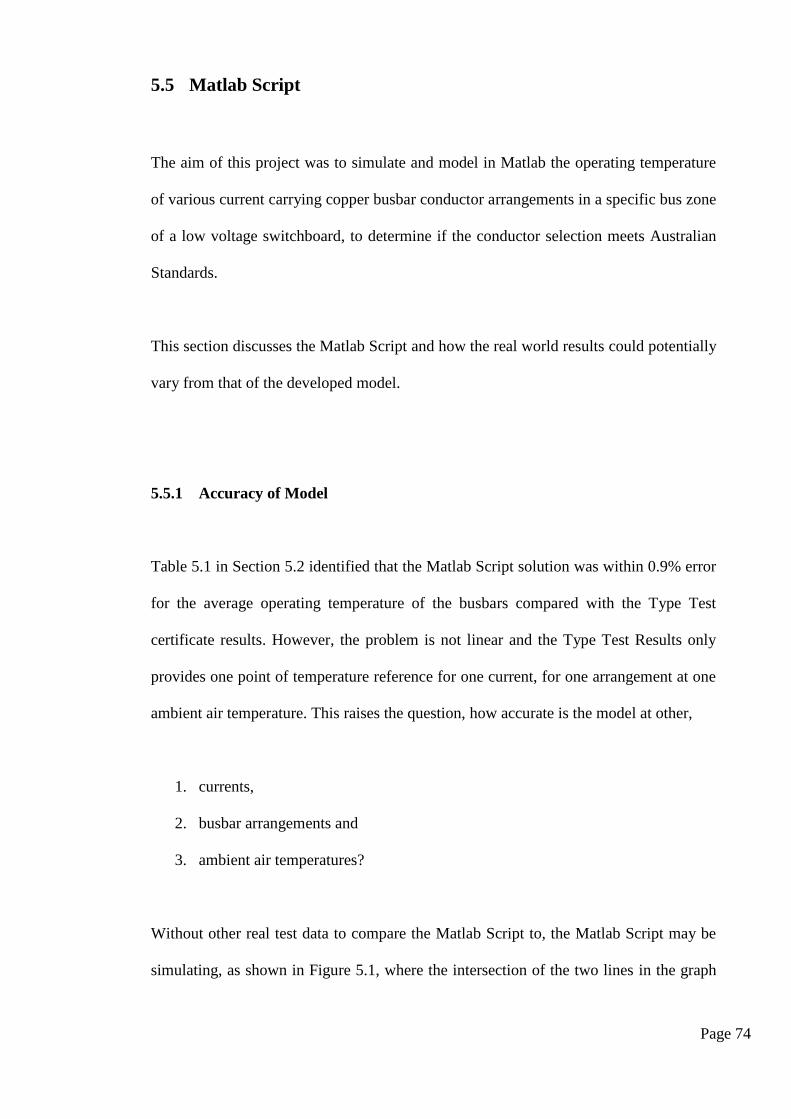
Page 74
5.5 Matlab Script
The aim of this project was to simulate and model in Matlab the operating temperature
of various current carrying copper busbar conductor arrangements in a specific bus zone
of a low voltage switchboard, to determine if the conductor selection meets Australian
Standards.
This section discusses the Matlab Script and how the real world results could potentially
vary from that of the developed model.
5.5.1 Accuracy of Model
Table 5.1 in Section 5.2 identified that the Matlab Script solution was within 0.9% error
for the average operating temperature of the busbars compared with the Type Test
certificate results. However, the problem is not linear and the Type Test Results only
provides one point of temperature reference for one current, for one arrangement at one
ambient air temperature. This raises the question, how accurate is the model at other,
1. currents,
2. busbar arrangements and
3. ambient air temperatures?
Without other real test data to compare the Matlab Script to, the Matlab Script may be
simulating, as shown in Figure 5.1, where the intersection of the two lines in the graph
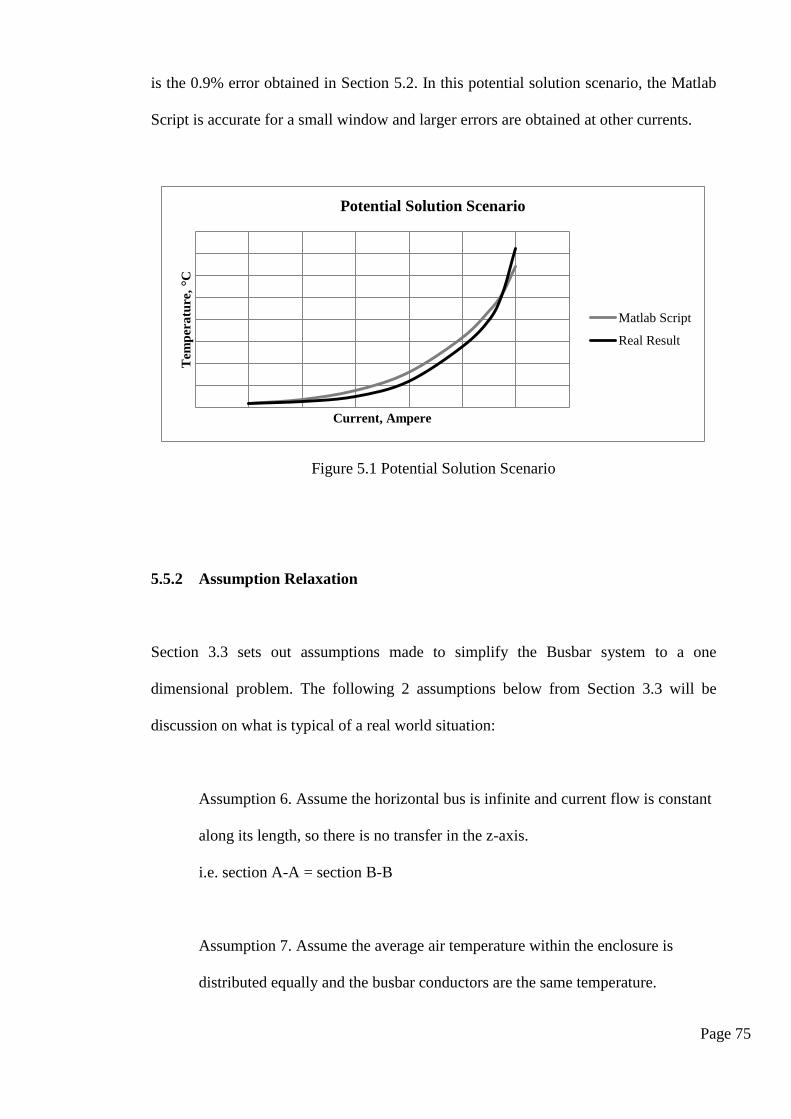
Page 75
Tem
per
atu
re, °C
Current, Ampere
Potential Solution Scenario
Matlab Script
Real Result
is the 0.9% error obtained in Section 5.2. In this potential solution scenario, the Matlab
Script is accurate for a small window and larger errors are obtained at other currents.
Figure 5.1 Potential Solution Scenario
5.5.2 Assumption Relaxation
Section 3.3 sets out assumptions made to simplify the Busbar system to a one
dimensional problem. The following 2 assumptions below from Section 3.3 will be
discussion on what is typical of a real world situation:
Assumption 6. Assume the horizontal bus is infinite and current flow is constant
along its length, so there is no transfer in the z-axis.
i.e. section A-A = section B-B
Assumption 7. Assume the average air temperature within the enclosure is
distributed equally and the busbar conductors are the same temperature.
Page 76
Firstly, Assumption 6 assumes that the bus zone is infinitely long, however, no
switchboard is infinitely long. Unless the ends of the switchboard are perfect insulators,
they will provide additional cooling surfaces, which will facilitate lower thermal
resistances in the bus zone thermal circuit. This would create a differential in busbar
temperatures at the ends of a switchboard compared to the middle, and would create
heat flow in the z-axis. This therefore makes the Matlab Script more conservative when
calculating operating temperature to determine compliance with Australian Standards.
The second half of Assumption 6 assumes that the current flow is constant along the
entire length of the bus zone. In reality, the full current rating will enter the bus zone at
a single point (i.e. above the incomer tier) which may be located at the end or in the
middle of the bus zone. Worst case scenario, the incoming point is located at one end
and the full current rating will flow until the first distribution tap off point in the
adjacent tier. Distribution tap off points will continue to decrease the current continuing
past each point.
As described in Section 3.4.1, the rate at which electrical power is generated per unit
length of busbar is the product of 𝐼2𝑅 as described. The resistance of the busbar has not
changed but the current has reduced. This leads to less heat dissipated and a lower
temperature of the busbar. This then creates a differential in busbar temperatures at the
ends furthest away from the incoming source point compared to the incoming source
point. The busbars at the end away from the incoming source point become effectively
heat sinks and would create heat flow in the z-axis. This therefore makes the Matlab
Script more conservative when calculating operating temperature to determine
compliance with Australian Standards.
Page 77
Assumption 7 was implemented to simplify the problem, however, real world
predictions can be made regarding these temperatures. The air temperature within the
enclosure would not be uniform with the air at the top being hotter, and the air at the
bottom cooler, than the enclosure average temperature. This air temperature differential
is essential for the mechanics of causing the buoyancy forces for heat convection.
Two phases of the busbar system are located in the lower half of the bus zone and one
phase is located in the top half. As the heat loss formulas are a calculation of heat loss to
the air temperature adjacent to the busbar, the two lower phases will have lower average
operating temperatures compared to the upper.
Additionally, in a three bars per phase system, the centre bar of a phase will have a
higher operating temperature compared to its two flanking bars. This is due to the centre
bar having severely reduced heat dissipation via radiation as the two larger surfaces face
the two flanking bars at approximately the same temperature. Therefore, the two
flanking busbars will be slightly less than the average operating temperature and the
centre busbar will be higher.
Page 78
6 Conclusions
The developed Matlab Script successfully models and simulates the operating
temperature of various current carrying copper busbar conductor arrangements in a
specific bus zone of a low voltage switchboard. Comparisons with the Type Test
Certificate results for the 3 by 125x6.3mm copper busbars per phase arrangement shows
that the Matlab Script is within 0.9% error for the same conditions.
A commercial switchboard manufacturing workshop method for calculating current
carrying capacities of busbars is to use a guide that was provided in AS 3000:1991 SAA
Wiring Rules. An extensive comparison of 240 different combinations of the
AS 3000:1991 method and the Matlab Script was carried out. The largest error of all the
combinations was ±7.8%, with an average error window of +3.4% to -4.4%.
AS/NZS 60890:2009 is an Australian Standard whose objective is to provide one
possible method to determine the temperature rise of current carrying copper busbar
conductors. This method was also compared with the Matlab Script using the 3 by
125x6.3mm copper busbars per phase arrangement. The average operating temperature
of the busbars has an error difference of 10.5% and the average temperature of the air
within the enclosure error of 9.1%.
Page 79
Similarly to the AS 3000:1991 method, the AS 60890 method is an approximation via
calculation and simplification, therefore, an exact match is not required, but the trend of
results being within a small margin of error is desirable as this these are Australian
Standards.
Due to the large error of the AS 60890 method of over 10% with the Matlab Script, it
was not analysed any further. The AS 60890 method result and two thirds of the
AS 3000:1991 method were more conservative than the Matlab Script, which would be
expected when developing an approximation method such as the Australian Standards
methods.
The final half of the project aim was to determine if the conductor selection meets
Australian Standards. AS 3439.1:2002 stipulates that the maximum copper busbar
operational temperature under normal service conditions is 105°C. An output of the
Matlab Script was tables detailing the operating temperature of a busbar arrangement
for a given current and ambient temperature. Using these tables thus satisfies the
requirements of AS 3439.
The outcomes of this project will be used to assist the design selection of busbar
conductors within the specified bus zone to document that design selections complies
with Australian Standards.
Page 80
6.1 Potential Future Work
All of the core objectives of this project have been completed successfully. However,
the Matlab Script model could be further improved with further development into the
following areas:
1. Further comparison with real test results to validate Matlab Script model for the
specified bus zone.
2. Increase complexity of the Matlab Script by modelling each busbar operating
temperature independently and is location dependant.
3. Increasing the dimensionality of the problem with the addition of heat transfer in
the z-axis. This would include investigation into load sheading along the bus
zone, hence sections of busbar acting as a heat sink.
4. Addition of functionality to allow alternative enclosure dimensions, busbar
arrangements (trefoil, 3 in a row horizontally, vertically, etc.) and busbar
orientation (horizontal or vertical). Comparison with real test results would be
required to validate Matlab Script model.
5. Investigate the effect of contaminates introduced to a busbar system in a non-
sealed bus zone.
6. Investigate the effect of cyclic loads to determine if a cyclic rating is applicable.
Page 81
7. Investigate the effect of busbar and cable joints and their heat distribution effect
on the busbar system.
8. Addition of a Graphical User Interface (GUI) for the Matlab Script.
Page 82
7 Appendix A
7.1 Project Specification
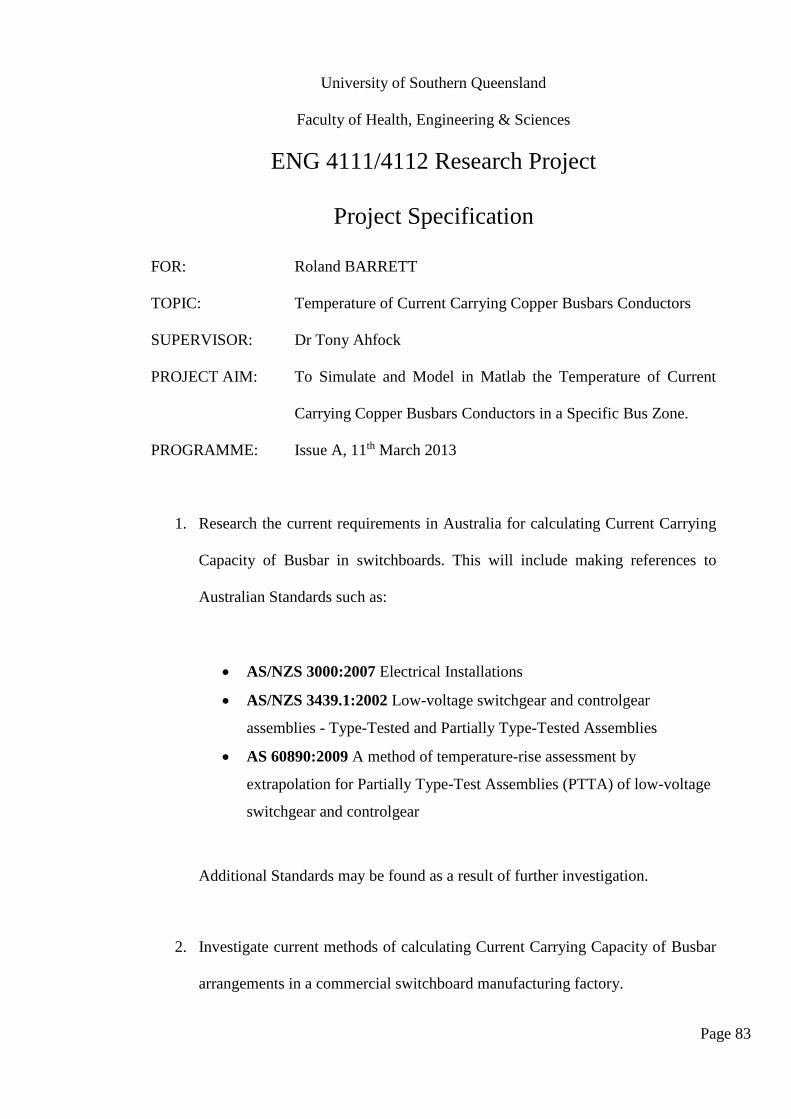
Page 83
University of Southern Queensland
Faculty of Health, Engineering & Sciences
ENG 4111/4112 Research Project
Project Specification
FOR: Roland BARRETT
TOPIC: Temperature of Current Carrying Copper Busbars Conductors
SUPERVISOR: Dr Tony Ahfock
PROJECT AIM: To Simulate and Model in Matlab the Temperature of Current
Carrying Copper Busbars Conductors in a Specific Bus Zone.
PROGRAMME: Issue A, 11th March 2013
1. Research the current requirements in Australia for calculating Current Carrying
Capacity of Busbar in switchboards. This will include making references to
Australian Standards such as:
AS/NZS 3000:2007 Electrical Installations
AS/NZS 3439.1:2002 Low-voltage switchgear and controlgear
assemblies - Type-Tested and Partially Type-Tested Assemblies
AS 60890:2009 A method of temperature-rise assessment by
extrapolation for Partially Type-Test Assemblies (PTTA) of low-voltage
switchgear and controlgear
Additional Standards may be found as a result of further investigation.
2. Investigate current methods of calculating Current Carrying Capacity of Busbar
arrangements in a commercial switchboard manufacturing factory.
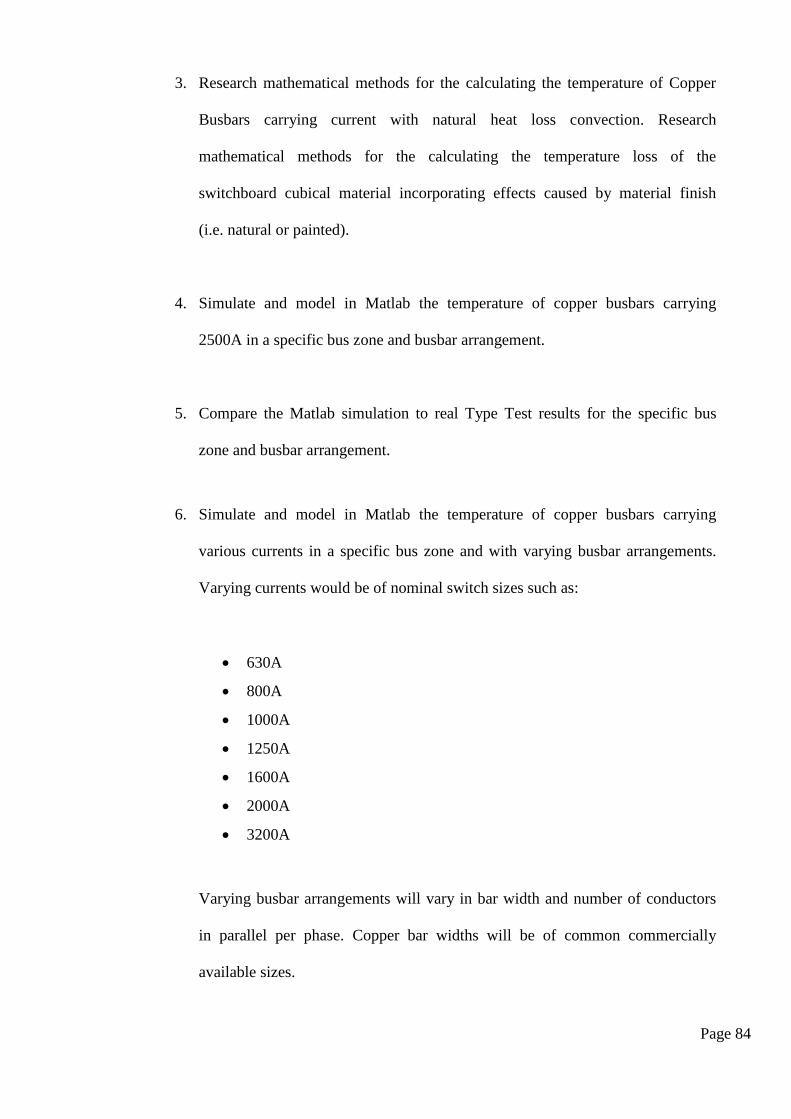
Page 84
3. Research mathematical methods for the calculating the temperature of Copper
Busbars carrying current with natural heat loss convection. Research
mathematical methods for the calculating the temperature loss of the
switchboard cubical material incorporating effects caused by material finish
(i.e. natural or painted).
4. Simulate and model in Matlab the temperature of copper busbars carrying
2500A in a specific bus zone and busbar arrangement.
5. Compare the Matlab simulation to real Type Test results for the specific bus
zone and busbar arrangement.
6. Simulate and model in Matlab the temperature of copper busbars carrying
various currents in a specific bus zone and with varying busbar arrangements.
Varying currents would be of nominal switch sizes such as:
630A
800A
1000A
1250A
1600A
2000A
3200A
Varying busbar arrangements will vary in bar width and number of conductors
in parallel per phase. Copper bar widths will be of common commercially
available sizes.
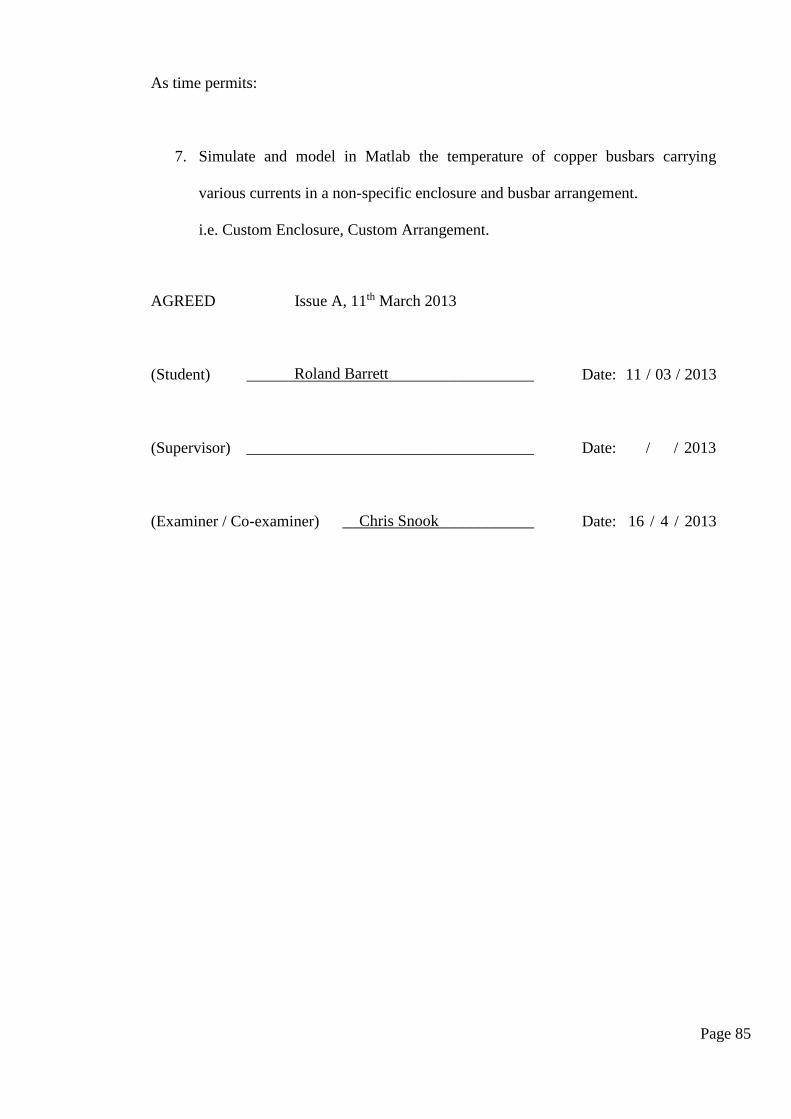
Page 85
As time permits:
7. Simulate and model in Matlab the temperature of copper busbars carrying
various currents in a non-specific enclosure and busbar arrangement.
i.e. Custom Enclosure, Custom Arrangement.
AGREED Issue A, 11th March 2013
(Student) ____________________________________ Date: 11 / 03 / 2013
(Supervisor) ____________________________________ Date: / / 2013
(Examiner / Co-examiner) ________________________ Date: 16 / 4 / 2013
Roland Barrett
Chris Snook

Page 86
8 Appendix B
8.1 Matlab Script
Page 87
% USQ ENG4111/4112 - Project - S1/S2 2013
% busbar_temp.m
% Created 20th April 2013
%--------------------------------------------------------------------------
% Authors
% Initials Name StudentNo. Mobile Email
% RB Roland Barrett 0050070099 0422535956 [email protected]
%--------------------------------------------------------------------------
% Version Date Author Comments
% 1.0 20 Apr 2013 RB Initial file
% 2.0 11 Aug 2013 RB Alpha Release
% 3.0 5 Oct 2013 RB Final Release
%--------------------------------------------------------------------------
%% Script Description
%
% The Matlab Script program is designed to simulate and model the
% operating temperature of current carrying copper busbar conductors in
% the specified bus zone enclosure detailed in Section 3.2 of the
% dissertation. The Matlab Script is written in functional blocks with
% the temperature and heat energy as the main inputs and outputs.
% The functional blocks are in line with the sub-sections of Section
% 3.4, Mathematical Methods of Temperature Calculation of the
% dissertation:
%
% 1. Heat Generated by Busbars
% 2. Heat Dissipated by Enclosure
% 3. Heat Conduction through Enclosure Wall
% 4. Heat Absorbed by Enclosure
% 5. Heat Dissipated by Busbars
%
% A function flow chart in Figure 3.8 of the dissertation illustrates
% how each functional block interacts with each other. Looping is
% introduced around functional blocks due to approximations made on the
% first pass through. Program looping allows for large amounts of data
% to be generated automatically without the need for user input for
% current settings or busbar arrangements.
%
% All constants were gained from the ‘Fundamentals of Heat and Mass
% Transfer’ by Incropera publication and the resistances of the busbars
% were provided in AS 600890:2009. Parameters are specific to the
% enclosure or busbar dimensions determined from Section 3.2 of the
% dissertation.
%
% The Matlab script will produce the following outputs for any given
% bar size, number of bars per phase and current flow:
%
% • Average Current in the conductors
% • Power dissipated per unit length of busbar arrangement
% • Total heat dissipated per unit length of enclosure
%
% • Temperature of the enclosure surroundings
% • Average temperature of the enclosure outer surface
% • Average temperature of the enclosure inner surface
% • Average temperature of air within the enclosure
% • Average temperature of busbar
%
% • Heat dissipated from busbars due to convection
% • Heat dissipated from busbars due to radiation
% • Heat conducted through enclosure wall
% • Heat dissipated from enclosure due to convection
% • Heat dissipated from enclosure due to radiation
%
%
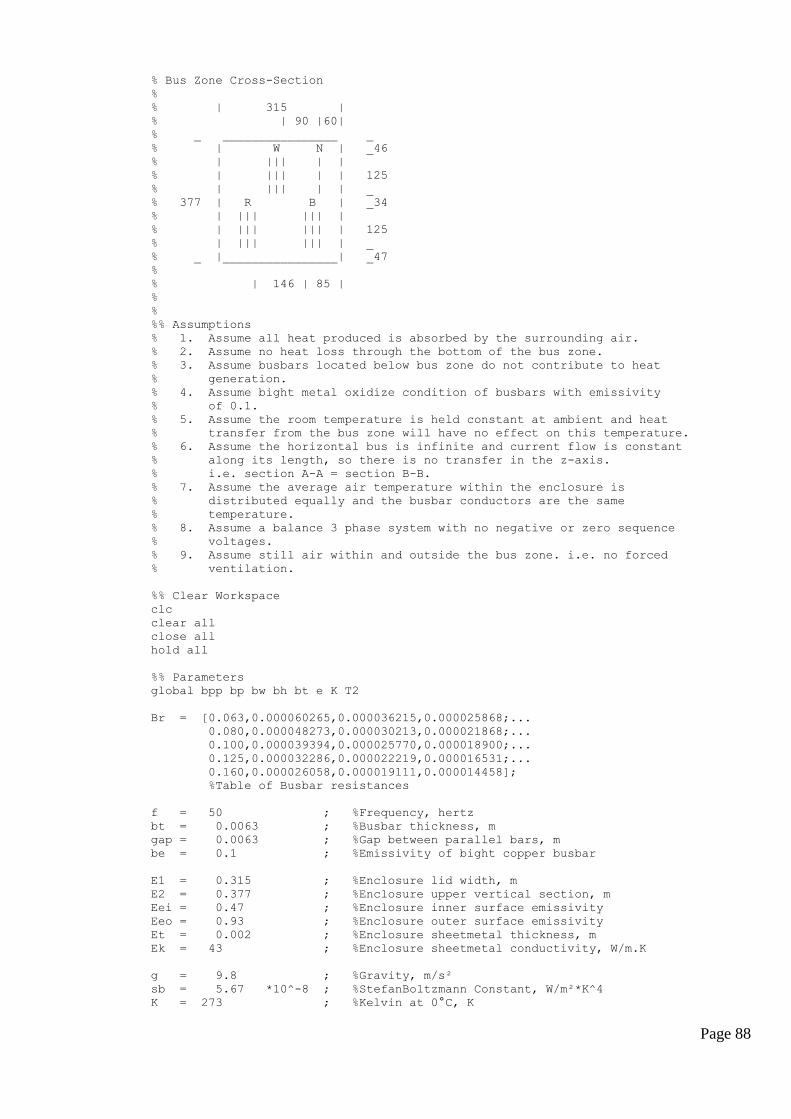
Page 88
% Bus Zone Cross-Section
%
% | 315 |
% | 90 |60|
% _ ________________ _
% | W N | _46
% | ||| | |
% | ||| | | 125
% | ||| | | _
% 377 | R B | _34
% | ||| ||| |
% | ||| ||| | 125
% | ||| ||| | _
% _ |________________| _47
%
% | 146 | 85 |
%
%
%% Assumptions
% 1. Assume all heat produced is absorbed by the surrounding air.
% 2. Assume no heat loss through the bottom of the bus zone.
% 3. Assume busbars located below bus zone do not contribute to heat
% generation.
% 4. Assume bight metal oxidize condition of busbars with emissivity
% of 0.1.
% 5. Assume the room temperature is held constant at ambient and heat
% transfer from the bus zone will have no effect on this temperature.
% 6. Assume the horizontal bus is infinite and current flow is constant
% along its length, so there is no transfer in the z-axis.
% i.e. section A-A = section B-B.
% 7. Assume the average air temperature within the enclosure is
% distributed equally and the busbar conductors are the same
% temperature.
% 8. Assume a balance 3 phase system with no negative or zero sequence
% voltages.
% 9. Assume still air within and outside the bus zone. i.e. no forced
% ventilation.
%% Clear Workspace
clc
clear all
close all
hold all
%% Parameters
global bpp bp bw bh bt e K T2
Br = [0.063,0.000060265,0.000036215,0.000025868;...
0.080,0.000048273,0.000030213,0.000021868;...
0.100,0.000039394,0.000025770,0.000018900;...
0.125,0.000032286,0.000022219,0.000016531;...
0.160,0.000026058,0.000019111,0.000014458];
%Table of Busbar resistances
f = 50 ; %Frequency, hertz
bt = 0.0063 ; %Busbar thickness, m
gap = 0.0063 ; %Gap between parallel bars, m
be = 0.1 ; %Emissivity of bight copper busbar
E1 = 0.315 ; %Enclosure lid width, m
E2 = 0.377 ; %Enclosure upper vertical section, m
Eei = 0.47 ; %Enclosure inner surface emissivity
Eeo = 0.93 ; %Enclosure outer surface emissivity
Et = 0.002 ; %Enclosure sheetmetal thickness, m
Ek = 43 ; %Enclosure sheetmetal conductivity, W/m.K
g = 9.8 ; %Gravity, m/s²
sb = 5.67 *10^-8 ; %StefanBoltzmann Constant, W/m²*K^4
K = 273 ; %Kelvin at 0°C, K
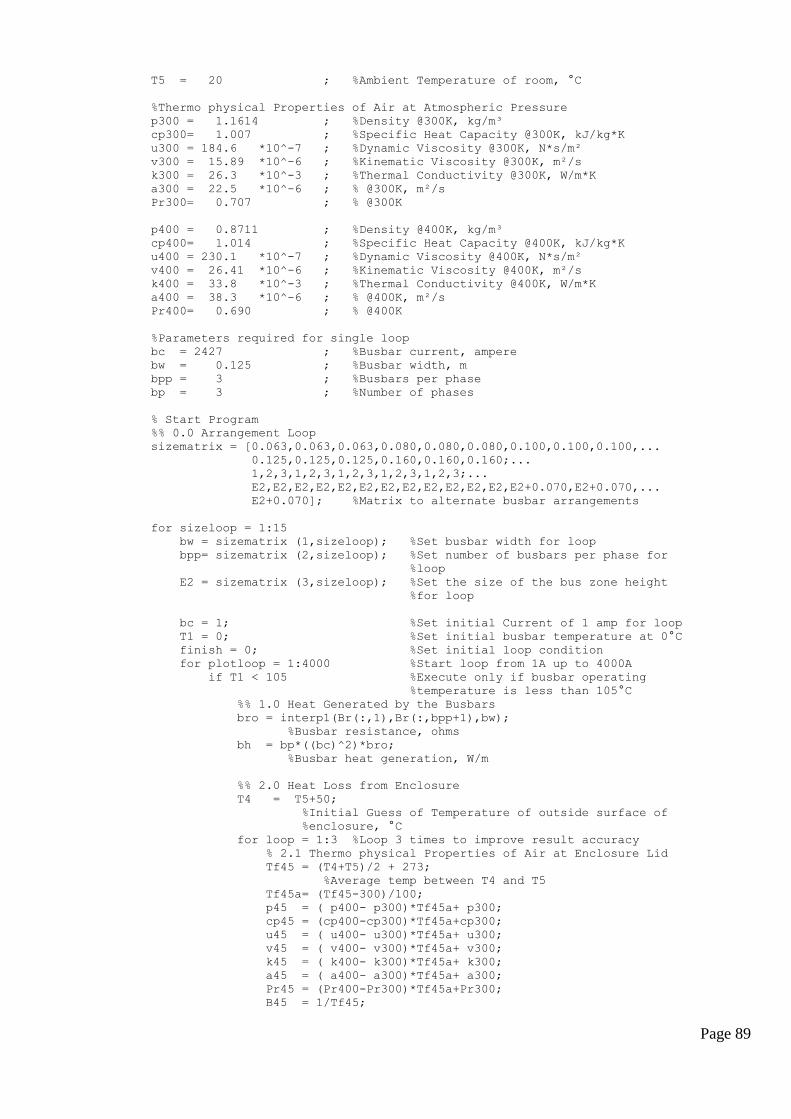
Page 89
T5 = 20 ; %Ambient Temperature of room, °C
%Thermo physical Properties of Air at Atmospheric Pressure
p300 = 1.1614 ; %Density @300K, kg/m³
cp300= 1.007 ; %Specific Heat Capacity @300K, kJ/kg*K
u300 = 184.6 *10^-7 ; %Dynamic Viscosity @300K, N*s/m²
v300 = 15.89 *10^-6 ; %Kinematic Viscosity @300K, m²/s
k300 = 26.3 *10^-3 ; %Thermal Conductivity @300K, W/m*K
a300 = 22.5 *10^-6 ; % @300K, m²/s
Pr300= 0.707 ; % @300K
p400 = 0.8711 ; %Density @400K, kg/m³
cp400= 1.014 ; %Specific Heat Capacity @400K, kJ/kg*K
u400 = 230.1 *10^-7 ; %Dynamic Viscosity @400K, N*s/m²
v400 = 26.41 *10^-6 ; %Kinematic Viscosity @400K, m²/s
k400 = 33.8 *10^-3 ; %Thermal Conductivity @400K, W/m*K
a400 = 38.3 *10^-6 ; % @400K, m²/s
Pr400= 0.690 ; % @400K
%Parameters required for single loop
bc = 2427 ; %Busbar current, ampere
bw = 0.125 ; %Busbar width, m
bpp = 3 ; %Busbars per phase
bp = 3 ; %Number of phases
% Start Program
%% 0.0 Arrangement Loop
sizematrix = [0.063,0.063,0.063,0.080,0.080,0.080,0.100,0.100,0.100,...
0.125,0.125,0.125,0.160,0.160,0.160;...
1,2,3,1,2,3,1,2,3,1,2,3,1,2,3;...
E2,E2,E2,E2,E2,E2,E2,E2,E2,E2,E2,E2,E2+0.070,E2+0.070,...
E2+0.070]; %Matrix to alternate busbar arrangements
for sizeloop = 1:15
bw = sizematrix (1,sizeloop); %Set busbar width for loop
bpp= sizematrix (2,sizeloop); %Set number of busbars per phase for
%loop
E2 = sizematrix (3,sizeloop); %Set the size of the bus zone height
%for loop
bc = 1; %Set initial Current of 1 amp for loop
T1 = 0; %Set initial busbar temperature at 0°C
finish = 0; %Set initial loop condition
for plotloop = 1:4000 %Start loop from 1A up to 4000A
if T1 < 105 %Execute only if busbar operating
%temperature is less than 105°C
%% 1.0 Heat Generated by the Busbars
bro = interp1(Br(:,1),Br(:,bpp+1),bw);
%Busbar resistance, ohms
bh = bp*((bc)^2)*bro;
%Busbar heat generation, W/m
%% 2.0 Heat Loss from Enclosure
T4 = T5+50;
%Initial Guess of Temperature of outside surface of
%enclosure, °C
for loop = 1:3 %Loop 3 times to improve result accuracy
% 2.1 Thermo physical Properties of Air at Enclosure Lid
Tf45 = (T4+T5)/2 + 273;
%Average temp between T4 and T5
Tf45a= (Tf45-300)/100;
p45 = ( p400- p300)*Tf45a+ p300;
cp45 = (cp400-cp300)*Tf45a+cp300;
u45 = ( u400- u300)*Tf45a+ u300;
v45 = ( v400- v300)*Tf45a+ v300;
k45 = ( k400- k300)*Tf45a+ k300;
a45 = ( a400- a300)*Tf45a+ a300;
Pr45 = (Pr400-Pr300)*Tf45a+Pr300;
B45 = 1/Tf45;
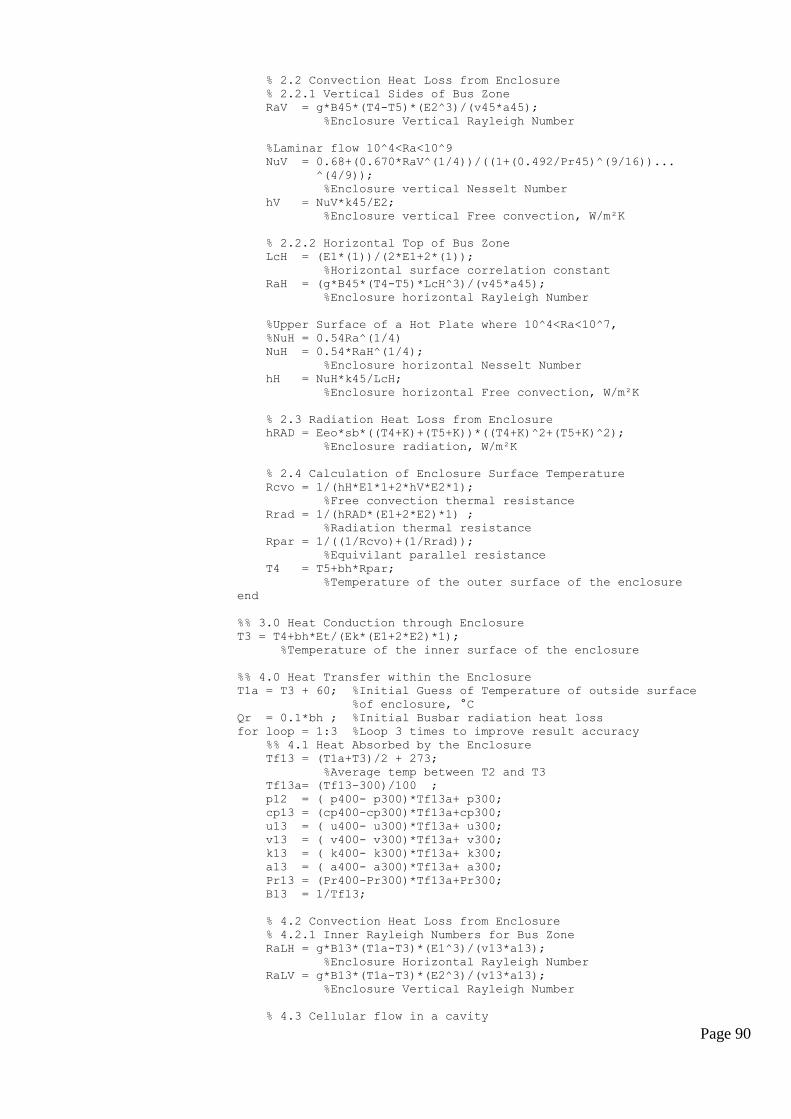
Page 90
% 2.2 Convection Heat Loss from Enclosure
% 2.2.1 Vertical Sides of Bus Zone
RaV = g*B45*(T4-T5)*(E2^3)/(v45*a45);
%Enclosure Vertical Rayleigh Number
%Laminar flow 10^4<Ra<10^9
NuV = 0.68+(0.670*RaV^(1/4))/((1+(0.492/Pr45)^(9/16))...
^(4/9));
%Enclosure vertical Nesselt Number
hV = NuV*k45/E2;
%Enclosure vertical Free convection, W/m²K
% 2.2.2 Horizontal Top of Bus Zone
LcH = (E1*(1))/(2*E1+2*(1));
%Horizontal surface correlation constant
RaH = (g*B45*(T4-T5)*LcH^3)/(v45*a45);
%Enclosure horizontal Rayleigh Number
%Upper Surface of a Hot Plate where 10^4<Ra<10^7,
%NuH = 0.54Ra^(1/4)
NuH = 0.54*RaH^(1/4);
%Enclosure horizontal Nesselt Number
hH = NuH*k45/LcH;
%Enclosure horizontal Free convection, W/m²K
% 2.3 Radiation Heat Loss from Enclosure
hRAD = Eeo*sb*((T4+K)+(T5+K))*((T4+K)^2+(T5+K)^2);
%Enclosure radiation, W/m²K
% 2.4 Calculation of Enclosure Surface Temperature
Rcvo = 1/(hH*E1*1+2*hV*E2*1);
%Free convection thermal resistance
Rrad = 1/(hRAD*(E1+2*E2)*1) ;
%Radiation thermal resistance
Rpar = 1/((1/Rcvo)+(1/Rrad));
%Equivilant parallel resistance
T4 = T5+bh*Rpar;
%Temperature of the outer surface of the enclosure
end
%% 3.0 Heat Conduction through Enclosure
T3 = T4+bh*Et/(Ek*(E1+2*E2)*1);
%Temperature of the inner surface of the enclosure
%% 4.0 Heat Transfer within the Enclosure
T1a = T3 + 60; %Initial Guess of Temperature of outside surface
%of enclosure, °C
Qr = 0.1*bh ; %Initial Busbar radiation heat loss
for loop = 1:3 %Loop 3 times to improve result accuracy
%% 4.1 Heat Absorbed by the Enclosure
Tf13 = (T1a+T3)/2 + 273;
%Average temp between T2 and T3
Tf13a= (Tf13-300)/100 ;
p12 = ( p400- p300)*Tf13a+ p300;
cp13 = (cp400-cp300)*Tf13a+cp300;
u13 = ( u400- u300)*Tf13a+ u300;
v13 = ( v400- v300)*Tf13a+ v300;
k13 = ( k400- k300)*Tf13a+ k300;
a13 = ( a400- a300)*Tf13a+ a300;
Pr13 = (Pr400-Pr300)*Tf13a+Pr300;
B13 = 1/Tf13;
% 4.2 Convection Heat Loss from Enclosure
% 4.2.1 Inner Rayleigh Numbers for Bus Zone
RaLH = g*B13*(T1a-T3)*(E1^3)/(v13*a13);
%Enclosure Horizontal Rayleigh Number
RaLV = g*B13*(T1a-T3)*(E2^3)/(v13*a13);
%Enclosure Vertical Rayleigh Number
% 4.3 Cellular flow in a cavity
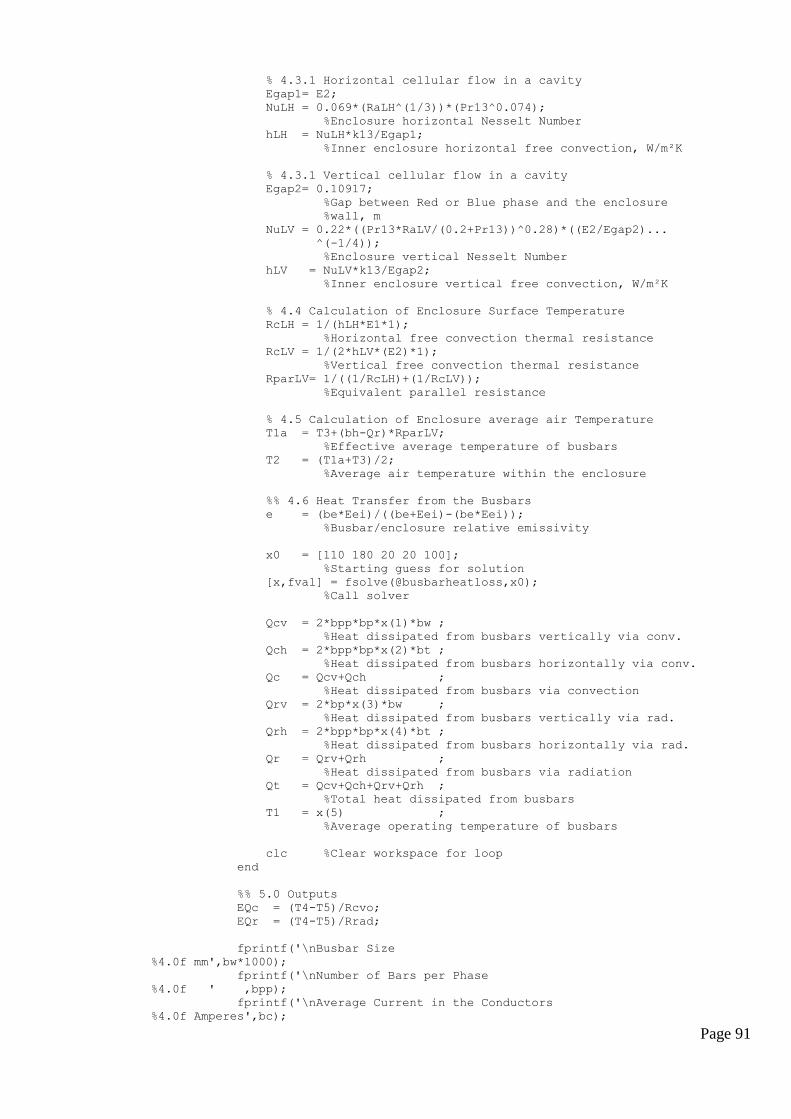
Page 91
% 4.3.1 Horizontal cellular flow in a cavity
Egap1= E2;
NuLH = 0.069*(RaLH^(1/3))*(Pr13^0.074);
%Enclosure horizontal Nesselt Number
hLH = NuLH*k13/Egap1;
%Inner enclosure horizontal free convection, W/m²K
% 4.3.1 Vertical cellular flow in a cavity
Egap2= 0.10917;
%Gap between Red or Blue phase and the enclosure
%wall, m
NuLV = 0.22*((Pr13*RaLV/(0.2+Pr13))^0.28)*((E2/Egap2)...
^(-1/4));
%Enclosure vertical Nesselt Number
hLV = NuLV*k13/Egap2;
%Inner enclosure vertical free convection, W/m²K
% 4.4 Calculation of Enclosure Surface Temperature
RcLH = 1/(hLH*E1*1);
%Horizontal free convection thermal resistance
RcLV = 1/(2*hLV*(E2)*1);
%Vertical free convection thermal resistance
RparLV= 1/((1/RcLH)+(1/RcLV));
%Equivalent parallel resistance
% 4.5 Calculation of Enclosure average air Temperature
T1a = T3+(bh-Qr)*RparLV;
%Effective average temperature of busbars
T2 = (T1a+T3)/2;
%Average air temperature within the enclosure
%% 4.6 Heat Transfer from the Busbars
e = (be*Eei)/((be+Eei)-(be*Eei));
%Busbar/enclosure relative emissivity
x0 = [110 180 20 20 100];
%Starting guess for solution
[x,fval] = fsolve(@busbarheatloss,x0);
%Call solver
Qcv = 2*bpp*bp*x(1)*bw ;
%Heat dissipated from busbars vertically via conv.
Qch = 2*bpp*bp*x(2)*bt ;
%Heat dissipated from busbars horizontally via conv.
Qc = Qcv+Qch ;
%Heat dissipated from busbars via convection
Qrv = 2*bp*x(3)*bw ;
%Heat dissipated from busbars vertically via rad.
Qrh = 2*bpp*bp*x(4)*bt ;
%Heat dissipated from busbars horizontally via rad.
Qr = Qrv+Qrh ;
%Heat dissipated from busbars via radiation
Qt = Qcv+Qch+Qrv+Qrh ;
%Total heat dissipated from busbars
T1 = x(5) ;
%Average operating temperature of busbars
clc %Clear workspace for loop
end
%% 5.0 Outputs
EQc = (T4-T5)/Rcvo;
EQr = (T4-T5)/Rrad;
fprintf('\nBusbar Size
%4.0f mm',bw*1000);
fprintf('\nNumber of Bars per Phase
%4.0f ' ,bpp);
fprintf('\nAverage Current in the Conductors
%4.0f Amperes',bc);
Page 92
fprintf('\nPower dissipated per unit length of busbar arrangement
%3.1f Watts' ,Qt);
fprintf('\nTotal heat dissipated per unit length of enclosure
%3.1f Watts' ,bh);
fprintf('\n');
fprintf('\nTemperature of the enclosure surroundings
%3.1f°C',T5);
fprintf('\nAverage temperature of the enclosure outer surface
%3.1f°C',T4);
fprintf('\nAverage temperature of the enclosure inner surface
%3.1f°C',T3);
fprintf('\nAverage temperature of air within the enclosure
%3.1f°C',T2);
fprintf('\nAverage temperature of busbar
%3.1f°C',T1);
fprintf('\n');
fprintf('\nHeat dissipated from busbars due to convection
%3.1f Watts',Qc);
fprintf('\nHeat dissipated from busbars due to radiation
%3.1f Watts',Qr);
fprintf('\nHeat conducted through enclosure wall
%3.1f Watts',bh);
fprintf('\nHeat dissipated from enclosure due to convection
%3.1f Watts',EQc);
fprintf('\nHeat dissipated from enclosure due to radiation
%3.1f Watts',EQr);
fprintf('\n');
results(plotloop,1) = bc;
results(plotloop,sizeloop+1) = T1;
%Record the results of the Busbar operating temperature
%vs. the current
bc = bc + 1;
%Increment the current for next loop
elseif finish ~= 1
plot(results(1:plotloop-1,1),results(1:plotloop-1,sizeloop+1))
%Graph the results for the current arrangement
finish = 1;
%Execute this function only once per arrangement
end
end
end
grid %Add Grid to graphs
% End Program
Page 93
9 Appendix C
9.1 AS 3000:1991 Method Calculations
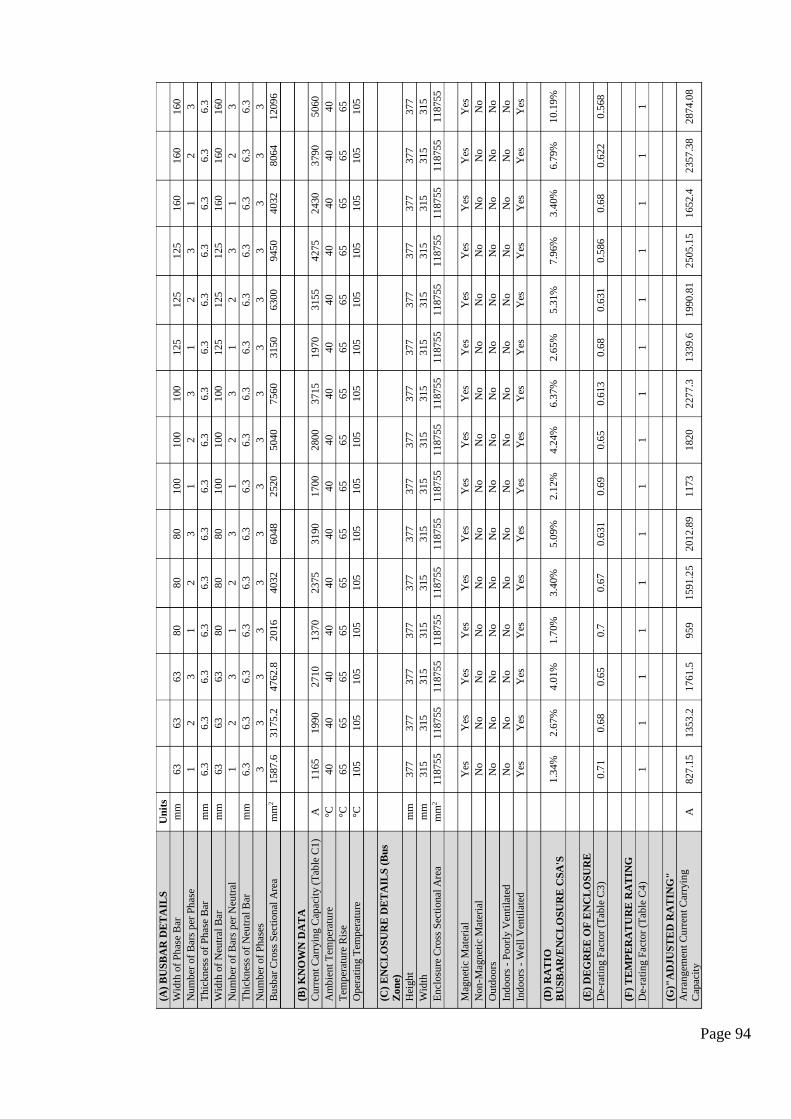
Page 94
(A
) B
US
BA
R D
ET
AIL
S
Un
its
W
idth
of
Ph
ase
Bar
m
m
63
63
63
80
80
80
100
100
100
125
125
125
160
160
160
Nu
mb
er o
f B
ars
per
Ph
ase
1
2
3
1
2
3
1
2
3
1
2
3
1
2
3
Th
ickn
ess
of
Phas
e B
ar
mm
6
.3
6.3
6
.3
6.3
6
.3
6.3
6
.3
6.3
6
.3
6.3
6
.3
6.3
6
.3
6.3
6
.3
Wid
th o
f N
eutr
al B
ar
mm
6
3
63
63
80
80
80
100
100
100
125
125
125
160
160
160
Nu
mb
er o
f B
ars
per
Neu
tral
1
2
3
1
2
3
1
2
3
1
2
3
1
2
3
Th
ickn
ess
of
Neu
tral
Bar
m
m
6.3
6
.3
6.3
6
.3
6.3
6
.3
6.3
6
.3
6.3
6
.3
6.3
6
.3
6.3
6
.3
6.3
Nu
mb
er o
f P
has
es
3
3
3
3
3
3
3
3
3
3
3
3
3
3
3
Bu
sbar
Cro
ss S
ecti
on
al A
rea
mm
2
1587
.6
3175
.2
4762
.8
2016
4032
6048
2520
5040
7560
3150
6300
9450
4032
8064
1209
6
(B
) K
NO
WN
DA
TA
C
urr
ent
Car
ryin
g C
apac
ity (
Tab
le C
1)
A
1165
1990
2710
1370
2375
3190
1700
2800
3715
1970
3155
4275
2430
3790
5060
Am
bie
nt
Tem
per
atu
re
°C
40
40
40
40
40
40
40
40
40
40
40
40
40
40
40
Tem
per
atu
re R
ise
°C
65
65
65
65
65
65
65
65
65
65
65
65
65
65
65
Op
erat
ing T
emp
erat
ure
°C
1
05
105
105
105
105
105
105
105
105
105
105
105
105
105
105
(C
) E
NC
LO
SU
RE
DE
TA
ILS
(B
us
Zo
ne)
Hei
gh
t m
m
377
377
377
377
377
377
377
377
377
377
377
377
377
377
377
Wid
th
mm
3
15
315
315
315
315
315
315
315
315
315
315
315
315
315
315
En
closu
re C
ross
Sec
tional
Are
a m
m2
1187
55
1187
55
1187
55
1187
55
1187
55
1187
55
1187
55
1187
55
1187
55
1187
55
1187
55
1187
55
1187
55
1187
55
1187
55
M
agn
etic
Mat
eria
l
Yes
Y
es
Yes
Y
es
Yes
Y
es
Yes
Y
es
Yes
Y
es
Yes
Y
es
Yes
Y
es
Yes
Non
-Mag
net
ic M
ater
ial
N
o
No
No
No
No
No
No
No
No
No
No
No
No
No
No
Ou
tdoors
No
No
No
No
No
No
No
No
No
No
No
No
No
No
No
Ind
oors
- P
oorl
y V
enti
late
d
N
o
No
No
No
No
No
No
No
No
No
No
No
No
No
No
Ind
oors
- W
ell
Ven
tila
ted
Y
es
Yes
Y
es
Yes
Y
es
Yes
Y
es
Yes
Y
es
Yes
Y
es
Yes
Y
es
Yes
Y
es
(D
) R
AT
IO
BU
SB
AR
/EN
CL
OS
UR
E C
SA
'S
1
.34%
2
.67%
4
.01%
1
.70%
3
.40%
5
.09%
2
.12%
4
.24%
6
.37%
2
.65%
5
.31%
7
.96%
3
.40%
6
.79%
1
0.1
9%
(E
) D
EG
RE
E O
F E
NC
LO
SU
RE
D
e-ra
tin
g F
acto
r (T
able
C3
)
0.7
1
0.6
8
0.6
5
0.7
0
.67
0.6
31
0.6
9
0.6
5
0.6
13
0.6
8
0.6
31
0.5
86
0.6
8
0.6
22
0.5
68
(F
) T
EM
PE
RA
TU
RE
RA
TIN
G
De-
rati
ng F
acto
r (T
able
C4
)
1
1
1
1
1
1
1
1
1
1
1
1
1
1
1
(G
)"A
DJ
US
TE
D R
AT
ING
"
Arr
angem
ent
Cu
rren
t C
arry
ing
Cap
acit
y
A
827
.15
1353
.2
1761
.5
959
1591
.25
2012
.89
1173
1820
2277
.3
1339
.6
1990
.81
2505
.15
1652
.4
2357
.38
2874
.08
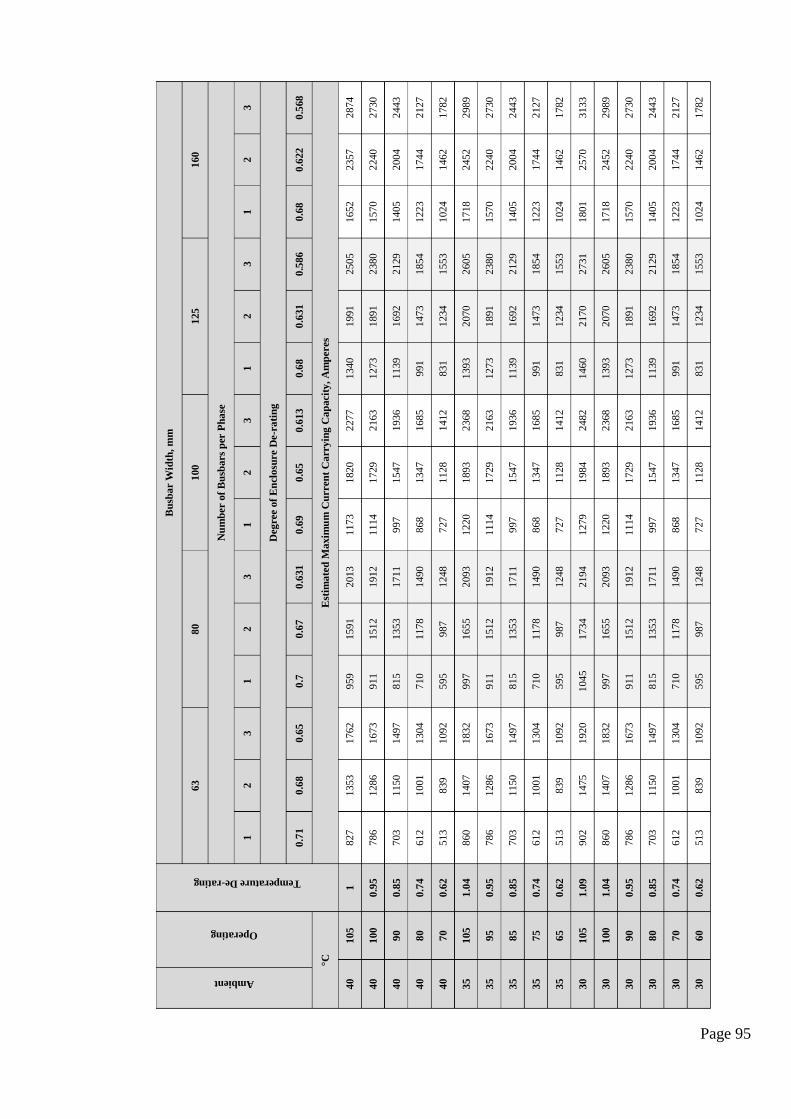
Page 95
Ambient
Operating
Temperature De-rating
Bu
sba
r W
idth
, m
m
63
80
100
125
160
Nu
mb
er o
f B
usb
ars
per
Ph
ase
1
2
3
1
2
3
1
2
3
1
2
3
1
2
3
Deg
ree o
f E
ncl
osu
re D
e-r
ati
ng
0.7
1
0.6
8
0.6
5
0.7
0
.67
0.6
31
0.6
9
0.6
5
0.6
13
0.6
8
0.6
31
0.5
86
0.6
8
0.6
22
0.5
68
°C
Est
ima
ted
Ma
xim
um
Cu
rren
t C
arr
yin
g C
ap
acit
y,
Am
peres
40
105
1
827
1353
1762
959
1591
2013
1173
1820
2277
1340
1991
2505
1652
2357
2874
40
100
0.9
5
786
1286
1673
911
1512
1912
1114
1729
2163
1273
1891
2380
1570
2240
2730
40
90
0.8
5
703
1150
1497
815
1353
1711
997
1547
1936
1139
1692
2129
1405
2004
2443
40
80
0.7
4
612
1001
1304
710
1178
1490
868
1347
1685
991
1473
1854
1223
1744
2127
40
70
0.6
2
513
839
1092
595
987
1248
727
1128
1412
831
1234
1553
1024
1462
1782
35
105
1.0
4
860
1407
1832
997
1655
2093
1220
1893
2368
1393
2070
2605
1718
2452
2989
35
95
0.9
5
786
1286
1673
911
1512
1912
1114
1729
2163
1273
1891
2380
1570
2240
2730
35
85
0.8
5
703
1150
1497
815
1353
1711
997
1547
1936
1139
1692
2129
1405
2004
2443
35
75
0.7
4
612
1001
1304
710
1178
1490
868
1347
1685
991
1473
1854
1223
1744
2127
35
65
0.6
2
513
839
1092
595
987
1248
727
1128
1412
831
1234
1553
1024
1462
1782
30
105
1.0
9
902
1475
1920
1045
1734
2194
1279
1984
2482
1460
2170
2731
1801
2570
3133
30
100
1.0
4
860
1407
1832
997
1655
2093
1220
1893
2368
1393
2070
2605
1718
2452
2989
30
90
0.9
5
786
1286
1673
911
1512
1912
1114
1729
2163
1273
1891
2380
1570
2240
2730
30
80
0.8
5
703
1150
1497
815
1353
1711
997
1547
1936
1139
1692
2129
1405
2004
2443
30
70
0.7
4
612
1001
1304
710
1178
1490
868
1347
1685
991
1473
1854
1223
1744
2127
30
60
0.6
2
513
839
1092
595
987
1248
727
1128
1412
831
1234
1553
1024
1462
1782
Page 96
10 Appendix D
10.1 AS 60890:2009 Method Calculations
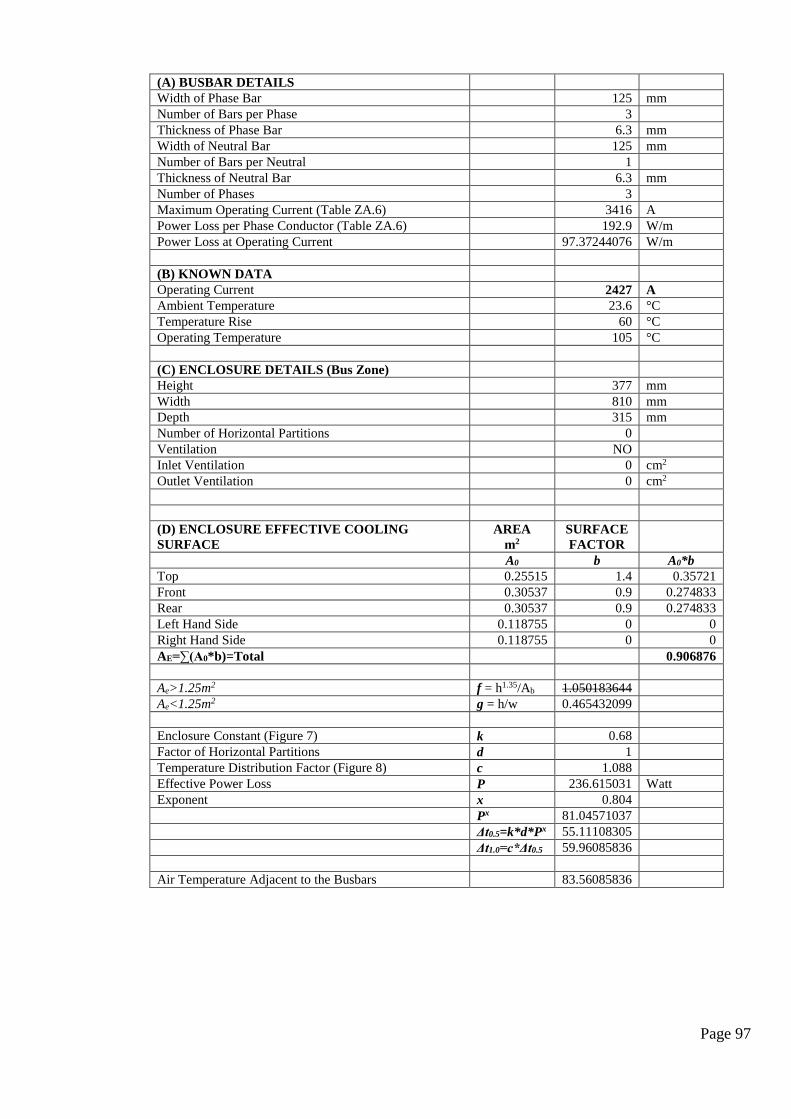
Page 97
(A) BUSBAR DETAILS
Width of Phase Bar 125 mm
Number of Bars per Phase 3
Thickness of Phase Bar 6.3 mm
Width of Neutral Bar 125 mm
Number of Bars per Neutral 1
Thickness of Neutral Bar 6.3 mm
Number of Phases 3
Maximum Operating Current (Table ZA.6) 3416 A
Power Loss per Phase Conductor (Table ZA.6) 192.9 W/m
Power Loss at Operating Current 97.37244076 W/m
(B) KNOWN DATA
Operating Current 2427 A
Ambient Temperature 23.6 °C
Temperature Rise 60 °C
Operating Temperature 105 °C
(C) ENCLOSURE DETAILS (Bus Zone)
Height 377 mm
Width 810 mm
Depth 315 mm
Number of Horizontal Partitions 0
Ventilation NO
Inlet Ventilation 0 cm2
Outlet Ventilation 0 cm2
(D) ENCLOSURE EFFECTIVE COOLING
SURFACE
AREA
m2
SURFACE
FACTOR
A0 b A0*b
Top 0.25515 1.4 0.35721
Front 0.30537 0.9 0.274833
Rear 0.30537 0.9 0.274833
Left Hand Side 0.118755 0 0
Right Hand Side 0.118755 0 0
AE=∑(A0*b)=Total 0.906876
Ae>1.25m2 f = h1.35/Ab 1.050183644
Ae<1.25m2 g = h/w 0.465432099
Enclosure Constant (Figure 7) k 0.68
Factor of Horizontal Partitions d 1
Temperature Distribution Factor (Figure 8) c 1.088
Effective Power Loss P 236.615031 Watt
Exponent x 0.804
Px 81.04571037
Δt0.5=k*d*Px 55.11108305
Δt1.0=c*Δt0.5 59.96085836
Air Temperature Adjacent to the Busbars 83.56085836 83.56085836

Page 98
11 Appendix E
11.1 Bus Zone General Arrangement Drawings
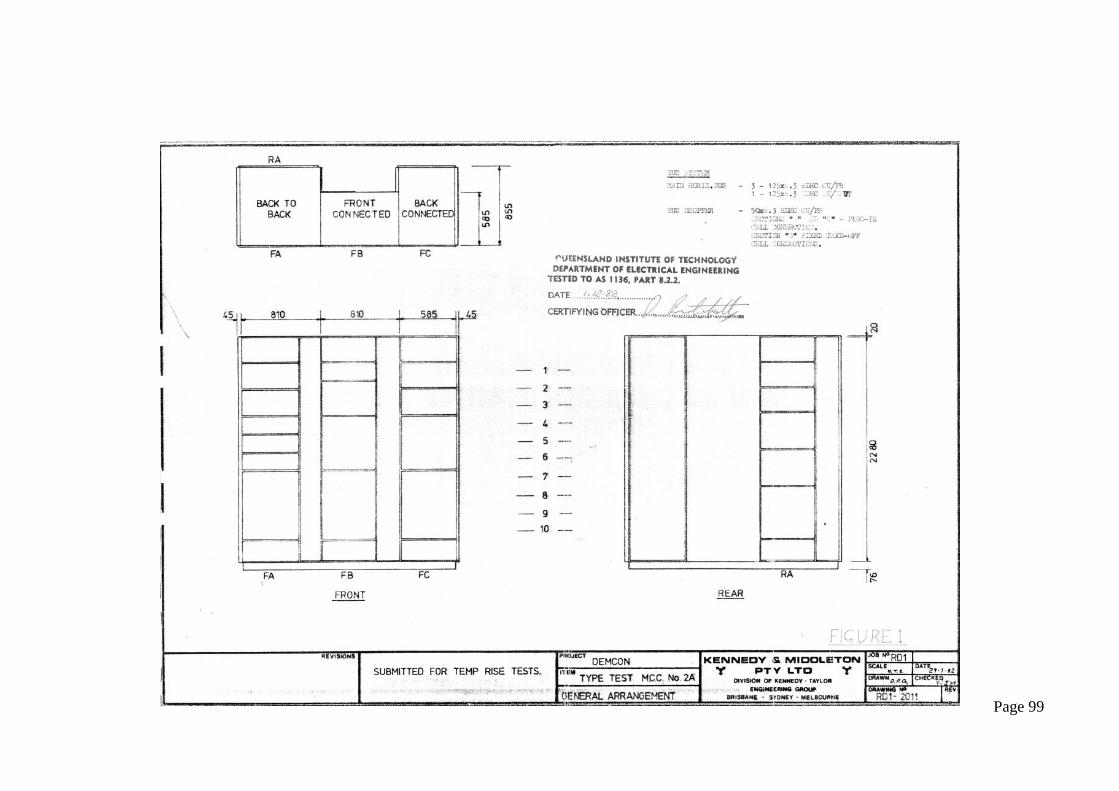
Page 99
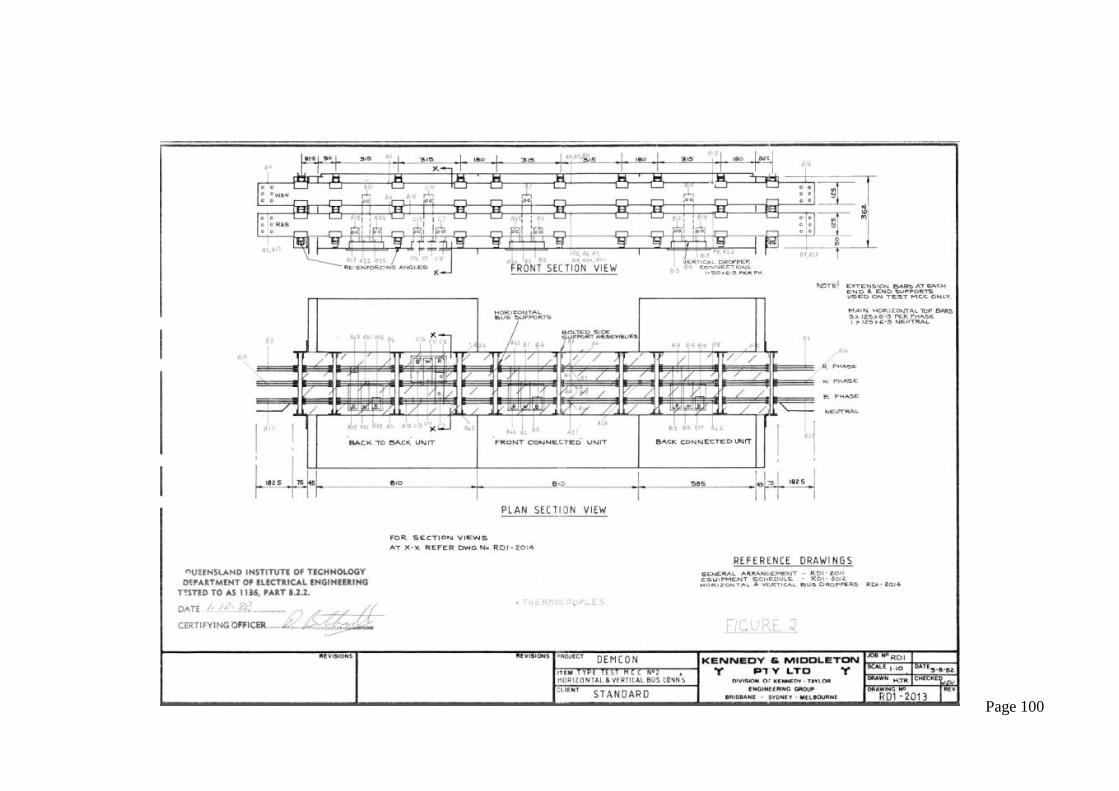
Page 100
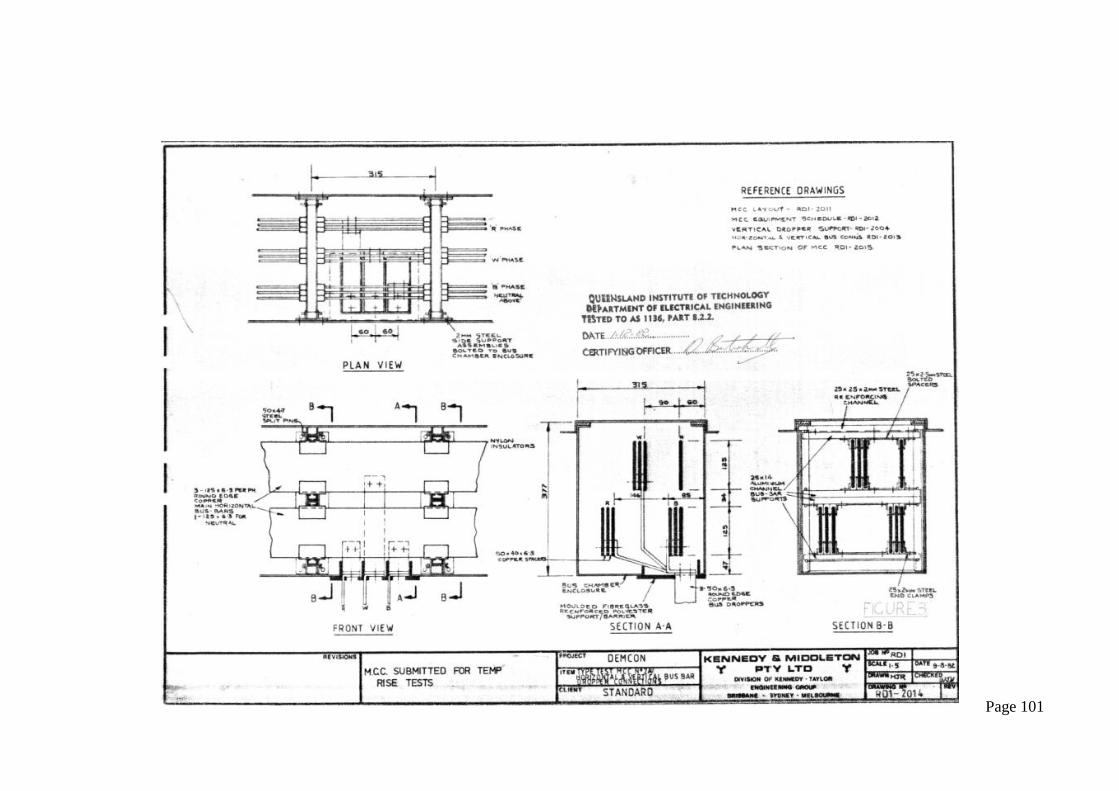
Page 101
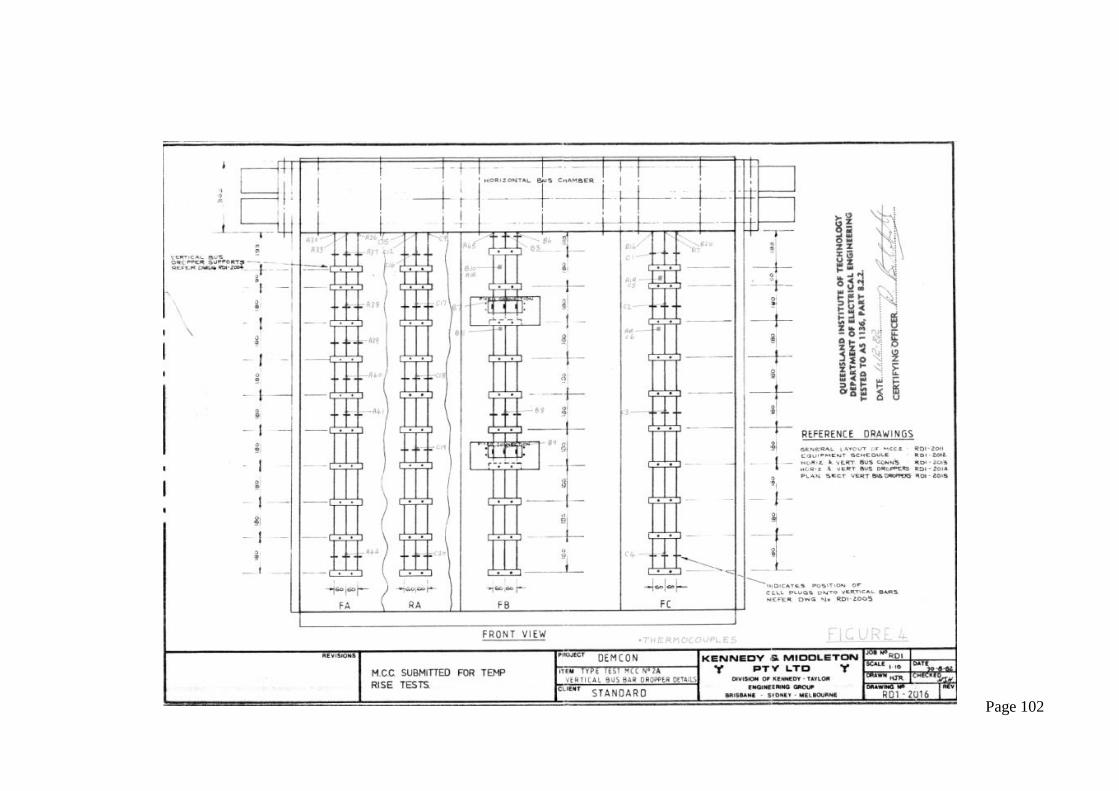
Page 102
Page 103
12 References
Copper Development Association 1996, Copper for Busbars, Pub 22, Copper
Development Association, United Kingdom, Viewed 17 March 2013
<http://www.copperinfo.co.uk/busbars/pub22-copper-for-busbars/homepage.shtml>
Ho S., Li Y., Lin X., Lo E. 2006, Calculations of Eddy Current, Fluid, and Thermal
Fields in an Air Insulated Bus Duct System, Electromagnetic Field Computation, pages
101, Viewed 30 June 2013, IEEE Xplore, 10.1109/CEFC-06.2006.1632893
Tebal N., Pinang P. 2012, Temperature Rise Prediction in 3-Phase Busbar System at
20°C Ambient Temperature, Power and Energy (PECon), 2012 IEEE International
Conference on 2-5 Dec. 2012, pages 736 – 740, Viewed 30 June 2013, IEEE Xplore,
10.1109/PECon.2012.6450313
Standards Australia 1991, SAA Wiring Rules, AS/NZS 3000:1991, Standards Australia,
Sydney, viewed 3 March 2013 <http://www.saiglobal.com/online/autologin.asp>
Standards Australia 2002, Low-voltage switchgear and controlgear assemblies - Type-
tested and partially type-tested assemblies, AS/NZS 3439.1:2002, Standards Australia,
Sydney, viewed 3 March 2013 <http://www.saiglobal.com/online/autologin.asp>
Page 104
Standards Australia 2007, Electrical Installations, AS/NZS 3000:2007, Standards
Australia, Sydney, viewed 3 March 2013
<http://www.saiglobal.com/online/autologin.asp>
Standards Australia 2009, A method of temperature-rise assessment by extrapolation for
partially type-test assemblies (PTTA) of low-voltage switchgear and controlgear,
AS 60890:2009, Standards Australia, Sydney, viewed 3 March 2013
<http://www.saiglobal.com/online/autologin.asp>
Standards Australia 2009, Electrical Installations - Selection of Cables,
AS/NZS 3008.1.1:2009, Standards Australia, Sydney, viewed 3 March 2013
<http://www.saiglobal.com/online/autologin.asp>