Embed Size (px)
Citation preview
J00I00
Maryland Aviation Administration Maryland Department of Transportation
Note: Numbers may not sum to total due to rounding. For further information contact: Jason A. Kramer Phone: (410) 946-5530
Analysis of the FY 2016 Maryland Executive Budget, 2015 1
Operating Budget Data
($ in Thousands)
FY 14 FY 15 FY 16 FY 15-16 % Change
Actual Working Allowance Change Prior Year
Special Fund $189,085 $179,981 $187,004 $7,023 3.9%
Deficiencies and Reductions 0 0 -835 -835
Adjusted Special Fund $189,085 $179,981 $186,169 $6,188 3.4%
Federal Fund 655 776 646 -131 -16.8%
Adjusted Federal Fund $655 $776 $646 -$131 -16.8%
Adjusted Grand Total $189,740 $180,757 $186,814 $6,057 3.4%
Note: The fiscal 2015 working appropriation reflects deficiencies and the Board of Public Works reductions to the extent that
they can be identified by program. The fiscal 2016 allowance reflects back of the bill and contingent reductions to the extent
that they can be identified by program.
The fiscal 2016 allowance increases by $6.1 million, or 3.4%, compared to the fiscal 2015 working
appropriation. Special funds increase by $6.2 million, or 3.4%, in the fiscal 2016 allowance, while
federal funds decrease by approximately $131,000.
Larger changes include a $2.6 million increase in utility costs and a $1.7 million increase in
personnel costs.

J00I00 – MDOT – Maryland Aviation Administration
Analysis of the FY 2016 Maryland Executive Budget, 2015 2
PAYGO Capital Budget Data
($ in Thousands)
Fiscal 2014 Fiscal 2015 Fiscal 2016
Actual Legislative Working Allowance
Special $81,837 $82,020 $95,614 $87,992
Federal $19,367 $23,154 $34,133 $25,248
Subtotal $101,204 $105,174 $129,747 $113,240
Other Funds $110,753 $91,400 $89,300 $101,800
Total $211,957 $196,574 $219,047 $215,040
The fiscal 2015 pay-as-you-go (PAYGO) working appropriation increases by $24.6 million
compared to the legislative appropriation. The increase is due to increases in system preservation
projects and increased costs for construction of the B/C Connector.
The fiscal 2016 PAYGO allowance decreases by $16.5 million compared to the fiscal 2015
working appropriation primarily due to a decrease in spending on system preservation projects.
Operating and PAYGO Personnel Data
FY 14 FY 15 FY 16 FY 15-16
Actual Working Allowance Change
Regular Operating Budget Positions
451.50
455.50
455.50
0.00
Regular PAYGO Budget Positions
48.00 48.00 48.00 0.00
Total Regular Positions 499.50 503.50 503.50 0.00
Operating Budget FTEs 0.50 0.50 0.50 0.00
PAYGO Budget FTEs 0.00 0.00 0.00 0.00
Total FTEs 0.50 0.50 0.50 0.00
Total Personnel 500.00 504.00 504.00 0.00
Vacancy Data: Regular Positions
Turnover and Necessary Vacancies, Excluding New
Positions 30.01 5.96%
Positions and Percentage Vacant as of 12/31/14 32 6.4%

J00I00 – MDOT – Maryland Aviation Administration
Analysis of the FY 2016 Maryland Executive Budget, 2015 3
The fiscal 2016 allowance for the personnel complement remains unchanged, however,
five new positions to maintain service for expanded facility operations were added in
January 2015 by the Board of Public Works outside of the “Rule of 100,” paid for entirely by
special funds.
The budgeted turnover rate in fiscal 2016 is 5.96%, requiring 30.01 vacant positions. As of
December 31, 2014, the department had 32.0 vacant positions for a turnover rate of 6.4%.
Analysis in Brief
Major Trends
Total Passengers Decrease: Largely due to the federal budget shutdown, a weak economy, and
sequestration, the number of passengers at Baltimore/Washington International Thurgood Marshall
Airport (BWI Marshall Airport) declined by 2.4% in calendar 2014. The Maryland Aviation
Administration (MAA) should comment on whether the decline in fuel prices or other factors
could drive an increase in passengers at BWI Marshall Airport.
Passenger Market Share Flat: BWI Marshall Airport maintained its market share in calendar 2014
relative to Ronald Reagan Washington National Airport and Washington Dulles International Airport.
The Department of Legislative Services (DLS) recommends that MAA discuss the competitive
landscape and what the coming years may hold for airports in the region. MAA should also
discuss the impact of the growth in international service at BWI Marshall Airport.
Cost and Revenue Per Enplaned Passenger: The cost per enplaned passenger at BWI Marshall
Airport increased from $9.50 to $9.88, while the revenue per enplaned passenger decreased from
$11.09 to $10.16.
Financial Results: Net operating income of $26.8 million is expected in fiscal 2016. Operating and
capital spending for MAA will outpace revenue in fiscal 2016 by $61.2 million, requiring a subsidy
from the Transportation Trust Fund.
Issues
Plans for BWI Hotel Progress: MAA is continuing with its plans to build a hotel next to the hourly
parking garage and linked to the terminal via skywalk. The $2.9 million demolition of the closed
Four Points by Sheraton BWI and grading of the site will be finished spring 2015, and MAA will issue
a request for proposal to enter into a long-term lease – likely 50 years – with a developer in order to
complete the project. DLS recommends that MAA discuss its plan for a new hotel and why
maintaining ownership and entering a long-term lease for operation of the hotel, rather than
selling the property, is more beneficial to MAA.
J00I00 – MDOT – Maryland Aviation Administration
Analysis of the FY 2016 Maryland Executive Budget, 2015 4
Operating Budget Recommended Actions
1. Concur with Governor’s allowance.
PAYGO Budget Recommended Actions
1. Concur with Governor’s allowance.
Update
Small Business Reserve Program: MAA awarded 27 nondesignated contracts to small businesses
totaling $115.8 million over the fiscal 2009 to 2014 period, and another 20 designated Small Business
Reserve procurements totaling $17.7 million.
J00I00
Maryland Aviation Administration Maryland Department of Transportation
Analysis of the FY 2016 Maryland Executive Budget, 2015 5
Budget Analysis
Program Description
The Maryland Aviation Administration (MAA) has responsibility for fostering, developing, and
regulating aviation activity throughout the State. MAA is responsible for operating, maintaining, and
developing the State-owned Baltimore/Washington International Thurgood Marshall Airport
(BWI Marshall Airport) as a major center of commercial air carrier service in the State and Martin State
Airport (MTN) as a general aviation reliever facility and as a support facility for the Maryland Air
National Guard and the Maryland State Police. MAA strives to make the Maryland aviation system
the “Easy Come, Easy Go” gateway to the world, and to achieve this it has identified the following key
goals:
keeping BWI Marshall Airport passengers, tenants, and facilities safe;
operating BWI Marshall Airport efficiently and effectively;
attracting, maintaining, and expanding air service; and
providing exceptional service.
Performance Analysis: Managing for Results
1. Total Passengers Decrease
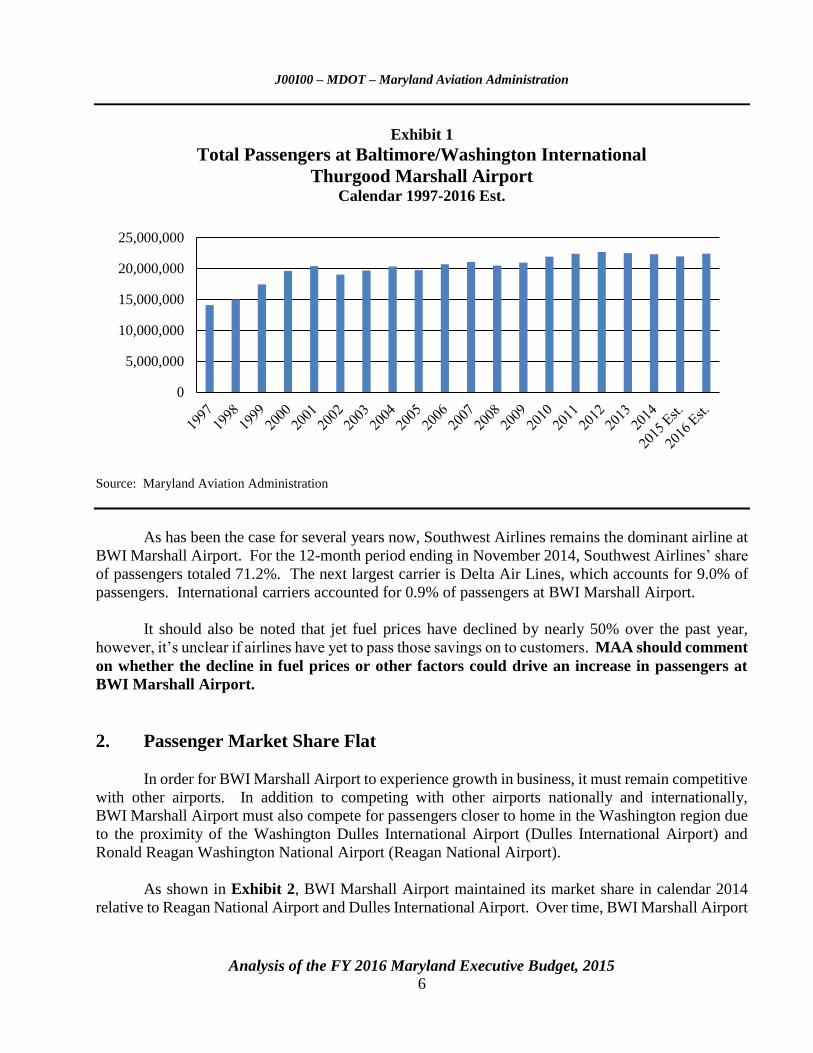
Passenger traffic at BWI Marshall Airport totaled 22.3 million passengers, a decrease of 0.8%
from calendar 2013 to 2014. As shown in Exhibit 1, over the last two decades, passengers have
increased from 14.0 million in calendar 1997 to 22.5 million in calendar 2013. Since calendar 2008,
BWI Marshall Airport saw steady growth in passengers despite the economic downturn. Beginning in
calendar 2013, the decline in passengers is largely attributable to the impact of the federal budget
shutdown and sequestration, and the weak economy. The decline in passengers continued into
calendar 2014, however, the decline was lower than expected, and MAA is currently revising its’
2015 and 2016 estimates higher.
J00I00 – MDOT – Maryland Aviation Administration
Analysis of the FY 2016 Maryland Executive Budget, 2015 6
Exhibit 1
Total Passengers at Baltimore/Washington International
Thurgood Marshall Airport Calendar 1997-2016 Est.
Source: Maryland Aviation Administration
As has been the case for several years now, Southwest Airlines remains the dominant airline at
BWI Marshall Airport. For the 12-month period ending in November 2014, Southwest Airlines’ share
of passengers totaled 71.2%. The next largest carrier is Delta Air Lines, which accounts for 9.0% of
passengers. International carriers accounted for 0.9% of passengers at BWI Marshall Airport.
It should also be noted that jet fuel prices have declined by nearly 50% over the past year,
however, it’s unclear if airlines have yet to pass those savings on to customers. MAA should comment
on whether the decline in fuel prices or other factors could drive an increase in passengers at
BWI Marshall Airport.
2. Passenger Market Share Flat
In order for BWI Marshall Airport to experience growth in business, it must remain competitive
with other airports. In addition to competing with other airports nationally and internationally,
BWI Marshall Airport must also compete for passengers closer to home in the Washington region due
to the proximity of the Washington Dulles International Airport (Dulles International Airport) and
Ronald Reagan Washington National Airport (Reagan National Airport).
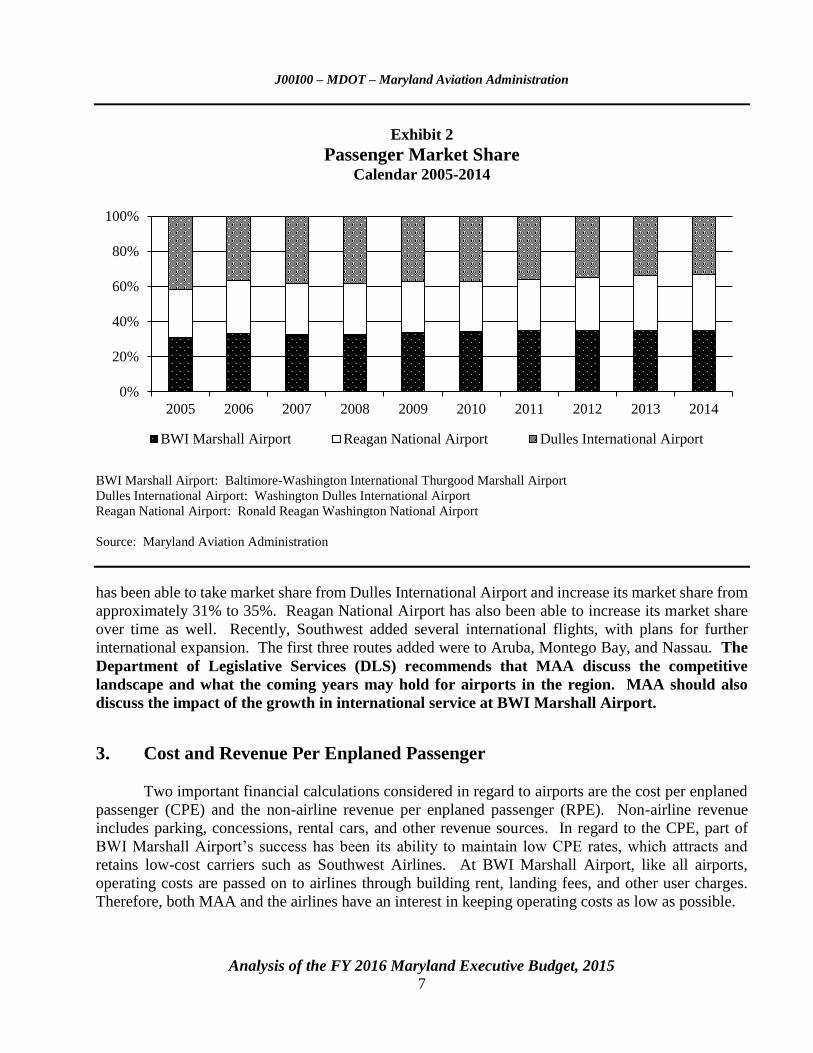
As shown in Exhibit 2, BWI Marshall Airport maintained its market share in calendar 2014
relative to Reagan National Airport and Dulles International Airport. Over time, BWI Marshall Airport
0
5,000,000
10,000,000
15,000,000
20,000,000
25,000,000
J00I00 – MDOT – Maryland Aviation Administration
Analysis of the FY 2016 Maryland Executive Budget, 2015 7
Exhibit 2
Passenger Market Share Calendar 2005-2014
BWI Marshall Airport: Baltimore-Washington International Thurgood Marshall Airport
Dulles International Airport: Washington Dulles International Airport
Reagan National Airport: Ronald Reagan Washington National Airport
Source: Maryland Aviation Administration
has been able to take market share from Dulles International Airport and increase its market share from
approximately 31% to 35%. Reagan National Airport has also been able to increase its market share
over time as well. Recently, Southwest added several international flights, with plans for further
international expansion. The first three routes added were to Aruba, Montego Bay, and Nassau. The
Department of Legislative Services (DLS) recommends that MAA discuss the competitive
landscape and what the coming years may hold for airports in the region. MAA should also
discuss the impact of the growth in international service at BWI Marshall Airport.
3. Cost and Revenue Per Enplaned Passenger
Two important financial calculations considered in regard to airports are the cost per enplaned
passenger (CPE) and the non-airline revenue per enplaned passenger (RPE). Non-airline revenue
includes parking, concessions, rental cars, and other revenue sources. In regard to the CPE, part of
BWI Marshall Airport’s success has been its ability to maintain low CPE rates, which attracts and
retains low-cost carriers such as Southwest Airlines. At BWI Marshall Airport, like all airports,
operating costs are passed on to airlines through building rent, landing fees, and other user charges.
Therefore, both MAA and the airlines have an interest in keeping operating costs as low as possible.
0%
20%
40%
60%
80%
100%
2005 2006 2007 2008 2009 2010 2011 2012 2013 2014
BWI Marshall Airport Reagan National Airport Dulles International Airport
J00I00 – MDOT – Maryland Aviation Administration
Analysis of the FY 2016 Maryland Executive Budget, 2015 8
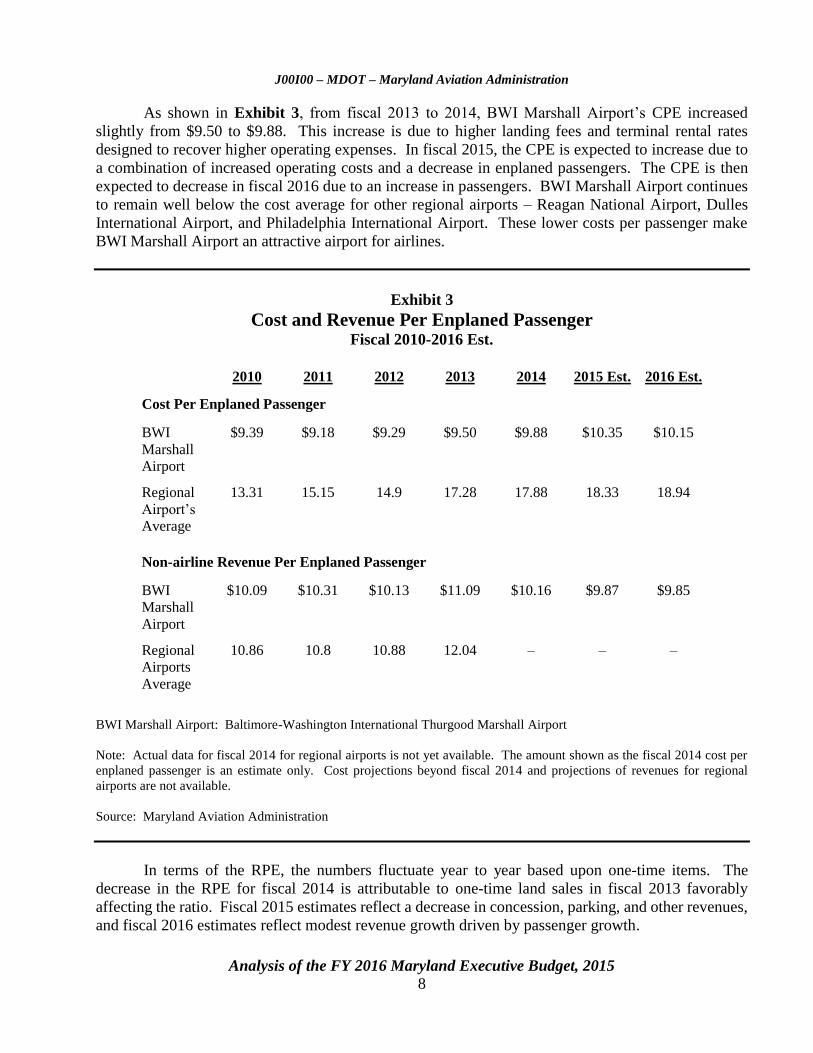
As shown in Exhibit 3, from fiscal 2013 to 2014, BWI Marshall Airport’s CPE increased
slightly from $9.50 to $9.88. This increase is due to higher landing fees and terminal rental rates
designed to recover higher operating expenses. In fiscal 2015, the CPE is expected to increase due to
a combination of increased operating costs and a decrease in enplaned passengers. The CPE is then
expected to decrease in fiscal 2016 due to an increase in passengers. BWI Marshall Airport continues
to remain well below the cost average for other regional airports – Reagan National Airport, Dulles
International Airport, and Philadelphia International Airport. These lower costs per passenger make
BWI Marshall Airport an attractive airport for airlines.
Exhibit 3
Cost and Revenue Per Enplaned Passenger Fiscal 2010-2016 Est.
2010 2011 2012 2013 2014 2015 Est. 2016 Est.
Cost Per Enplaned Passenger
BWI
Marshall
Airport
$9.39 $9.18 $9.29 $9.50 $9.88 $10.35 $10.15
Regional
Airport’s
Average
13.31 15.15 14.9 17.28 17.88 18.33 18.94
Non-airline Revenue Per Enplaned Passenger
BWI
Marshall
Airport
$10.09 $10.31 $10.13 $11.09 $10.16 $9.87 $9.85
Regional
Airports
Average
10.86 10.8 10.88 12.04 – – –
BWI Marshall Airport: Baltimore-Washington International Thurgood Marshall Airport
Note: Actual data for fiscal 2014 for regional airports is not yet available. The amount shown as the fiscal 2014 cost per
enplaned passenger is an estimate only. Cost projections beyond fiscal 2014 and projections of revenues for regional
airports are not available.
Source: Maryland Aviation Administration
In terms of the RPE, the numbers fluctuate year to year based upon one-time items. The
decrease in the RPE for fiscal 2014 is attributable to one-time land sales in fiscal 2013 favorably
affecting the ratio. Fiscal 2015 estimates reflect a decrease in concession, parking, and other revenues,
and fiscal 2016 estimates reflect modest revenue growth driven by passenger growth.

J00I00 – MDOT – Maryland Aviation Administration
Analysis of the FY 2016 Maryland Executive Budget, 2015 9
4. Financial Results
Unlike most other State agencies that rely solely on the State for all support, MAA receives
operating revenues that help offset its expenditures. Its profitability determines how much the
Transportation Trust Fund (TTF) must provide as a subsidy. Although MAA’s revenues have typically
covered its operating expenses, MAA relies on the TTF or other non-MAA financing mechanisms to
fund its capital program.
Exhibit 4 shows MAA’s special fund revenues and expenditures. In fiscal 2016, revenues are
expected to decrease from fiscal 2015 levels while spending also decreases slightly, operating and
capital spending outpace revenues by $61.2 million.
Exhibit 4
Special Fund Revenues and Expenditures Fiscal 2013-2016
2013 2014
Work.
Approp.
2015
Allowance
2016
$ Change
2015-2016
% Change
2015-2016
Operating Revenues
Flight Activities $60,444 $64,125 $61,002 $61,991 $989 1.62%
Rent and User Fees 59,043 64,238 65,036 65,849 813 1.25%
Concessions 78,697 77,486 72,261 74,094 1,833 2.54%
Other Revenues 14,702 2,657 10,964 2,933 -8,031 -73.25%
Martin State Airport 7,885 8,784 7,901 8,133 232 2.94%
Revenues Subtotal $220,771 $217,290 $217,164 $213,000 -$4,164 -1.92%
Operating
Expenditures1
$170,473 $189,085 $179,981 $186,1692 $6,188 3.44%
Net Operating
Income
$50,298 $28,205 $37,183 $26,831 -$10,352 -27.84%
Capital Expenditures1 $55,622 $81,837 $95,614 $87,992 -$7,622 -7.97%
Net Income/Loss -$5,324 -$53,632 -$58,431 -$61,161 -$2,730 -4.67%
1 Includes special funds only. 2Adjusted for cost containment.
Source: Maryland Aviation Administration
It is important to note that in looking at MAA capital expenditures in a business manner,
consideration should be given to the fact that capital expenditures are often paid for in a single year, or
over multiple years, which decreases TTF expenditures for other purposes. Reimbursement from the
airlines (through the Basic Use and Lease Agreement) actually takes place over 5 to 30 years, meaning
that revenues and capital expenditures may not match in a year-to-year comparison.
J00I00 – MDOT – Maryland Aviation Administration
Analysis of the FY 2016 Maryland Executive Budget, 2015 10
Proposed Budget
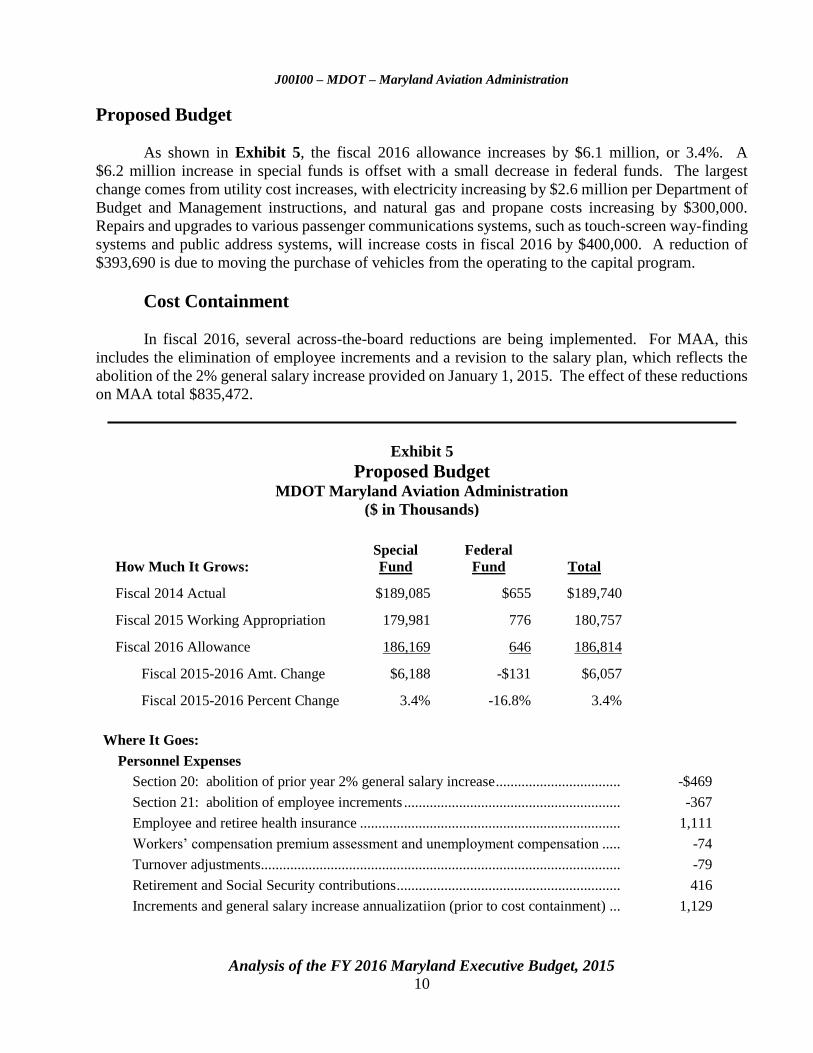
As shown in Exhibit 5, the fiscal 2016 allowance increases by $6.1 million, or 3.4%. A
$6.2 million increase in special funds is offset with a small decrease in federal funds. The largest
change comes from utility cost increases, with electricity increasing by $2.6 million per Department of
Budget and Management instructions, and natural gas and propane costs increasing by $300,000.
Repairs and upgrades to various passenger communications systems, such as touch-screen way-finding
systems and public address systems, will increase costs in fiscal 2016 by $400,000. A reduction of
$393,690 is due to moving the purchase of vehicles from the operating to the capital program.
Cost Containment
In fiscal 2016, several across-the-board reductions are being implemented. For MAA, this
includes the elimination of employee increments and a revision to the salary plan, which reflects the
abolition of the 2% general salary increase provided on January 1, 2015. The effect of these reductions
on MAA total $835,472.
Exhibit 5
Proposed Budget MDOT Maryland Aviation Administration
($ in Thousands)
How Much It Grows:
Special
Fund
Federal
Fund
Total
Fiscal 2014 Actual $189,085 $655 $189,740
Fiscal 2015 Working Appropriation 179,981 776 180,757
Fiscal 2016 Allowance 186,169 646 186,814
Fiscal 2015-2016 Amt. Change $6,188 -$131 $6,057
Fiscal 2015-2016 Percent Change 3.4% -16.8% 3.4%
Where It Goes:
Personnel Expenses
Section 20: abolition of prior year 2% general salary increase .................................. -$469
Section 21: abolition of employee increments ........................................................... -367
Employee and retiree health insurance ....................................................................... 1,111
Workers’ compensation premium assessment and unemployment compensation ..... -74
Turnover adjustments .................................................................................................. -79
Retirement and Social Security contributions ............................................................. 416
Increments and general salary increase annualizatiion (prior to cost containment) ... 1,129
J00I00 – MDOT – Maryland Aviation Administration
Analysis of the FY 2016 Maryland Executive Budget, 2015 11
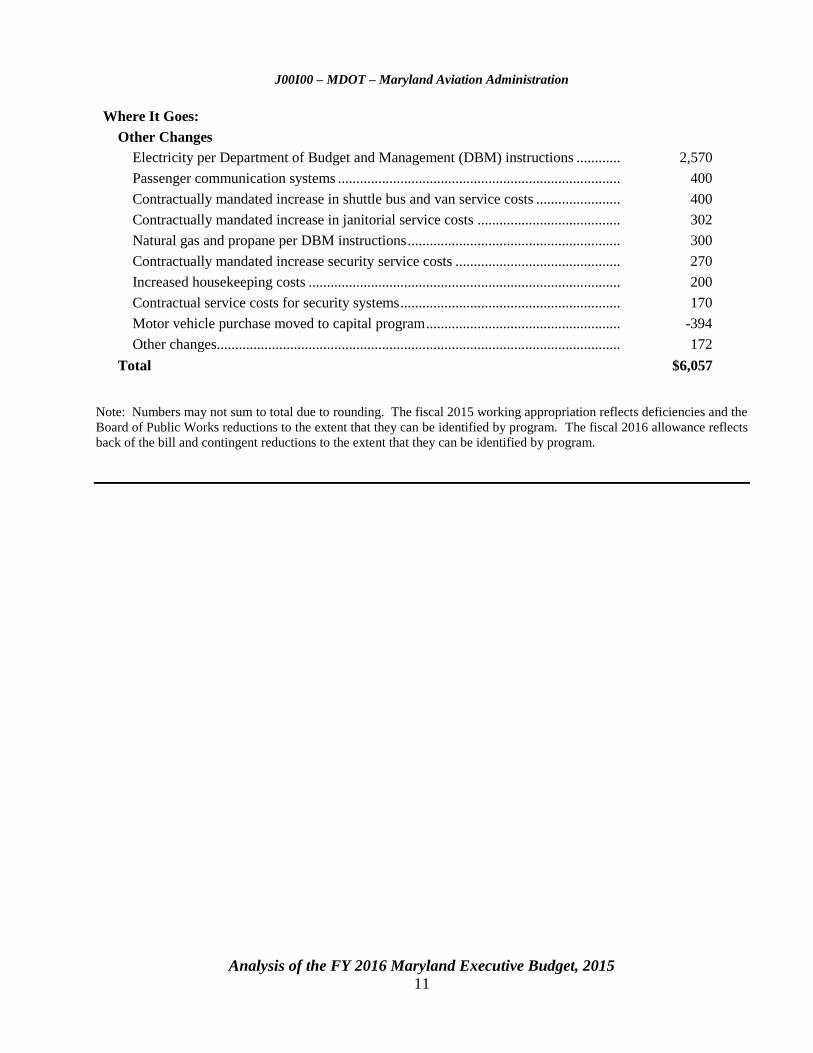
Where It Goes:
Other Changes
Electricity per Department of Budget and Management (DBM) instructions ............ 2,570
Passenger communication systems ............................................................................. 400
Contractually mandated increase in shuttle bus and van service costs ....................... 400
Contractually mandated increase in janitorial service costs ....................................... 302
Natural gas and propane per DBM instructions .......................................................... 300
Contractually mandated increase security service costs ............................................. 270
Increased housekeeping costs ..................................................................................... 200
Contractual service costs for security systems ............................................................ 170
Motor vehicle purchase moved to capital program ..................................................... -394
Other changes.............................................................................................................. 172
Total $6,057
Note: Numbers may not sum to total due to rounding. The fiscal 2015 working appropriation reflects deficiencies and the
Board of Public Works reductions to the extent that they can be identified by program. The fiscal 2016 allowance reflects
back of the bill and contingent reductions to the extent that they can be identified by program.
J00I00 – MDOT – Maryland Aviation Administration
Analysis of the FY 2016 Maryland Executive Budget, 2015 12
PAYGO Capital Program
Program Description
MAA’s capital program provides for the development and maintenance of facilities at
BWI Marshall Airport and MTN. MAA undertakes projects that meet the demands of commercial and
general aviation for both passenger and cargo activities at BWI Marshall Airport. At MTN, facilities
improvements and rehabilitation activities such as runway and taxiway improvements, building and
system renovations, and various maintenance projects are implemented.
Fiscal 2015 to 2020 Consolidated Transportation Program
MAA’s total capital program from fiscal 2015 to 2020 totals $651.1 million, a decrease of
$62.8 million compared to the fiscal 2014 to 2019 Consolidated Transportation Program (CTP).
Funding for projects in the fiscal 2015 to 2020 CTP is largely devoted to funding two types of projects.
The first type is federally mandated improvements to runway safety areas (RSA) and pavement
conditions through the pavement management program (PMP) at BWI Marshall Airport. The second
type of project is concourse-related improvements. Currently, the CTP includes funding for the
construction of the D/E connector.
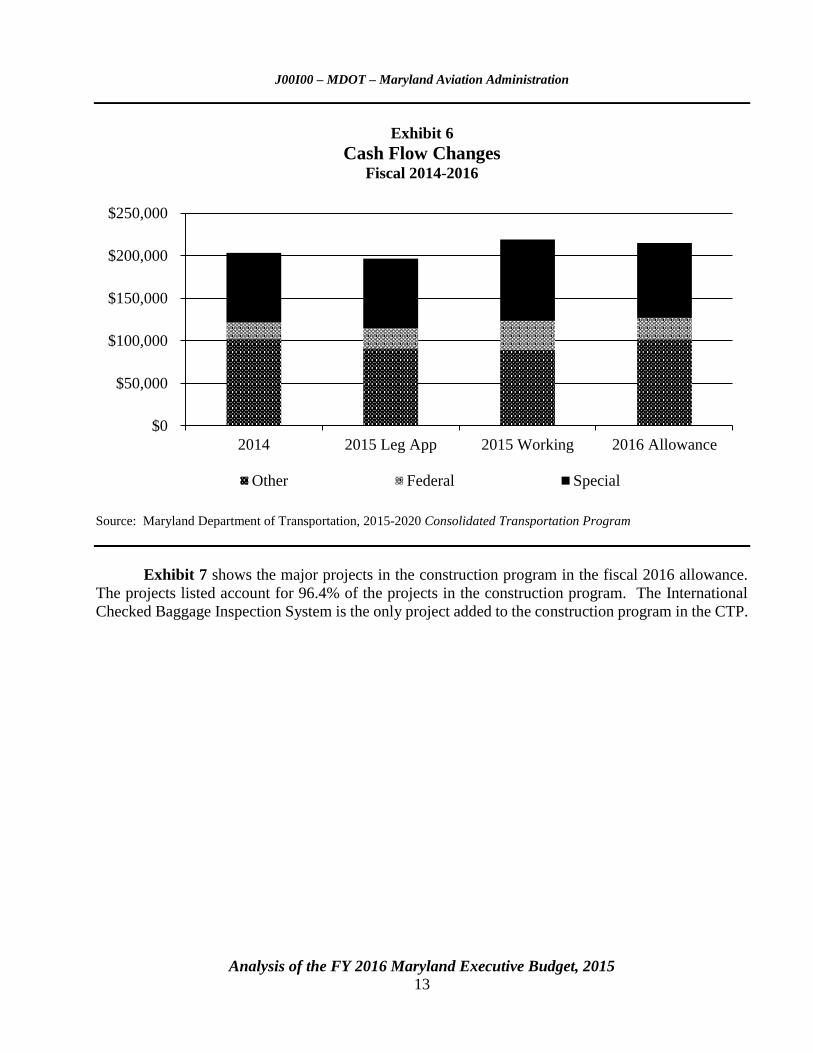
Fiscal 2015 and 2016 Cash Flow Analysis
Exhibit 6 shows that the fiscal 2015 working appropriation increased by $24.6 million (not
including nonbudgeted funds) compared to the legislative appropriation. Including nonbudgeted funds,
the increase is $22.5 million and includes the following:
A $26.9 million increase for system preservation projects.
A $15.9 million increase for several phases of federally mandated runway safety and
pavement improvements.
A $12.3 million increase for the B/C Connector due to a $6.5 million change order for the
Concourse C widening portion of the project and a cash flow shift of $5.8 million in costs
from fiscal 2014 to 2015.
A $6 million increase for the new International Concourse extension that was added to the
Development and Evaluation program.
A $38.9 million decrease for a schedule change for construction of the D/E Connector.
The fiscal 2016 allowance (including nonbudgeted funds) is $4.0 million less than the working
appropriation. A large, scheduled increase in spending of $29.7 million on the D/E Connector and the
new International Checked Baggage System ($8.1 million increase) is offset by a $35.3 million
decrease in spending on minor system preservation projects.
J00I00 – MDOT – Maryland Aviation Administration
Analysis of the FY 2016 Maryland Executive Budget, 2015 13
Exhibit 6
Cash Flow Changes Fiscal 2014-2016
Source: Maryland Department of Transportation, 2015-2020 Consolidated Transportation Program
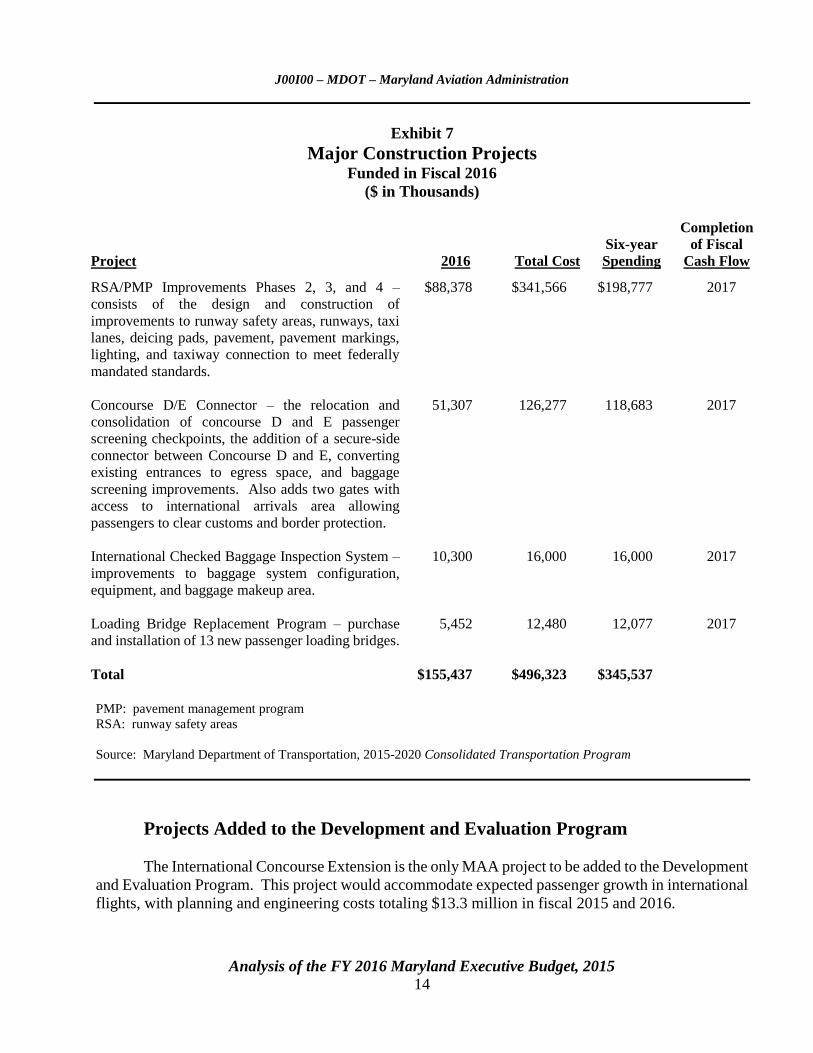
Exhibit 7 shows the major projects in the construction program in the fiscal 2016 allowance.
The projects listed account for 96.4% of the projects in the construction program. The International
Checked Baggage Inspection System is the only project added to the construction program in the CTP.
$0
$50,000
$100,000
$150,000
$200,000
$250,000
2014 2015 Leg App 2015 Working 2016 Allowance
Other Federal Special
J00I00 – MDOT – Maryland Aviation Administration
Analysis of the FY 2016 Maryland Executive Budget, 2015 14
Exhibit 7
Major Construction Projects Funded in Fiscal 2016
($ in Thousands)
Project 2016 Total Cost
Six-year
Spending
Completion
of Fiscal
Cash Flow
RSA/PMP Improvements Phases 2, 3, and 4 –
consists of the design and construction of
improvements to runway safety areas, runways, taxi
lanes, deicing pads, pavement, pavement markings,
lighting, and taxiway connection to meet federally
mandated standards.
$88,378 $341,566 $198,777 2017
Concourse D/E Connector – the relocation and
consolidation of concourse D and E passenger
screening checkpoints, the addition of a secure-side
connector between Concourse D and E, converting
existing entrances to egress space, and baggage
screening improvements. Also adds two gates with
access to international arrivals area allowing
passengers to clear customs and border protection.
51,307 126,277 118,683 2017
International Checked Baggage Inspection System –
improvements to baggage system configuration,
equipment, and baggage makeup area.
10,300 16,000 16,000 2017
Loading Bridge Replacement Program – purchase
and installation of 13 new passenger loading bridges.
5,452 12,480 12,077 2017
Total $155,437 $496,323 $345,537
PMP: pavement management program
RSA: runway safety areas
Source: Maryland Department of Transportation, 2015-2020 Consolidated Transportation Program
Projects Added to the Development and Evaluation Program
The International Concourse Extension is the only MAA project to be added to the Development
and Evaluation Program. This project would accommodate expected passenger growth in international
flights, with planning and engineering costs totaling $13.3 million in fiscal 2015 and 2016.

J00I00 – MDOT – Maryland Aviation Administration
Analysis of the FY 2016 Maryland Executive Budget, 2015 15
Issues
1. Plans for BWI Hotel Progress
MAA is continuing with its plans to build a hotel next to the hourly parking garage and linked
to the terminal via skywalk. MAA expects the $2.9 million demolition of the closed Four Points by
Sheraton BWI and grading of the site will be finished spring 2015.
Also this spring, MAA will issue a request for proposal (RFP) to enter into a long-term lease –
likely 50 years – with a developer in order to complete the project. The developer would be responsible
for the design, construction, finance, operation, and maintenance of the hotel. The issuance of the RFP
was delayed by about one year in order for MAA management to perform due diligence on the project
with an in-depth analysis of comparable airport hotel developments.
MAA stated that it has four objectives for the new hotel: (1) enhance customer experience
through traveler conveniences, quality of services, meeting facilities, and amenities; (2) serve as the
gateway to the Baltimore-Washington Metropolitan area; (3) design a hotel that reflects the
architectural characteristics of BWI Marshall Airport; and (4) maximize revenues through ground rent
and a percentage of new hotel revenues. DLS recommends that MAA discuss its plan for a new
hotel and why maintaining ownership and entering a long-term lease for operation of the hotel,
rather than selling the property, is more beneficial to MAA.
J00I00 – MDOT – Maryland Aviation Administration
Analysis of the FY 2016 Maryland Executive Budget, 2015 16
Operating Budget Recommended Actions
1. Concur with Governor’s allowance.
J00I00 – MDOT – Maryland Aviation Administration
Analysis of the FY 2016 Maryland Executive Budget, 2015 17
PAYGO Budget Recommended Actions
1. Concur with Governor’s allowance.
J00I00 – MDOT – Maryland Aviation Administration
Analysis of the FY 2016 Maryland Executive Budget, 2015 18
Updates
1. Small Business Reserve Program
During the 2014 legislative session, the budget committees requested a report regarding MAA’s
Small Business Reserve Program (SBR), which is intended to bring more opportunities for small
businesses.
MAA reported that it awarded 27 nondesignated contracts to small businesses totaling
$115.8 million over the fiscal 2009 to 2014 period, and another 20 designated SBR procurements
totaling $17.7 million. The average timeline was approximately four to six months from advertisement
to award, although more complex architectural and engineering procurements took an average of
12 months. MAA also reports that it has sent extensive notifications to small businesses regarding
procurement opportunities and has encouraged small businesses already working with the airport to
become certified. In addition, MAA has unbundled some larger contracts to encourage more small
business participation.
MAA also conducts outreach to encourage participation in the SBR program, including
attending events geared toward small businesses as well as women-owned, minority-owned, and
veteran-owned businesses. In the past year, MAA attended the Maryland Hispanic Business
Conference, the Baltimore-Washington Regional Government Procurement Fair, the Baltimore Small
Business Fair, the Government Procurement Fair, the Maryland Washington Minority Companies
Association Spring Fair, and the Legislative Black Caucus Weekend.
J00I00 – MDOT – Maryland Aviation Administration
Analysis of the FY 2016 Maryland Executive Budget, 2015 19
Appendix 1
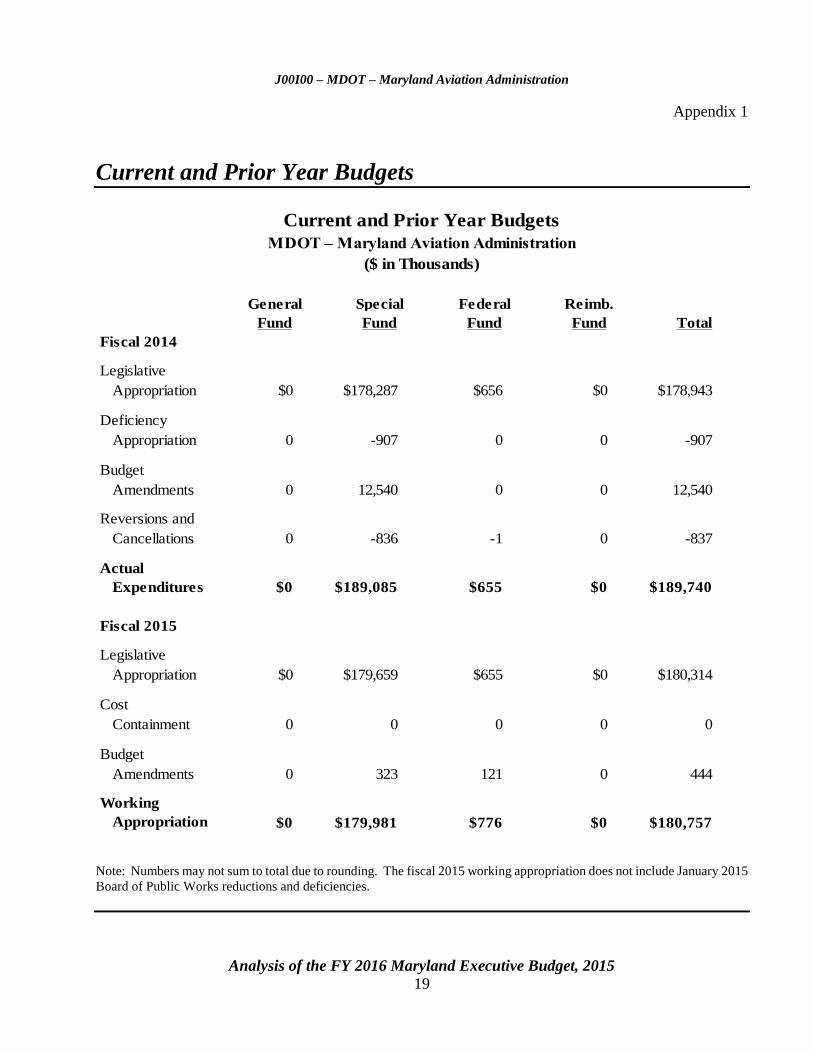
Current and Prior Year Budgets
Fiscal 2014
Legislative
Appropriation $0 $178,287 $656 $0 $178,943
Deficiency
Appropriation 0 -907 0 0 -907
Budget
Amendments 0 12,540 0 0 12,540
Reversions and
Cancellations 0 -836 -1 0 -837
Actual
Expenditures $0 $189,085 $655 $0 $189,740
Fiscal 2015
Legislative
Appropriation $0 $179,659 $655 $0 $180,314
Cost
Containment 0 0 0 0 0
Budget
Amendments 0 323 121 0 444
Working
Appropriation $0 $179,981 $776 $0 $180,757
Current and Prior Year Budgets
Fund FundFund
Reimb.
Fund Total
($ in Thousands)
MDOT – Maryland Aviation Administration
General Special Federal
Note: Numbers may not sum to total due to rounding. The fiscal 2015 working appropriation does not include January 2015
Board of Public Works reductions and deficiencies.
J0
0I0
0 –
MD
OT
Ma
rylan
d A
viatio
n A
dm
inistra
tion
Appen
dix
1
J00I00 – MDOT – Maryland Aviation Administration
Analysis of the FY 2016 Maryland Executive Budget, 2015 20
Fiscal 2014
MAA finished fiscal 2014 approximately $10.8 million above its legislative appropriation.
Retirement contributions were reduced by $647,743 and health care contributions were reduced
by $258,811 through special fund deficiency appropriations.
An amendment increased special funds by $9.4 million for winter maintenance due to an
extraordinary number of winter weather events, and another amendment increased special funds by
$2.5 million for electricity, also due to the severe winter and increased electric rates. Amendments for
the cost-of-living adjustment (COLA) and salary increment increased the appropriation by $613,112 in
special funds.
The Administration cancelled approximately $836,000 primarily due to lower than expected
contributions to employee and retiree health insurance contributions.
Fiscal 2015
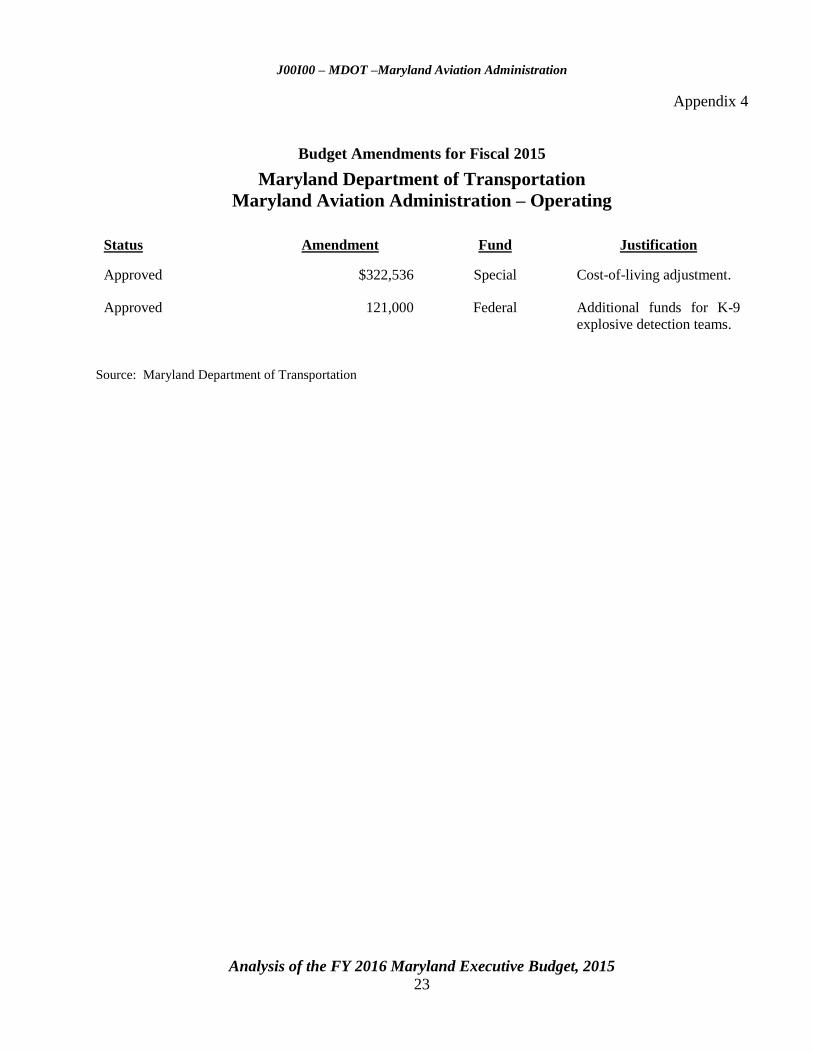
The fiscal 2015 legislative appropriation increased by $322,536 in special funds for the COLA
and by $121,000 in federal funds for a grant for the airport’s Canine Explosive Detection Squad.
An
alysis o
f the F
Y 2
016 M
aryla
nd E
xecu
tive Bu
dget, 2
015
21
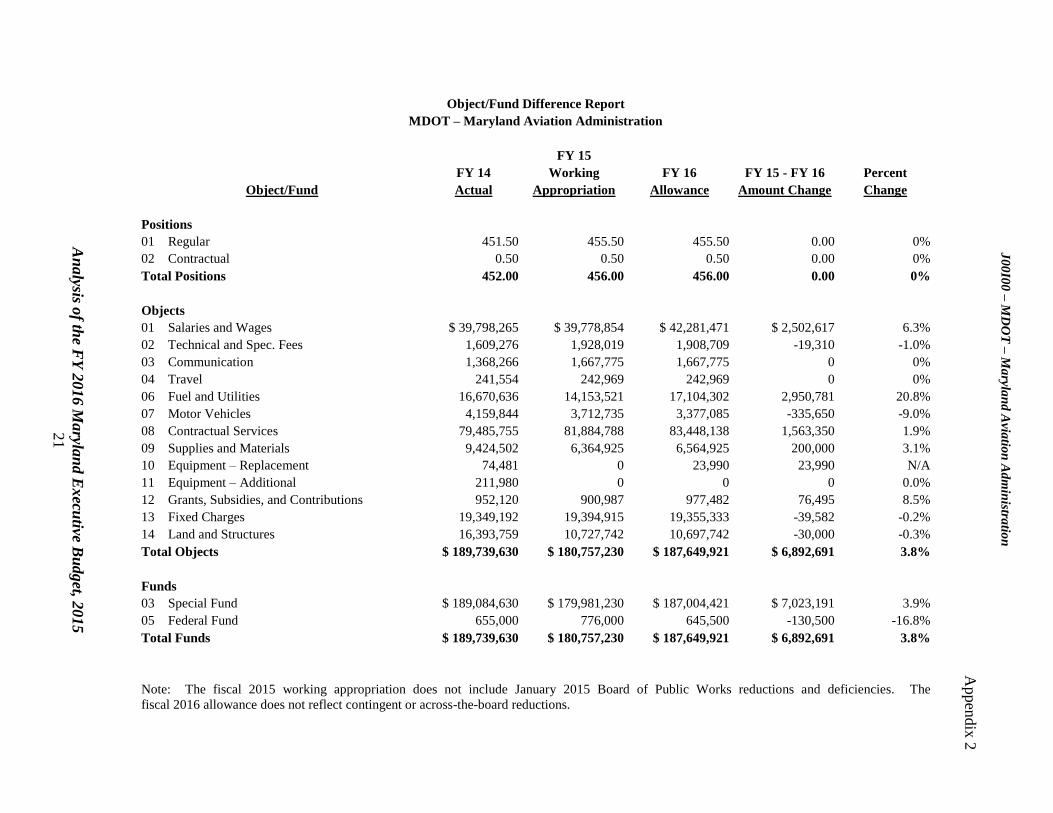
Object/Fund Difference Report
MDOT – Maryland Aviation Administration
FY 15
FY 14 Working FY 16 FY 15 - FY 16 Percent
Object/Fund Actual Appropriation Allowance Amount Change Change
Positions
01 Regular 451.50 455.50 455.50 0.00 0%
02 Contractual 0.50 0.50 0.50 0.00 0%
Total Positions 452.00 456.00 456.00 0.00 0%
Objects
01 Salaries and Wages $ 39,798,265 $ 39,778,854 $ 42,281,471 $ 2,502,617 6.3%
02 Technical and Spec. Fees 1,609,276 1,928,019 1,908,709 -19,310 -1.0%
03 Communication 1,368,266 1,667,775 1,667,775 0 0%
04 Travel 241,554 242,969 242,969 0 0%
06 Fuel and Utilities 16,670,636 14,153,521 17,104,302 2,950,781 20.8%
07 Motor Vehicles 4,159,844 3,712,735 3,377,085 -335,650 -9.0%
08 Contractual Services 79,485,755 81,884,788 83,448,138 1,563,350 1.9%
09 Supplies and Materials 9,424,502 6,364,925 6,564,925 200,000 3.1%
10 Equipment – Replacement 74,481 0 23,990 23,990 N/A
11 Equipment – Additional 211,980 0 0 0 0.0%
12 Grants, Subsidies, and Contributions 952,120 900,987 977,482 76,495 8.5%
13 Fixed Charges 19,349,192 19,394,915 19,355,333 -39,582 -0.2%
14 Land and Structures 16,393,759 10,727,742 10,697,742 -30,000 -0.3%
Total Objects $ 189,739,630 $ 180,757,230 $ 187,649,921 $ 6,892,691 3.8%
Funds
03 Special Fund $ 189,084,630 $ 179,981,230 $ 187,004,421 $ 7,023,191 3.9%
05 Federal Fund 655,000 776,000 645,500 -130,500 -16.8%
Total Funds $ 189,739,630 $ 180,757,230 $ 187,649,921 $ 6,892,691 3.8%
Note: The fiscal 2015 working appropriation does not include January 2015 Board of Public Works reductions and deficiencies. The
fiscal 2016 allowance does not reflect contingent or across-the-board reductions.
J0
0I0
0 –
MD
OT
– M
aryla
nd
Avia
tion
Ad
min
istratio
n
Appen
dix
2
An
alysis o
f the F
Y 2
016 M
aryla
nd E
xecu
tive Bu
dget, 2
015
22
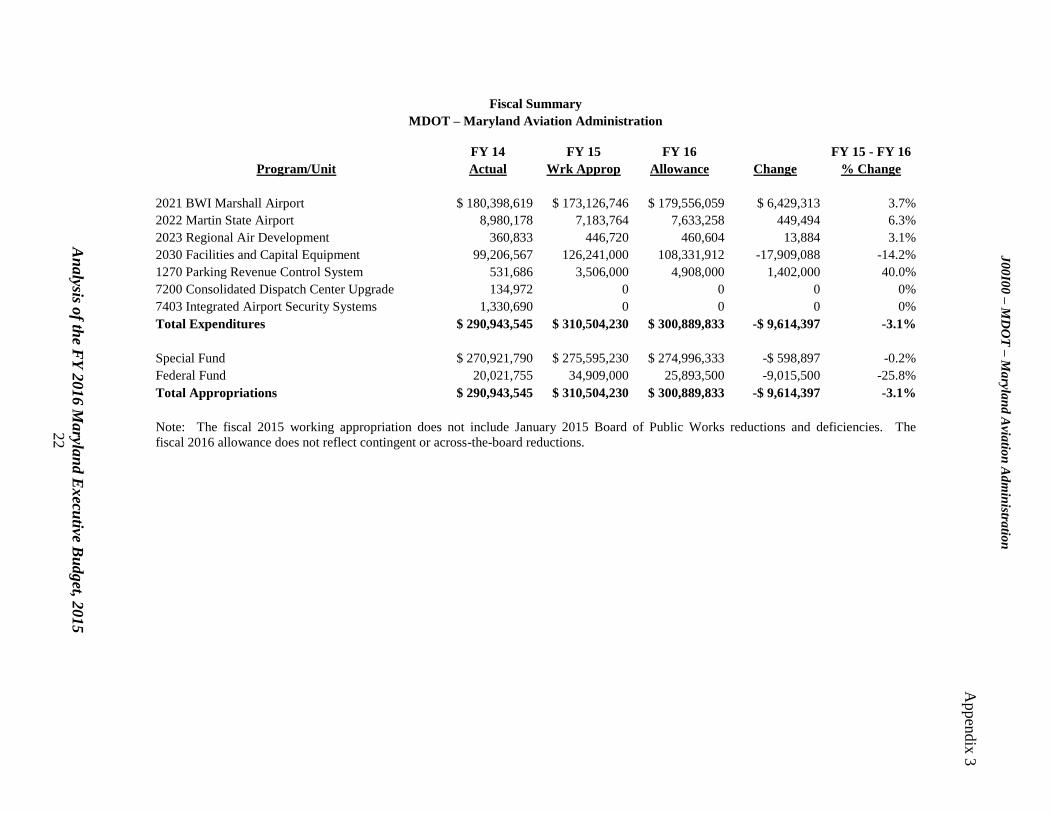
Fiscal Summary
MDOT – Maryland Aviation Administration
FY 14 FY 15 FY 16 FY 15 - FY 16
Program/Unit Actual Wrk Approp Allowance Change % Change
2021 BWI Marshall Airport $ 180,398,619 $ 173,126,746 $ 179,556,059 $ 6,429,313 3.7%
2022 Martin State Airport 8,980,178 7,183,764 7,633,258 449,494 6.3%
2023 Regional Air Development 360,833 446,720 460,604 13,884 3.1%
2030 Facilities and Capital Equipment 99,206,567 126,241,000 108,331,912 -17,909,088 -14.2%
1270 Parking Revenue Control System 531,686 3,506,000 4,908,000 1,402,000 40.0%
7200 Consolidated Dispatch Center Upgrade 134,972 0 0 0 0%
7403 Integrated Airport Security Systems 1,330,690 0 0 0 0%
Total Expenditures $ 290,943,545 $ 310,504,230 $ 300,889,833 -$ 9,614,397 -3.1%
Special Fund $ 270,921,790 $ 275,595,230 $ 274,996,333 -$ 598,897 -0.2%
Federal Fund 20,021,755 34,909,000 25,893,500 -9,015,500 -25.8%
Total Appropriations $ 290,943,545 $ 310,504,230 $ 300,889,833 -$ 9,614,397 -3.1%
Note: The fiscal 2015 working appropriation does not include January 2015 Board of Public Works reductions and deficiencies. The
fiscal 2016 allowance does not reflect contingent or across-the-board reductions.
J0
0I0
0 –
MD
OT
– M
aryla
nd
Avia
tion
Ad
min
istratio
n
Appen
dix
3
J00I00 – MDOT –Maryland Aviation Administration
Analysis of the FY 2016 Maryland Executive Budget, 2015 23
Appendix 4
Budget Amendments for Fiscal 2015
Maryland Department of Transportation
Maryland Aviation Administration – Operating
Status Amendment Fund Justification
Approved $322,536 Special Cost-of-living adjustment.
Approved 121,000 Federal Additional funds for K-9
explosive detection teams.
Source: Maryland Department of Transportation
J00I00 – MDOT –Maryland Aviation Administration
Analysis of the FY 2016 Maryland Executive Budget, 2015 24
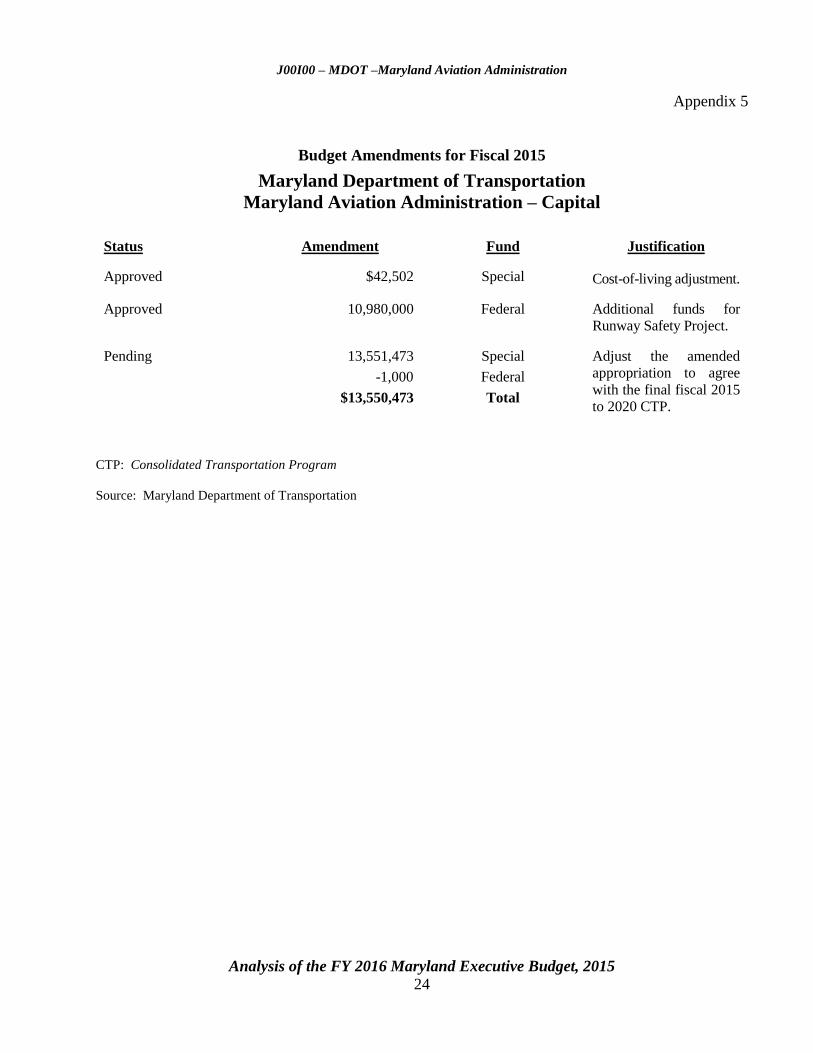
Appendix 5
Budget Amendments for Fiscal 2015
Maryland Department of Transportation
Maryland Aviation Administration – Capital
Status Amendment Fund Justification
Approved $42,502 Special Cost-of-living adjustment.
Approved 10,980,000 Federal Additional funds for
Runway Safety Project.
Pending 13,551,473
-1,000
$13,550,473
Special
Federal
Total
Adjust the amended
appropriation to agree
with the final fiscal 2015
to 2020 CTP.
CTP: Consolidated Transportation Program
Source: Maryland Department of Transportation