Embed Size (px)
Citation preview

The Achievement Gap in the Lexington Public Schools:
Documentation, Research, and Recommendations
Submitted by Vito A. LaMura
to
Dr. Paul B. Ash, Superintendent of Schools
January 2008

2
Table of Contents
Introduction…………………………………………………...………………… 3 Establishing the Gap: Local Data…………………………………………….. 6
MCAS………………………………………………………………………6 AYP………………………………………………………………………..10 Lexington Grade 1-2 Math Assessments………………………..……10 Lexington Grade 1-2 Reading Language Arts Assessments……….11 Lexington Secondary School Assessment Data……………………..11 METCO Over-Representation in SPED……………………………….12
Conversations and Surveys: Parents, Students, and LPS Staff…………. 16 Parent, Student, & LPS Staff Survey Responses……………………16 LPS Staff Conversations………………………………………………..19
Research: Gap-Closing Practices, Schools, and Practitioners…………….22 Books………………………………………………………….…………..22 Research Studies………………………………………………...…….. 24 Professional Journals……………………………………………………30 Gap Closers………………………………………………………………32 Summary and Recommendations………………………………………..…...35
Appendix………………………………………………………………………… 41

3
INTRODUCTION During the 2006-2007 school year, the Superintendent of Schools, Dr. Paul Ash, learned of the significant over-representation of METCO students in special education programs. Alarmed, he asked two important questions: How well and how appropriately are the Lexington Public Schools meeting the needs of Boston students? Are METCO students achieving at levels comparable to the general population of Lexington students? In order to answer these questions, he commissioned a research study. For almost three months, from late August 2007 to his retirement in mid-November 2007, Vito LaMura, former Diamond Middle School teacher and Lexington Education Association President, sought the answers to the Superintendent’s questions. This task involved surveying and interviewing scores of school community members from administrators to students, gathering and analyzing all available student achievement data, comprehensively examining the best available national research into closing achievement gaps, and finally making both short and long-term recommendations for decision-makers to consider. This report will address the following:
1. Documenting the extent of the achievement gaps among the racial subgroups in the Lexington Public Schools. Although multiple measures of achievement will be examined, this report uses achieving at Proficient or higher on MCAS tests as a benchmark. Therefore, when racial subgroups are compared using MCAS, the percentages of students BELOW PROFICIENT is a key indicator.
2. Conversations with the Lexington School Community. A number of parents, students, faculty, and administrators were asked why they thought the achievement gaps in the LPS were so persistent and so significant. Their responses and their recommendations for how to close the gaps are all rank ordered and/or summarized in the report.
3. An examination of the research. There are many schools where the achievement gaps are being closed if not eliminated. This report will examine the common characteristics of these gap closing schools and will also summarize recent research into the best practices by which to accomplish gap closing.
4. Recommendations. The report will conclude with a set of recommendations for LPS decision-makers to consider as resources are applied over time.
All available assessment data - from MCAS results at 7 different grade levels, to local assessments of literacy and mathematics skills in grades 1-2, to under-representation in secondary school higher level courses, to high school grade point averages, to over-representation in special education – all data confirm a large achievement gap between Lexington’s METCO students (0ver 93% African American and Hispanic) and the Lexington-resident White and Asian students. There are, of course, Lexington-resident African American and Hispanic students. Whenever the available achievement data allows resident and non-resident African American and Hispanic students to be disaggregated, I will clearly note that in the report. However, much of this report will focus on the METCO students, who are in a unique program, more easily identified and statistically tracked. For decades the Lexington Public Schools has embraced METCO students and has, at least in word and print and at varying times with more or less emphasis, made closing the gap between METCO students’ achievement and resident students’ achievement an explicit

4
goal at both the district and the individual school levels. These efforts, though certainly well intentioned, have, by and large, not succeeded in closing the achievement gap. Lexington is hardly unique in its lack of progress in this area. Kati Haycock, President of the Education Trust (a national organization working to promote high achievement of all students) points out that in the United States by the time African American and Hispanic children reach the age of 17, they typically have been taught only to the same level as 13-year-old white children. In reality, the plural gaps should be used to describe the differences in African American and Hispanic achievement. Nationally, these gaps exist not only in standardized test scores but also in areas such as Advanced Placement course participation and test taking, high school graduation rates, college entrance and graduation rates, and earned income. In Massachusetts, when the recently encouraging statewide test data is disaggregated, the gap persists. Jeffrey Nellhaus, the Acting Commissioner of Education, pointed out in his forward to the summary of 2007 MCAS results, “The achievement gap between the percent of white students and African American and Hispanic students scoring Proficient and higher remains a serious concern for families and students, policymakers, and educators.” Some slight narrowing of the gap was evident in English Language Arts, but the gap in mathematics appears to have widened in some grades, as gains made by white students outpaced gains made by African American and Hispanic students. On the 2007 NAEP tests (National Assessment of Educational Progress, a.k.a. The Nation’s Report Card) Massachusetts ranked first alone among all states on three of the four tests (grade 4 reading and math; grade 8 math), and tied for first on the fourth NAEP test (grade 8 reading). However, between 2005 and 2007 in Massachusetts, there were no significant changes in the performance gaps between white and African American students in reading and mathematics at grades 4 and 8. Similarly, the performance gap change between white and Hispanic students did not change significantly between 2005 and 2007. Significantly higher percentages of African American and Hispanic students still scored at Basic levels; whereas, significantly higher percentages of white students scored at Proficient and Advanced levels. The gap persists in the nation, in our state, and in the Lexington Public Schools. This is unacceptable and correctable. Our core beliefs as public educators must guide our work. The following beliefs and assumptions must be fundamental to any gap-closing efforts:
Eliminating the achievement gap is not only the right thing to do, but it is essential, given the core purposes of the Lexington Public Schools: (1) academic excellence, (2) respectful and caring relationships, and (3) a culture of reflection, conversation, collaboration and commitment to continuous improvement.
The METCO program was long ago woven into the fabric of the Lexington Public Schools, and it continues to contribute mightily and positively to our diversity. It is a program to be cherished and supported to the fullest extent possible.
Academic ability is a developed (and developable) ability, one that is not simply a function of biological endowment or a fixed aptitude.
Understanding the fact that academic ability is malleable, we will close the gaps in academic achievement among different groups of students when we have effectively taught all of our students how to learn by using high-quality teaching and instruction of rigorous, relevant curriculum in every classroom.

5
Strong, trusting, and encouraging teacher-student relationships will contribute to improving achievement for all students, but even more so for African American and Hispanic students, who may have internalized the insidious societal message that low achievement indicates low ability.
While recognizing the crucial role that parents, community, and culture play in educating all students, the primary focus of our schools must be on what we can control and actually do.
Schools that concentrate on how their practices affect all students will be more productive and successful than those which blame students, families, poverty, cultural differences, or race for underachievement. Schools can and must have a powerful, positive impact on the achievement of all students.
We must all continually examine our beliefs and change our practices to counteract the contemporary and historic impacts of racism and discrimination.
To improve student achievement for all students and thereby close the achievement gap, we must identify and change those aspects of our school culture that impede our gap-closing work.
With African American and Hispanic children achieving at significantly lower levels than their white and Asian peers, we cannot choose to be color-blind. Emphasizing race in educational discussions and activities may seem controversial or counterintuitive, but it is far more effective than the alternative if our goal is closing the achievement gap.
Can we know if these beliefs, once turned into policies and actions, will close the achievement gap? Can it be done? Can schools help all children learn at high levels? YES, is the answer to all 3 questions. There are schools all across the country where these gaps are being narrowed and closed. Karin Chenoweth, in her recently published It’s Being Done: Academic Success in Unexpected Schools, writes about 15 schools where the gap-closing work is highly successful. There are recent studies, scholarly papers, and professional articles, which document the work and lay out the characteristics and practices of gap-closing schools. It must be noted that there is no quick fix, no single intervention, which we in the Lexington Public Schools can readily adopt to solve this problem. However, it can be done, if we choose to do so. Focus, will, and leadership cannot be overstated as essential elements to our closing the gaps. The good news is that many proven practices are being implemented in the LPS even as this report is being written - more on those practices later in the report. Before turning to the promising research and the making of recommendations, however, let me share with you the achievement data, which confirm the achievement gap in the Lexington Public Schools, and also the feedback I have received from students, parents, and LPS staff. Note that the following data is not intended to be completely comprehensive look at all possible measures of student achievement. Rather, my purpose is to simply establish the fact that there is an achievement gap in Lexington.

6
ESTABLISHING THE GAP: LOCAL DATA MCAS Results To illustrate the achievement gap between African American / Hispanic students and White / Asian students, the tables below indicate the percentages of students in a particular subgroup (African American, White, Asian, Hispanic) who scored BELOW PROFICIENT on the last 5 years’ MCAS English Language Arts (ELA) assessments in the various grades where the test was given (NT in the charts indicates no test was given in that grade for that year). A student’s MCAS score falls into one of 4 categories: Advanced, Proficient, Needs Improvement, Failure/Warning. One of our gap-closing goals must be to get all students to Proficient or Advanced as measured by MCAS. For illustrative purposes only, the last column shows the difference (the gap) between two of the subgroups - the White students and the African American students.
LEX ELA MCAS: % of Students BELOW PROFICIENT THE GAP between
Grade 3 Afr. Am'n. White Asian Hisp. w/ Disab. LEP White & Afr. Am'n.
2003 59% 14% 18% 41% 56% 50% 45% 2004 45% 14% 11% 42% 42% 25% 31% 2005 37% 20% 14% - 42% 50% 17% 2006 48% 21% 18% 36% 56% 50% 27% 2007 56% 16% 13% 27% 48% 27% 40%
LEX ELA MCAS: % of Students BELOW PROFICIENT THE GAP between
Grade 4 Afr. Am'n. White Asian Hisp. w/ Disab. LEP White & Afr. Am'n.
2003 50% 13% 10% 60% 53% - 37% 2004 53% 14% 10% 45% 55% 30% 39% 2005 52% 19% 10% 54% 56% 46% 33% 2006 48% 28% 16% - 60% 44% 20% 2007 58% 17% 13% 47% 60% 37% 41%
LEX ELA MCAS: % of Students BELOW PROFICIENT THE GAP between
Grade 5 Afr. Am'n. White Asian Hisp. w/ Disab. LEP White & Afr. Am'n.
2003 NT NT NT NT NT NT 2004 NT NT NT NT NT NT 2005 NT NT NT NT NT NT 2006 48% 12% 6% 41% 43% - 36% 2007 63% 14% 6% 18% 43% 28% 49%
LEX ELA MCAS: % of Students BELOW PROFICIENT THE GAP between
Grade 6 Afr. Am'n. White Asian Hisp. w/ Disab. LEP White & Afr. Am'n.
2003 NT NT NT NT NT NT 2004 NT NT NT NT NT NT 2005 NT NT NT NT NT NT 2006 36% 8% 11% 36% 42% - 28% 2007 27% 8% 6% 46% 34% - 19%

7
LEX ELA MCAS: % of Students BELOW PROFICIENT THE GAP between
Grade 7 Afr. Am'n. White Asian Hisp. w/ Disab. LEP White & Afr. Am'n.
2003 34% 10% 4% 27% 38% - 24% 2004 42% 8% 7% 25% 42% - 34% 2005 36% 8% 3% - 38% - 28% 2006 51% 9% 5% 23% 37% - 42% 2007 35% 7% 5% 21% 39% - 28%
LEX ELA MCAS: % of Students BELOW PROFICIENT THE GAP between
Grade 8 Afr. Am'n. White Asian Hisp. w/ Disab. LEP White & Afr. Am'n.
2003 NT NT NT NT NT NT 2004 NT NT NT NT NT NT 2005 NT NT NT NT NT NT 2006 20% 6% 3% - 28% - 14% 2007 26% 5% 2% 18% 29% - 21%
LEX ELA MCAS: % of Students BELOW PROFICIENT THE GAP between
Grade 10 Afr. Am'n. White Asian Hisp. w/ Disab. LEP White & Afr. Am'n.
2003 42% 9% 14% - 44% - 33% 2004 50% 11% 7% - 46% - 39% 2005 50% 8% 13% 9% 32% 70% 42% 2006 35% 7% 6% 14% 42% 8% 28% 2007 42% 5% 4% 8% 35% - 37%
Below are the MCAS results in mathematics for the past 5 years at each grade level:
LEX Math MCAS: % of Students BELOW PROFICIENT THE GAP between
Grade 3 Afr. Am'n. White Asian Hisp. w/ Disab. LEP White & Afr. Am'n.
2003 NT NT NT NT NT NT - 2004 NT NT NT NT NT NT - 2005 NT NT NT NT NT NT - 2006 68% 21% 14% 45% 62% 43% 47% 2007 64% 19% 10% 40% 46% 10% 45%
LEX Math MCAS: % of Students BELOW PROFICIENT THE GAP between
Grade 4 Afr. Am'n. White Asian Hisp. w/ Disab. LEP White & Afr. Am'n.
2003 75% 25% 17% 67% 64% - 50% 2004 66% 28% 6% 54% 67% 5% 38% 2005 82% 25% 11% 55% 57% 42% 57% 2006 74% 33% 20% - 64% 50% 41% 2007 77% 23% 10% 47% 66% 50% 54%

8
LEX Math MCAS: % of Students BELOW PROFICIENT THE GAP between
Grade 5 Afr. Am'n. White Asian Hisp. w/ Disab. LEP White & Afr. Am'n.
2003 NT NT NT NT NT NT - 2004 NT NT NT NT NT NT - 2005 NT NT NT NT NT NT - 2006 67% 21% 9% 36% 63% - 46% 2007 58% 17% 3% 27% 45% 14% 41%
LEX Math MCAS: % of Students BELOW PROFICIENT THE GAP between
Grade 6 Afr. Am'n. White Asian Hisp. w/ Disab. LEP White & Afr. Am'n.
2003 64% 21% 15% 50% 64% - 43% 2004 64% 23% 7% - 60% - 41% 2005 57% 16% 9% 40% 53% - 41% 2006 75% 21% 7% 45% 66% - 54% 2007 54% 17% 5% 46% 53% - 37%
LEX Math MCAS: % of Students BELOW PROFICIENT THE GAP between
Grade 7 Afr. Am'n. White Asian Hisp. w/ Disab. LEP White & Afr. Am'n.
2003 NT NT NT NT NT NT - 2004 NT NT NT NT NT NT - 2005 NT NT NT NT NT NT - 2006 73% 24% 12% 61% 64% - 49% 2007 66% 21% 8% 50% 62% - 45%
LEX Math MCAS: % of Students BELOW PROFICIENT THE GAP between
Grade 8 Afr. Am'n. White Asian Hisp. w/ Disab. LEP White & Afr. Am'n.
2003 79% 26% 3% 63% 66% - 53% 2004 81% 24% 10% 50% 61% - 57% 2005 69% 21% 9% 63% 60% - 48% 2006 64% 25% 5% - 69% - 39% 2007 63% 20% 7% 43% 62% - 43%
LEX Math MCAS: % of Students BELOW PROFICIENT THE GAP between
Grade 10 Afr. Am'n. White Asian Hisp. w/ Disab. LEP White & Afr. Am'n.
2003 74% 25% 13% - 58% - 49% 2004 75% 20% 6% - 61% - 55% 2005 43% 10% 2% 27% 32% 10% 33% 2006 48% 10% 5% 28% 42% 8% 38% 2007 28% 5% 1% 16% 35% - 23%
The above MCAS data confirms that on this measure of achievement large gaps persist over time with one notable exception – grade 10 math where the gaps are being closed over time and among all sub-groups. Later in this report, I will take a closer look at what is being done in the math department at LHS which seems to be having sustained success in closing the MCAS gap.

9
With the cooperation of the Computer Center, I was able to separate out from the 2006 and 2007 grade 10 MCAS results the scores of Lexington-resident African American and Hispanic students. It must be noted here that I did not do more of this because, given our data systems and available support personnel, it is very difficult and time consuming to gather this data.
% of 10th Graders BELOW PROFICIENT on 2006 and 2007 MCAS LEXINGTON ELA 06 MATH 06 ELA 07 MATH 07
All African American 35% 48% 42% 28% ALL Hispanic 14% 28% 8% 16% Lex. Resident Afr. Am'n/Hispanic 31% 31% 19% 26% White 7% 10% 5% 5% Asian 6% 5% 4% 1%
The number of students in the All African American, All Hispanic, and Lexington Resident African American/Hispanic subgroups is small. Therefore, definitive conclusions should not be drawn. That being said, there are significantly fewer White and Asian students below proficient than there are African American and Hispanic students, regardless of address. In the appendix of this report, I have included much more MCAS data:
• Two bar graphs, one for ELA and one for math, using the BELOW-PROFICIENT data
presented above for the 4 subgroups from 2003 – 2007. (P. 41) • Comparative 2006 and 2007 MCAS BELOW-PROFICIENT results for Lexington,
Boston, Wellesley, Weston, Brookline, Newton, Belmont, Bedford, and Concord-Carlisle. The data are reported for each grade level at which MCAS is administered for each of the 4 subgroups: African American, White, Asian, and Hispanic. The comparative data do show that the percentages of BELOW-PROFICIENT students in Boston, in the aggregate, are significantly greater than in Lexington. The data also show that our comparable communities with METCO programs are also experiencing significant achievement gaps. (PP. 42-48)
• 2007 MCAS BELOW-PROFICIENT results for Lexington across the grades for the 4
subgroups, but with the actual number of students tested in each subgroup. (P. 48) • Two bar graphs, one for ELA and one for math, showing the 2007 BELOW-
PROFICIENT data for the 4 subgroups in the elementary grades, in middle school, and in grade 10. (P. 49)
• A table of grade 10 METCO students’ MCAS data in 2006 and 2007 which
disaggregates the scaled scores by gender. The scores indicate no significant differences. (P. 50)

10
AYP (Adequate Yearly Progress) AYP is required by the No Child Left Behind (NCLB) federal statute. All subgroups in a school district (Limited English Proficient, Special Education, Low Income, African American, Asian/Pacific Islander, Hispanic, Native American, White) must make AYP. To make AYP in 2007, for example, a student group must meet a student participation requirement, either the State’s 2007 performance target for that subject or the group’s own 2007 improvement target, and an additional attendance or graduation requirement. Overall, as one would expect, Lexington receives a very high performance rating when AYP is considered in the aggregate. However, when the data is disaggregated by grade spans (3-5, 6-8, 9-12) the achievement gap does make a limited appearance. In the grade 3-5 span for English Language Arts, the African American subgroup did not meet the State’s performance target, nor did this group meet its own improvement target. In the grade 3-5 span for mathematics, the African American subgroup did not meet the State’s performance target, but it did meet the improvement target. Lexington Math Assessments, Grades 1 and 2: Fall 2007 The table below shows the most recent math assessment scores for METCO and non-METCO students in grades 1 and 2. The “score” is the sum of three assessments on a 100-point scale with the best score being “0.” Children with the highest scores are most in need of intervention by the teacher and/or the math specialist. Grade 1 scores are the sum of the teacher’s recommendation, a counting assessment, and a skills checklist. The grade 2 scores are the sum of a skills checklist, the recommendation of the teacher, and the recommendation of the math specialist.
Score METCO % Non-
METCO %
0-30 8 33.3% 730 79.7%
35-65 7 29.2% 118 12.9%
70-100 9 37.5% 68 7.4% Totals 24 100.0% 916 100.0%
The number of METCO students is too small to draw definitive conclusions; however, a significantly higher percentage of the METCO students assessed in grades 1 and 2 received scores indicating the need for special intervention in math.

11
NOTE: This mathematics assessment data was gathered in such a way that I was able to disaggregate the Lexington-resident African American and Hispanic students in grades 1 and 2. Again, the number of students is small, but here are the results:
Score Lex. Resident Afr. Am'n/Hispanic % 0-30 25 64.1% 35-65 6 15.4%
70-100 8 20.5% Totals 39 100.0%
Again, definitive conclusions cannot be drawn, but there are higher percentages of Lexington-resident African American/Hispanic students with scores indicating intervention needs than there are among the population with only the METCO students disaggregated. Reading Language Arts Assessments, Grades 1- 2: Fall 2007 Lexington students in grades 1 and 2 are also assessed on a 100-point scale in reading and language arts using very specific diagnostics such as an adapted DeFord Dictation, Nonsense Word Lists, and Scott Foresman Placement Tests. As in math, the higher the score a student receives, the more in need of special intervention. “0” is the best possible assessment. Here is a table with the most recent results:
Score Non-METCO % METCO % 0-30 635 74.2% 14 51.9% 35-65 128 15.0% 6 22.2% 70-100 93 10.9% 7 25.9%
856* 27 * 1 second grade class missing
The number of METCO students is too small to draw definitive conclusions; however, a significantly higher percentage of the METCO students assessed in grades 1 and 2 received scores indicating the need for special intervention in reading and language arts. Lexington Secondary Schools Assessment Data In addition to the sixth, seventh, eighth, and tenth grade MCAS data already presented, one other general measure of student achievement at Lexington High School is a student’s unweighted GPA (grade point average). At the end of the 2006-2007 school year, the average GPA of the 60 METCO students at LHS was 2.17 (26 girls averaged 2.34 and 34 boys averaged 2.01). The average GPA for the other 1,896 students was 3.10.

12
If all of last year’s course enrollments at LHS are separated out between METCO students’ selections and all other students’ selections, it is clear that the most challenging coursework is not often a METCO student’s choice. Most courses are unleveled, but among those courses that are leveled, it is clear that METCO students are under-represented in Honors/AP courses. METCO students enrolled in an honors/AP course in only 9 out of 709 total enrollments or 1.3% of the time. All other students at LHS enrolled in an honors/AP course 14.8% of the time. Here are the numbers:
Student Course Selections at LHS 2006-2007
METCO Non-METCO74.6% Unleveled 63.6% 1.3% Honors 14.8% 19.7% Level 1 20.6% 5.9% Level 2 1.0%
When a similar examination of student course selections at LHS was made in 2004 and 2005, the findings were very similar. At our middle schools, mathematics is the only team, academic subject that is leveled. In grades 7 and 8, there are three levels: Extended, Advanced and Intermediate. At Clarke Middle School, 30% of seventh graders are in the highest level, Extended Math course, but that includes no METCO students. At Clarke, 56% of all seventh graders are in Advanced Math; 27% of the METCO seventh graders are among this group. In the eighth grade at Clarke, 49% of all students are in Extended Math - Algebra 1; 1 of 16 METCO eighth graders (6%) is among them. Forty percent of all Clarke eighth graders are in Advanced Math - Algebra 1A; 4 of 16 METCO eighth graders (25%) are in this course. At Diamond Middle School, 24% of all seventh graders are in Extended Math; among these students are 2 of 12 METCO seventh graders (17%). Seventy percent of the seventh graders at Diamond are in Advanced Math; among these students are 7 of 12 METCO seventh graders (58%). In the eighth grade at Diamond, 68% of all students are in Extended Math - Algebra 1; there are no METCO students in this level. Twenty-eight percent of all Diamond eighth graders are in Advanced Math - Algebra 1A; 11 of 14 METCO eighth graders (79%) are in this course. In the aggregate at our middle schools, 28% of all seventh graders and 9% of METCO seventh graders are in Extended Math. 63% percent of all seventh graders and 43% of METCO seventh graders are in Advanced Math. In grade eight, 58% of all eighth graders and 3 % of METCO eighth graders are in Algebra 1. 34% of all eighth graders and 60% of METCO eighth graders are in the Advanced Math course, Algebra I A. METCO Student Over-Representation in Special Education Another disturbing manifestation of the achievement gap, or perhaps how we choose to deal with it, in the Lexington Public Schools is the frequency with which METCO students are determined to need special education services. Here are the numbers:

13
Currently, there are 264 METCO students with 88 of them (33.3%) on special education IEPs.
Those 88 SPED students are distributed in the following grades and schools: o 3rd Grade: 4 o 4th Grade: 5 o 5th Grade: 13 o 6th Grade: 6 Elementary: 22 (25%) o 7th Grade: 8 Middle School: 31 (35.2%) o 8th Grade: 17 High School: 35 (39.8%) o 9th Grade: 14 o 10th Grade: 9 o 11th Grade: 5 o 12th Grade: 7
School Total METCO METCO in SPED %
LHS 72 35 48.6% CL 33 17 51.5% DI 41 14 34.1% BO 20 5 25.0% BR 21 3 14.3% FI 21 7 33.3%
HR 19 3 15.8% HS 16 1 6.3% ES 21 3 14.3%
The current METCO SPED students original referral data are as follows:
o Referred from BOWMAN: 24 (27.3%) Referred in grade 1: 1 Referred in grade 2: 11 6 were referred before FY 01. Referred in grade 3: 2 12 were referred from FY 01 - FY 05. Referred in grade 4: 8 4 were referred during FY 06 - FY 07. Referred in grade 5: 2
o Referred from BRIDGE: 13 (14.8%)
Referred in grade 1: 4 Referred in grade 2: 2 4 were referred before FY 01. Referred in grade 3: 1 6 were referred from FY 01 - FY 05. Referred in grade 4: 6 3 were referred during FY 06 - FY 07. Referred in grade 5: 0
o Referred from ESTABROOK: 10 (11.4%)
Referred in grade 1: 4 Referred in grade 2: 2 3 were referred before FY 01. Referred in grade 3: 3 6 were referred from FY 01 - FY 05. Referred in grade 4: 1 1 was referred during FY 06 - FY 07. Referred in grade 5: 0
14
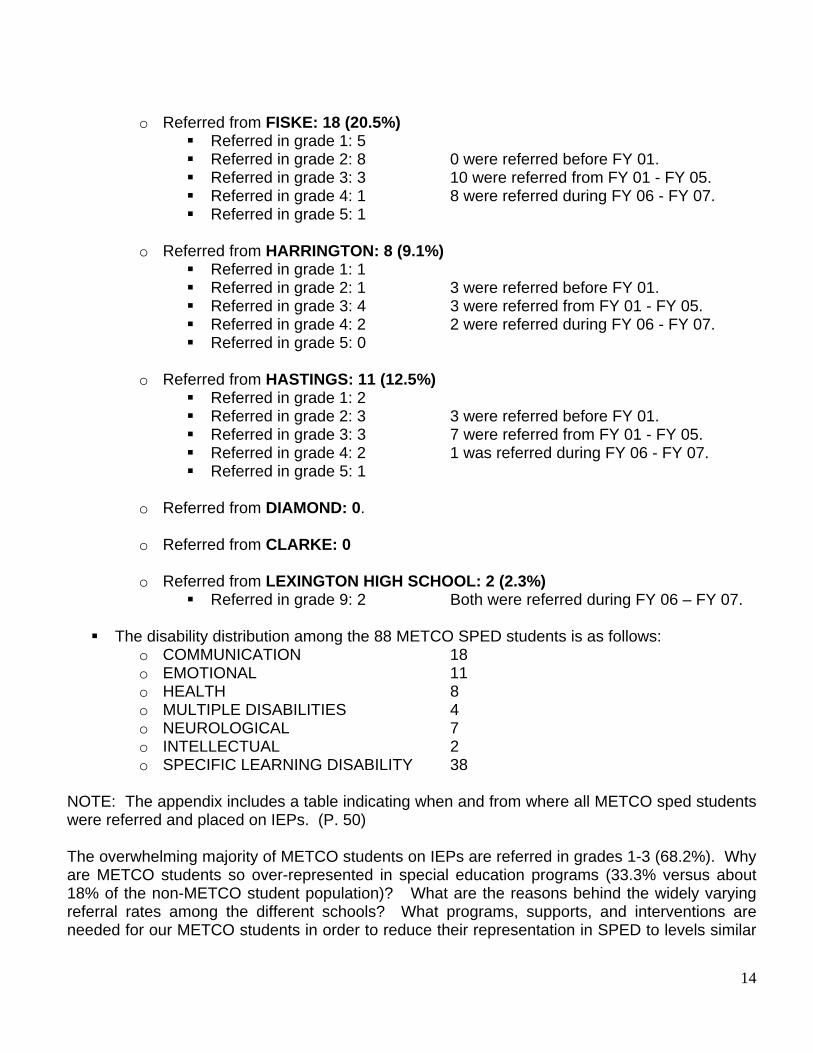
o Referred from FISKE: 18 (20.5%) Referred in grade 1: 5 Referred in grade 2: 8 0 were referred before FY 01. Referred in grade 3: 3 10 were referred from FY 01 - FY 05. Referred in grade 4: 1 8 were referred during FY 06 - FY 07. Referred in grade 5: 1
o Referred from HARRINGTON: 8 (9.1%)
Referred in grade 1: 1 Referred in grade 2: 1 3 were referred before FY 01. Referred in grade 3: 4 3 were referred from FY 01 - FY 05. Referred in grade 4: 2 2 were referred during FY 06 - FY 07. Referred in grade 5: 0
o Referred from HASTINGS: 11 (12.5%)
Referred in grade 1: 2 Referred in grade 2: 3 3 were referred before FY 01. Referred in grade 3: 3 7 were referred from FY 01 - FY 05. Referred in grade 4: 2 1 was referred during FY 06 - FY 07. Referred in grade 5: 1
o Referred from DIAMOND: 0.
o Referred from CLARKE: 0
o Referred from LEXINGTON HIGH SCHOOL: 2 (2.3%)
Referred in grade 9: 2 Both were referred during FY 06 – FY 07.
The disability distribution among the 88 METCO SPED students is as follows: o COMMUNICATION 18 o EMOTIONAL 11 o HEALTH 8 o MULTIPLE DISABILITIES 4 o NEUROLOGICAL 7 o INTELLECTUAL 2 o SPECIFIC LEARNING DISABILITY 38
NOTE: The appendix includes a table indicating when and from where all METCO sped students were referred and placed on IEPs. (P. 50) The overwhelming majority of METCO students on IEPs are referred in grades 1-3 (68.2%). Why are METCO students so over-represented in special education programs (33.3% versus about 18% of the non-METCO student population)? What are the reasons behind the widely varying referral rates among the different schools? What programs, supports, and interventions are needed for our METCO students in order to reduce their representation in SPED to levels similar

15
to the general school population? What effect does being placed on an IEP have on teacher, student, and parent expectations and subsequent academic achievement? These are all questions that are worthy of further consideration and study. Later in this report, an examination of many of the promising practices and characteristics of gap-closing schools and summaries of conversations with LPS staff may well point the way toward reducing this over-reliance on special education programs to provide struggling METCO students with necessary services.

16
CONVERSATIONS AND SURVEYS: PARENTS, STUDENTS and L.P.S.
STAFF No examination of the achievement gap issue in the Lexington Public Schools would be complete or credible without carefully listening to the stories and opinions of the students, parents, and education professionals in and from both Lexington and Boston. On October 16, 2007, at the Lexington School Committee Meeting in Boston, METCO parents and LPS staff in attendance were given the opportunity to complete a survey after hearing presentations which included some startling MCAS data to illustrate the significant achievement gap between White/Asian students and African American/Hispanic students. That survey data and the specific information gathered in the conversations that took place in the breakout group after the presentations were carefully analyzed for the frequency of similar responses. Each respondent was asked to identify his/her role (METCO parent, teacher, administrator, student, etc.) to allow for more discriminating analysis of the responses. Teachers and other education professionals who were not able to attend the Boston meeting were also given the opportunity to respond to the same questions via the LEA Conference in First Class. Their responses were added to the analysis of staff responses gathered at the Boston meeting. Over the past 2.5 months, METCO Director, Cheryl Prescott-Walden and I were also able to meet with three small groups of high school METCO students. Middle School METCO Counselor, Gail Cody, and I also met with two groups of middle school METCO students. The students completed surveys and then participated in guided discussions. Their written and oral responses were also carefully analyzed. One of the questions asked of all these groups was, of course, what they thought were the reasons for the achievement gap. Below are their responses after first being rank ordered for frequency and then separated into categories: factors over which the schools had control and external factors, which were beyond the schools’ control. Some of the responses, which did not fit neatly into either category, were placed in both columns. For example, “Insufficient or lack of parental involvement” is somewhat susceptible to LPS interventions but also somewhat uncontrollable. The lists are ordered from the most frequent response to the reasons with the fewest responses. No single-respondent reasons were included in the lists. METCO Parent Responses
Factors Susceptible to LPS Interventions in Rank Order (39 METCO Parents)
1. Insufficient or lack of parental involvement 2. Some parents' lack of expertise/strategies to provide effective academic support 3. Students' lack of sufficient time to do schoolwork 4. Ineffective teaching styles and strategies 5. Homework issues: incomplete, undone, misunderstood, no help
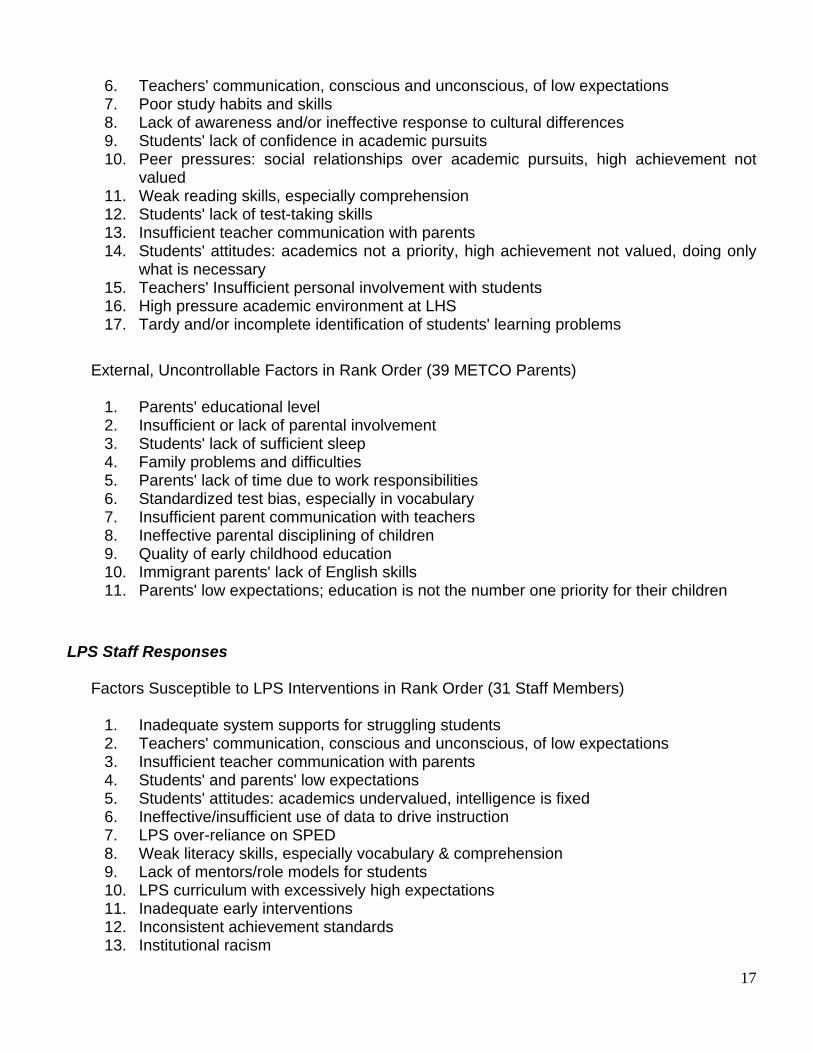
17
6. Teachers' communication, conscious and unconscious, of low expectations 7. Poor study habits and skills 8. Lack of awareness and/or ineffective response to cultural differences 9. Students' lack of confidence in academic pursuits 10. Peer pressures: social relationships over academic pursuits, high achievement not
valued 11. Weak reading skills, especially comprehension 12. Students' lack of test-taking skills 13. Insufficient teacher communication with parents 14. Students' attitudes: academics not a priority, high achievement not valued, doing only
what is necessary 15. Teachers' Insufficient personal involvement with students 16. High pressure academic environment at LHS 17. Tardy and/or incomplete identification of students' learning problems
External, Uncontrollable Factors in Rank Order (39 METCO Parents)
1. Parents' educational level 2. Insufficient or lack of parental involvement 3. Students' lack of sufficient sleep 4. Family problems and difficulties 5. Parents' lack of time due to work responsibilities 6. Standardized test bias, especially in vocabulary 7. Insufficient parent communication with teachers 8. Ineffective parental disciplining of children 9. Quality of early childhood education 10. Immigrant parents' lack of English skills 11. Parents' low expectations; education is not the number one priority for their children
LPS Staff Responses
Factors Susceptible to LPS Interventions in Rank Order (31 Staff Members)
1. Inadequate system supports for struggling students 2. Teachers' communication, conscious and unconscious, of low expectations 3. Insufficient teacher communication with parents 4. Students' and parents' low expectations 5. Students' attitudes: academics undervalued, intelligence is fixed 6. Ineffective/insufficient use of data to drive instruction 7. LPS over-reliance on SPED 8. Weak literacy skills, especially vocabulary & comprehension 9. Lack of mentors/role models for students 10. LPS curriculum with excessively high expectations 11. Inadequate early interventions 12. Inconsistent achievement standards 13. Institutional racism

18
14. Inadequate professional development 15. Teachers unfamiliarity with varied learning styles 16. Teachers' lack of cultural awareness 17. Inadequate, personal staff involvement with students
External, Uncontrollable Factors in Rank Order (31 Staff Members)
1. Families' lack of access to outside resources 2. Distance from Lexington: loss of time; difficulty in attending conferences etc. 3. Family income 4. Insufficient parent communication with teachers 5. Difficult family lives 6. Students' and parents' low expectations 7. Students' attitudes: academics undervalued, intelligence is fixed 8. Parents' work ethic 9. Students' pre-LPS academic preparation
METCO Students’ Responses
Factors Susceptible to LPS Interventions in Rank Order (22 METCO Secondary Students)
1. Student lack of effort and attentiveness 2. Student belief that school is not a number one priority 3. Insufficient time to do schoolwork 4. Ineffective teaching styles and strategies 5. Student embarrassment in asking questions 6. Inadequate access to academic help and resources 7. Lack of in-school support 8. Student attitudes: high achievement is not cool, place friendship obligations over
schoolwork 9. Teachers' communication, conscious and unconscious, of low expectations 10. Insufficient MCAS preparation 11. Insufficient parent involvement
External, Uncontrollable Factors in Rank Order (22 METCO Secondary Students)
1. Student lack of effort and attentiveness 2. Students' lack of sleep 3. Student belief that school is not a number one priority 4. Many after school jobs and activities 5. Harder, more difficult lives 6. Student attitudes: high achievement is not cool, place friendship obligations over
schoolwork 7. Parents' lack of education 8. Insufficient parent involvement

19
The second key question that was asked of parents, staff, and students was what they thought should be done to help close the achievement gap. Again, in order of frequency from most to fewest responses and with no single-respondent inclusions, here are the results:
METCO Parents’ Suggestions in Rank Order (39 METCO Parents)
1. Increase parent communication and involvement with teachers and the schools 2. Provide many more embedded programs for struggling students 3. Provide more tutoring options for students 4. Provide in-school and after-school homework support for students 5. Maintain and regularly communicate high standards 6. Provide a mentoring program for METCO students 7. Provide training for interested parents in study skills/academic support 8. Develop on-going systemic encouragements for high achievement 9. Provide more test preparation/skill instruction 10. Parents must increase their own supportive and informational networking
LPS Staff Suggestions in Rank Order (31 Staff Members)
1. Develop and implement additional, tiered academic assistance 2. Use data-driven intervention strategies 3. Develop a mentor program for METCO students 4. Provide clear, consistent feedback to students much more frequently 5. Provide early and extensive literacy interventions for all struggling students 6. Develop strategies to increase parent involvement 7. Continue to train staff in a variety of teaching styles & strategies 8. Implement full-day Kindergarten as soon as possible 9. Provide more professional development to embed best practices 10. Provide more study skills instruction
METCO Students’ Suggestions in Rank Order (22 METCO Secondary Students)
1. Provide many more in-school tutoring options 2. Provide more test preparation courses / sessions 3. Provide after school academic support programs 4. Provide in-school and after-school homework support 5. Develop more teacher sensitivity to different learning styles 6. Push students harder and into more high level courses 7. Provide more study skills and time management instruction
Conversations with LPS Staff Over the past 2.5 months I have sat down with 22 professional educators in the Lexington Public Schools to talk in depth and at length about the achievement gap. These staff members include Central Office Administrators, Principals, Assistant Principals, METCO Staff, Curriculum Leaders, and Teachers. One question I almost always asked was this: If money were not an issue, and

20
you had the authority to make it happen, what would you do to close the achievement gap? Given the nature of the question and the respondents, I have chosen to include all responses in no particular order. However, those that were mentioned by multiple respondents are in bold and grouped at the beginning of the list. This should not be interpreted as a qualitative judgment. Rather, view the list below as a menu of key LPS Staff’s best, unrestrained thinking in conjunction with the rank ordered list of staff suggestions reported above.
METCO tutors should be licensed, content specialists in literacy and/or mathematics. Provide more such tutors and dedicated space for instruction. Ideally one tutor per school would work with all METCO students.
METCO tutors must be hired and ready to start their work with students on the first day of school.
Institute full-day kindergarten and start the METCO program in kindergarten. Much more professional development for teachers in both the affective factors contributing
to the achievement gap and the successful pedagogical responses to underachievement. After-school academic support for elementary METCO students, particularly on Thursday
afternoons. Thus, provide the necessary transportation. Much more embedded literacy and math support for elementary students in grades 3-5. Hire more faculty and administrators of color. Provide for an extended school day either in Lexington or Boston with substantive
academic support programs. Provide all secondary teachers with professional development on teaching literacy skills. Embed much more faculty collaboration specifically designed to address
underachievement. The METCO selection process must be re-examined and more effective screening must
take place. On the METCO bus have books on tape, live readers, or other effective uses of this time. METCO staff levels should be increased to allow them to focus more on academic as well
as social-emotional support. Seek staff with dual licenses: social work and teaching. Expository, non-fiction writing must be a district priority at all levels. The literature confirms it, and we must find a way to ensure it happens. Underachieving
students, particularly METCO students, must have a strong, formalized connection with a caring, encouraging adult at school if they are to improve their achievement.
Address the issues of race, cultural differences, and bias head on and regularly. All elementary students should have 2 hours per day of high quality literacy instruction and
1 hour per day of high quality math instruction. Those in need of intervention in either math or literacy should receive one more hour of supplemental instruction.
Staff after school programs with licensed specialists who work from 11:00 a.m. to 5:00 p.m. every day.
Eliminate all pull-out instrumental music programs. Summer intervention programs must be very high quality and mandatory. Double dosing in math and literacy skills for struggling secondary students must be a
scheduling priority. Do not put METCO siblings in different schools.

21
Provide monitors on the 4:30 METCO late bus to assure parents and students of a safe ride home after hours.
Small group math must be taught by licensed math teachers, not by SPED generalists. Establish fully functioning, properly staffed learning centers at the middle schools. Develop specific strategies to push METCO students into higher-level courses and then
provide the support services they will need. Provide secondary, drop-in homework centers staffed by a literacy specialist. Provide more opportunity and professional development for transmitting acquired
knowledge and skills to new staff. Provide small-group studies at the secondary schools. Hire staff to monitor more closely those METCO students who stay after school. Develop clearer expectations for METCO social workers with regard to home visits before
students are accepted into the METCO program. In elementary schools, develop multiple, short-term intervention strategies provided to
students by many different specialists. Provide more before-school academic support programs at the elementary level. Make a consolidated list of effective after-school programs available in Boston. This would
require significant staff time to visit and assess those programs. Provide after school programs in Lexington staffed by Boston-based professionals. Require, do not invite, underachievers to participate in special programs. Ensure that all standards, whether behavioral or academic, apply to all students. Provide a mandatory, summer program in Boston taught by Lexington staff for all newly
accepted METCO students. Provide many more non-SPED supports at the elementary level, particularly in reading. Experiment with elementary scheduling to provide a half-day per week per grade level for
intervention and/or enrichment. Train more senior citizens and other like volunteers as literacy paraprofessionals. Early intervention is the key. Use every other Thursday afternoon at the elementary
schools to group the system’s METCO students in need of extra support. Have a primary group and an upper elementary group. Hire licensed professionals to staff each group.
Provide much more training for Instructional Assistants. Provide mandatory reading courses for 9th graders identified in need of such a course. Identify the appropriate students, and then require they use 2:30 – 4:00 at LHS for
monitored homework time. Experiment with secondary scheduling to provide more time for academic support during
the school day. For example, a 6-day schedule with one period per day dedicated to academic support and/or enrichment.
Common, formative assessments must be developed and put into place at all levels. Parent education and support programs should be offered. Hire an African American drama specialist to work with students on issues of self-image
and confidence. Prevent over-referral to SPED when, in fact, the METCO students are just “instructionally
deprived.”

22
RESEARCH: GAP-CLOSING PRACTICES, SCHOOLS, AND PRACTITIONERS
In this section of the report I will begin by listing and briefly describing the books, research studies, and professional readings I have found to be particularly informative and valuable. Bibliographical data and/or internet links will allow readers to access the material for further examination and study. Important sections of the material will also be placed in this report’s appendix for easy reference. In the second part of this section, I will report on my conversations with a small number of people, some from other parts of the country, who have been doing this work with some success. This section will then conclude with my thoughts on essential gap-closing strategies and practices. Books Chenoweth, Karin. It’s Being Done: Academic Success in Unexpected Schools. Cambridge, MA: Harvard Education Press, 2007.
This is the one book I have read on the subject of gap closing that I recommend all educators read. I attended a forum at Boston University on the achievement gap where I learned of this recent publication. Chenoweth is a longtime education writer who currently writes for the Achievement Alliance. From 1999-2004 she wrote a column on schools and education for the Washington Post. In this book she describes how she used available student achievement data to ferret out 15 schools (all levels and in many different states) where the achievement gaps were being rapidly closed if not eliminated. Her accounts of each school are inspiring and replete with practical ideas and best practices. Although many of the schools in the book are not at all like Lexington’s schools, there is certainly a universal applicability to many of the best practices. There is no substitute for reading the book since many of its best stories are exactly that – stories with many characters and multifaceted approaches. However, here’s an overly simplified, but hopefully appetite-whetting menu of some of this book’s easily listed best practices.
Train community volunteers, mostly retirees, to work with students in literacy and math. The staff coordinator of this program is paid a stipend. (p. 22)
Constant teacher encouragement, high expectations, and expectations that upper classmen serve as role models are all part of a winning and achieving school culture. (pp. 30-31)
Make student achievement data transparent; all teachers know the achievement data of other teachers in order to learn from each other. (p. 39, p. 81)
Parents, many of whom underachieved in their school experience, are given packets of information on how to help their children achieve. (p. 41)
Middle school looping: Team teachers teach grade 7 one year and then loop to grade 8 the next. (p 52, p. 183)
“Excuses are dream killers.” (p. 81) Distribute leadership among the teachers. (p 84)

23
Reorganize the school day to provide long, uninterrupted periods of instruction. (p. 107)
Use advisory periods as the core of how students are connected to the school. (p. 119)
Frequency of good assessment is vital to improve achievement. (p. 134)
Chenoweth concludes with her account of “What It’s Being Done Schools do that Is different.” A summary of her conclusions is included in this report’s Appendix. (PP. 51-52)
Carter, Prudence. Keepin’ It Real: School Success Beyond Black and White. New York: Oxford University Press, 2005.
The directors of EMI recommended this book. Carter is Associate Professor of Sociology at Harvard University. Her book is a study of 68 African American and Hispanic students in Yonkers, NY. Her thesis is that Black and Latino students may describe certain practices as “acting white,” but they do so for cultural reasons, not academic ones, i.e., to act in solidarity with self-worth and pride. However, once enrolled in schools and once they exhibit low academic performance, this gets translated by many educators as a rejection of excellence, which it is not. Carter’s work reminds those of us in education that culture matters. Both our students and we have a responsibility to address how culture affects academic achievement. She reinforces the findings of Ron Ferguson and other researchers that closing the achievement gap will require us to ensure that our students of color have encouraging, understanding, and trusting adults in their schools.
Tatum, Alfred. Teaching Reading to Black Adolescent Males. Portland, ME: Stenhouse Publishers, 2005.
This book was recommended by Dr. Laura Cooper, an Assistant Superintendent in Evanston, Illinois. (I will say more about my conversation with Laura later in this report.) Tatum is an assistant professor in the Department of Literacy Education at Northern Illinois University. In this book, he begins by describing the changes that take place in adolescence, specifically with regard to black males’ literacy development. He goes on to describe how educators must seek comprehensive solutions to address the turmoil that young black men experience in their day-to-day lives. He concludes with a comprehensive framework for literacy teaching, text discussion, and assessment, and also with methods of professional development for teachers.

24
Research Studies High Performance in High Poverty Schools: 90/90/90 and Beyond by Douglas B. Reeves.
http://www.sabine.k12.la.us/online/leadershipacademy/high%20performance%2090%2090%2090%20and%20beyond.pdf
This article provides a review of research in high poverty schools that have also demonstrated high academic performance. Reeves originally coined the term “90/90/90” in 1995. It is based on observations in Milwaukee, Wisconsin, where schools had been identified with the following characteristics: 90% or more of the students were eligible for free and reduced lunch, 90% of more of the students were members of ethnic minority groups, and 90% or more of the students met the district or state academic standards in reading or another area. A key finding in this study is that poverty and minority status are definitely not invariably linked to low achievement. Rather there were common characteristics of these high achieving schools:
A focus on academic achievement Clear curriculum choices Frequent assessment of student progress and multiple opportunities for improvement An emphasis on nonfiction writing Collaborative scoring of student work
Reeves goes on in this article to describe the best practices of the Norfolk, VA, schools where the schools reduced the achievement gap between white and black students in third, fifth, and eighth grades, with both groups continuing to improve:
The Impact of Collaboration: The schools devoted time for teacher collaboration meetings, which were focused on an examination of student work and a collective determination of what the word “proficiency” really means.
The Value of Feedback: The schools with significant improvements provided significantly more frequent feedback to students than is typically the case with a report card. Struggling students often received clear, unambiguous weekly reports
The Impact of Time: The schools with large gains made dramatic changes in their schedules. At the elementary level, they routinely devoted three hours each day to literacy, with two hours of reading and one hour of writing. At the secondary level, they routinely provided double periods of English and mathematics.
Action Research and Mid-Course Corrections: Teachers engaged in successful action research and mid-course changes in strategies.
Aligning Teacher Assignments With Teacher Preparation: Principals made decisive moves in teacher assignments so as to best meet the teachers’ abilities and backgrounds.
Constructive Data Analysis: Successful schools included an intensive focus on student data from multiple sources, and specifically focused on cohort data. In brief, these teachers compared the students to themselves rather than to other groups of students. This analysis allowed them to focus their teacher strategies on the needs of their students and not on generic improvement methods.
Common Assessments: The schools with the greatest improvements in student achievement consistently used common assessment. The use of a common assessment

25
for each major discipline allows for a combination of daily discretion and independence by teachers, while preserving a school-wide commitment to equity and consistency of expectations.
The Value of Every Adult in the System: These remarkably successful schools employed the resources of every adult in the system.
Cross-Disciplinary Integration: There is explicit involvement of the subjects that are frequently and systematically disregarded in traditional accountability systems – music, art, physical education, world languages, technology, career education, consumer and family education, and many other variations on the these themes.
After the Test: Closing the Achievement Gaps With Data by Kiley Walsh Symonds
http://www.ncrel.org/gap/studies/basrc.pdf
This is an impressive study that was published in 2004. The Bay Area School Reform Collaborative surveyed 32 K–8 schools in the San Francisco Bay Area and compared responses from schools narrowing the gaps with schools maintaining or widening the gaps. The study defined gap-closing schools as those schools in which all students made improvement, but low-performing students made more rapid progress. Conversely, the study defined non-gap-closing schools as those schools in which high-performing students made more improvement than low-performing students. Below is a summary of the study’s recommendations:
Schools need frequent, reliable data. Whether in the form of diagnostic assessments or qualitative data, teachers and school leaders need frequent feedback to identify strengths and weaknesses.
Teachers need support to use data. Teachers need professional development regarding
how to understand data and how to take action on the data. They also need collaboration time to discuss strategies and visit each others’ classrooms to observe practice.
Race matters. Schools need to hire and promote people of color and provide structured,
data-based opportunities for faculty to discuss how race and ethnicity affects students’ experiences in school. They should get specific regarding what equity should look like and then set measurable goals regarding how to reach that vision of equity.
Focus is essential. Schools should not try to do everything. Instead, they should choose
what matters most and can be controlled within school walls and focus on it. One essential focus is to make sure that students are mastering reading/literacy skills; these skills are the foundation of learning.
One finding in the study is particularly relevant for our work in Lexington. Case-study schools that focused on a small student group—the lowest-performing student group—reported big gains for the school as a whole. In Belle Air Elementary School, a focus on supporting Hispanic/Latino boys helped teachers hone their skills at differentiating instruction for all. At Roosevelt Middle School, a focus on African-American suspensions resulted in a reduced suspension rate for all students. It may seem counterintuitive, but focusing on a few students can lead to the kinds of

26
deep changes that promote whole school change. In other words, our targeted efforts to raise the achievement levels of our African American/Hispanic students would certainly help all struggling students, if not all students, period. In the appendix I have included two pieces of this study: (1) A graphic from the study called the Cycle of Inquiry, which is essentially a model of Action research. (P. 53) Teachers at one of the gap-closing schools in the study, Belle Air, are constantly using data to ask questions, challenging themselves to try new approaches, and evaluating results. It’s this process that they call the Cycle of Inquiry. Belle Air engages in this formal self-analysis on a school-wide, grade-level, and classroom-level basis. (2) An excellent example of how one school (Roosevelt Middle School) uses data to help children. (PP. 54-55) Gaining Traction, Gaining Ground: How Some High Schools Accelerate Learning for Struggling Students by the Staff of the EDUCATION TRUST (Note: The focus of the Education Trust as an organization is on closing the achievement gap that separates low-income students and students of color from other young Americans.)
http://www2.edtrust.org/NR/rdonlyres/6226B581-83C3-4447-9CE7-31C5694B9EF6/0/GainingTractionGainingGround.pdf
This study, published in November 2005, examined seven public high schools. Four were “high-impact” – that is, they produced unusually large growth among students who entered significantly behind. The Education Trust staff compared these high-impact schools with three average-impact schools with similar demographics. By looking at both sets of schools, they hoped to find out what the high-impact schools do differently than the average-impact schools. Below is an overview of the study’s findings with regard to the characteristics of high-impact high schools:
Sphere 1: Culture
High-impact high schools are clearly focused on preparing students for life beyond high school—specifically, college and careers.
In official policy documents, the clear focus in high-impact schools is on academics. In high-impact high schools, teachers and administrators express consistent views about
achievement-related school goals. In high-impact schools, teachers embrace external standards and assessments; in
courses where such standards and assessments are unavailable, they create them.
Sphere 2: Academic Core
High-impact schools have consistently higher expectations for all students, regardless of students’ prior academic performance; and principals, teachers, and counselors take responsibility for helping students succeed.
In high-impact schools, barriers to high-level course taking are removed. Students are encouraged to take on academic challenges.
27
High-impact schools use assessment data for future planning, such as improving curriculum or making teacher assignments.
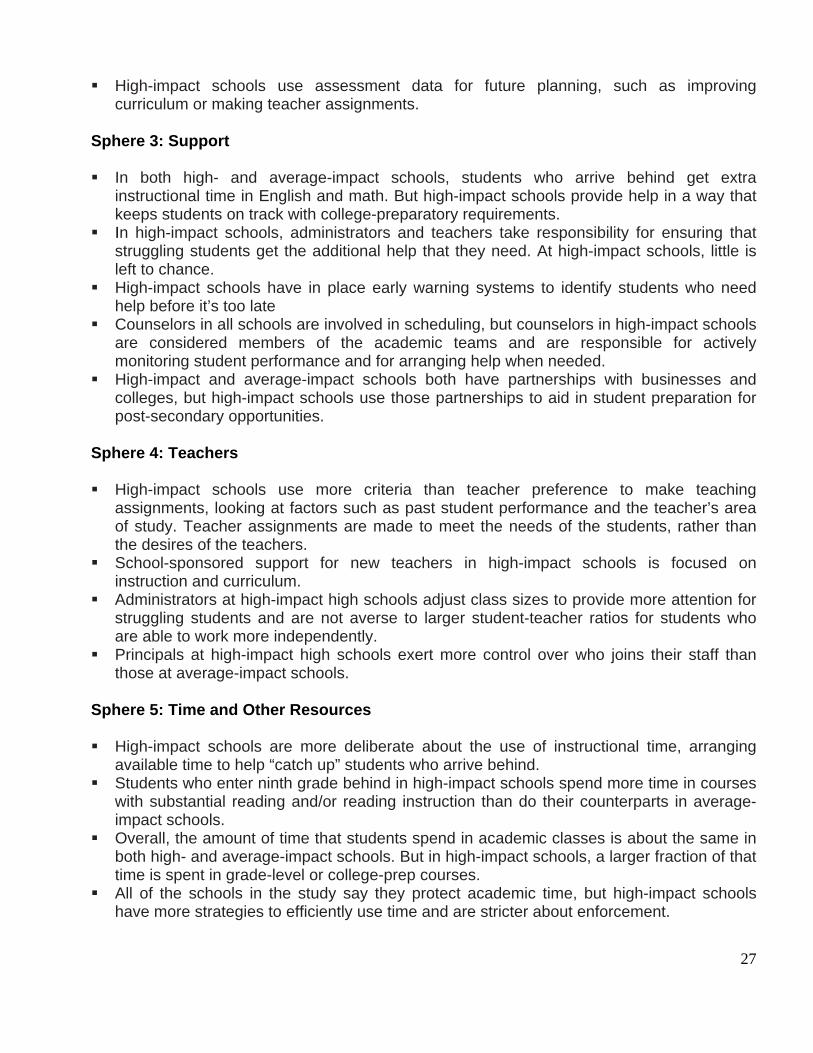
Sphere 3: Support
In both high- and average-impact schools, students who arrive behind get extra
instructional time in English and math. But high-impact schools provide help in a way that keeps students on track with college-preparatory requirements.
In high-impact schools, administrators and teachers take responsibility for ensuring that struggling students get the additional help that they need. At high-impact schools, little is left to chance.
High-impact schools have in place early warning systems to identify students who need help before it’s too late
Counselors in all schools are involved in scheduling, but counselors in high-impact schools are considered members of the academic teams and are responsible for actively monitoring student performance and for arranging help when needed.
High-impact and average-impact schools both have partnerships with businesses and colleges, but high-impact schools use those partnerships to aid in student preparation for post-secondary opportunities.
Sphere 4: Teachers
High-impact schools use more criteria than teacher preference to make teaching
assignments, looking at factors such as past student performance and the teacher’s area of study. Teacher assignments are made to meet the needs of the students, rather than the desires of the teachers.
School-sponsored support for new teachers in high-impact schools is focused on instruction and curriculum.
Administrators at high-impact high schools adjust class sizes to provide more attention for struggling students and are not averse to larger student-teacher ratios for students who are able to work more independently.
Principals at high-impact high schools exert more control over who joins their staff than those at average-impact schools.
Sphere 5: Time and Other Resources
High-impact schools are more deliberate about the use of instructional time, arranging
available time to help “catch up” students who arrive behind. Students who enter ninth grade behind in high-impact schools spend more time in courses
with substantial reading and/or reading instruction than do their counterparts in average-impact schools.
Overall, the amount of time that students spend in academic classes is about the same in both high- and average-impact schools. But in high-impact schools, a larger fraction of that time is spent in grade-level or college-prep courses.
All of the schools in the study say they protect academic time, but high-impact schools have more strategies to efficiently use time and are stricter about enforcement.

28
A table from this study entitled School Practices at a Glance, which compares high-impact and average-impact high school practices, is included in the appendix. (PP. 56-57) ALL STUDENTS REACHING THE TOP: Strategies for Closing Academic Achievement Gaps by the National Study Group for the Affirmative Development of Academic Ability
http://www.ncrel.org/gap/studies/allstudents.pdf
In 2004, with the support of Learning Point Associates, the College Board, and the Institute for Urban and Minority Education at Columbia University Teachers College, 20 leading scholars from multiple disciplines conducted this study. They crafted a vision for affirming academic ability, nurturing intellective competence (defined in the study as that which reflects the integration of academic content with mental processes such as reasoning and critical thinking applied within an ever-changing but highly relevant social context, which results in the mental activity that is necessary to make sense of experiences and to solve problems), and moving all students—particularly minority and low-income students—to high levels of academic achievement. The entire study is well worth examining, but for this report, I will highlight one key finding. The study finds that the social-psychological literature points to a clear message that feelings of trust in the institution, and in those who are seen to represent the interests of those institutions (e.g., teachers, administrators), are a fundamental building block in the affirmative development of high minority achievement. Yet successful minority students are increasingly likely, as they move up the achievement ladder, to encounter contexts and situations in which their group has been historically excluded and underrepresented. Stereotype threat becomes a relevant psychological process when people find themselves in contexts where a stereotype about their group is applicable. As such, Hispanic and African-American students may be particularly vulnerable to stereotypes in the domain of academics, because the stereotype surrounding these students concerns a generalized suspicion about their intelligence. Importantly, the effects of stereotypes can occur without the stereotyped individual himself or herself believing the stereotype—one simply has to have the knowledge of the stereotype and the awareness that others may view him or her through that stereotype. To the degree that schooling in general and standardized testing in particular place particular emphasis on diagnosis of ability as a gateway for tracking, or college admissions, or other future opportunities, the implications of feeling stereotyped in relation to minority student achievement are profound. The study argues that minority students may experience the psychological impact of being a member of a stigmatized group more acutely as they become more academically successful. The reasons for this are twofold: First, such success implies developing an academic identity, which for minority students is a threatened identity. Second, as minority students become more successful, the likelihood increases that educational opportunities and institutions will continue being over-represented by majority group members—thereby increasing suspicions about one’s belonging and acceptance.

29
What Doesn’t Meet the Eye: Understanding and Addressing Racial Disparities in High- Achieving Suburban Schools by Ronald F. Ferguson, Ph. D., November 2002
http://www.ncrel.org/gap/ferg/
Ferguson’s work has particular relevance for Lexington since he examines high-achieving suburban schools. He offers 4 particular recommendations:
1. Assume no motivational differences. It seems likely that incorrect assumptions about group differences in effort and interest may lead some schools to underinvest in searching for ways to raise achievement levels among African-American, Hispanic, and some mixed-race students. Teachers should assume that there are no systematic, group-level differences in effort or motivation to succeed, even when there are clearly observable differences in behavior and academic performance.
2. Address specific skill deficits. Racial and ethnic disparities in self-reported understanding of lessons and readings call attention to the fact that gaps in standardized test scores and school grades reflect real disparities in academic knowledge and skill. To help raise achievement and close gaps, schools should endeavor to identify and address specific skill and knowledge deficits that underlie comprehension problems for individuals in particular racial and ethnic groups and respond in targeted ways.
3. Supply ample encouragement routinely. Given the importance that black and Hispanic students assign to teacher encouragement, teachers need to be aware of what students regard as encouraging. Using this awareness, they need to provide effective forms of encouragement routinely. Further, as the other recommendations imply, encouragement should be matched with truly effective instruction and other forms of academic support both inside and outside the classroom.
4. Provide access to resources and learning experiences. In response to differences in family-background advantages, schools could supply more educational resources and learning experiences outside the home. They could provide access to books and computers and extracurricular opportunities for intellectual enrichment.
Ferguson’s work has been confirmed in other studies. There can be no doubt that effective and encouraging teacher-student relationships are especially important resources for motivating African American and Hispanic students. These students, more so than White and Asian students, report that “encouragement” is much more motivating than teacher “demands.” The mantra - “We care; therefore, they learn” - must be both internalized and made manifest by all educational professionals. Of course, Ferguson also emphasizes that an adequate, ambitious, multi-dimensional strategy to close racial and ethnic gaps in academic knowledge and skill would have many other components as well. He indicates that we must focus relentlessly on ideas and activities geared to produce learning.

30
Gleanings from Professional Journals
The November 2004 edition of Educational Leadership was devoted exclusively to articles about achievement gaps. There is one article in particular that struck me when I read it: “Untracking Earth Science,” by Sherry King, Seth Weitzman, and Larry Keane.
The Hommocks Middle School in the article is part of a high-achieving suburban school system in Westchester County, NY, that is racially, economically, and ethnically integrated. Like Lexington, they faced a minority underachievement problem. This article describes what was done with regard to one, previously tracked 8th grade course – Earth Science. After hosting many community conversations and open study sessions, the school board assured school administrators that engaging students in challenging classes was a higher priority than getting higher test results or making the school look good in the local newspaper. At Hommocks, they decided to admit all but the most seriously disabled students to the rigorous, previously tracked Earth Science course. A year later 95% of the 8th graders took the Regents Earth Science exam compared to only 66% the year before. The average score declined only slightly from 91 to 85, and 98% of the special education students passed the test.
How did they do it at Hommocks? (1) District support and (2) the work of the middle school staff in making comprehensive instructional changes to support the success of all students. The district hired a full-time teacher assistant certified in Earth Science who visited classes, assisted individual students, and taught a support class every other day to those needing more time on task. The district used Title 1 funds to provide before and after school help classes. The district assigned a Spanish-speaking teacher assistant to help ELL students. The middle school staff worked together to create hands-on laboratories for all students and used technology much more effectively. However, the careful use of data to monitor student progress and the cooperation of all staff to create intervention strategies for strugglers really made a difference in all students being able to achieve. Teachers were willing to get to know every student, to take collective responsibility for every student’s success, and to modify their own teaching styles as many times as necessary to help every student learn.
In the September 2007 issue of Educational Leadership, Doug Reeves contributed the article, “Teachers Step Up.”
Reeves describes the remarkably successful efforts of the Jenks Public Schools in Oklahoma for some of the most challenging students in the system. In particular, at Jenks High School, intervention is proactive, not reactive. The school does not wait for a failing grade to institute intervention strategies. At JHS, intervention is delivered by outstanding faculty members who volunteer to take on the most challenging students. Also at JHS, intervention includes time – twice the student contact hours that had been provided in the past. These interventions are mandatory for the students who need them. If extra time is not enough for some students, extra reading and composition classes may be mandated. In math, algebra lab classes are mandated and taught by excellent teachers. Faculty are relentless. Students will learn!
31
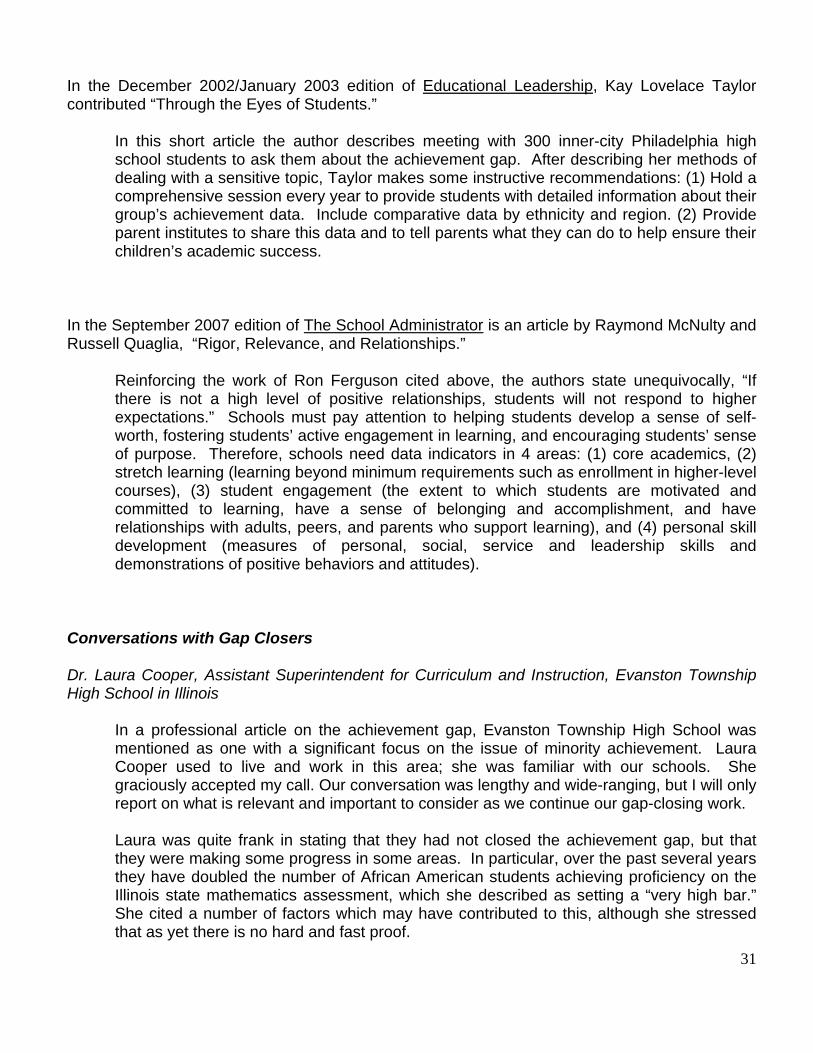
In the December 2002/January 2003 edition of Educational Leadership, Kay Lovelace Taylor contributed “Through the Eyes of Students.”
In this short article the author describes meeting with 300 inner-city Philadelphia high school students to ask them about the achievement gap. After describing her methods of dealing with a sensitive topic, Taylor makes some instructive recommendations: (1) Hold a comprehensive session every year to provide students with detailed information about their group’s achievement data. Include comparative data by ethnicity and region. (2) Provide parent institutes to share this data and to tell parents what they can do to help ensure their children’s academic success.
In the September 2007 edition of The School Administrator is an article by Raymond McNulty and Russell Quaglia, “Rigor, Relevance, and Relationships.”
Reinforcing the work of Ron Ferguson cited above, the authors state unequivocally, “If there is not a high level of positive relationships, students will not respond to higher expectations.” Schools must pay attention to helping students develop a sense of self-worth, fostering students’ active engagement in learning, and encouraging students’ sense of purpose. Therefore, schools need data indicators in 4 areas: (1) core academics, (2) stretch learning (learning beyond minimum requirements such as enrollment in higher-level courses), (3) student engagement (the extent to which students are motivated and committed to learning, have a sense of belonging and accomplishment, and have relationships with adults, peers, and parents who support learning), and (4) personal skill development (measures of personal, social, service and leadership skills and demonstrations of positive behaviors and attitudes).
Conversations with Gap Closers
Dr. Laura Cooper, Assistant Superintendent for Curriculum and Instruction, Evanston Township High School in Illinois
In a professional article on the achievement gap, Evanston Township High School was mentioned as one with a significant focus on the issue of minority achievement. Laura Cooper used to live and work in this area; she was familiar with our schools. She graciously accepted my call. Our conversation was lengthy and wide-ranging, but I will only report on what is relevant and important to consider as we continue our gap-closing work. Laura was quite frank in stating that they had not closed the achievement gap, but that they were making some progress in some areas. In particular, over the past several years they have doubled the number of African American students achieving proficiency on the Illinois state mathematics assessment, which she described as setting a “very high bar.” She cited a number of factors which may have contributed to this, although she stressed that as yet there is no hard and fast proof.

32
Describing algebra and its mastery as key to their entire math program, Laura described how their high school has an algebra team, who have common planning time and who have used that time to develop common assessments. Individual teachers are free to supplement, but not supplant, these common assessment cores. And, critically, Algebra 1 students receive double periods of instruction. There are mandatory help sessions for those who significantly underachieve. These sessions occur in 3-week cycles after which students are reassessed. The school is also in the second year of a pilot summer program for persistently underachieving algebra students. Not only do these students spend 2 hours per day on algebra skills, they also spend 2 hours per day on activities designed to improve their knowledge of themselves, how they learn, and how to be a member of an academic community. This is called the Academic Youth Development Program.
Dr. Douglas Reeves, CEO and founder of the Center for Performance Assessment
Doug was able to take my call while he was waiting to board a flight to his next consulting site. He was able to point me to a number of publications/studies with relevant and current research on gap closing. Much of that material has been referenced in this report. In the brief time we had to talk, Doug emphasized the importance of teaching kids at all levels to master non-fiction writing. He said that $3.1 billion per year is spent by U.S. businesses to help their employees learn how to write! Doug added that schools must do whatever it takes to provide teachers with more time to collaborate and, particularly at the secondary level, to provide teachers and struggling students with more time together. In his most recent research, he pointed out that although requiring underachieving students to spend more time in literacy and mathematics instructional settings initially reduced the number of elective choices/courses, those numbers eventually increased because students had become more proficient and confident as learners. In ending our conversation, Doug emphasized the absolutely critical role that committed leadership must play in doing this work. Without leaders willing to restructure school days and alter traditional scheduling practices to permit course and teacher assignments that underachievers need, success in closing the gaps may be elusive. He emphatically added that that if “heat” must be taken to bring this about, leadership must take it, not teachers.
Mr. David Ingham, Principal of the Adams Middle School in Westland, Michigan
In the appendix, (PP. 58-59) I have included Dave Ingham’s piece called “From the Principal,” which is posted on the Adams website. It is a clear, concise summary of how one school is creating professional learning communities and putting into practice many of the research-proven, gap closing strategies and practices. The link below will allow the reader to explore this school’s very rich website. http://adams.wwcsd.net/index.php?option=com_content&task=blogcategory&id=27&Itemid=43

33
I learned about the Adams Middle School while reading an article recommended by Doug Reeves. Dave Ingham, the principal at Adams, also graciously accepted my call to talk further about their gap closing successes. (Adams is relying heavily on DuFour and Reeves in doing their gap closing work.) In what is emerging as a common theme and an academic imperative, Dave described the one hour per week of contractually permitted after-school time at Adams being used for Professional Learning Community meetings. At Adams, these PLCs are organized vertically (e.g., a PLC made up of all 6th, 7th, and 8th grade English teachers). These PLC teams focus exclusively on how to ensure that all students learn. Thus, this time has been used to develop common assessments and pacing guides in all content areas. (Note: Learning from experience, Dave suggested doing the common assessment work before any pacing guide work.) A “Pyramid of Interventions” was developed and is continually being assessed and altered to address the needs of struggling students. This “Pyramid” is included in the appendix. (P. 60) Dave described semester-long classes that certain levels of underachievement mandate for struggling students. He calls them “Academic Literacy” courses, and one is in mathematics and one in English language arts. Some teachers also volunteer to do directed, shorter-term study groups during lunch periods to which underachievers are assigned until they can test out. I was most interested in learning how the faculty responded to so much fundamental change. Dave indicated it was not always easy and that some faculty found it difficult to give up a degree of autonomy in order to do this “common” work. Some faculty were fearful of the degree of transparency that student assessment was taking on in the PLCs. He indicated that it is essential to celebrate every small victory and every student improvement in the beginning of this work in order to build up a critical mass of success that eventually become points of pride.
Mr. Gary Simon, Mathematics Department Head, Lexington High School
Earlier in this report, I indicated that the math department at LHS seems to be having sustained success in closing the MCAS gaps. Here again are the data, which indicate that from 2003 to 2007 in all 4 subgroups there is gap-closing progress:
LEX Math MCAS: % of Students BELOW PROFICIENT Grade 10 Afr. Am’n. White Asian Hisp. 2003 74% 25% 13% - 2004 75% 20% 6% - 2005 43% 10% 2% 27% 2006 48% 10% 5% 28% 2007 28% 5% 1% 16%

34
In my conversation with Gary, I was very interested in determining if any of the gap-closing practices I had been reading about had been part of the LHS math department’s best practices. I can report with some confidence that this is the case. Eighth graders in Lexington who are assessed most in need of math support are placed in the Integrated Math course. This course has the lowest performing math students but is taught by very experienced and highly skilled teachers. Community volunteers staff the Math Tutoring Center all day, every day with few exceptions. There is also voluntary staffing of a Math Testing Center where students who need extended time or who missed a test can complete these assessments. A TAP Program (Teacher Assistant Program) has been developed which allows seniors to get math credit by being assigned to a particular math teacher and one of that teacher’s particular courses. These seniors then learn how to support struggling students in those classes. Gary reports that math faculty members are also widely available after school to help individual students and that student use of this time is extensive. Every math course has a lead teacher who takes responsibility for coordinating the activities of all staff teaching that course. Department members liberally share all lessons, worksheets, assessments, etc. by posting all such material in a First Class folder for every course. Final exams for every course are eventually posted on the school’s website. Assigning excellent teachers to the neediest students, providing multiple support programs for students both during the day and after school, embedding collaborative faculty practices, and distributing teacher leadership are all characteristics of successful gap-closing strategies.
Ms. Barbara Manfredi, recently retired Principal of the Bridge School
Under Barbara’s leadership, Bridge had the lowest rate of student referral into special education programs. In our conversation I asked her what she thought were the reasons for this. Barbara described a set of practices and a school culture that was successful in getting many struggling students what they needed to succeed without putting them on IEPs. First and foremost, teams of educators met regularly to look at specific data in order to identify underachievers. The Child Assistance Team deliberately did not have special education teachers among its members. All factors were considered in assessing each child and multiple assessments were the rule. Each individual was then provided with the services most likely to address the learning issue within regular education programs. Sometimes that could mean placing a regular education student in a small group of SPED students being taught by a special educator. Like-learners were grouped together. Resources were also distributed as a result of the data examination at grade level team meetings, which took place twice a year. This over-simplified description indicates a total team effort by committed staff with a reliance on data to determine need and distribute resources. Students who were, in Barbara’s words, “instructionally deprived” were provided appropriate instruction without resorting to over-identification as learning disabled. Empowering and enlightened leadership is needed to coordinate such efforts.

35
SUMMARY and RECOMMENDATIONS Schools and school systems reflect the communities in which they operate, the families they serve, and the staff who teach and work there. The individual programs and specific practices, which contribute to all students achieving at proficient and higher levels, will differ widely from one gap-closing school to another. However, there are common characteristics of gap-closing schools, without which, it seems, the achievement gaps will persist.
1. As stated earlier, core beliefs must be the foundation of all gap-closing work. o Academic ability is a developed (and developable) ability, one that is not simply a
function of biological endowment or a fixed aptitude. o Strong, trusting, and encouraging teacher-student relationships will contribute to
improving achievement for all students, but even more so for African American and Hispanic students, who may have internalized the insidious societal message that low achievement indicates low ability.
o While recognizing the crucial role that parents, community, and culture play in educating all students, the primary focus of our schools must be on what we can control and actually do.
o Schools that concentrate on how their practices affect each and every student will be more productive and successful than those that blame students, families, poverty, cultural differences, or race for underachievement. Schools can and must have a powerful, positive impact on the achievement of all students.
o We must all continually examine our beliefs and change our practices to counteract the contemporary and historic impacts of racism and discrimination.
o To improve student achievement for all students and thereby close the achievement gap, we must identify and change those aspects of our school culture that impede our gap-closing work.
o With African American and Hispanic children achieving at significantly lower levels than their white and Asian peers, we cannot choose to be color-blind. Emphasizing race in educational discussions and activities may seem controversial or counterintuitive, but it is far more effective than the alternative.
2. Schools and systems must adopt an explicitly stated, goal-defined, resource-supported,
on-going, laser-like focus on getting all students, particularly those subgroups with long histories of underachievement, to achieve at proficient and higher levels. Focused pursuit and deep implementation of fewer goals is far preferable and more conducive to success than superficially addressing too many goals.
3. Excellent teaching and highly effective leadership must be defined in terms of all
students learning. Reciprocal accountability must be the norm. Districts and leaders must be held accountable for providing all students and teachers with the supports and resources they need to close gaps and ensure high achievement. Teachers must be held accountable for what they have the capacity to accomplish in terms of student learning.

36
4. High standards, rigorous curricula, effective instruction, and frequent formative assessments must all be in alignment.
5. Extended learning opportunities must be abundant. A combination of before school,
during school, after school, summer school, and/or weekend school opportunities must be employed.
6. Scheduling practices must be carefully examined and revised as needed to ensure that
extended learning in literacy and mathematics become mandated realities for underachievers.
7. Early intervention to support underachievers in literacy and math must trump other uses
of instructional time. This over-arching emphasis on literacy and math must extend to middle and high school levels as needed. Non-fiction writing must receive significant emphasis at all levels.
8. African American and Hispanic students must be encouraged to take more high-level
courses and must be given the supports they need to succeed. Secondary school leaders must embrace accountability for making specific, targeted progress in this area.
9. Policies and contracts must be adopted to ensure that the most effective teachers
provide instruction for the most challenging underachievers.
10. Frequent (at least monthly) and effective common, formative assessments of individual student achievement must be instituted at all levels of instruction and must drive the implementation of a tiered set of intervention strategies for underachievers.
11. Collaboration in structured Professional Learning Communities must be embedded in the
school day and must focus exclusively on all aspects of student learning and development.
12. Teachers must be willing to give up some autonomy as members of a PLC, but they
must also receive more authority to experiment, reexamine and alter practices, and make decisions in the best interests of student learning.
13. Understanding that teacher quality is key to student achievement, professional
development programs must provide teachers with the support and skill sets needed to get each and every student to proficiency. In particular, skill in analyzing low-performing student data and linking this data to specific instructional strategies is critical. Teachers, as part of any professional development program, must also be given more opportunities to visit one another’s classrooms.
14. All members of the school community must recognize that strong, trusting, and
encouraging adult-student relationships at school are vital to all students, but particularly to African American and Hispanic students. Specific programs (mentoring, tutoring, role modeling, affinity grouping) must be developed to ensure that minority students are

37
engaged academically, supported culturally and emotionally, and explicitly valued as indispensable members of the school community.
Recommendations My intent here is to stimulate professional conversation and to jump start the decision-making process. There is no substitute for decision-makers delving deeply into this issue on their own before coming together to assess whether these recommendations are complete, appropriate, and viable. I am sure there will be healthy debate and significant revision. The achievement gap is a complex issue, which will require a multi-faceted approach and the application of significant resources over time before every student reaches proficiency on accepted measures of achievement. Success will be largely a matter of will and leadership. For far too long, the small number of METCO students and the small number of Lexington-resident African American and Hispanic students have been easily lost in the aggregate achievement of a high performing district. It’s time to change that fact. The research is convincing that it can be done and that the efforts, programs, and practices required to do so will positively impact the achievement of all students, not just the targeted underachievers. With this in mind, I offer the following recommendations:
1. As soon as possible and practicable the Lexington School Committee should adopt a specific, gap-closing action plan, which includes a time frame (no longer than a 5-year plan) and appropriate, annual benchmarks by which to measure success.
2. To assist the School Committee and Administration in this endeavor, an Achievement Gap
Task Force should be constituted to develop and continually assess/revise the action plan as needed, to provide research and best-practice support, and to oversee its implementation. The Task Force should report to the School Committee in open session every other month.
3. It is vital that the work begun in Lexington to institute and institutionalize formalized
Professional Learning Committees continue. The research is overwhelming that embedded collaboration around student learning is essential not only to gap closing, but also to increasing all students’ achievement and success.
I recommend at this point that readers of this report refer back to the previously reported recommendations of parents, students, and LPS staff on how to address the achievement gap. Many of the studies, books, and journal articles already cited also included important recommendations as well. I hope some of them have or will strike particular chords with particular decision-makers. In addition, having been steeped in this work for several months, I respectfully offer the following recommendations, which I believe are essential:
1. The LPS should institute full-day kindergarten as soon as possible. METCO students, ideally, should enter the LPS in kindergarten.

38
2. All elementary students should receive two hours of high quality literacy instruction and one hour of high quality mathematics instruction every day. Elementary schedules should also be flexible enough to permit additional intervention time for struggling students. These interventions must not be unrelated, uncoordinated pull outs. The Task Force should investigate creative, alternative scheduling practices at both elementary and secondary schools. Scheduling practices that will enable extended learning time for underachievers are essential to this work.
3. Provide bus monitors on all METCO late buses, and provide an elementary METCO late
bus on Thursday afternoons. This is unutilized time for extended learning – the most precious of resources.
4. For implementation as soon as possible, develop a METCO mentor program for those who need an adult advocate in the schools. The Task Force should develop this program, and if it is unrealistic to provide a mentor for every METCO student so quickly, develop the criteria by which to assess the need for a mentor. Ideally METCO students should know if they are accepted into the Lexington Public Schools no later than June, 2 months before school begins, and a mentor should be assigned to allow for summer contact and relationship building.
5. Every school must develop a set of tiered intervention strategies that is directly linked to
individual student assessment. (Ask Stephanie Grimaldi about her piloting of a 3-tier, literacy intervention program.) Tools must also be developed to assess METCO student engagement in school (the extent to which students are motivated and committed to learning, have a sense of belonging and accomplishment, and have relationships with adults, peers, and parents who support learning). This engagement data must be used in conjunction with academic assessments and should contribute to a school’s development of tiered intervention strategies.
6. Counselors and METCO social workers should collaborate in developing action research
projects around the tracking of student achievement and their role in monitoring and/or activating the academic intervention process. One question that must be answered is whether more counselors, social workers, and/or academic support staff will be needed as roles expand to include new responsibilities with regard to student achievement.
7. More staff (custodians, cafeteria workers, instructional assistants, teachers, administrators)
of color must be hired and then supported for success. (Too many licensed staff of color have not achieved PTS in the past.) Eventually, mentor training should be made available to non-professional staff of color; they can play an important role as METCO students’ adult advocates.
8. Specific goals must be set at each school with regard to secondary METCO students enrolling and succeeding in higher-level courses. Therefore, substantial support services must be a part of this effort. (See the article, “Untracking Earth Science,” referenced above for examples of such supports.) Creating a critical mass of METCO high achievers is essential to this work. The Task Force should investigate Brookline High School’s African American Scholars Program.

39
9. Increase tutoring support during school (e.g., drop-in centers or pre-qualified student sign
up’s or mandated, directed studies), after school in both Boston and Lexington (e.g., mandated homework sessions), and before school (e.g. ,mandated help sessions during X block at LHS) by qualified educators for regular-ed underachievers. Adjusting staff working hours (e.g. 7 – 2 or 11 – 6) may make it easier to provide this support.
10. Develop effective, comprehensive assessments for students in grades 5 and 8 to determine who will need semester or yearlong special courses (also to be developed) in basic literacy, non-fiction composition, and/or mathematics in grades 6 and 9. Such coursework may mean double dosing with fewer elective choices. Only highly effective teachers should be teaching these small group classes; therefore, appropriate incentives as well as accountability must be considered. (NOTE: I recognize that the Integrated Math course already exists at LHS.)
11. METCO students and their parents must be actively engaged, not only in individual achievement, but also as members of a group in the gap closing efforts of that group. This will require the sharing of assessment data from year to year to determine goals and assess progress, representation on the Task Force, and increased support for Lexington’s efforts in this regard. I recommend that METCO Lexington, in conjunction with LPS leadership and the Task Force, develop a comprehensive plan to address several of the student, parent, and staff survey findings, namely:
Insufficient or lack of parental involvement and communication with the schools Students’ lack of confidence and effort in academic pursuits Students’ and parents’ expectations, attitudes, and values with regard to education
12. I recommend that the LPS, in conjunction with METCO and the Task Force, develop a
comprehensive plan to address several of the student, parent, and staff survey findings, namely:
Teachers’ communication, conscious and unconscious, of low expectations Over-referral to special education Insufficient communication with parents Insufficient cultural awareness and its effect on student learning
13. Mandatory, Lexington-supported and staffed, rigorous, summer school should be provided
for significantly underachieving students in both Boston and Lexington.
14. METCO parents have asked for and should receive the opportunity to learn more about effective strategies parents can employ to help their children manage their schoolwork more efficiently and effectively. The Task Force should consider how and when to provide such opportunities. I recommend there be at least three programs developed, one for elementary parents, one for middle school parents, and one for high school parents.
15. Increasingly relying on data to drive instruction and instructional interventions necessitates
that the Task Force investigate (1) the significant obstacles and difficulties created by our current technology and software systems, and (2) how to improve our ability to gather, analyze, access, and distribute data. For example, the simple fact that most teachers do

40
not have access to Excel severely limits capacity with regard to using data to help students.
16. In keeping with the truism, “We won’t fix what we will not recognize,” I recommend that this report be disseminated, in whole or in part, in hard copy or in presentation form, to all members of the Lexington school community, and that meaningful discussions focus on acknowledging, understanding, and collaboratively working toward reducing and then eliminating the achievement gap throughout the district.
More than once in this report, I have said that without the requisite will and leadership, the achievement gap in the Lexington Public Schools will persist, just as it has for decades. As James McDermott, English teacher at Worcester’s gap-closing University Park Campus School has said, “We know what works in education. The research is prolific. Amazingly, then, the question today is not about what works, but about why we do not implement what we know works in all schools for all kids.”

41
APPENDIX Reading/English Language Arts % BELOW PROFICIENT
0%
10%
20%
30%
40%
50%
60%
70%
Grade & Subgroup (Afr. Am'n., White, Asian, Hispanic)
Bel
ow P
rofic
ient 2003
2004
2005
2006
2007
2003 59% 14% 18% 41% 50% 13% 10% 60% 34% 10% 4% 27% 42% 9% 14% 0%
2004 45% 14% 11% 42% 53% 14% 10% 45% 42% 8% 7% 25% 50% 11% 7% 0%
2005 37% 20% 14% 0% 52% 19% 10% 54% 36% 8% 3% 0% 50% 8% 13% 9%
2006 48% 21% 18% 36% 48% 28% 16% 0% 51% 9% 5% 23% 35% 7% 6% 14%
2007 56% 16% 13% 27% 58% 17% 13% 47% 35% 7% 5% 21% 42% 5% 4% 8%
3 AA 3 WH 3 AS 3 HS 4 AA 4 WH 4 AS 4 HS 7 AA 7 WH 7 AS 7 HS 10 AA
10 WH
10 AS 10 HS
MCAS Math % BELOW PROFICIET
0%
10%
20%
30%
40%
50%
60%
70%
80%
90%
Grade & Subgroup (Afr. Am'n., White, Asian, Hispanic)
Bel
ow P
rofic
ient 2003
2004200520062007
2003 75% 25% 17% 67% 64% 21% 15% 50% 79% 26% 3% 63% 74% 25% 13% 0
2004 66% 28% 6% 54% 64% 23% 7% 0 81% 24% 10% 50% 75% 20% 6% 0
2005 82% 25% 11% 55% 57% 16% 9% 40% 69% 21% 9% 63% 43% 10% 2% 27%
2006 74% 33% 20% 0 75% 21% 7% 45% 64% 25% 5% 0 48% 10% 5% 28%
2007 77% 23% 10% 47% 54% 17% 5% 46% 63% 20% 7% 43% 28% 5% 1% 16%
4 AA 4 WH 4 AS 4 HS 6 AA 6 WH 6 AS 6 HS 8 AA 8 WH 8 AS 8 HS 10 AA 10 WH 10 AS 10 HS

42
Below are the comparative 2007 and 2006 MCAS, BELOW-PROFICIENT results for Lexington, Boston, Wellesley, Weston, Brookline, Newton, Belmont, Bedford, and Concord-Carlisle. The data are reported for each grade level at which MCAS is administered for each of the 4 subgroups: African American, White, Asian, and Hispanic. The comparative data do show that the percentages of BELOW-PROFICIENT students in Boston, in the aggregate, are significantly greater than in Lexington. The data also show that our comparable communities with METCO programs are also experiencing significant achievement gaps. 2007
BOSTON 2007 MCAS: Percentage of Students BELOW PROFICIENT Subgroup Content Gr. 3 Gr. 4 Gr. 5 Gr. 6 Gr. 7 Gr. 8 Gr. 10
African American E/LA 72% 75% 68% 70% 59% 53% 59%White E/LA 45% 44% 39% 37% 29% 21% 25%Asian E/LA 55% 47% 40% 37% 32% 26% 24%Hispanic E/LA 74% 77% 65% 65% 59% 52% 57%African American MATH 69% 81% 76% 83% 84% 85% 56%White MATH 45% 49% 47% 48% 55% 48% 27%Asian MATH 36% 37% 26% 27% 37% 32% 11%Hispanic MATH 71% 79% 72% 77% 82% 81% 51%African American SCI/TECH - - 88% - - 95% - White SCI/TECH - - 56% - - 81% - Asian SCI/TECH - - 54% - - 79% - Hispanic SCI/TECH - - 84% - - 96% -
LEXINGTON 2007 MCAS: Percentage of Students BELOW PROFICIENT Subgroup Content Gr. 3 Gr. 4 Gr. 5 Gr. 6 Gr. 7 Gr. 8 Gr. 10
African American E/LA 56% 58% 63% 27% 35% 26% 42%White E/LA 16% 17% 14% 8% 7% 5% 5% Asian E/LA 13% 13% 7% 6% 5% 2% 4% Hispanic E/LA 27% 47% 18% 46% 21% 18% 8% African American MATH 64% 77% 58% 54% 66% 63% 28%White MATH 19% 23% 17% 17% 21% 20% 5% Asian MATH 10% 10% 3% 5% 8% 7% 1% Hispanic MATH 40% 47% 27% 46% 50% 43% 16%African American SCI/TECH 79% 79% White SCI/TECH 25% 33% Asian SCI/TECH 54% 23% Hispanic SCI/TECH 36% 72%

43
WELLESLEY 2007 MCAS: Percentage of Students BELOW PROFICIENT Subgroup Content Gr. 3 Gr. 4 Gr. 5 Gr. 6 Gr. 7 Gr. 8 Gr. 10
African American E/LA 85% 40% 62% - 9% 23% 33%White E/LA 10% 15% 11% 7% 4% 5% 4% Asian E/LA 14% 10% 20% 11% 6% 0% 0% Hispanic E/LA 24% 40% 17% 7% 15% 18% 17%African American Math 81% 80% 100% - 73% 62% 39%White Math 16% 32% 22% 16% 20% 26% 6% Asian Math 19% 10% 25% 17% 13% 0% 0% Hispanic Math 43% 80% 50% 21% 46% 54% 9% African American Sci/Tech - - 82% - - 92% - White Sci/Tech - - 28% - - 59% - Asian Sci/Tech - - 30% - - 50% - Hispanic Sci/Tech - - 41% - - 82% -
WESTON 2007 MCAS: Percentage of Students BELOW PROFICIENT Subgroup Content Gr. 3 Gr. 4 Gr. 5 Gr. 6 Gr. 7 Gr. 8 Gr. 10
African American E/LA 50% 36% 56% - - - - White E/LA 15% 13% 11% 10% 6% 1% 3% Asian E/LA 14% 6% 13% 7% 5% 0% 0% Hispanic E/LA - - - - - - - African American Math 60% 71% 81% - - - - White Math 21% 24% 17% 25% 29% 22% 9% Asian Math 14% 17% 0% 7% 15% 45% 12%Hispanic Math - - - - - - - African American Sci/Tech - - 88% - - - - White Sci/Tech - - 28% - - 32% - Asian Sci/Tech - - 33% - - 40% - Hispanic Sci/Tech - - - - - - -
BROOKLINE 2007 MCAS: Percentage of Students BELOW PROFICIENT Subgroup Content Gr. 3 Gr. 4 Gr. 5 Gr. 6 Gr. 7 Gr. 8 Gr. 10
African American E/LA 53% 54% 25% 33% 34% 26% 28%White E/LA 15% 21% 14% 7% 5% 7% 9% Asian E/LA 21% 28% 15% 11% 10% 7% 17%Hispanic E/LA 42% 32% 47% 22% 28% 25% 25%African American Math 65% 77% 41% 50% 72% 77% 36%White Math 22% 35% 24% 18% 19% 24% 12%Asian Math 16% 28% 14% 8% 11% 14% 4% Hispanic Math 36% 60% 54% 45% 52% 48% 39%African American Sci/Tech - - 53% - - 84% - White Sci/Tech - - 25% - - 47% - Asian Sci/Tech - - 27% - - 41% - Hispanic Sci/Tech - - 61% - - 70% -

44
NEWTON 2007 MCAS: Percentage of Students BELOW PROFICIENT Subgroup Content Gr. 3 Gr. 4 Gr. 5 Gr. 6 Gr. 7 Gr. 8 Gr. 10
African American E/LA 62% 53% 50% 46% 43% 36% 43%White E/LA 19% 19% 13% 15% 10% 8% 9% Asian E/LA 23% 20% 17% 17% 12% 4% 8% Hispanic E/LA 43% 45% 25% 27% 46% 22% 19%African American Math 50% 69% 64% 52% 78% 78% 42%White Math 15% 22% 18% 21% 24% 29% 9% Asian Math 12% 25% 12% 11% 13% 13% 5% Hispanic Math 36% 50% 47% 45% 68% 67% 18%African American Sci/Tech - - 69% - - 82% - White Sci/Tech - - 22% - - 45% - Asian Sci/Tech - - 23% - - 34% - Hispanic Sci/Tech - - 49% - - 87% -
BELMONT 2007 MCAS: Percentage of Students BELOW PROFICIENT Subgroup Content Gr. 3 Gr. 4 Gr. 5 Gr. 6 Gr. 7 Gr. 8 Gr. 10
African American E/LA 63% - - 38% - 20% 10%White E/LA 19% 17% 12% 10% 9% 9% 10%Asian E/LA 10% 21% 8% 11% 10% 15% 13%Hispanic E/LA 20% - 50% 39% 20% 15% 27%African American Math 72% - - 69% - 85% 20%White Math 19% 25% 22% 24% 26% 30% 7% Asian Math 6% 30% 20% 4% 14% 12% 0% Hispanic Math 40% - 50% 39% 47% 46% 18%African American Sci/Tech - - - - - 88% - White Sci/Tech - - 25% - - 38% - Asian Sci/Tech - - 20% - - 23% - Hispanic Sci/Tech - - 57% - - 54% -
BEDFORD 2007 MCAS: Percentage of Students BELOW PROFICIENT Subgroup Content Gr. 3 Gr. 4 Gr. 5 Gr. 6 Gr. 7 Gr. 8 Gr. 10
African American E/LA 54% 54% 30% - - - 17%White E/LA 16% 23% 19% 8% 7% 7% 19%Asian E/LA 18% 23% 14% 21% 6% 0% 0% Hispanic E/LA - - - - - - - African American Math 82% 69% 70% - - - 16%White Math 20% 32% 29% 18% 43% 27% 11%Asian Math 18% 32% 22% 26% 30% 70-% 0% Hispanic Math - - - - - - - African American Sci/Tech - - 70% - - - - White Sci/Tech - - 27% - - 44% - Asian Sci/Tech - - 26% - - 29% - Hispanic Sci/Tech - - - - - - -

45
CON.-CARLISLE 2007 MCAS: Percentage of Students BELOW PROFICIENT
Subgroup Content Gr. 10 African American E/LA 29% White E/LA 3% Asian E/LA 10% Hispanic E/LA 10% African American Math 29% White Math 9% Asian Math 10% Hispanic Math 20%
2006
BOSTON 2006 MCAS: Percentage of Students BELOW PROFICIENT Subgroup Content Gr. 3 Gr. 4 Gr. 5 Gr. 6 Gr. 7 Gr. 8
African American E/LA 72% 80% 73% 72% 65% 51%White E/LA 47% 52% 38% 41% 28% 20%Asian E/LA 54% 50% 40% 37% 38% 23%Hispanic E/LA 80% 79% 72% 70% 65% 56%African American MATH 76% 83% 84% 88% 89% 86%White MATH 44% 51% 53% 63% 54% 54%Asian MATH 38% 41% 36% 40% 43% 37%Hispanic MATH 76% 79% 79% 85% 86% 87%African American SCI/TECH - - 87% - - 96%White SCI/TECH - - 61% - - 77%Asian SCI/TECH - - 58% - - 80%Hispanic SCI/TECH - - 86% - - 96%
LEXINGTON 2006 MCAS: Percentage of Students BELOW PROFICIENT Subgroup Content Gr. 3 Gr. 4 Gr. 5 Gr. 6 Gr. 7 Gr. 8
African American E/LA 48% 48% 48% 36% 51% 20%White E/LA 21% 28% 12% 8% 9% 6% Asian E/LA 18% 16% 6% 11% 5% 3% Hispanic E/LA 36% - 41% 36% 23% - African American Math 68% 74% 67% 75% 73% 64%White Math 21% 33% 21% 21% 24% 25%Asian Math 14% 20% 9% 7% 12% 5% Hispanic Math 45% - 36% 45% 61% - African American Sci/Tech - - 74% - - 80%White Sci/Tech - - 22% - - 34%Asian Sci/Tech - - 14% - - 19%Hispanic Sci/Tech - - 45% - - -

46
WELLESLEY 2006 MCAS: Percentage of Students BELOW PROFICIENT Subgroup Content Gr. 3 Gr. 4 Gr. 5 Gr. 6 Gr. 7 Gr. 8
African American E/LA 57% 83% 50% 8% 34% - White E/LA 15% 22% 8% 5% 8% 4% Asian E/LA 13% 12% 15% 3% 4% - Hispanic E/LA - - - - 10% - African American Math 77% 100% 75% 58% 60% - White Math 29% 39% 25% 19% 29% 31%Asian Math 19% 17% 25% 3% 0% - Hispanic Math - - - - 30% - African American Sci/Tech - - 92% - - - White Sci/Tech - - 33% - - 41%Asian Sci/Tech - - 35% - - - Hispanic Sci/Tech - - - - - -
WESTON 2006 MCAS: Percentage of Students BELOW PROFICIENT Subgroup Content Gr. 3 Gr. 4 Gr. 5 Gr. 6 Gr. 7 Gr. 8
African American E/LA 38% 43% - 36% - 50%White E/LA 13% 19% 11% 10% 6% 9% Asian E/LA 4% 7% 5% 15% 4% 0% Hispanic E/LA - - - - - - African American Math 63% 63% - 72% - 84%White Math 20% 25% 29% 22% 28% 35%Asian Math 17% 13% 21% 19% 35% 0% Hispanic Math - - - - - - African American Sci/Tech - - - - - 84%White Sci/Tech - - 35% - - 35%Asian Sci/Tech - - 26% - - 5% Hispanic Sci/Tech - - - - - -
BROOKLINE 2006 MCAS: Percentage of Students BELOW PROFICIENT Subgroup Content Gr. 3 Gr. 4 Gr. 5 Gr. 6 Gr. 7 Gr. 8
African American E/LA 36% 48% 49% 29% 35% 40%White E/LA 17% 27% 13% 9% 10% 4% Asian E/LA 34% 34% 17% 12% 13% 8% Hispanic E/LA 43% 68% 39% 31% 34% 30%African American Math 64% 53% 71% 63% 68% 79%White Math 27% 29% 27% 18% 26% 23%Asian Math 27% 22% 20% 8% 21% 16%Hispanic Math 50% 68% 56% 46% 46% 59%African American Sci/Tech - - 83% - - 81%White Sci/Tech - - 31% - - 37%Asian Sci/Tech - - 32% - - 47%Hispanic Sci/Tech - - 78% - - 79%

47
NEWTON 2006 MCAS: Percentage of Students BELOW PROFICIENT Subgroup Content Gr. 3 Gr. 4 Gr. 5 Gr. 6 Gr. 7 Gr. 8
African American E/LA 54% 66% 46% 41% 55% 31%White E/LA 20% 28% 16% 12% 17% 8% Asian E/LA 22% 34% 21% 10% 11% 8% Hispanic E/LA 46% 54% 40% 54% 45% 32%African American Math 68% 79% 59% 66% 76% 79%White Math 12% 32% 26% 22% 30% 33%Asian Math 20% 23% 19% 9% 12% 19%Hispanic Math 43% 65% 53% 76% 64% 62%African American Sci/Tech - - 43% - - 81%White Sci/Tech - - 21% - - 45%Asian Sci/Tech - - 27% - - 38%Hispanic Sci/Tech - - 50% - - 71%
BELMONT 2006 MCAS: Percentage of Students BELOW PROFICIENT Subgroup Content Gr. 3 Gr. 4 Gr. 5 Gr. 6 Gr. 7 Gr. 8
African American E/LA 64% 50% 56% - 52% 30%White E/LA 18% 19% 13% 8% 10% 5% Asian E/LA 18% 17% 10% 12% 12% 10%Hispanic E/LA - - - 15% 17% - African American Math 63% 90% 81% - 100% 70%White Math 22% 33% 32% 29% 34% 29%Asian Math 21% 29% 17% 19% 20% 17%Hispanic Math - - - 71% 58% - African American Sci/Tech - - 75% - - 70%White Sci/Tech - - 21% - - 37%Asian Sci/Tech - - 31% - - 36%Hispanic Sci/Tech - - - - - -
BEDFORD 2006 MCAS: Percentage of Students BELOW PROFICIENT Subgroup Content Gr. 3 Gr. 4 Gr. 5 Gr. 6 Gr. 7 Gr. 8
African American E/LA 45% 60% - - - - White E/LA 20% 36% 12% 21% 10% 6% Asian E/LA 35% 25% 35% 16% 6% 7% Hispanic E/LA - - - - - - African American Math 45% 80% - - - - White Math 27% 41% 30% 33% 30% 29%Asian Math 17% 29% 30% 21% 12% 7% Hispanic Math - - - - - - African American Sci/Tech - - - - - - White Sci/Tech - - 29% - - 53%Asian Sci/Tech - - 30% - - 20%Hispanic Sci/Tech - - - - - -

48
CON.-CARLISLE 2006 MCAS: Percentage of Students BELOW PROFICIENT Subgroup Content Gr. 10
African American E/LA 18% White E/LA 5% Asian E/LA 0% Hispanic E/LA - African American Math 47% White Math 9% Asian Math 0% Hispanic Math -
Below are the 2007 MCAS, BELOW-PROFICIENT results for Lexington across the grades for the 4 subgroups, but with the actual number of students in that subgroup.
LEXINGTON 2007 MCAS: Percentage of Students in Subgroups BELOW PROFICIENT
Subgroup Content Gr. 3 Gr. 4 Gr. 5 Gr. 6 Gr. 7 Gr. 8 Gr. 10 African Americans E/LA 56% of 25 58% of 26 63% of 19 27% of 22 35% of 32 26% of 19 42% of 19
Whites E/LA 16% of 316 17% of 305 14% of 307 8% of 329 7% of 372 5% of 363 5% of 372 Asians E/LA 13% of 112 13% of 92 7% of 121 6% of 141 5% of 97 2% of 98 4% of 73
Hispanics E/LA 27% of 15 47% of 15 18% of 11 46% of 13 21% of 14 18% of 22 8% of 25 African Americans MATH 64% of 25 77% of 26 58% of 19 54% of 22 66% of 32 63% of 19 28% of 18
Whites MATH 19% of 316 23% of 304 17% of 306 17% of 330 21% of 376 20% of 361 5% of 368 Asians MATH 10% of 113 10% of 92 3% of 121 5% of 143 8% of 96 7% of 98 1% of 74
Hispanics MATH 40% of 15 47% of 15 27% of 11 46% of 13 50% of 14 43% of 21 16% of 25
African Americans SCI/TECH 79% of 19 79% of 19 Whites SCI/TECH 25% of 306 33% of 362 Asians SCI/TECH 54% of 121 23% of 98
Hispanics SCI/TECH 36% of 11 72% of 21

49
Below are two bar graphs, one for ELA and one for math, showing the 2007 BELOW-PROFICIENT data for the 4 subgroups in the elementary grades, in middle school, and in grade 10.
% BELOW PROFICIENT ON 2007 MCAS
59%
16%
10%
32%30%
7%5%
27%
42%
5% 4%8%
0%
10%
20%
30%
40%
50%
60%
70%
E/LA E/LA E/LA E/LA
African Americans Whites Asians Hispanics
Subgroups: English/Language Arts
BEL
OW
PR
OFI
CIE
NT
Grades 3-5
Grades 6-8
Grade 10
% BELOW PROFICIENT ON 2007 MCAS
67%
20%
8%
39%
62%
19%
7%
46%
28%
5%1%
16%
0%
10%
20%
30%
40%
50%
60%
70%
80%
MATH MATH MATH MATH
African Americans Whites Asians Hispanics
Subgroups: Mathematics
BEL
OW
PR
OFI
CIE
NT
Grades 3-5Grades 6-8Grade 10
Grade

50
Below is a table of grade 10 MCAS data for METCO students in 2006 and 2007 which disaggregates the scaled scores by gender. The scores indicate no significant differences.
Grade 10 MCAS 2007 2006 Boys' ELA Average 245.3 242.8 Girls' ELA Average 244.7 234.7 Boys' Math Average 250.7 231.2 Girls' Math Average 251.0 230.7
The table below indicates when and from where all METCO SPED students were referred.
98 99 00 01 02 03 04 05 06 07 Bowman 2 3 1 0 6 3 2 3 3 1 Bridge 0 1 2 1 1 2 1 2 2 1 Estabrook 1 1 1 0 2 1 2 1 0 1 Fiske 0 0 0 4 2 2 1 1 8 0 Harrington 0 1 1 1 1 1 0 1 1 1 Hastings 0 1 2 0 2 2 2 1 0 1 Diamond 0 0 0 0 0 0 0 0 2 0 Clarke 0 0 0 0 0 0 0 0 0 0 LHS 0 0 0 0 0 0 0 0 0 2 Total 3 7 7 6 14 11 8 9 16 7 88

51
Summary of the conclusion of Karin Chenoweth’s book, It’s Being Done What are the common characteristics of the gap-closing schools she visited?
1. They teach their students. This is not a flip thing to say; rather, in these schools teachers think deeply about what their students need to learn and how to make sure they learn it. It’s all about learning in these schools, not just about teaching.
2. They don’t teach to the state tests. They teach a rich, coherent curriculum tied to state standards.
3. They have high expectations for their students. They assume all students are able to meet high standards and believe their job is to help their students get there. High achievement is a topic of continuous conversation and encouragement at all levels.
4. They know what the stakes are. They know that without a good education, their students face the probability of a lifetime of poverty and dependence. They talk about this fact with their students.
5. They embrace and use all the data they can get their hands on. They know that achievement data represent a kid’s face or a group of kids’ faces. That’s a life; that’s a future.
6. They use data to focus on individual students, not just a group of students. 7. They constantly reexamine what they do. Tradition is never invoked as the only reason
something is done. Change is the logical consequence of putting student achievement ahead of everything else.
8. They embrace accountability. They know they have an obligation not only to their students but to their communities to demonstrate that they are doing the job that has been entrusted to them to do – to educate future citizens.
9. They make decisions on what is good for kids, not what is good for adults. For example, schedules are created and teachers are assigned for the maximum benefit to students, not to senior staff.
10. They use school time wisely. School is a time for instruction, and instruction is treated as something almost sacred.
11. They leverage as many resources from the community as possible. This means everything from organizing outside mentors and volunteers to asking outside companies and organizations for help.
12. They expand the time students – particularly struggling students – have in school. This is done in many ways: before and after school programs, summer programs, intensive tutoring during vacations.
13. They do not spend a lot of time disciplining students, in the sense of punishing them. Discipline means leading the children in the most positive sense.
14. They establish an atmosphere of respect. 15. They like kids. Students are brought into conversations, student work is proudly
displayed, and older students are specifically taught how to be role models for younger students.
16. They make sure that kids who struggle the most have the best instruction. 17. Principals are a constant presence. They walk the halls, visit classes, and know all the
children 18. Principals are not the only leaders. Distributive leadership is made real. 19. They pay careful attention to the quality of the teaching staff. 20. They provide teachers with the time to meet to plan and work collaboratively.
Schedules are built with embedded, professional collaboration in mind. 21. They provide teachers time to observe each other.

52
22. They think seriously about professional development. The general theory is that if students are weak in a particular area, that means that teachers need to learn more about it.
23. They assume that they will have to train new teachers more or less from scratch and carefully acculturate all newly hired teachers.
24. They have high-quality, dedicated, and competent office and building staff who feel themselves part of the educational mission of the school.
25. They are nice places to work. Expectations are high for all staff who work incredibly hard; however, the rewards and satisfaction make these schools wonderful places to work.
26. In sum, the adults in these schools expect their students to learn, and they work hard to master the skills and knowledge necessary to teach those students.

53
Below is the Action Research model described in the Kiley Walsh Symonds study, After the Test: Closing the Achievement Gaps With Data.

54
Below is a section of the Kiley Walsh Symonds study, After the Test: Closing the Achievement Gaps With Data. It is an excellent example of how one school uses data to help children. HOW ARE THEY DOING IT? 1. Data-Based Decision Making Roosevelt uses data constantly to improve both academic achievement and the school’s learning environment. When Stockey became principal in 1998, she conducted a thorough needs analysis, leading the teachers through a careful examination of student achievement data and conducting focus groups with parents, teachers, students, and community members. What she discovered was sobering. “African-Americans were underrepresented in everything,” she remembered. “It was across the board. We were bottom feeders in every area. African-Americans were the majority performing in the first quartile. It was ‘in your face’ data. To me, you couldn’t ignore it. But the other companion to that was the quiet data. The detentions, suspensions, referrals were African-Americans. That was another hard one that we had to look at.” Student Achievement Data. Over the past five years, Roosevelt has gone from what principal Stockey described as a “perfunctory” attitude toward looking at data to examining it with a passion. “[Roosevelt] has had a real climate shift in terms of comfort with data, and receptiveness to using it in meaningful ways,” said Patrick Lee, data and assessment coordinator at Oakland Unified School District. “The administration has worked really hard with teachers so that they’re not seeing the data as evaluative against them, but rather as pieces of information on which to reflect. Reflecting on data is a continual process that they undergo throughout the year.” The school uses a wide variety of diagnostic assessments, including a Curriculum Embedded Assessment (CEA) for writing, the Gates-MacGinitie Reading Test, and a math Problem of the Week (POW) also instituted in 2001. Each test is administered biannually, once in the fall and then in the spring. Teachers look at data from these assessments, and data from the STAR testing program (disaggregated by race and ethnicity), and determine strengths and weaknesses and plan their curriculum and lessons accordingly. “When we started with BASRC,” explained Principal Stockey, “one of the things that we always looked at was the data. And people did so reluctantly. You find now they delve into the data.” Roosevelt has an infrastructure to support the consistent use of data with staff resources and time during the school day and at the end of the school year. Teachers have time for data analysis every Wednesday, a minimum-release day in which classes are 30 minutes each. Twice a month, the entire staff meets; in the other two weeks, there are either department meetings or committee meetings. To make sure the daily business of running a school doesn’t crowd out time for discussing data, one staff meeting a month, called Standards in Practice, is devoted solely to this work. Similarly, the committee structure is intended to focus discussions. Every teacher serves on a committee. While every committee is data-informed, two in particular—the Data Committee; and the Curriculum, Instruction, and Assessment Committee—focus their efforts on analyzing data for the rest of the staff to use, including creating charts and graphs for departmental reflection. As one teacher reflected, “Everybody is given the data, and we take our time and look at it.

55
We do a lot of that. We throw ideas up on the table…. Before, there’s been criticism that ‘Well, so we’ve got all this data, what are we going to do differently?’ And I think that’s what’s happening now; we’re able to do more planning.” Use of data is further emphasized by Roosevelt’s annual Day of Reflection. At the end of every school year since 1996, Roosevelt has held a Day of Reflection, a structured feedback session on the past academic year for the entire staff to analyze school data and suggest next steps. The leadership team then takes recommendations and, over a summer leadership team retreat, develops an implementation plan. The whole faculty then convenes for a fall retreat to develop a data-based action plan. The school also employs a full-time instructional coordinator, Jane O’Brien, who is responsible for managing all aspects of the assessment process, including making sure teachers receive necessary data in a timely manner and in a format that they can understand. “[Roosevelt’s] approach to data has been very honest and forthright,” said Lee, the data and assessment coordinator. “The principal and assistant principals have been very forceful in working with their staff on looking at the data and looking at differences in achievement. And asking teachers and teams of teachers ‘Why do these patterns exist?’ Asking hard questions. ‘Why do these gaps exist?’ ” Assistant Principal Theresa Clincy summed up Roosevelt’s philosophy, explaining, “This school is data-driven. You don’t know if you are digressing or improving if you don’t look at data from one year to another. You make changes accordingly so you do make improvements over time. That’s one of the first things I learned when I came on board with Darcel. Look at the data, see what it says. Go from there. On the next 2 pages is a table comparing high-impact and average-impact high school practices from the study Gaining Traction, Gaining Ground: How Some High Schools Accelerate Learning for Struggling Students by the Staff of the EDUCATION TRUST.
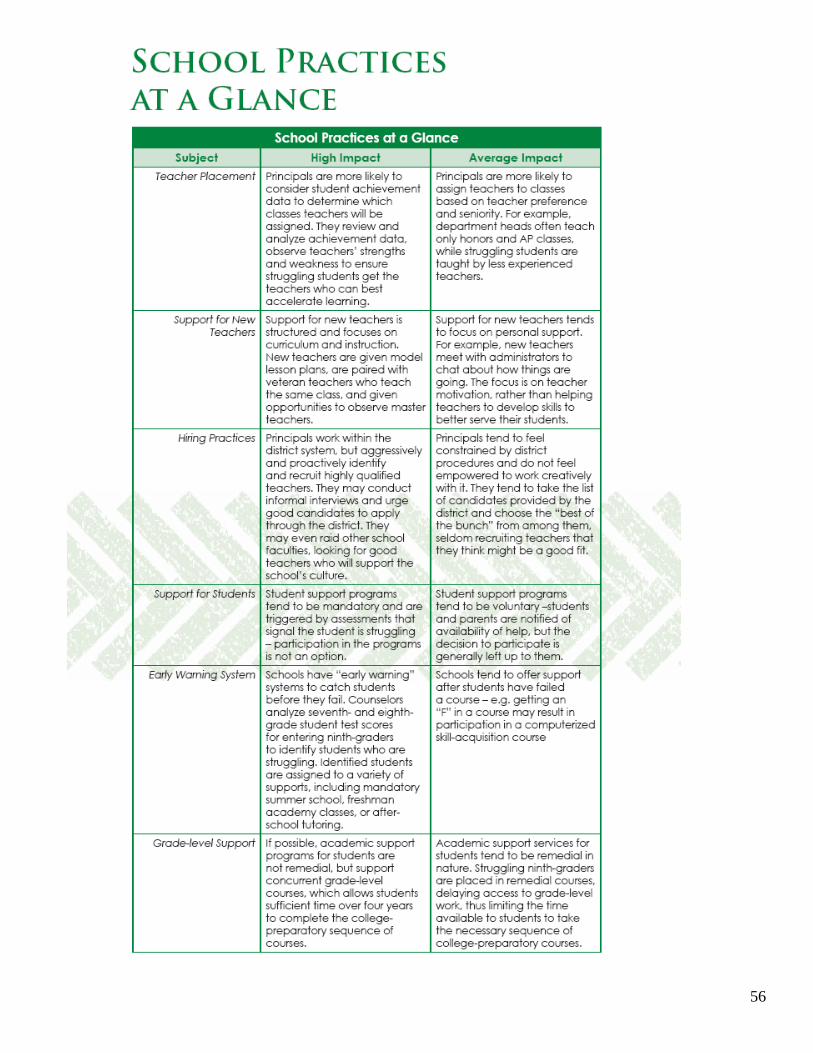
56

57

58
Below is David Ingham’s “From the Principal” document, posted on the home page of the Adams Middle School in Westland, Michigan.
During the past four years, Adams Middle School, in Westland, Michigan has successfully made a fundamental change in the school culture. We have gone from a traditional school, with teachers working in isolation, to a Professional Learning Community (PLC) with teachers working in effective, high-performing collaborative teams focused on learning. This building-wide cultural change is radically different from what has guided middle schools in the past.
Adams started this cultural transition four years ago with a shared mission, vision and goals focused on student achievement with a results orientation. Adams truly practices that, “Failure is Not an Option”, and “All students will learn” if we answer and act on three basic questions:
· What is it we expect students to learn? · How will we know when they have learned it? · How will we respond and what will we do when they don’t learn?
The school adopted four results oriented goals focused on student achievement: 1. Increase student achievement in English Language Arts (ELA). 2. Increase student achievement in Math. 3. Increase student achievement in Science. 4. Increase student achievement in Social Studies.
To begin to answer our first basic question, What is it we expect students to learn?, we have replaced teacher isolation with collaborative content area teams that are embedded into the daily life of the school. Adams has organized all teachers into the following content area teams: ELA, Math, Science, Social Studies, Physical Education, Fine Arts, Practical Arts and Counseling. These teams use our one-hour of contract time, previously used for staff meetings, each week for job-embedded professional development. They have collaborated in a collective effort to produce Pacing Guides for all courses offered at Adams. Our teachers gave up a degree of personal autonomy in exchange for collective authority in the form of Pacing Guides to standardize the question “What we expect students to learn”. The teams have the benefit of time, focus, parameters, access to information and ongoing support as they engage in collective inquiry and action research. They work together in an ongoing effort to discover best practices and to expand their professional expertise. During our weekly job-embedded professional development time, our content area teams have also collectively worked on our second basic question, How will we know when they have learned it? Teachers developed common assessments through this collaborative effort. Each team is developing a minimum of four common assessments by grade level for each content area. These common assessments provide every teacher with timely, relevant feedback on the achievement of his or her students in comparison to other comparable students attempting to meet the same standard. Our teachers then identify strengths and weaknesses in student learning and identify areas that need additional attention. Teachers are working together on these teams to support one another, do collective inquiry on best practices, and seek ways to improve individual and team results. To help ease their transition into this teamwork, each team developed its own norms or protocols to facilitate their work as a team. Another tool used in the team process is the team feedback sheet. Each week following the content team meeting, the team will turn in this sheet to the Principal. This provides a means for the Principal to respond with direct feedback to each team on a timely basis. Adams is addressing our third basic question, How will we respond and what will we do when they don’t learn? Collaborative teams review data from the common assessments and

59
identify students who need additional time and support. Adams has created a school-wide systematic approach to student interventions. This is called a “Pyramid of Interventions” which is used to monitor each student’s attainment of the essential learning on a timely, ongoing basis. This “pyramid” is a series of consistent, systematic procedures that ensure each student is guaranteed additional time and support when needed. This approach has produced powerful benefits for students and staff alike. Our school, although it has the largest population of economically disadvantaged students in the district, has surpassed the other middle schools in student achievement. The staff members take justifiable pride in the powerful results their collective efforts have produced, even as they look for additional ways to reach all students. An additional positive outcome of this transition process has been the consolidation of the various school improvement requirements. Adams has taken the various traditional improvement plans, such as NCA School Improvement, MEAP Improvement, Title I and MI Plan and then streamlined their efforts into one consolidated plan with the four goals stated above. This has provided our staff with a single approach organized for sustained school improvement. Adams is also trying a new approach to special education in hopes of bringing more students with disabilities up to grade level. Instead of sending these students to work with special-education teachers in separate special education rooms, we are bringing the special-education teachers into the regular education classrooms to work with them. This plan, known as the “inclusion model”, teams special-education teachers with regular English, math, science and social studies teachers. Students that were assigned to a special-education English class in the past, now go to a regular class with a special-education teacher there to help them adapt and be successful. In these new powerful classrooms, collaborative teaching or coteaching is the delivery system. The general and special-education teachers work together to teach a group of predominantly regular students along with some students with disabilities. Adams Middle School has built a meaningful collaborative culture and therefore has transformed our school by making “learning” rather than “teaching” its fundamental purpose. We have overcome a tradition of teacher isolation to now work in effective content area teams. Our high performing collaborative teams have created content area goals and shared lesson plans, developed pacing guides, rubrics, protocols, parent communications, common assessments, and weekly feedback sheets. They analyzed student performance on assessments and the strategies they would use to improve upon that performance. These actions have resulted in dramatic improvements in student achievement. During the past two years, Adams has led the district in MEAP, our state assessment, scores for ELA, Math, Science and Social Studies and has led the district in 3 of 4 areas for each of the past two years. These scores are also well above the state averages. Adams also leads the district with an 89% Michigan School Report Card Grade. The Adams staff has turned aspirations into action, visions into reality, and this has produced increases in student achievement.
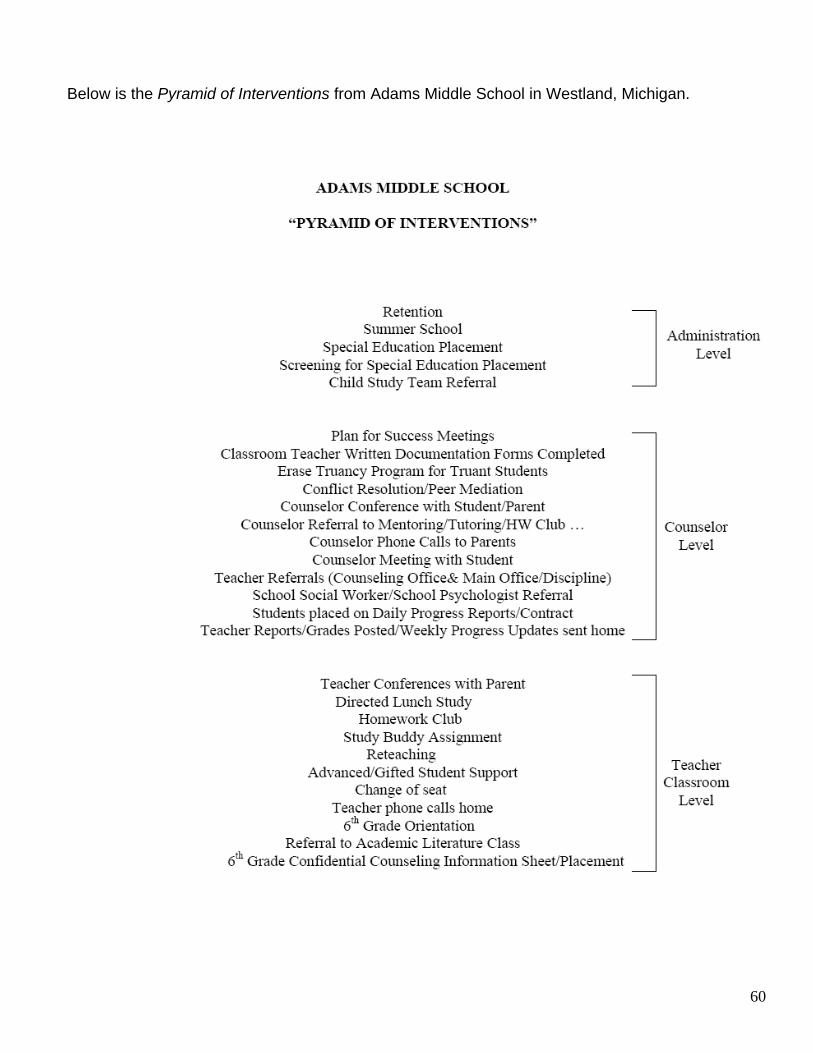
60
Below is the Pyramid of Interventions from Adams Middle School in Westland, Michigan.