Embed Size (px)
Citation preview

Sand Creek Industrial Superfund Site, O.U. 1, Page i of 31
U.S. ENVIRONMENTAL PROTECTION AGENCYOffice of Solid Waste and Emergency ResponseTechnology Innovation Office
COST AND PERFORMANCE REPORT
EXECUTIVE SUMMARY
This report presents cost and performance data for a soil vapor extraction (SVE) system at the SandCreek Superfund site, Operable Unit (O.U.) 1, in Commerce City, Colorado. The SVE system was usedat the Sand Creek O.U. 1 site to treat soil contaminated with halogenated volatile organic compounds(VOCs), specifically chloroform, methylene chloride, trichloroethene (TCE), and tetrachloroethene(PCE), and nonhalogenated VOCs, including mixed petroleum hydrocarbons.
The Sand Creek O.U. 1 site was the location of pesticide manufacturing companies in the 1960s and1970s, and prior to that, by a petroleum refinery. The pesticide manufacturing companies had two firesin the period from 1968-1977, and were reported to have unsatisfactory waste management practices. Remedial investigations conducted from 1984 to 1988 showed three subareas of soil contamination atSand Creek O.U. 1 (referred to as Subareas 1,2, and 3), with the following maximum soil concentrationsof halogenated VOCs: chloroform - 0.820 mg/kg, methylene chloride - 5.8 mg/kg, TCE - 0.087 mg/kg,and PCE - 9.34 mg/kg. Based on these concentrations, EPA estimated the total mass of the four targetcontaminants in the operable unit as 684 pounds. No information was provided in the availablereferences on the concentrations or mass of nonhalogenated VOCs in the three subareas.
A Record of Decision (ROD) addressing Sand Creek O.U. 1 was signed in September 1989 and anExplanation of Significant Differences (ESD) modifying the 1989 ROD was issued in September 1993. The modified ROD specified soil cleanup standards for the four target VOCs as follows: chloroform -0.165 mg/kg, methylene chloride - 0.075 mg/kg, TCE - 0.285 mg/kg, and PCE - 1.095 mg/kg. No soilcleanup standards were identified for the nonhalogenated VOCs.
The SVE system used in this application was a patented fluid injection/vapor extraction (FIVE) system. In the FIVE technology, pressurized air is injected into vadose zone soils to produce relatively largersubsurface pressure gradients and higher flow rates of extracted vapors than would be achieved solelywith using vapor extraction technology. The FIVE system used at Sand Creek O.U. 1 consisted of 32extraction/injection wells (31 vertical, 1 horizontal), three positive displacement blowers (for extraction),one liquid/vapor separator, one catalytic oxidizer, and two blowers (for injection). The wells werescreened up to 32.5 feet below ground surface.
The FIVE system was operated from September to December 1993, and again from January to April1994, for a total of approximately six months of run time. Confirmatory soil borings collected in April1994 showed that the concentrations for all four target contaminants were less than the cleanup standardsset in the ROD. The maximum concentration of target contaminants measured in the confirmation soilborings was: chloroform - 0.0099 mg/kg, methylene chloride - not detected, TCE - 0.10 mg/kg, and PCE -0.28 mg/kg. Approximately 176,500 pounds of total VOCs were extracted during this application,including 3,250 pounds of the four target contaminants. The 3,250 pound value was roughly4.75 times greater than the original estimated mass of target contaminants (685 pounds). An airemissions operating permit was not obtained for this application, however, air emissions were regulated

Sand Creek Industrial Superfund Site, O.U. 1, Page ii of 31
U.S. ENVIRONMENTAL PROTECTION AGENCYOffice of Solid Waste and Emergency ResponseTechnology Innovation Office
EXECUTIVE SUMMARY (CONT.)
under an Air Pollution Emission Notice issued by the Colorado Department of Health. Approximately6,200 pounds of total VOCs were released to the atmosphere through stack emissions.
The total actual costs for this application were approximately $2,140,000. Of this total, about $82,000were expended in before-treatment costs, such as for mobilization and preparatory work, confirmatorysampling, and QA/QC laboratory analyses, and $2,058,000 were expended for activities directlyattributed to treatment, such as subcontractor costs, project management/administrative, SVE remedialwork, and cost of ownership. The costs directly attributed to treatment correspond to $39-65 per cubicyard of soil treated (based on a range of soil quantity treated estimates of 31,440 to 52,920 cubic yards,as provided by the vendor) and $11.70 per pound of VOC removed (based on 176,500 pounds).

Sand Creek Industrial Superfund Site, O.U. 1, Page 1 of 31
U.S. ENVIRONMENTAL PROTECTION AGENCYOffice of Solid Waste and Emergency ResponseTechnology Innovation Office
SITE INFORMATION
Identifying Information:
Sand Creek Industrial Superfund siteOperable Unit No. 1Commerce City, ColoradoCERCLIS # COD980717953Action Memorandum Date: September 29, 1989
Treatment Application:
Type of Action: RemedialTreatability Study Associated with Application? Remedial(see discussion under remedy selection)EPA SITE Program Test Associated with Application? RemedialPeriod of Operation: September 24, 1993 to April 27, 1994Quantity of Material Treated During Application: There are varying estimates of thequantity of soil treated during this application. These differences are attributed to the differentmethods used to estimate soil volume for an in-situ application. The following estimates arebased on input from the vendor and have been reviewed by the RPM.
The treatment vendor (OHM) provided estimates for quantity of material treated based on (1) themean (average) groundwater depth and (2) the mean smear zone screen length, as shown belowfor the three SVE system areas. (Smear zone is the area immediately above the groundwatertable, which, in this application, was the area from the top of the well screens to the water table ,and which was contaminated by hydrocarbons.) The vendor identified the areal extent of thethree SVE areas based on information in their solicitation and used average groundwater depthand smear zone lengths to calculate soil quantity treated. [14]
Treatment Vendor Estimate of Soil Quantity Treated-Mean Depth to Groundwater [14]
SVE Area Area (ft2)
Mean (Average)Groundwater
Depth (ft) Volume (ft3) Volume (yd3)
1 29,300 12.4 363,320 13,456
2 30,872 27.2 839,718 31,100
3 7,238 31.2 225,826 8,364
Total (based on mean groundwater depth) 52,920

Sand Creek Industrial Superfund Site, O.U. 1, Page 2 of 31
U.S. ENVIRONMENTAL PROTECTION AGENCYOffice of Solid Waste and Emergency ResponseTechnology Innovation Office
SITE INFORMATION (Cont.)
Treatment Application (cont.):
Treatment Vendor Estimate of Soil Quantity Treated-Mean Smear Zone Screen Length [14, 16]
SVE Area Area (ft2)
Mean SmearZone ScreenLength (ft) Volume (ft3) Volume (yd3)
1 29,300 8.1 237,330 8,790
2 30,872 17.7 546,434 20,238
3 7,238 9 65,142 2,412
Total (based on mean smear zone) 31,440
According to the vendor, the estimate based on groundwater depth (52,920 yds3) assumes that allsoil in the three SVE areas was contaminated, including the clean backfill in Area 2, while theestimate based on smear zone (31,440 yds3) is a “conservatively low estimate”. [14]
Background
Historical Activity that Contributed to Contamination at the Site: Pesticide Manufacturing,Petroleum Refinery
Corresponding SIC Code: 2879 (Pesticides and Agricultural Chemicals, NEC),2911 (Petroleum Refining)
Waste Management Practice that Contributed to Contamination: Manufacturing Process
Site History: The Sand Creek Industrial Superfund site (Sand Creek) covers approximately 550acres and is located in Commerce City, Adams County, Colorado, as shown in Figure 1. O.U. 1,which covers approximately 13 acres of the Sand Creek site, was used by Times Chemical forpesticide manufacturing and petroleum refining from 1960 to 1968. Prior to Times Chemical,the land was used by the Oriental Refinery; no additional information is provided in the availablereferences on Oriental Refinery's operations. Around 1968, Times Chemical changed its name toColorado International Company (CIC). In 1968, a fire destroyed three buildings at the CICfacility. An inspection of CIC by Tri-County District Health Department personnel in June 1974indicated unsatisfactory waste management practices and unsatisfactory worker safetyconditions. [1, 2, 14, 15]

Sand Creek Industrial Superfund Site, O.U. 1, Page 3 of 31
U.S. ENVIRONMENTAL PROTECTION AGENCYOffice of Solid Waste and Emergency ResponseTechnology Innovation Office
SITE INFORMATION (CONT.)
Background (cont.)
In March 1976, the ColoradoDepartment of Health (CDH)conducted a field inspection at CIC. The inspectors observed 55-gallondrums containing pesticides, includingparathion, stored in various locations atthe CIC facility. In addition, theyobserved washwater, storm drainage,and boiler feed water draining into acommon surface drainage that flowedoff property towards Sand Creek. Asecond fire occurred at CIC inDecember 1977, releasing parathionfumes over northeast Denver. The stateof Colorado issued an EmergencyCease and Desist Order in 1978 againstCIC to clean up the property andadjacent areas contaminated by the fire. CIC declared bankruptcy and re-opened the operations as ColoradoOrganic Chemical Company (COC). COC operations were essentially the same as CICoperations. [1]
Soil sampling at COC in early 1978 revealed elevated levels of halogenated organic compounds,such as organophosphate pesticides and thermally-altered pesticides, and volatile organiccompounds (VOCs). In 1980, COC was cited for unsafe drum storage and improper storageareas. In 1982, a consent agreement and final order were issued for RCRA violations. In March1983, EPA deferred to the Department of Justice the matter of COC's RCRA violations andviolation of the consent agreement. In June 1983, a spill of the herbicide 2,4-dichlorophenoxyacetic acid (2,4-D) resulted in an additional compliance order to clean up the spill and to complywith previous orders. EPA issued a CERCLA 106 order in March 1984 for cleanup of the site. Between April and September 1984, COC removed drummed wastes, product, and contaminatedsoil from the site and fenced the site. [1]
Initial remedial actions at the site, which were conducted primarily in 1992, involved excavationand incineration of contaminated soils, tank wastes, and pesticides. Approximately 40,000pounds of material, consisting of several drums of toxaphene and pentachlorophenol and soilcontaminated with 2,4-D, were excavated and incinerated off site. Four buildings and fourrailcars were demolished, and several storage tanks and other debris were removed from the site.[2]
Figure 1. Site Location

Sand Creek Industrial Superfund Site, O.U. 1, Page 4 of 31
U.S. ENVIRONMENTAL PROTECTION AGENCYOffice of Solid Waste and Emergency ResponseTechnology Innovation Office
SITE INFORMATION (CONT.)
Background (cont.)
Regulatory Context: In September 1989, EPA issued a Record of Decision (ROD) for O.U. 1 atthe Sand Creek site. O.U. 1 addressed contaminated soils, buildings, and tanks at the COCfacility. The ROD required excavation and off-site incineration for highly contaminated soils(greater than or equal to 1,000 mg/kg of halogenated organic compounds); soil vapor extraction(SVE) for soil contaminated with volatile organic compounds (VOCs); and demolition andtreatment of contaminated buildings and tanks in accordance with the RCRA Land DisposalRestrictions. In addition, the ROD required groundwater monitoring at the site for 30 years, andperformance of a public health evaluation once every five years following remediation. [1]
In September 1993, EPA issued an Explanation of Significant Differences (ESD) to modify the1989 ROD for O.U. 1. The ESD modified the ROD by limiting the areal extent for operation ofsoil vapor extraction technology, and by identifying additional costs for disposal of tanks fromthe facility. [2]
In July 1994, EPA issued a ROD for Operable Unit No. 4 (O.U. 4) at the Sand Creek site. O.U. 4involved remediation of a light non-aqueous phase liquid (LNAPL) plume at the site using acombination SVE and dual vapor extraction (DVE) process (SVE/DVE). This treatment wasselected because the SVE system was already in place at the site. [12] The application of O.U. 4is not discussed further in this report.
Remedy Selection: Soil vapor extraction was selected as the remedy for treatment of VOC-contaminated soil in O.U. 1. According to the treatment vendor, the generally permeable natureof the soil matrix indicated that the volatile fractions at Sand Creek, containing the more toxiccompounds, could be readily removed with SVE. [14] In 1990, EPA conducted a treatabilitystudy to determine if the technology could adequately extract VOCs from O.U. 1 soils and todetermine the radius of influence for SVE wells at the site. The study showed that SVE was afeasible remedial technology for the site and that a radius of influence of 60 feet could beachieved at the site. [2,4]

Sand Creek Industrial Superfund Site, O.U. 1, Page 5 of 31
U.S. ENVIRONMENTAL PROTECTION AGENCYOffice of Solid Waste and Emergency ResponseTechnology Innovation Office
SITE INFORMATION (CONT.)
Site Logistics/Contacts
Site Management: Federal Lead/Fund FinancedOversight: EPA
Remedial Project Manager: ARCs Contractor:
Ms. Erna Waterman, 8 EPR-SR John ChinnockU.S. Environmental Protection Agency URS Consultants, Inc.Region VIII 1099 18th Street, Suite 700999 18th Street, Suite 500 Denver, Colorado 80202-1907Denver, Colorado 80202-2466 (303) 296-9700(303) 312-6762(303) 312-6897 (fax)
Remedial Design/Construction/Operation Subcontractor (Treatment Vendor):
Christopher StrzempkaProject Technical Manager for OU-1OHM Remediation Services Corp.16406 U.S. Route 224 EastFindlay, OH 45840(800) 537-9540

Sand Creek Industrial Superfund Site, O.U. 1, Page 6 of 31
U.S. ENVIRONMENTAL PROTECTION AGENCYOffice of Solid Waste and Emergency ResponseTechnology Innovation Office
MATRIX DESCRIPTION
Matrix Identification
Type of Matrix Processed Through the Treatment System: Soil (in situ)
Contaminant Characterization
Primary Contaminant Groups: Volatiles - Halogenated: chloroform, methylene chloride,tetrachloroethene, and trichloroethene; Volatiles - Nonhalogenated: TPH.
EPA conducted a Remedial Investigation (RI) at the site from 1984 to 1988. [3] Soils identifiedas contaminated with pesticides (e.g., 2,4-D) were excavated and hauled off site for incineration.Additional soil contamination at the site was identified by the vendor as consisting of mixedpetroleum and halogenated hydrocarbons, with some of the hydrocarbons classified assemivolatile or non-volatile, including hydrocarbons of aromatic range and heavier hydrocarbonsto C-24. [11, 14]
Three subareas of contaminated soil were identified during the RI, labelled Subareas 1, 2, and 3. The maximum concentrations of VOCs in the soil identified by the RI are shown in Table 1. Based on these data, the prime contractor estimated the total mass of chloroform, methylenechloride, TCE, and PCE in the soil as 684 pounds. [4]
Table 1. Maximum Concentrations of Halogenated VOCs in Soil as Identified by RI [2]
Contaminant Maximum Concentration (mg/kg)
Chloroform 0.820
Methylene Chloride 5.8
Trichloroethene (TCE) 0.087
Tetrachloroethene (PCE) 9.34
In addition to the VOC contamination in the soil, a light non-aqueous phase liquid (LNAPL)plume was identified floating on the groundwater at the COC facility. LNAPL plume thicknesswas measured at the COC facility in October 1990, April 1991, November 1991, and September1992. Table 2 shows the LNAPL Plume Thickness in five wells at the COC facility at thosetimes. As shown in Table 2, LNAPL thickness ranged from 1.69 to 4.72 feet in the five wellsand averaged from 2.29 to 3.69 feet over the 2-year sampling period. [5]
Figure 2 shows the relative locations of the three contaminated soil areas and LNAPL plume atthe Sand Creek site.

Sand Creek Industrial Superfund Site, O.U. 1, Page 7 of 31
U.S. ENVIRONMENTAL PROTECTION AGENCYOffice of Solid Waste and Emergency ResponseTechnology Innovation Office
MATRIX DESCRIPTION (CONT.)
Contaminant Characterization (cont.)
Table 2. LNAPL Plume Thickness [5]
Measured LNAPL Thickness (ft)
Well 10/90 04/91 11/91 09/92
URS-3 4.31 2.25 3.49 2.48
URS-4 3.10 2.43 3.60 3.82
URS-5 3.95 2.26 4.45 4.72
URS-6 3.18 2.43 3.34 1.69
URS-14 2.07 2.07 3.58 3.01
Average 3.32 2.29 3.69 3.14
Figure 2. Locations of Contaminated Soil Areas and LNAPL Plume [11]

Sand Creek Industrial Superfund Site, O.U. 1, Page 8 of 31
U.S. ENVIRONMENTAL PROTECTION AGENCYOffice of Solid Waste and Emergency ResponseTechnology Innovation Office
MATRIX DESCRIPTION (CONT.)
Matrix Characteristics Affecting Treatment Cost or Performance
The major matrix characteristics affecting cost or performance for this technology and the valuesmeasured for each are shown in Table 3.
Table 3. Matrix Characteristics [3, 4, 12, 14]
Parameter Value Measurement Method
Soil Classification Sandy loams, loamy sands USDA Soil ConservationService
Clay Content and/or Particle Size Distribution Larger than 1/4" 0.34 - 3.66%Granules (10 mesh to 1/4") 3.98 - 8.35%Medium to very coarse sand (60 to 10 mesh) 35.48 - 40.38%Very fine to fine sand (200 to 60 mesh) 30.01 - 34.99%Silt and clay (less than 200 mesh) 19.99 - 24.71%
U.S. Standard Sieves
Moisture Content 3.0 - 30.1% Measured values in 13observations during wellinstallation
Air Permeability Not measured* -
Porosity Not measured** N/A
Total Organic Carbon Not measured*** N/A
Nonaqueous Phase Liquids LNAPL layer present Measured on site
*Although air permeability testing was not conducted, the vendor reported the following: (1) the soils were predominantly sandy, and well screens of 5-ft lengths in the vadose zone were producing extraction flows in excess of 100 SCFM at relatively low vacuums; (2) using a simple steady-state facial flow equation for compressible flow described by Johnson et al (1990), air permeabilities in excess of 2 x 10⁻⁷ cm2 (20 darcies) could be expected; and (3) moisture content in the capillary fringe and saturated zones was the chief impediment to flow. **Porosity measurements were not made during the project. Some interbedded silts and clays were found at O.U. 1, but soils were predominantly sandy with estimated air-filled porosity in the vadose zones of 30 percent. [14]***TOC analyses of soils were not made. The bulk of the soils were predominantly sands and silts characterized normally by low TOC. [14]N/A - Measurement method not reported for this parameter because resulting value not expected to vary among measurement procedures.

Sand Creek Industrial Superfund Site, O.U. 1, Page 9 of 31
U.S. ENVIRONMENTAL PROTECTION AGENCYOffice of Solid Waste and Emergency ResponseTechnology Innovation Office
MATRIX DESCRIPTION (CONT.)
Site Geology/Stratigraphy
The RI indicated that the site is underlain by alluvial deposits consisting of high-permeabilitysands and gravels, interbedded with low-permeability clayey and silty layers. Two groundwaterunits underlie the site, separated by a relatively impermeable layer 10 to 20 feet thick. The upperdeposit is up to 40 feet thick and is primarily unsaturated (i.e., contains little to no groundwater).The lower deposit is up to 44 feet thick and generally exists under confined conditions. [1] Asimplified schematic of the alluvial groundwater system at the Sand Creek site is shown inFigure 3.
Figure 3. Simplified Schematic of Alluvial Groundwater System at the Sand Creek Site[3]

Sand Creek Industrial Superfund Site, O.U. 1, Page 10 of 31
U.S. ENVIRONMENTAL PROTECTION AGENCYOffice of Solid Waste and Emergency ResponseTechnology Innovation Office
TREATMENT SYSTEM DESCRIPTION
Primary Treatment Technology Type: Soil Vapor Extraction
Supplemental Treatment Technology Type: Catalytic oxidization
Soil Vapor Extraction System Description and Operation
System Description [4, 8, 10, 12, 14]
The soil vapor extraction system used at Sand Creek consisted of 31 vertical wells and 1horizontal well, and was thermally-enhanced by fluid injection with vacuum extraction (referredto as the FIVE system). The wells were grouped into three subareas at the site: SVE-1, SVE-2,and SVE-3. Thirteen vertical wells and the horizontal well were located in SVE-1 (wells 101through 113 and H12). SVE-2 contained 12 wells (wells 201 through 212) and SVE-3 contained6 wells (wells 301 through 306). The location of these wells at the site is shown in Figure 4. Asshown on Figure 4, well H12 is a horizontal well, and all other wells are vertical. For several ofthe wells in each subarea, operation of the wells was alternated between vacuum extraction andair injection during the course of remediation.
In their bid for the project, the vendor stated that both horizontal and vertical wells would beincluded in the system, with "preference" given to horizontal wells because the vendor believedsuch wells would increase the radius of influence. However, only one horizontal well wasincluded in the SVE system at Sand Creek. During installation of the initial horizontal well atSand Creek, the vendor discovered buried concrete blocks and other construction debris in thesubsurface. This created problems of increased friction during installation of the prepackagedwell screens resulting in delays. Therefore, after installation of the one horizontal well, thevendor decided to replace the remaining planned horizontal wells with multiple vertical wells.
Figure 4. SVE Well Pattern [8]

Sand Creek Industrial Superfund Site, O.U. 1, Page 11 of 31
U.S. ENVIRONMENTAL PROTECTION AGENCYOffice of Solid Waste and Emergency ResponseTechnology Innovation Office
TREATMENT SYSTEM DESCRIPTION (CONT.)
Soil Vapor Extraction System Description and Operation (cont.)
The screened intervals and depths for the wells at Sand Creek are as follows [14]:
SVE System Well No. Screened Interval(ft. bgs)
Total Depth (ft. bgs)
1 SVE-101 4.5 - 11.5 11.5SVE-102 6.5 - 11.5 11.5SVE-103 4.0 - 11.5 11.5SVE-104 4.0 - 11.5 11.5SVE-105 4.0 - 11.5 11.5SVE-106 3.0 - 10.5 10.5SVE-107 5.5 - 13.0 13.0SVE-108 5.0 - 12.5 12.5SVE-109 5.0 - 12.5 12.5SVE-110 5.0 - 12.5 12.5SVE-111 5.0 - 12.5 12.5SVE-112 5.0 - 12.5 12.5SVE-113 4.0 - 11.5 11.5
H12 10 102 SVE-201 8.0 - 15.5 15.5
SVE-202 8.0 - 20.5 20.5SVE-203 7.5 - 17.5 17.5SVE-204 11.5 - 21.5 21.5SVE-205 10.5 - 20.5 20.5SVE-206 10.5 - 20.5 20.5SVE-207 9.5 - 24.5 24.5SVE-208 8.0 - 25.5 25.5SVE-209 10.0 - 22.5 22.5SVE-210 15.0 - 30.0 30.0SVE-211 13.0 - 30.5 30.5SVE-212 14.0 - 32.5 32.5
3 SVE-301 11.0 - 28.5 28.5SVE-302 9.5 - 27.5 27.5SVE-303 13.5 - 26.0 26.0SVE-304 10.5 - 23.0 23.0SVE-305 10.5 - 23.0 23.0SVE-306 9.0 - 24.0 24.0

Sand Creek Industrial Superfund Site, O.U. 1, Page 12 of 31
U.S. ENVIRONMENTAL PROTECTION AGENCYOffice of Solid Waste and Emergency ResponseTechnology Innovation Office
TREATMENT SYSTEM DESCRIPTION (CONT.)
Soil Vapor Extraction System Description and Operation (cont.)
Figure 5 shows a schematic of the SVE system. As shown in Figure 5, three 1,500 ACFMpositive displacement blowers were used to create a vacuum, with two of the three blowersoperated at one time. Extracted water was separated from the vapors using an air/waterseparator. Following separation, extracted vapors were diluted with ambient air (between 12%and 50% by volume) and treated using a catalytic oxidizer. The emissions from the catalyticoxidizer were either re-injected into the soil through the vertical and horizontal wells, or releasedto the atmosphere. The system included two blowers for air injection, operated one at a time. The vendor reported that the FIVE system is described in the following reference: Kirk, J.L. andJ.R. Ohneck, "A Portable Method for Decontaminating Earth," U.S. Patent No. 4,435,492, U.S.Patent and Trademark Office, Washington, D.C., March 6, 1984.
Figure 5. SVE System Schematic [based on 8, 10]

Sand Creek Industrial Superfund Site, O.U. 1, Page 13 of 31
U.S. ENVIRONMENTAL PROTECTION AGENCYOffice of Solid Waste and Emergency ResponseTechnology Innovation Office
TREATMENT SYSTEM DESCRIPTION (CONT.)
Soil Vapor Extraction System Description and Operation (cont.)
Operation [8, 12, 14]
The SVE system was operated for two periods - September to December 1993, and January toApril 1994. SVE system start-up activities began on September 24, 1993 and the system becamefully operational by October 12, 1993.
Start-up activities focused on well development (initial purging activities), which took place 24hours a day. Well development was limited to 2 to 3 wells per day to balance the relatively highconcentrations of VOCs in the vapors extracted during development and the capacity of thecatalytic oxidizer.
Extraction quantities varied during the remediation based on the capacity of the catalyticoxidation (CATOX) unit (extracted vapors had to be maintained at less than 25% of the lowerexplosive limit (LEL) of vapors in air). Early in the remedial action, the concentration of VOCsin the extracted vapors was high and few wells could be used for extraction because of "over-heating" of the CATOX unit. Later on, the concentration of VOCs in the extracted vapors wasless, and all wells in the system could be used in extraction mode.
Treated vapors were intermittently injected into the soil. In October 1993, approximately 25% ofthe extracted and treated vapors (i.e., after CATOX) were re-injected into Subareas 2 and 3. InNovember 1993, approximately 15% of the extracted and treated vapors were re-injected into allthree subareas. During December 1993, vapors were re-injected into Subarea 1 for nine days. Treated vapors were released directly to the atmosphere during January through April 1994.
The treatment vendor described their general approach to determining injection quantities asfollows: (1) at the start of a remediation (when highly concentrated vapors are being extracted),injection must be limited to prevent fugitive emissions from the ground surface or uncontrolledmigration of vapor plumes; (2) later on in the remediation, additional injection wells could bebrought into service to thermally enhance volatilization, reduce contaminant liquid viscosity, andimprove flushing efficiency between adjacent injection and extraction wells; and (3) towards theend of a remediation (when VOC contaminant concentrations are lowest, and are least amenableto further extraction), lower injection flows (and corresponding lower extraction volumes) wouldlead to conditions conducive to biodegradation (e.g., oxygen enhancement, elevated temperature,adequate moisture). At Sand Creek, it appears that the vendor used limited injection throughoutthe remediation (25% in Month 1, 15% in Month 2, limited in Month 3, and none in Months 4-7).No data were provided in the available references on any potential fugitive emissions oruncontrolled migration at Sand Creek, or on how much the use of injection improved treatmentsystem performance through thermally-enhanced volatilization, reduced contaminant liquidviscosity, improved flushing efficiency, or biodegradation.
Sand Creek Industrial Superfund Site, O.U. 1, Page 14 of 31
U.S. ENVIRONMENTAL PROTECTION AGENCYOffice of Solid Waste and Emergency ResponseTechnology Innovation Office
TREATMENT SYSTEM DESCRIPTION (CONT.)
Soil Vapor Extraction System Description and Operation (cont.)
System operation generally took place without equipment failure or shutdown. However, inMarch 1994, the system was automatically shut down twice. On March 1, a shutdown occurredbecause the high temperature set point was exceeded on the catalytic oxidizer. The system wasrestarted after about 5 hours. On March 8, the system shut down a second time because of flamefailure. The system was restarted one-half hour later.
Groundwater Removal and Disposition [8, 12, 14]
From October 1993 through April 1994, the extraction wells removed entrained groundwaterfrom the subsurface, however, no provisions were made for a water treatment system. The waterwas temporarily stored on site in a storage tank until disposal at an approved facility. OnFebruary 21, 1994, approximately 3,750 gallons of entrained water were disposed at Enviroserve,Inc. Between February 21, 1994 and April 27, 1994, approximately 1,700 gallons of entrainedwater were collected. No additional information was provided on the disposition of watercollected between February and April 1994.
The water extraction rate varied with rainfall, and the presence of perched water and fluctuatingwater tables. The extraction rate of entrained groundwater from October 1993 to February 1994was estimated as 10 gallons per day. During March 1994, the rate of entrained groundwaterextraction increased to approximately 30 gallons per day, possibly due to a spring snow melt. InApril, the rate dropped to about 25 gallons per day.
System Shutdown [8, 12]
The soil vapor extraction system was temporarily shut down on April 19, 1994 for soilconfirmation sampling and to assess cleanup of the site. Based on these results (presented undertreatment performance data), no additional operation of the SVE system was needed and thesystem was permanently shut down by April 27.
The treatment performance data shown later in this report indicate that cleanup criteria were metin November 1993, however, according to the RPM, system operation was continued until April1994 because of the structure of the contract and information about non-target VOC removalquantities. According to the RPM, system operation was performed under a fixed-price contract,where the only benefit to an earlier shutdown would be for oversight costs paid to the primecontractor. These oversight costs were less than the estimated costs for demobilization and apossible subsequent remobilization (for example, if vapor headspace concentrations hadincreased after a shutdown period), and the RPM determined that shutdown in November 1993would not be "cost efficient." In addition, during the November 1993-April 1994 operatingperiod, the RPM reported that "significant" quantities of non-target VOCs were being removedby the SVE system.

Sand Creek Industrial Superfund Site, O.U. 1, Page 15 of 31
U.S. ENVIRONMENTAL PROTECTION AGENCYOffice of Solid Waste and Emergency ResponseTechnology Innovation Office
TREATMENT SYSTEM DESCRIPTION (CONT.)
Soil Vapor Extraction System Description and Operation (cont.)
On June 22 and June 23, 1994, the extraction wells were abandoned in place. They were groutedwith a 9 to 1 ratio of cement/bentonite. The vacuum extraction/injection blowers, catalyticoxidizer, LEL monitoring control system, and decontamination trailer were reconditioned andreconfigured to be used in remediation of O.U. 4 at the Sand Creek site.
Operating Parameters Affecting Treatment Cost or Performance
The major operating parameters affecting cost or performance for this technology and the valuesmeasured for each are shown in Table 4.
Table 4. Operating Parameters [8]
ParameterSeptember to
December 1993 January to April 1994 Measurement MethodAir Flow Rate 2,681 scfm 2,910 scfm N/AOperating Pressure/Vacuum 22-24 inches of water
column13.4 to 23.8 inches of
water columnN/A
Air Injection Rate 605 scfm under 12inches of watercolumn pressure
483 scfm under 18.3inches of water column
pressure
N/A
N/A - Measurement method not reported for this parameter because resulting value not expected to vary among measurement procedures.
Timeline
A timeline for this application is shown in Table 5.
Table 5. Timeline [4, 8, 14]Start Date End Date Activity
1982 - Sand Creek site placed on NPL1984 1988 Site-wide Remedial Investigation conducted
September 29, 1989 - ROD signed for O.U. 1September 8, 1993 - ESD signed for O.U. 1September 24, 1993 October 12, 1993 System started up and wells developed
September 1993 December 1993 First period of operationsDecember 22, 1993 January 5, 1994 System temporarily shutdown for the holiday season
January 1994 April 1994 Second period operationsApril 19, 1994 April 27, 1994 System shut down for confirmation soil boringApril 27, 1994 - Shutdown of SVE systemJune 22, 1994 June 23, 1994 Extraction wells abandoned in place
December 20, 1996 - Sand Creek site removed from NPL (61 FR 67233)

Sand Creek Industrial Superfund Site, O.U. 1, Page 16 of 31
U.S. ENVIRONMENTAL PROTECTION AGENCYOffice of Solid Waste and Emergency ResponseTechnology Innovation Office
TREATMENT SYSTEM PERFORMANCE
Cleanup Goals/Standards
The ROD for O.U. 1 specified soil cleanup goals for four VOCs, as shown in Table 6.
Table 6. Soil Cleanup Goals for VOCs at O.U. 1 [1]
Compound Cleanup Goals (mg/kg)
Chloroform 0.165
Methylene Chloride 0.075
Trichloroethene (TCE) 0.285
Tetrachloroethene (PCE) 1.095
An air emissions operating permit was not obtained for this application, however, air emissionswere regulated under an Air Pollution Emission Notice (APEN) effective December 30, 1992,issued by the Colorado Department of Health under Regulation No. 3. The notice requiredreporting of air emission quantities, but did not limit the emissions. [14]
Addition Information on Goals
The soil cleanup goals for VOCs were developed based on the results of a risk assessment for thesite. The risk assessment identified a groundwater ingestion pathway as the most significantroute for exposure to VOCs, based on a review of the relatively low partitioning coefficients forthe specific contaminants. The cleanup goals were calculated based on this pathway and using a10-6 risk level. [1]
Treatment Performance Data
Treatment performance data for the SVE application at O.U. 1 consists of confirmation soilborings, equilibrium headspace sampling, mass extraction data, and catalytic oxidizer destructionefficiency data.
Confirmation Soil Borings [8]
On April 19, 1994, OHM began confirmation soil boring. Thirty-two confirmation soil boringswere performed in O.U. 1. Sixteen soil borings were performed in SVE-1, 11 borings wereperformed in SVE-2, and 5 borings were performed in SVE-3. Confirmation soil borings wereperformed using a CME-55 truck mounted drilling rig with 7-inch, outside diameter, hollow-stemaugers. Soil samples were collected using a series of 2-inch outside diameter by 2-foot longCalifornia Split Spoon Samplers in accordance with ASTM Method D-1586.

Sand Creek Industrial Superfund Site, O.U. 1, Page 17 of 31
U.S. ENVIRONMENTAL PROTECTION AGENCYOffice of Solid Waste and Emergency ResponseTechnology Innovation Office
TREATMENT SYSTEM PERFORMANCE (CONT.)
Treatment Performance Data (cont.)
Following decontamination of the split spoon samplers, four 6-inch brass sleeves were placedinto the sampler.
Once the sampler was retrieved from the boring, the split barrel was opened and the brass sleevesremoved. Teflon sheeting was placed over each end of each 6-inch brass sleeve and capped withTeflon caps. For each split spoon sampler retrieved, four soil samples were generated, one forlithology characterization using the Unified Soil Classification System (USCS, ASTM MethodD-2488), one for backup, one for on-site analytical screening, and one for off-site laboratoryanalysis. In addition, QA/QC samples were collected during the field sampling event. Thesesamples included trip blanks, field blanks, and equipment rinse water.
Field analyses of the soil boring samples were performed according to Method 8010B, publishedin SW-846, "Test Methods for Evaluating Solid Waste," and using a Hewlett Packard Series IIGas Chromatograph (GC), configured with a Tekmar ALS 2016 Purge and a Tekmar LSC 2000Trap for sample introduction. An OI Corp. 5220 Electrolytic Conductivity Detector (ECD) wasused for quantitation of the target compounds.
Off-site laboratory analyses were performed by Great Lakes Analytical Laboratory in BuffaloGrove, Illinois. Trip blanks and equipment blanks also were analyzed by Great Lakes AnalyticalLaboratory.
Table 7 shows the results from the off-site laboratory analyses for the four target constituents inthe confirmation soil borings. Only those borings where at least one constituent was measured ata detectable concentration are shown on Table 7. Samples for off-site analysis were collectedbetween April 19 and May 2, 1994.
Equilibrium Headspace Sampling [8]
Equilibrium headspace sampling was performed in September, November, and December 1993,and in March 1994. Prior to sampling, the SVE system was shut down by closing the valves inthe system, including 10-inch headers located in the equipment pad area, 4-inch well head valves,and extraction/injection manifold 4-inch valves. The SVE system was shut down for a minimumof 48 hours to allow sufficient time for the vapors in the wells to reach a state of equilibrium. After equilibration, the SVE system was re-started and operated 5 to 10 minutes, and well head(static vapor) samples were collected.

Sand Creek Industrial Superfund Site, O.U. 1, Page 18 of 31
U.S. ENVIRONMENTAL PROTECTION AGENCYOffice of Solid Waste and Emergency ResponseTechnology Innovation Office
TREATMENT SYSTEM PERFORMANCE (CONT.)
Treatment Performance Data (cont.)
Table 7. Analytical Results from Off-Site Laboratoryfor Confirmation Soil Borings* [11]
Soil BoringDepth(ft bgs)
Chloroform(mg/kg)
MethyleneChloride(mg/kg)
Trichloroethene(mg/kg)
Tetrachloroethene(mg/kg)
Cleanup Goal - 0.165 0.075 0.285 1.095
CB-1 5-7 ND ND ND 0.200
CB-1 10-12 ND ND ND 0.005
CB-2 3-5 ND ND ND 0.032
CB-12 11-13 ND ND ND 0.280
CB-17 7-9 0.0078 ND ND ND
CB-18 15-17 0.0069 ND ND ND
CB-18 17-19 0.0099 ND 0.10 ND
CB-19 7-9 ND ND ND 0.0063
CB-19 9-11 ND ND ND 0.0059
CB-21 19.5-20 0.0071 ND ND 0.066
ND - Not detected (detection limits not provided).*Off-site laboratory analyses were performed for 61 samples (i.e., soil borings at specific depths). Only those 10 samples where at least one constituent was measured at a detectable concentration are shown on this table. All other samples were reported as ND for all four target constituents.
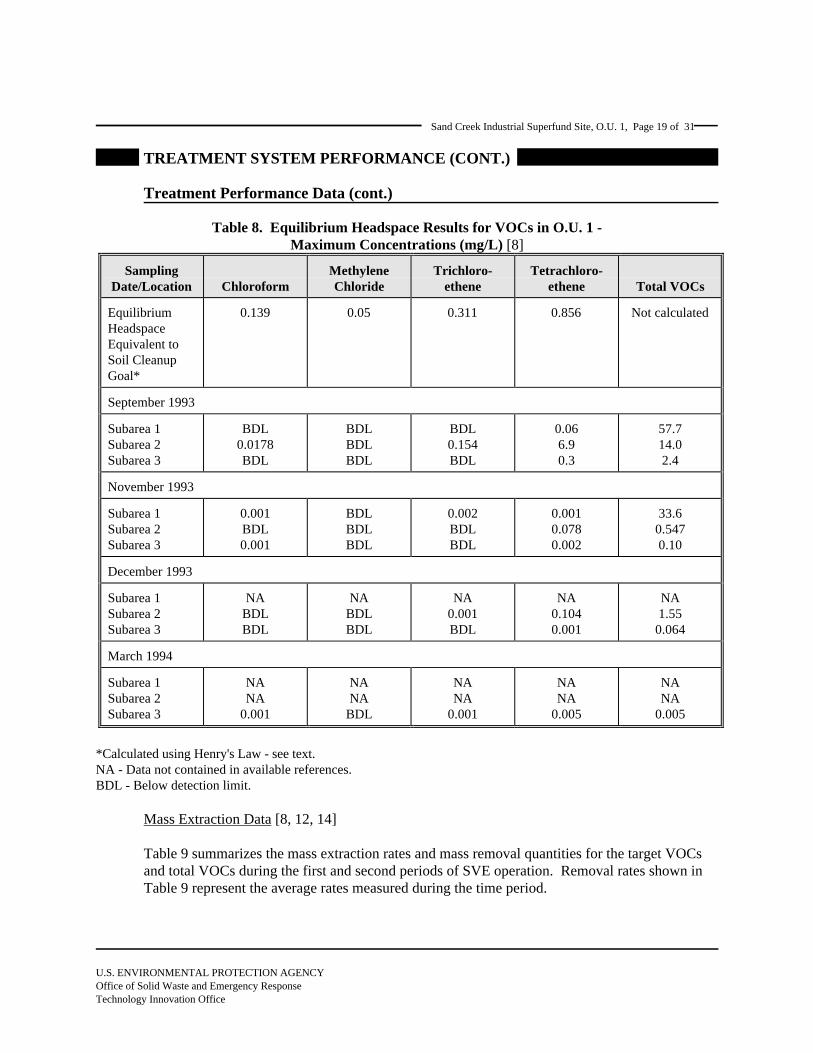
Table 8 summarizes the results from equilibrium headspace sampling in Subareas 1, 2, and 3during September, November, and December 1993, and March 1994. As shown in Table 8, anequilibrium headspace equivalent to the soil cleanup goals was identified for the four VOC targetcontaminants. This value was calculated using Henry's Law Constant as an indicator of therelationship between headspace soil vapor concentrations and soil concentrations. Headspaceequivalent values were calculated with values taken from the technical literature, and fieldsampling to validate Henry's Constant, porosity, moisture content, temperature, or partitioncoefficients used to compute headspace equivalent was not conducted.
Sand Creek Industrial Superfund Site, O.U. 1, Page 19 of 31
U.S. ENVIRONMENTAL PROTECTION AGENCYOffice of Solid Waste and Emergency ResponseTechnology Innovation Office
TREATMENT SYSTEM PERFORMANCE (CONT.)
Treatment Performance Data (cont.)
Table 8. Equilibrium Headspace Results for VOCs in O.U. 1 -Maximum Concentrations (mg/L) [8]
SamplingDate/Location Chloroform
MethyleneChloride
Trichloro-ethene
Tetrachloro-ethene Total VOCs
EquilibriumHeadspaceEquivalent toSoil CleanupGoal*
0.139 0.05 0.311 0.856 Not calculated
September 1993
Subarea 1Subarea 2Subarea 3
BDL0.0178BDL
BDLBDLBDL
BDL0.154BDL
0.066.90.3
57.714.02.4
November 1993
Subarea 1Subarea 2Subarea 3
0.001BDL0.001
BDLBDLBDL
0.002BDLBDL
0.0010.0780.002
33.60.5470.10
December 1993
Subarea 1Subarea 2Subarea 3
NABDLBDL
NABDLBDL
NA0.001BDL
NA0.1040.001
NA1.550.064
March 1994
Subarea 1Subarea 2Subarea 3
NANA
0.001
NANABDL
NANA
0.001
NANA
0.005
NANA
0.005
*Calculated using Henry's Law - see text.NA - Data not contained in available references.BDL - Below detection limit.
Mass Extraction Data [8, 12, 14]
Table 9 summarizes the mass extraction rates and mass removal quantities for the target VOCsand total VOCs during the first and second periods of SVE operation. Removal rates shown inTable 9 represent the average rates measured during the time period.

Sand Creek Industrial Superfund Site, O.U. 1, Page 20 of 31
U.S. ENVIRONMENTAL PROTECTION AGENCYOffice of Solid Waste and Emergency ResponseTechnology Innovation Office
TREATMENT SYSTEM PERFORMANCE (CONT.)
Treatment Performance Data (cont.)
Table 9. Mass Extraction Rates and Mass Removal Quantities forSVE System Operation [8]
Parameter September to December 1993 January to April 1994
Average Removal Rate for TargetCompounds (lbs/day)
33.86 3.15
Average Removal Rate for TotalVOCs (lbs/day)
1,482.6 482.4
Mass Extracted for TargetCompounds (lbs)
2,899.7 349.6
Mass Extracted for Total VOCs(lbs)
122,456.6 53,547
NOTE: Total VOCs were analyzed using a modified EPA Method 8015. Non-halogenated VOCs, including thevolatile portions of any semivolatiles present were measured, with gasoline range hydrocarbons prevalent inthe chromatographs. Average mass extraction rates of contaminants were computed by multiplying themean concentration by the mean volumetric flow rate between successive sampling episodes and convertingto a daily rate (lb/day).
Table 10 shows the cumulative mass of target compounds and total VOCs extracted from thethree subareas, released to the atmosphere through stack emissions, and re-injected into the soil. Data in Table 10 represent the cumulative mass over the entire period of system operation, fromSeptember 24, 1993 to April 27, 1994.
Total VOCs were analyzed using a modified EPA Method 8015. Non-halogenated VOCs,including the volatile portions of any semivolatiles present were measured, with gasoline rangehydrocarbons prevalent in the chromatographs. Average mass extraction rates of contaminantswere computed by multiplying the mean concentration by the mean volumetric flow rate betweensuccessive sampling episodes and converting to a daily rate (lb/day).
Catalytic Oxidizer Destruction Efficiency Data
The destruction efficiencies for the catalytic oxidizer are shown in Table 11, by operating period.Average destruction efficiencies are shown for target compounds and total VOCs. Destructionefficiency was calculated as follows [14]:

Sand Creek Industrial Superfund Site, O.U. 1, Page 21 of 31
U.S. ENVIRONMENTAL PROTECTION AGENCYOffice of Solid Waste and Emergency ResponseTechnology Innovation Office
TREATMENT SYSTEM PERFORMANCE (CONT.)
Treatment Performance Data (cont.)
Table 10. Cumulative Mass of Contaminants Extracted, Released to the Atmosphere,and Re-injected - September 24, 1993 through April 27, 1994 (lbs) [8]
Target Compounds
MethyleneChloride
Chloroform Trichloro-ethene
Tetrachloro-ethene
Total TargetCompounds*
TotalVOCs*
Extraction
Subarea 1 0.0 0.0 0.0 5.2 5.2 69,096.7
Subarea 2 0.0 0.40 35.2 3,130.7 3,166.3 106,232.6
Subarea 3 0.0 13.4 0.0 69.8 83.2 1,175.2
Total 0.0 13.8 35.2 3,205.7 3,254.7 176,504.5
Release to Atmosphere
Stack Emission 0.0 0.0 0.0 209.6 209.6 6,210.3
Injection
Total 0.0 0.0 0.0 0.74 0.74 638.9
*Totals reflect rounding.
Table 11. Catalytic Oxidizer [8]
Parameter September to December 1993 January to April 1994
Target Compounds DestructionEfficiencies (%)
92.9 99.1
Total VOCs DestructionEfficiencies (%)
95.5 98.8
Destruction Removal Efficiency = [1 - [(Minj + Ms)/Mext]] x 100%
where: Minj = Mass of contaminant injected to the subsurface (lb/day)Ms = Mass of contaminant emitted from the stack (lb/day)Mext = Mass of contaminant extracted from the subsurface (lb/day)

Sand Creek Industrial Superfund Site, O.U. 1, Page 22 of 31
U.S. ENVIRONMENTAL PROTECTION AGENCYOffice of Solid Waste and Emergency ResponseTechnology Innovation Office
TREATMENT SYSTEM PERFORMANCE (CONT.)
Performance Data Assessment
The treatment performance data shown in Table 7 indicate that the SVE system used at SandCreek met the soil cleanup goals for VOCs within 6 months of operation. Soil concentrationswere reduced from as high as 9.34 mg/kg (the maximum concentration shown in the RI fortetrachloroethene) to less than the cleanup goals. The maximum concentration of targetconstituents measured by the off-site laboratory for the confirmation soil borings was: chloroform - 0.0099 mg/kg; methylene chloride - not detected; trichloroethene - 0.10 mg/kg; andtetrachloroethene - 0.28 mg/kg. In addition, as discussed in Table 7, less than 20% of the soilboring samples (i.e., soil borings at specific depths) contained at least one target constituentmeasured at a detectable concentration.
Equilibrium headspace results shown in Table 8 indicate a reduction in contaminant levels overthe course of the remediation. For example, these data show a reduction for tetrachloroethenefrom 6.9 mg/L in September 1993 (Subarea 2) to 0.104 mg/L in December 1993 (Subarea 2), andfrom 0.3 mg/L in September 1993 (Subarea 3) to 0.005 in March 1994 (Subarea 3). Theheadspace results also provide an indication of the variations in contaminant levels betweensubareas. For example, these data show a relatively higher level of contamination in Subarea 2than in Subareas 1 or 3. The relatively higher concentrations in Subarea 2 are further supportedby the cumulative mass extraction data shown in Table 10. For example, Table 10 shows that3,166.3 lbs of the 3,254.7 lbs (97.3%) of target compounds were extracted from Subarea 2.
Mass extraction rate and mass removal quantity data provided in Table 9 also show a reductionin contaminant quantities over the course of the remediation. For example, the average removalrate for target compounds was reduced ten-fold from the first to second periods, from 33.86 to3.15 lbs/day.
As shown in Table 10, approximately 3,250 lbs of the four target VOC compounds and 176,500lbs of total VOCs were extracted from the three subareas at O.U. 1. Tetrachloroethene accountedfor approximately 98.5% of the mass of target compounds extracted from the subareas. Table 10also shows that during the 6 months of SVE operation, approximately 6,200 lbs of total VOCswere released to the atmosphere, including approximately 209.6 lbs of tetrachloroethene. Anestimated 0.74 lbs of tetrachloroethene were re-injected into the soil.
As shown in Table 11, the average destruction efficiencies for the catalytic oxidizer ranged from92.9 to 99.1% during the 7 months of SVE system operation. Treatment performance data arenot provided in the available references to compare actual air emissions with regulatory levels.

Sand Creek Industrial Superfund Site, O.U. 1, Page 23 of 31
U.S. ENVIRONMENTAL PROTECTION AGENCYOffice of Solid Waste and Emergency ResponseTechnology Innovation Office
TREATMENT SYSTEM PERFORMANCE (CONT.)
Performance Data Completeness
Analytical data are available for the following: 1) the maximum concentrations of contaminantsin the soil prior to treatment, as reported in the RI; 2) the range of operating conditions of theSVE system during treatment; 3) analytical data for soil boring confirmation samples; 4) thereduction in equilibrium headspace concentrations over the course of the remediation; and 5)other process parameters, such as rate and mass of extracted VOCs, release of VOCs to theatmosphere, and destruction efficiency of the catalytic oxidizer.
No data are available to characterize the actual soil concentrations in 1993, at the time just priorto treatment system operation. Data are available from the mid-1980s for VOCs in the soil whenthe RI was performed.
Performance Data Quality
The treatment vendor performed quality assurance/quality control (QA/QC) procedures as part ofthis application, including use of standard EPA analytical methods, analysis of duplicatesamples, trip blanks, and equipment blanks. No deviations to the QA/QC protocols were notedby the vendor. [8]
Soil samples from confirmation soil borings were processed in accordance with the URS-approved Chemical Quality Management/Sampling Plan, Soil Vapor Extraction RemedialAction, Sand Creek Industrial Superfund Site, OU-1 Commerce City, Colorado," dated October20, 1993, and "Subcontractor Quality Control Plan, OHM Remediation Services Corp.," June 17,1993. The QA/QC results are contained in OHM's "Cleanup Demonstration Results for SubareaSVE-1, SVE-2 and SVE-3," (Appendix C), dated March 17, 1995. [14]

Sand Creek Industrial Superfund Site, O.U. 1, Page 24 of 31
U.S. ENVIRONMENTAL PROTECTION AGENCYOffice of Solid Waste and Emergency ResponseTechnology Innovation Office
TREATMENT SYSTEM COST
Procurement Process
The SVE application at Sand Creek O.U. 1 was procured by EPA Region 8 through an ARCscontract with URS Consultants, Inc. (URS). URS prepared detailed bidding and subcontractrequirements for the SVE application, including a description of the work, summary of siteconditions, and startup, testing, and operating requirements. URS selected OHM RemediationServices Corp. (OHM) under a fixed price subcontract to design, construct, and operate the SVEsystem in accordance with a URS performance specification. [4, 8, 14] According to the RPM,the remediation was competitively bid, with four bidders. Selection was based on technicalcriteria and cost, including use of a best and final offer (BAFO) approach. [12]
During the procurement period, EPA revised the air emissions control equipment from activatedcarbon to catalytic oxidation because of the relatively large quantity of non-target VOCs in thesoil (approximately 98% of the total VOCs removed). The ARCs contractor estimated thatcarbon disposal costs would have exceeded the cost for catalytic oxidation by approximately$600,000 to $750,000. [11] The treatment vendor indicated that savings from use of catalyticoxidation rather than carbon with off-site regeneration may have been greater than the estimateof $600,000 to $750,000, based on the following analysis: A total of approximately 176,500 lbsof VOC were extracted from site soils. If a carbon adsorption capacity of 10 percent wasassumed, 10 lbs of carbon would be needed to adsorb one pound of VOC, and approximately1,765,000 lbs of carbon costing $1.50/lb or a total of $2,647,500 would be required for thisapplication. The vendor stated that this suggested that nearly $2 million might have been savedby selecting catalytic oxidation. [14]
Treatment System Cost [1, 2, 12]
Actual treatment system costs of approximately $2.14 million were provided by EPA Region 8for this treatment application. This value does not include costs for demobilization activities;costs for these activities are not available at this time. [9]
In order to standardize operating costs across projects, costs reported by Region 8 werecategorized according to an interagency Work Breakdown Structure (WBS), as shown in Tables12 and 13. Table 12 shows that $81,231 in costs for this application were incurred for before-treatment activities such as mobilization and preparatory work, and monitoring, sampling,testing, and analysis. Table 13 shows that $2,058,564 were incurred for activities directlyattributed to treatment, such as short-term operation and cost of ownership. Approximately 82%of the costs directly attributed to treatment were for the treatment vendor for this application.
As discussed under the section on Quantity of Soil Treated, the estimates for the quantity of soiltreated during this application varied from 31,440-52,920 cubic yards. Because of this, the costper cubic yard of soil treated is presented as a range, rather than a single cost number. Therefore,the $2,058,564 in costs attributed to treatment corresponds to $39-65 per cubic yard of soiltreated (31,440-52,920 cubic yards) and $11.70 per pound of VOC removed (176,500 lbs).

Sand Creek Industrial Superfund Site, O.U. 1, Page 25 of 31
U.S. ENVIRONMENTAL PROTECTION AGENCYOffice of Solid Waste and Emergency ResponseTechnology Innovation Office
TREATMENT SYSTEM COST (CONT.)
Treatment System Cost (cont.)
Table 12. Before Treatment Costs [9]Cost Element Unit Cost ($) Cost ($)
Mobilization and Preparatory Work - Work plan revisions, addendum, and response to interrogatories - Coordination with Operable Units 4 and 5
4,11727,137
31,254
Monitoring, Sampling, Testing, and Analysis - Confirmatory sampling - QA/QC laboratory analyses
15,56934,408
49,947
Total 81,231
Table 13. Treatment Costs [9]Cost Element Unit Cost ($) Cost ($)
Operation (short-term - up to 3 years) - Subcontractor costs - Project management/administrative - SVE remedial work (1993) - SVE remedial work (1994) - Other costs (RA, Area 1, 2, 3, SVE, community relations, TSOPs, travel, ODCs, reporting, and closeout)
1,693,260234,859105,89955,21627,676
2,116,910
Cost of Ownership - Overhead adjustment - Unallowable costs
(55,088)a
(3,258)a
(58,346)a
Total 2,058,564
aValues in parentheses represent credits (i.e., amount that vendor deducted from total treatment cost).
Cost Data Quality
The costs described above represent actual costs for this treatment application as reported byEPA Region 8. Limited information is available on the specific activities included within severalof these cost elements. Tables 12 and 13 show the available information.
Vendor Input
URS (the prime contractor) provided the following information on SVE remediation [13]:
There are a number of items that can affect the cost and opportunities for reductions in costs forsimilar projects to be completed in the future.
(1) The most important factor is to adequately characterize the site and to identify the aerialextent and the vertical zones of contamination. This is necessary to adequately

Sand Creek Industrial Superfund Site, O.U. 1, Page 26 of 31
U.S. ENVIRONMENTAL PROTECTION AGENCYOffice of Solid Waste and Emergency ResponseTechnology Innovation Office
TREATMENT SYSTEM COST (CONT.)
Vendor Input (cont.)
remediate the site and prevent cost growth during remediation as a result of "unforeseensite conditions." Change orders during cleanup will substantially impact the ultimateremediation cost. The detailed site characterization should be performed as part of theremedial design phase rather than the RI/FS phase. This will ensure that the designengineers obtain the "design related data" rather than less detailed and specific datarequired to produce the RI.
(2) The site must be adequately characterized to ensure that all soil contaminants that willimpact the SVE process are quantified. As a case in point, only approximately 2% of thetotal contaminants removed were target analytes. There are cases where the totalquantity of contaminants were not characterized, resulting in large project cost increasesbecause inappropriate air pollution control technologies were specified.
(3) Innovative contracting strategies can provide opportunities for cost reductions. Forexample, rather than using a traditional firm fixed price contract, a two step procurementwith a fixed price variable quantity contracting strategy could be used. This contractingstrategy would provide for a firm fixed price for mobilization, installation and startup ofthe SVE system. There would also be a firm fixed price for a base period of operation. At the Sand Creek Industrial Superfund Site this could have been two months. The baseperiod of system operation would then be followed by multiple fixed price option timeperiods. This approach will provide the selection of the best technical approach at thelowest estimated cost. It will also allow EPA to take advantage of cost reductions whena quick site cleanup occurs and pay a reasonable cost if the remediation takes longer. There will also be corresponding reductions to the Remediation Contractor's pricingbecause of reduced risk for the Contractor.
OHM (the treatment vendor) indicated that cost reduction is directly related to increasingproductivity, reducing remediation time, and encouraging innovation. [14]

Sand Creek Industrial Superfund Site, O.U. 1, Page 27 of 31
U.S. ENVIRONMENTAL PROTECTION AGENCYOffice of Solid Waste and Emergency ResponseTechnology Innovation Office
OBSERVATIONS AND LESSONS LEARNED
Cost Observations and Lessons Learned
• Approximately $2.14 million were expended for SVE treatment of O.U. 1 at Sand Creek,including $81,231 in before-treatment costs, and $2,058,564 in costs directly attributedto treatment.
• The $2,058,564 in costs directly attributed to treatment corresponds to $39-65 per cubic
yard of soil treated (31,440-52,920 cubic yards) and $11.70 per pound of VOC removed(176,500 pounds). A range of costs is presented because of the variation in estimates ofthe quantity of soil treated. Estimates were provided using the average groundwaterdepth and average smear zone depth to calculate soil quantity treated.
• EPA’s decision to revise the air emissions control equipment from activated carbon with
off-site regeneration to catalytic oxidation (CATOX) resulted in a cost savings to thegovernment. The prime contractor estimated the savings to be $600,000 to $750,000,while the treatment vendor estimated the savings as nearly $2,000,000. EPA revised thecontrol to CATOX because of the relatively large quantity of non-target VOCs in thesoil.
• The RPM stated that there was limited benefit in shutting down the system in November
1993 when the operating data indicated that the cleanup criteria for target contaminantshad been met. For example, the system was still removing significant quantities of non-target petroleum hydrocarbons. Although operating data (e.g., wellhead vapors) arebecoming more acceptable as an indicator of soil concentrations, the vendor indicatedthat there was reluctance to perform confirmation soil borings in November 1993, andthe system continued to operate until April 1994 when confirmation soil boringsindicated the cleanup criteria had been met. Early shutdown would have saved EPAfrom paying oversight costs to the prime contractor (URS). However, had EPA shutdown the system in November 1993, and then found an increase in wellhead vaporconcentrations, EPA would have incurred additional costs for demobilization andremobilization.

Sand Creek Industrial Superfund Site, O.U. 1, Page 28 of 31
U.S. ENVIRONMENTAL PROTECTION AGENCYOffice of Solid Waste and Emergency ResponseTechnology Innovation Office
OBSERVATIONS AND LESSONS LEARNED
Cost Observations and Lessons Learned (cont.)
• The prime contractor identified several items that should be considered in future SVEapplications for reducing costs:
- a detailed site characterization should be performed as part of the remedialdesign rather than the RI/FS, to identify the aerial extent and vertical zones ofcontamination, and to identify the total quantity of contaminants, includingtarget and non-target contaminants. At Sand Creek, only approximately 2% ofthe total contaminants removed were target analytes.
- innovative contracting strategies may provide a potential for cost savings withthis technology as alternatives to traditional firm fixed-price contracts. Forexample, a two-step procurement with a fixed price contract for mobilization,installation, and system startup, followed by multiple fixed price option periodsfor system operation, would likely result in lower costs for SVE projects.
Performance Observations and Lessons Learned
• Analytical data from off-site laboratory analyses of confirmation soil borings indicatethat the SVE system used at Sand Creek met the soil cleanup goals for VOCs within 6months of operation.
• Soil concentrations were reduced from as high as 9.34 mg/kg (the maximum
concentration shown in the RI for tetrachloroethene) to less than the cleanup goals. Themaximum concentration of target constituents measured by the off-site laboratory for theconfirmation soil borings was: chloroform - 0.0099 mg/kg; methylene chloride - notdetected; trichloroethene - 0.10 mg/kg; and tetrachloroethene - 0.28 mg/kg. In addition,less than 20% of the soil boring samples (i.e., soil borings at specific depths) containedat least one target constituent measured at a detectable concentration.
• Equilibrium headspace results, and VOC extraction rate and mass results, indicate a
reduction in contaminant levels and quantities over the course of the remediation. Forexample, equilibrium headspace results show a reduction for tetrachloroethene from 6.9mg/L in September 1993 to 0.104 mg/L in December 1993 (Subarea 2), and from 0.3mg/L in September 1993 to 0.005 mg/L in March 1994 (Subarea 3).
• Approximately 3,250 lbs of the four target VOC compounds and 176,500 lbs of total
VOCs were extracted from the three subareas at O.U. 1. Tetrachloroethene accountedfor approximately 98.5% of the mass of target compounds extracted from the subareas.

Sand Creek Industrial Superfund Site, O.U. 1, Page 29 of 31
U.S. ENVIRONMENTAL PROTECTION AGENCYOffice of Solid Waste and Emergency ResponseTechnology Innovation Office
OBSERVATIONS AND LESSONS LEARNED (CONT.)
Other Observations and Lessons Learned
• The average quarterly destruction efficiency for the catalytic oxidizer ranged from 92.9to 99.1% during the 6 months of SVE system operation.
• The mass of target compounds removed from the soil (3,250 pounds) was approximately
4.75 times greater than the original estimated mass of target compounds (684 pounds),determined based on preremedial target compound concentrations and estimated in situsoil volume reported in the remedial design report. According to the RPM, the reasonfor the difference was based on sampling and analysis for VOCs in the soil prior toremediation. According to the RPM, sampling and analysis of VOCs in soil can often bebiased low, because of VOC losses in the sampling processes. In addition, according tothe RPM, the pre-remediation VOC results may not have been representative of the zoneof influence of the SVE wells.
• The treatment vendor used their patented Fluid Injection/Vapor Extraction (FIVE)
technology in this application. The vendor stated that this system “enhanced subsurfacevolatilization and shortened the period of remediation.”
• The CATOX unit was a limiting factor in determining the number of wells that could beused for extraction. Early in the application, the concentration of contaminants in theextracted soil vapors was high, and the number of wells had to be limited so as not tooverheat the CATOX unit. Later in the application, when the vapor concentrations wereless, all wells in the system could be used for extraction.
• The vendor’s bid for this application included use of both horizontal and vertical wells,with “preference” given to horizontal wells, because the vendor believed that horizontalwells would increase the radius of influence. At that time, the use of horizontal wells forSVE was not widely practiced, and was considered an emerging technology. However,during installation of the first horizontal well at Sand Creek, the vendor discoveredburied concrete blocks and other construction debris in the subsurface, and these itemscaused an increase in the cost and time required for horizontal well installation. As aresult, the vendor abandoned their plan to give preference to horizontal wells. Instead ofinstalling two additional horizontal wells, additional vertical wells were installed.

Sand Creek Industrial Superfund Site, O.U. 1, Page 30 of 31
U.S. ENVIRONMENTAL PROTECTION AGENCYOffice of Solid Waste and Emergency ResponseTechnology Innovation Office
REFERENCES
1. Record of Decision, Sand Creek Industrial, Commerce City, CO, Operating Unit #1, September29, 1989.
2. Explanation of Significant Differences. Soil Cleanup of OU 1--Sand Creek Superfund Site. September 8, 1993.
3. Remedial Investigation Site Characterization Report. Sand Creek Industrial Site, CommerceCity, Colorado. March 4, 1988.
4. Project Manual for Soil Vacuum Extraction Remedial Action, Sand Creek Industrial SuperfundSite, Operable Unit No. 1. Commerce City, Colorado. URS Consultants, Inc. September 9,1992.
5. Sand Creek Industrial Superfund Site, Operable Unit No. 4 (OU 4), Technical Assistance,Remedial Investigation/Feasibility Study, Commerce City, Colorado, Remedial InvestigationReport, Volume I, September 1993.
6. Sand Creek Industrial Superfund Site, Operable Unit No. 4 (OU 4), Technical Assistance,Remedial Investigation/Feasibility Study, Commerce City, Colorado, Final Feasibility StudyReport, February 7, 1994.
7. Letter to Ms. Erna Acheson, U.S. EPA, from URS Consultants, Inc., regarding Sand CreekIndustrial Superfund Site OU1 RA, OHM Monthly Reports. January 30, 1995.
8. Sand Creek Industrial Superfund Site, Operable Unit No.1 (OU-1) Commerce City, ColoradoCleanup Subarea SVE-1, SVE-2, and SVE-3 Demonstration Results. OHM RemediationServices Corp. March 17, 1995.
9. Cost Report. Sand Creek, Operable Unit 1, Monthly Report. U.S. EPA, Region VIII. March1995.
10. John Chinnock, "Innovative Solutions Cut Cleanup Costs at Sand Creek Superfund Site." Environmental Solutions, pp. 30-31, March 1995.
11. Draft Remedial Action Completion Report, Revision 2. Sand Creek Industrial Superfund Site,Operable Units No. 1 (OU1) and No. 4 (OU4), Remedial Action, Commerce City, Colorado. URS Consultants, Inc. September 20, 1995.
12. Memorandum from E. Acheson, RPM, to L. Fiedler, OSWER/TIO, "Sand Creek Superfund Site,SVE Technical Information, O.U. #1, Commerce City, CO," February 27, 1997.
13. Memorandum from J. Chinnock, URS, to E. Acheson, EPA, "Sand Creek Industrial SuperfundSite, OU 1 RA; TIO Responses," February 27, 1996.

Sand Creek Industrial Superfund Site, O.U. 1, Page 31 of 31
U.S. ENVIRONMENTAL PROTECTION AGENCYOffice of Solid Waste and Emergency ResponseTechnology Innovation Office
REFERENCES (CONT.)
14. Letter from C. Strzempka, OHM, to E. Acheson, EPA, "Remediation Case Study Report, SoilVapor Extraction at the Sand Creek Industrial Superfund Site, Operable Unit No. 1, CommerceCity, Colorado, November 30, 1995," February 23, 1996.
15. C. Strzempka, R. Cox, R. Freasier, J. Critzer, OHM Remediation Services Corp., “ThermallyEnhanced Fluid Injection with Vacuum Extraction at a Colorado Superfund Site,” Proceedings ofthe Ninth National Outdoor Action Conference and Exposition, Las Vegas, NV, May 2-4, 1995.
16. R. Cox, “Examining the Economics of Remediation by Fluid Injection with Vacuum Extraction,”Remediation, Spring 1995, pp. 29-35.
17. R. Cox, “Fluid Injection Helps Vacuum Extract Contaminants,” OHM Remediation ServicesCorp., Brochure, Not dated.
18. R. Cox, “Fluid Injection Helps Vacuum Extract Contaminants,” Soils, March 1994, pp. 8-11.
Analysis Preparation
This case study was prepared for the U.S. Environmental Protection Agency's Office of SolidWaste and Emergency Response, Technology Innovation Office. Assistance was provided byRadian International under EPA Contract No. 68-W3-0001 and U.S. Army Corps of EngineersContract No. DACA45-96-D-0016.